 Joshua M. Hatch
 Kimberly T. Murray
 Samir Patel
 Ronald Smolowitz2
 Heather L. Haas
- 1National Oceanic and Atmospheric Administration (NOAA) National Marine Fisheries Service, Northeast Fisheries Science Center (NEFSC), Woods Hole, MA, United States
- 2Coonamessett Farm Foundation, East Falmouth, MA, United States
Spatial and temporal assessments of overlap are becoming increasingly popular as indicators of encounter risk. The overlap in distributions between protected species and commercial fishing effort is of interest for reducing bycatch. We explored overlap between the U.S. Atlantic sea scallop fishery and loggerhead turtles (Caretta caretta) using 2 metrics, and we assessed the ability of one of those metrics to track estimated fishery interactions over time. Moderate overlap occurred between June - September; mild overlap in the spring (May) and fall (October - November); and relatively little overlap from December to April. Qualitatively, there appeared to be some correspondence between the overlap values averaged across months for each calendar year and published annual loggerhead interaction estimates with fisheries, but the predictive performance of the overlap metric was low. When data on the relative distributions of commercial fishing effort and protected species are available, simple measures of spatial and temporal overlap can provide a quick and cost-effective way to identify when and where bycatch is likely to occur. In this case study, however, overlap was limited in helping to understand the relative susceptibility of protected species to commercial fishing (i.e., magnitude of interactions). We therefore caution against using overlap as a meaningful predictor of absolute risk unless there is direct evidence to suggest a relationship.
Introduction
Spatial and temporal assessments of overlap are becoming increasingly popular as indicators of encounter risk (i.e., relative risk of interaction) between protected species and human activities. Bedriñana-Romano et al. (2021) identified priority areas for blue whale conservation by exploring overlap between the whales’ critical habitat and vessel traffic. Best and Halpin (2019) quantified tradeoffs in site selection and timing of offshore wind energy development by exploring overlap between the industry’s profitability and sensitivities of several seabird and cetacean species. Numerous studies have explored the overlap between protected species’ distributions and commercial fishing to help inform discussions on bycatch mitigation (Cronin et al., 2016; Hatch et al., 2016; Stepanuk et al., 2018; Baird et al., 2021; Murray et al., 2021) and to prevent seasonal area closures (Howell et al., 2008; Howell et al., 2015; Eguchi et al., 2017; Hazen et al., 2018; Myers and Moore, 2020).
Fisheries bycatch is often cited as a major source of mortality for protected species in the marine environment (Read et al., 2006; Lewison et al., 2009; Wallace et al., 2010) because many protected species exhibit life-history traits (e.g., long-lived, delayed sexual maturity) that make them particularly vulnerable (Crouse et al., 1987; Heppell et al., 1999; Heppell et al., 2000; Fujiwara and Caswell, 2001; Heppell et al., 2005, Niel and Lebreton, 2005, Gray and Kennelly, 2018; Hatch et al., 2019). Minimizing fisheries-related mortality and morbidity, then, can better position threatened populations to recover (Lewison et al., 2004; Warden et al., 2015). Interactions between fisheries and protected species can also pose an economic cost to fishers, possibly leading to depredation of catch (Tixier et al., 2021), damage to fishing gear (Panagopoulou et al., 2017), and loss of fishing opportunities through time-area closures or reductions in fishing effort if bycatch limits are exceeded (Hazen et al., 2018; Myers and Moore, 2020). Here, interaction refers to any direct or close contact between protected species and fishing gear, whereas bycatch refers to a subset of interactions that result in serious injury or mortality.
Mitigating bycatch of protected species often revolves around issues of when and where animals occur and how they interact with commercial fishing gear (Senko et al., 2014). This where, when, and how approach is often associated with implementing gear modifications and time-area closures as preferred management strategies to reduce fisheries bycatch. The U.S. Atlantic sea scallop fishery is an important commercial fishery (NMFS, 2021) that primarily extends from Georges Bank to the Mid-Atlantic and overlaps with the distribution of threatened loggerhead sea turtles requiring vessels to use gear modifications aimed at minimizing sea turtle bycatch. Those gear modifications have had an apparent conservation benefit (Smolowitz et al., 2010; Smolowitz et al., 2012), with reductions in serious injury and mortality rates of sea turtles since their implementation (Murray, 2011; Murray, 2015). However, those same gear modifications complicate bycatch monitoring and increase interest in alternative monitoring approaches such as using overlap metrics as a proxy for encounter risk.
Assessing susceptibility of protected species to commercial fishing can be complicated, as most threatened populations are data-limited. Attributes that define a species susceptibility to fishing are often classified into four ordinal categories (Hobday et al., 2011): overlap (in geographic space [hereafter referred to as space] and time), encounterability (depth usage, given overlap), selectivity (caught and retained by the fishing gear, given overlap and encounterability), and post-interaction mortality (death, given overlap, encounterability, and selectivity). Ideally, each of these parameters should be quantified before defining a species’ risk to fishing activities (i.e., bycatch). But quantifying each of those attributes is difficult when available data are sparse, as is the case for most threatened populations. Using simple measures of spatial-temporal overlap may be useful (Howell et al., 2008; Howell et al., 2015; Cronin et al., 2016; Hatch et al., 2016; Eguchi et al., 2017; Hazen et al., 2018; Stepanuk et al., 2018; Baird et al., 2021; Murray et al., 2021), especially if the other attributes of susceptibility can be simplified or assumed known. For example, assuming high encounterability may be reasonable if turtles are known to be predominately benthic in a certain time and area that overlaps with bottom fishing.
Here, we explore the spatial and temporal overlap between the U.S. Atlantic sea scallop fishery and loggerhead turtles (Caretta caretta) using 2 overlap metrics (i.e., Bhattacharyya’s coefficient and the Morisita-Horn index), and we assessed the ability of one of those metrics to track estimated interactions over time. We characterized the spatial and temporal distributions of loggerhead turtles using satellite tag data (Winton et al., 2018) and the U.S. Atlantic sea scallop fishery using data from the Vessel Monitoring System (VMS). The characterized distributions were combined to develop a time series of overlap measures that spanned roughly 18 years (i.e., 2003 - 2020). We then extracted estimates of fishery interactions from published reports over the same time frame and examined the relationship between overlap and interactions. We decided to focus on loggerhead turtles because they broadly overlap with the U.S. Atlantic sea scallop fishery where fisheries bycatch of marine turtles has historically been a conservation issue.
Materials and methods
Data
Commercial fishing effort
Under current regulations (FR, 2021), commercial fishing vessels are required to submit electronic Vessel Trip Reports (VTRs) after each fishing trip documenting a variety of trip-level characteristics (e.g., a single location where most fishing occurred, gear fished, quantity of gear fished, etc.). Starting in 1998, to provide better resolution of fishing locations, vessel monitoring systems (VMS) were mandated for vessels fishing under limited-access permits1 in the U.S. Atlantic sea scallop fishery. The VMS program was subsequently expanded in following years to cover more vessels and fleets, and can be considered a near census of locations for those vessels equipped with VMS (which now constitutes most vessels in the U.S. Atlantic sea scallop fishery).
We measured the spatial footprint of the U.S. Atlantic sea scallop fishery using data from the VMS. Fishing activity was determined using a speed rule approach, with vessel speeds between 2 and 5.5 knots being used to indicate fishing (Figure A1). Vessels participating in the U.S. Atlantic sea scallop fishery were obliged to report positions at pre-specified intervals defined by the VMS requirement of the Fishery Management Plan (FMP), usually twice an hour with an increase in frequency if the vessel approached a closed area.
The VMS data for the U.S. Atlantic sea scallop fishery from fishing years 2003 - 2020 were aggregated onto a 10km × 10km grid that spanned the Greater Atlantic Region (GAR). As part of the gridding process, VMS spatial coordinates were re-projected into an oblique Mercator projection with a central line that roughly coincided with the long axis of the U.S. Atlantic coast. The gridding process involved determining how much time was spent in each grid cell by a vessel transiting between 2 VMS polls. To do this, we assumed the vessel was transiting at a constant speed and in a straight line between polls, with the time spent in a grid cell being proportional to the distance traveled in that grid cell relative to the total distance fished. For example, if a vessel had 2 VMS polls an hour apart and traveled 4km during that time, with 1km in grid cell 1 and 3km in grid cell 2, then ¼ of an hour would be allocated to grid cell 1 and ¾ of an hour would be allocated to grid cell 2. The VMS data were then aggregated by month to produce monthly composites of commercial fishing effort (i.e., hours fished) for the U.S. Atlantic sea scallop fishery.
Temporal trends in commercial fishing effort (i.e., hours fished) were explored using a Bayesian generalized additive mixed model to partition out the seasonal and relatively, long-term signals (Bürkner, 2017; Bürkner, 2018). Hours fished (yt) were summed by month for FYs 2003 - 2020 and were indexed by month (xt,1) and the number of months that elapsed since the beginning of the time series (xt,2). The mixed model can then be written as,
Here, t refers to a date (e.g., March, FY 2003). The correlation matrix, Λ, was chosen to reflect a first-order autoregressive process (i.e., AR(1)) grouped by FY. Effectively, the mixed model is detrending the data and then applying an AR(1) process to the residuals. Flat priors were placed on all coefficients (except the intercept) and the correlation parameter, while Student-t priors were placed on the intercept and truncated Student-t priors were placed on the standard deviations. We used a posterior predictive check to compare simulations from the fitted model and the observed data to assess model adequacy.
Loggerhead turtle distribution
Predicted monthly densities of tagged loggerhead turtles from Winton et al. (2018) were modified using cubic convolution from a 40 km to 10 km spatial resolution to match the gridded VMS data (Figure 1). Briefly, Winton et al. (2018) predicted the monthly densities of aggregated daily locations with a space-time geostatistical mixed effects model using satellite data from 271 large juvenile and adult loggerhead turtles tagged in the northwest Atlantic between 2004 and 2016. Turtle satellite tracks were reconstructed using a continuous time correlated random walk movement model to account for satellite location error; reconstructed tracks were then interpolated to a daily time step to account for irregular transmissions (see Winton et al., 2018 for more details).
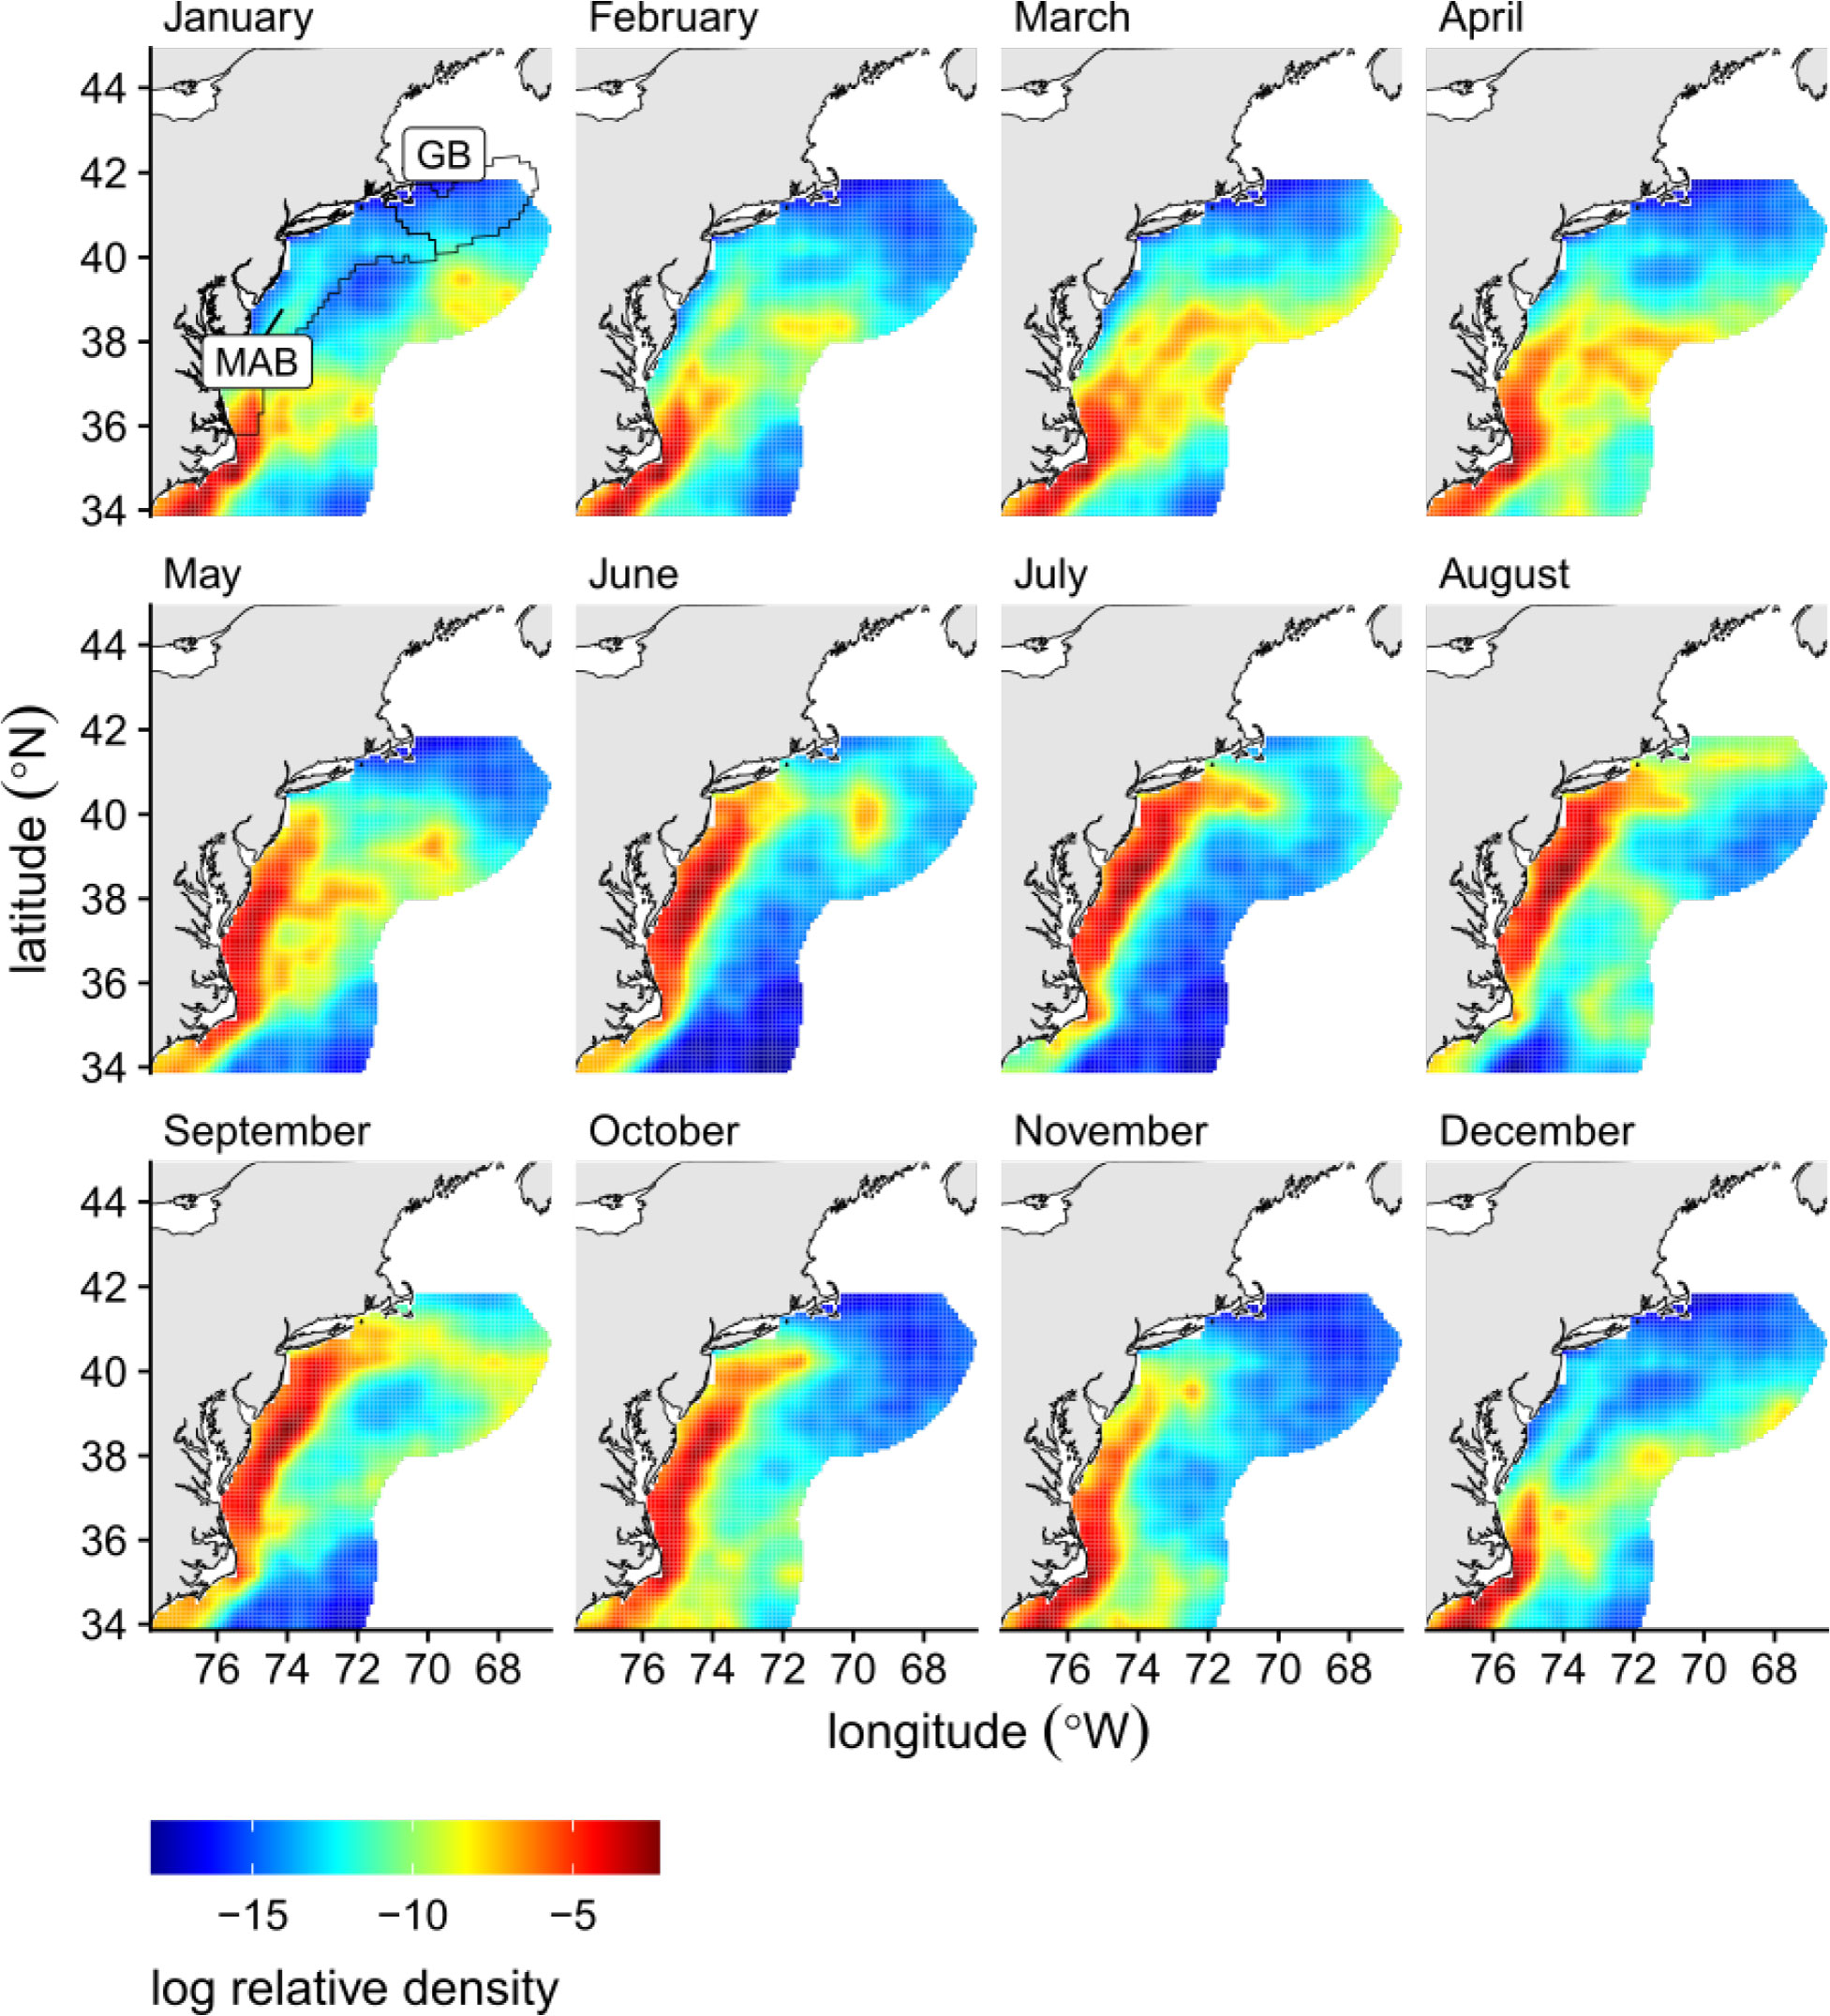
Figure 1 Logged relative densities of tagged loggerhead locations from 2004 – 2016 modified from Winton et al. (2018) upsampled to a 10km × 10km grid using cubic convolution. The Georges Bank (GB) and Mid-Atlantic (MAB) regions are outlined and labeled on the first panel (NEFSC, 2021).
Overlap metrics
Two commonly cited overlap metrics were explored to better understand the intersection between the distribution of loggerhead sea turtles and the U.S. Atlantic sea scallop fishery. The first overlap metric is Bhattacharyya’s coefficient (Bc; Bhattacharyya, 1943) defined as:
where p1 and p2 are the normalized vectors of commercial fishing effort and tagged loggerhead turtle densities, respectively, and i refers to the grid cell. The second overlap metric is the Morisita-Horn (MH) index, which has been used previously to assess overlap between protected species and commercial fisheries (Cronin et al., 2016; Murray et al., 2021), defined as:
Both overlap metrics can range from 0 (no overlap) to 1 (complete overlap) and were calculated by month, the lowest temporal resolution possible. Monthly overlap metrics could then be summarized by either calendar (CY) or fishing year (FY), with the definition of a FY changing over time. Prior to 2017, a FY spanned March 1 to February 28 (or 29) of the following year. For example, FY 2016 ran from March 1, 2016 to February 28, 2017. In 2017, a FY spanned March 1 - March 31. And after 2017, a FY spanned April 1 - March 31.
Beyond seasonal comparisons, we focused on the Bc overlap measure because it is more robust to a higher amount of low values. We included the MH index when looking at seasonal patterns because it has been used previously (Cronin et al., 2016; Murray et al., 2021); however, the MH index is known to be sensitive when overlap is low for a majority of the area in a particular time (Rempala and Seweryn, 2013). Since the relative patterns between the 2 overlap measures were similar, we focused on the more suitable metric given our situation that included a large amount of low overlap. For years with observed interactions, we superimposed the location of the observed interactions on maps of the averaged overlap values by fishing year.
Estimated fishery interactions
We used published estimates of interactions between loggerhead turtles and the U.S. Atlantic sea scallop fishery. Loggerhead interactions in the fishery were estimated from fishery observer (vessel-based) data using Generalized Additive Models (GAMs) and stratified-ratio estimators for the following periods: 2001 - 2008 (Murray, 2011); 2009 - 2014 (Murray, 2015); and 2015 - 2019 (Murray, 2021). The estimated interactions from Murray (2011); Murray (2015); Murray (2021) included those that could be observed, as well as those that occurred subsurface and out of view as a result of gear modifications (see Warden and Murray, 2011 for more details on unobservable but quantifiable fishery interactions). Those gear modifications include turtle chain mats and Turtle Deflector Dredges (TDDs) (Smolowitz et al., 2012), both of which are required when fishing west of 71°W from May - November (FR, 2015). For instance, fishery observers documented 47 loggerhead turtle interactions between 2001 - 2008 (Murray, 2011) at 3% sampling coverage, while the use of chain mats and turtle deflector dredges reduced the number of reported interactions to 12 between 2009 - 2015 (Murray, 2015; Murray, 2021) at 6% sampling coverage. More details can be found in Murray (2011); Murray (2015); Murray (2021).
Murray (2011); Murray (2015); Murray (2021) constrained the annual estimates of turtle interactions to the fraction of the fleet fishing in the Mid-Atlantic, where all observed loggerhead interactions occurred. The definition of the Mid-Atlantic study region, however, has changed slightly over time. Murray (2011); Murray (2015) defined the Mid-Atlantic as the region west of 71°W and south of 42°N. Murray (2021) defined the Mid-Atlantic region as the boundaries of the Mid-Atlantic Ecological Production Unit (EPU; NEFSC, 2021). We used the same definitions (Murray, 2011; Murray, 2015; Murray, 2021) for the Mid-Atlantic region when comparing overlap values to the interaction estimates produced by Murray (2011); Murray (2015); Murray (2021). For 2015 and later, we also limited the overlap values to be between May and December to align with Murray (2021), whereas the full calendar year was considered prior to 2015 (Murray, 2011; Murray, 2015).
The annual estimated fishery interactions (Murray, 2011; Murray, 2015; Murray, 2021) were then related to the mean annual overlap values using a Bayesian regression model. The published, estimated fishery interactions were summarized on an annual basis preventing monthly comparisons (Murray, 2011; Murray, 2015; Murray, 2021). Monthly overlap values were then averaged across a calendar year to compare with the estimated interactions. The Bayesian regression model took the form,
where yi refers to the interaction estimate in calendar year i, xi refers to the mean annual overlap value, β0 is the intercept, β1 is the slope, and σi is the standard error for the interaction estimate. A log link was used to ensure the predictions were non-negative, as interaction estimates cannot be less than 0. The Bayesian model was structured to include the known errors of the estimated interactions into the regression, thereby ensuring propagation of uncertainty. We used Bayesian R2 as a measure of predictive performance, which is a convenient summary statistic that ranges from 0 (no predictive performance) to 1 (perfect predictive performance).
Results
Commercial fishing effort
According to VMS data, the hours fished in the U.S. Atlantic sea scallop fishery has declined steadily since 2003 (see Figure 2), with an average decrease of roughly 61 hours fished per month over the 18-year time period. We also see a regional shift in commercial fishing, with the Mid-Atlantic comprising a smaller portion of effort in recent years (Figure 2). The decline in commercial fishing effort, coupled with relatively high landings (NOAA Fisheries, 2023), suggests the footprint of the fishery is retracting. Seasonally, most commercial fishing occurred between May and June (Figure 2). The autocorrelation parameter was estimated to be 0.65 (95% CI: 0.54 - 0.77), suggesting moderate residual autocorrelation about the fitted trend.
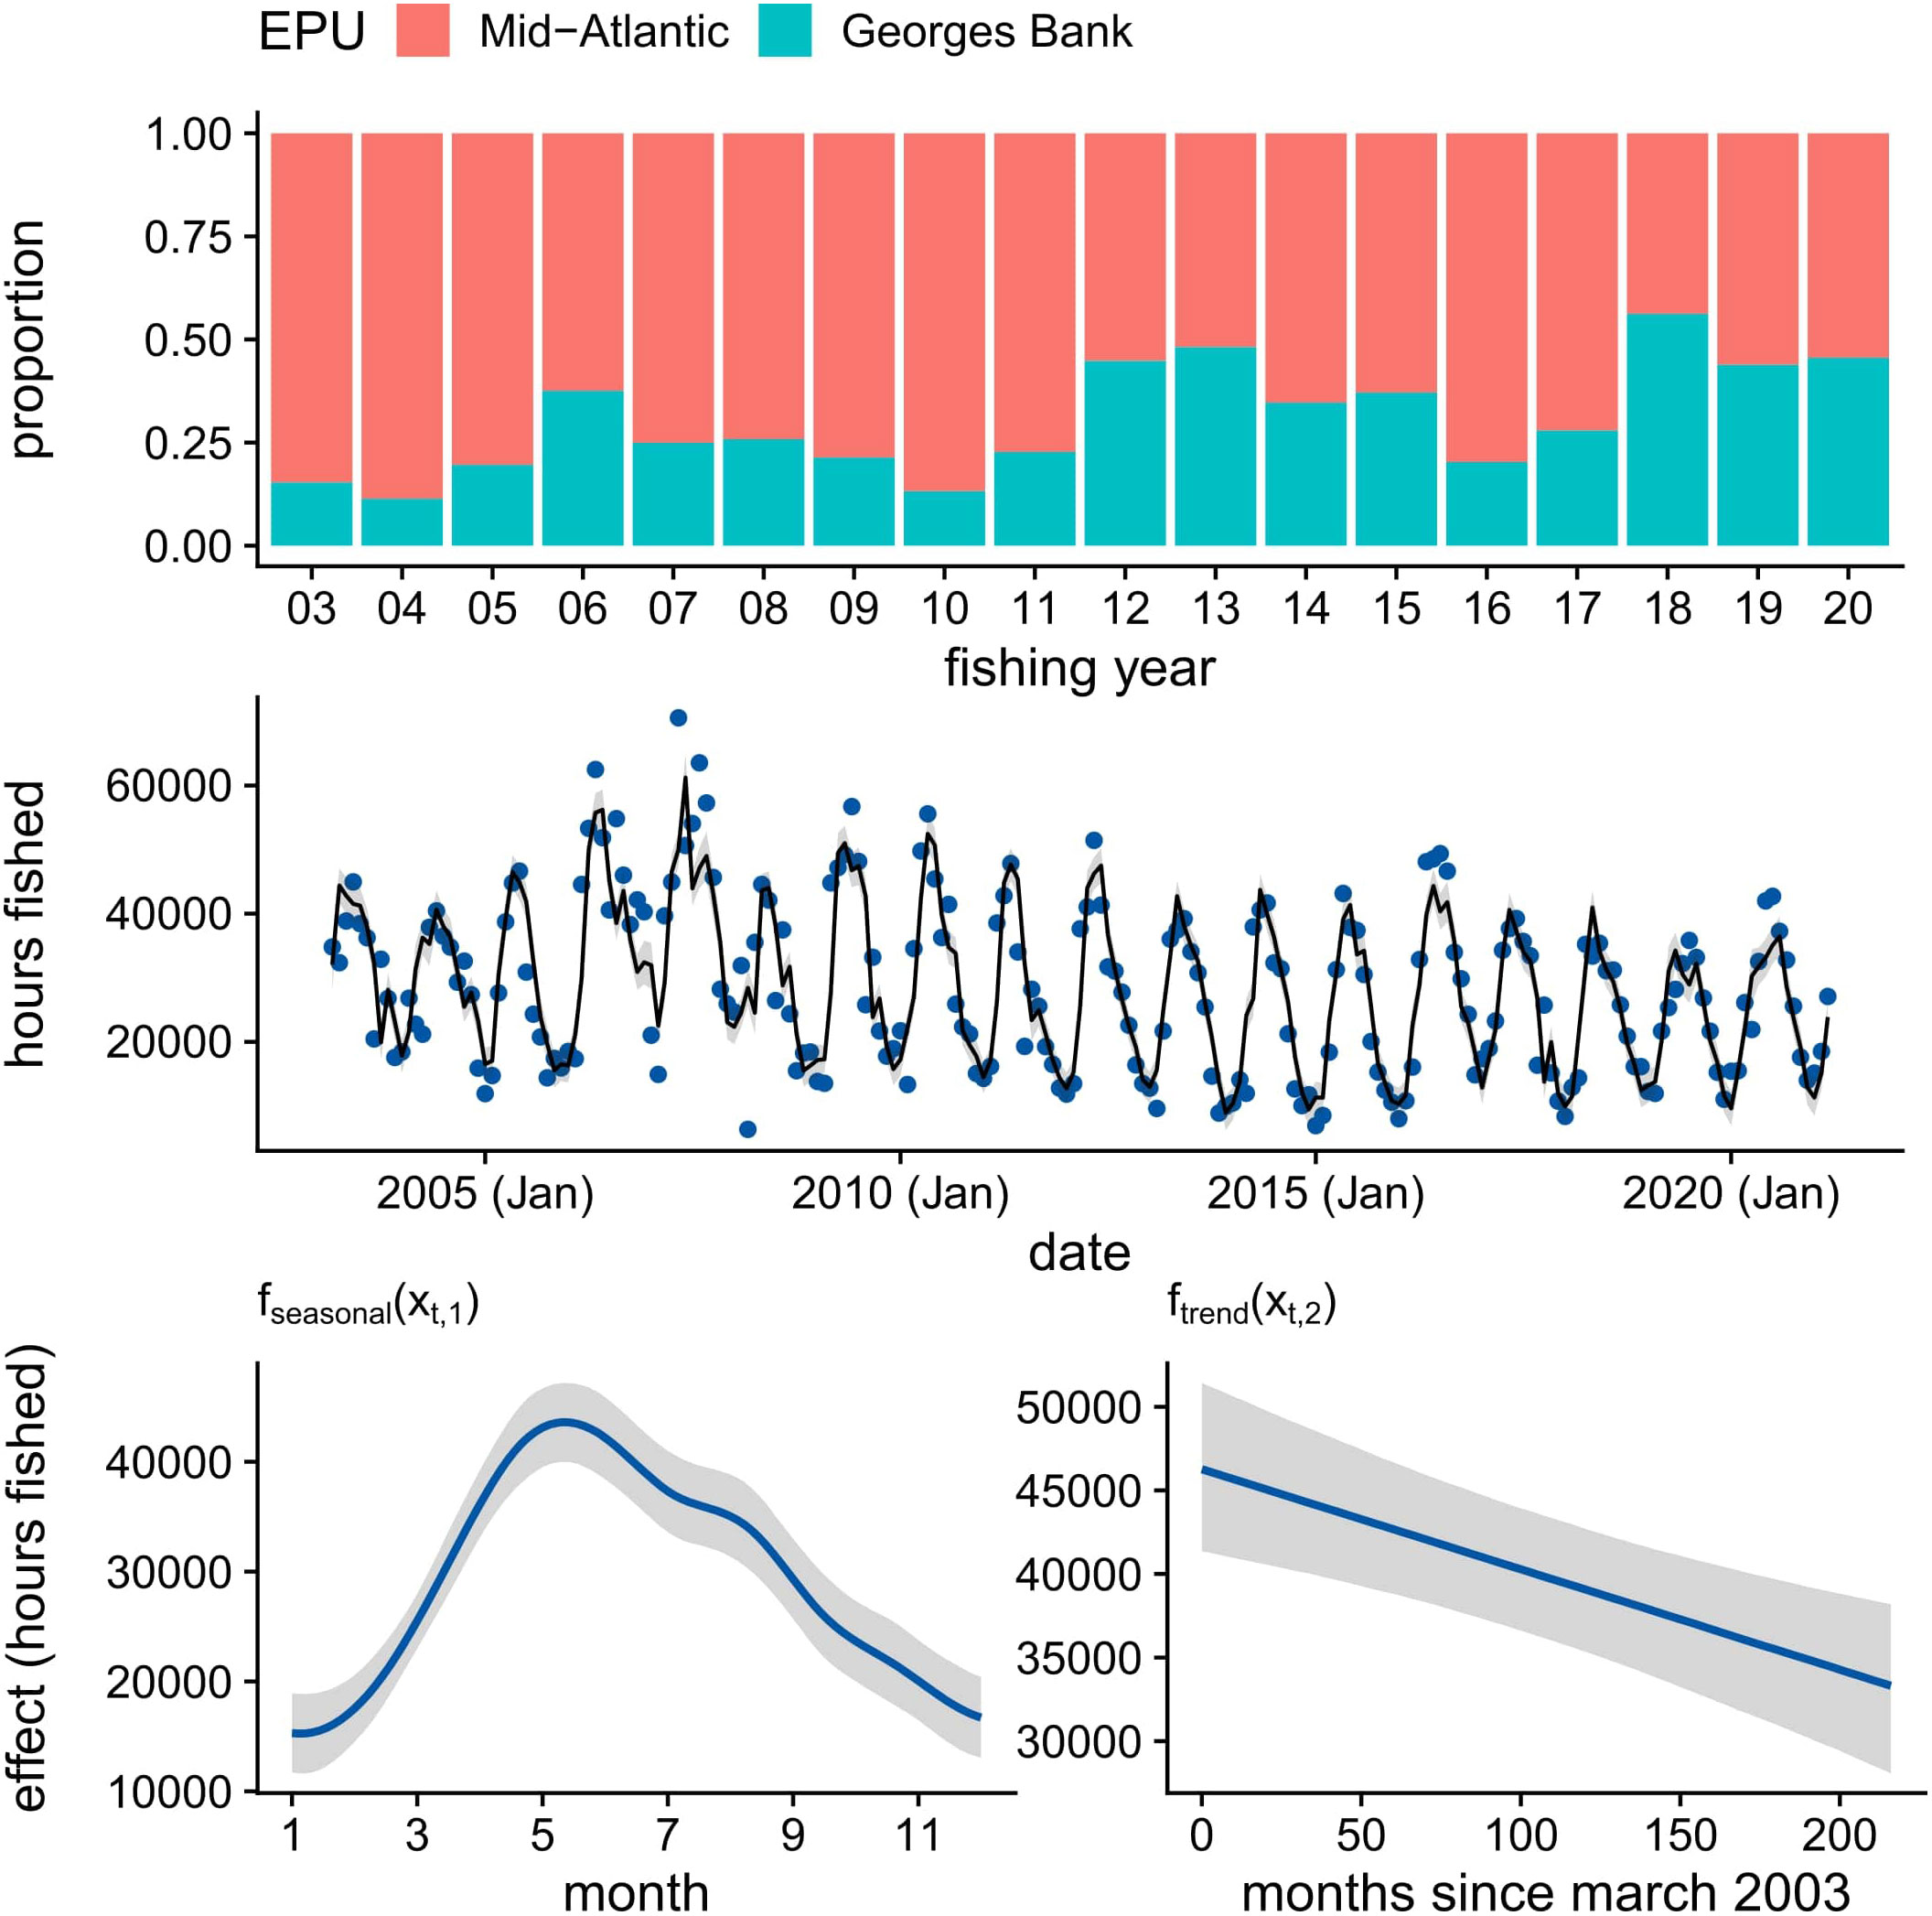
Figure 2 Proportion of commercial fishing effort for the U.S. Atlantic sea scallop fishery from VMS data for fishing years 2003 to 2020 found in the Mid-Atlantic and Georges Bank regions (NEFSC, 2021); hours fished by date (month, year) for the U.S. Atlantic sea scallop fishery from VMS data for fishing years 2003 to 2020 superimposed with fitted values (line) and 95% credible intervals (shaded region) from the Bayesian generalized additive mixed model (GAMM); smooths (line) for the effects of season and trend on hours fished from the Bayesian GAMM, with shaded regions representing 95% credible intervals.
Loggerhead turtle distribution
The relative densities of tagged loggerhead turtles were highest along the continental shelf, with lower densities farther offshore (Figure 1). There was also an apparent seasonal shift in relative densities, reflecting the highly migratory behavior of loggerhead turtles (Figure 1). This migration was characterized by northward movements into the GAR from March - May, followed by southward movements out of the GAR from October - December as loggerhead turtles search for overwintering areas off the coast of North Carolina or farther south (Figure 1). More details can be found in Winton et al. (2018).
Overlap metrics
Looking at the average value by month, we see similar seasonal patterns for both overlap metrics (Figure 3). Qualitatively, we see moderate overlap between June - September, with high overlap occurring in August. Mild overlap occurred during the spring (May) and fall (October - November) migrations, as loggerhead turtles enter and leave the GAR respectively. For the rest of the year, from December to April, we see relatively little overlap between loggerhead turtle distribution and the U.S. Atlantic sea scallop fishery. Observed interactions occurred mostly in areas where the averaged overlap values were relatively higher (Figures 4, C1), with observer coverage that ranged between 2 - 6% (Murray, 2011; Murray, 2015; Murray, 2021).
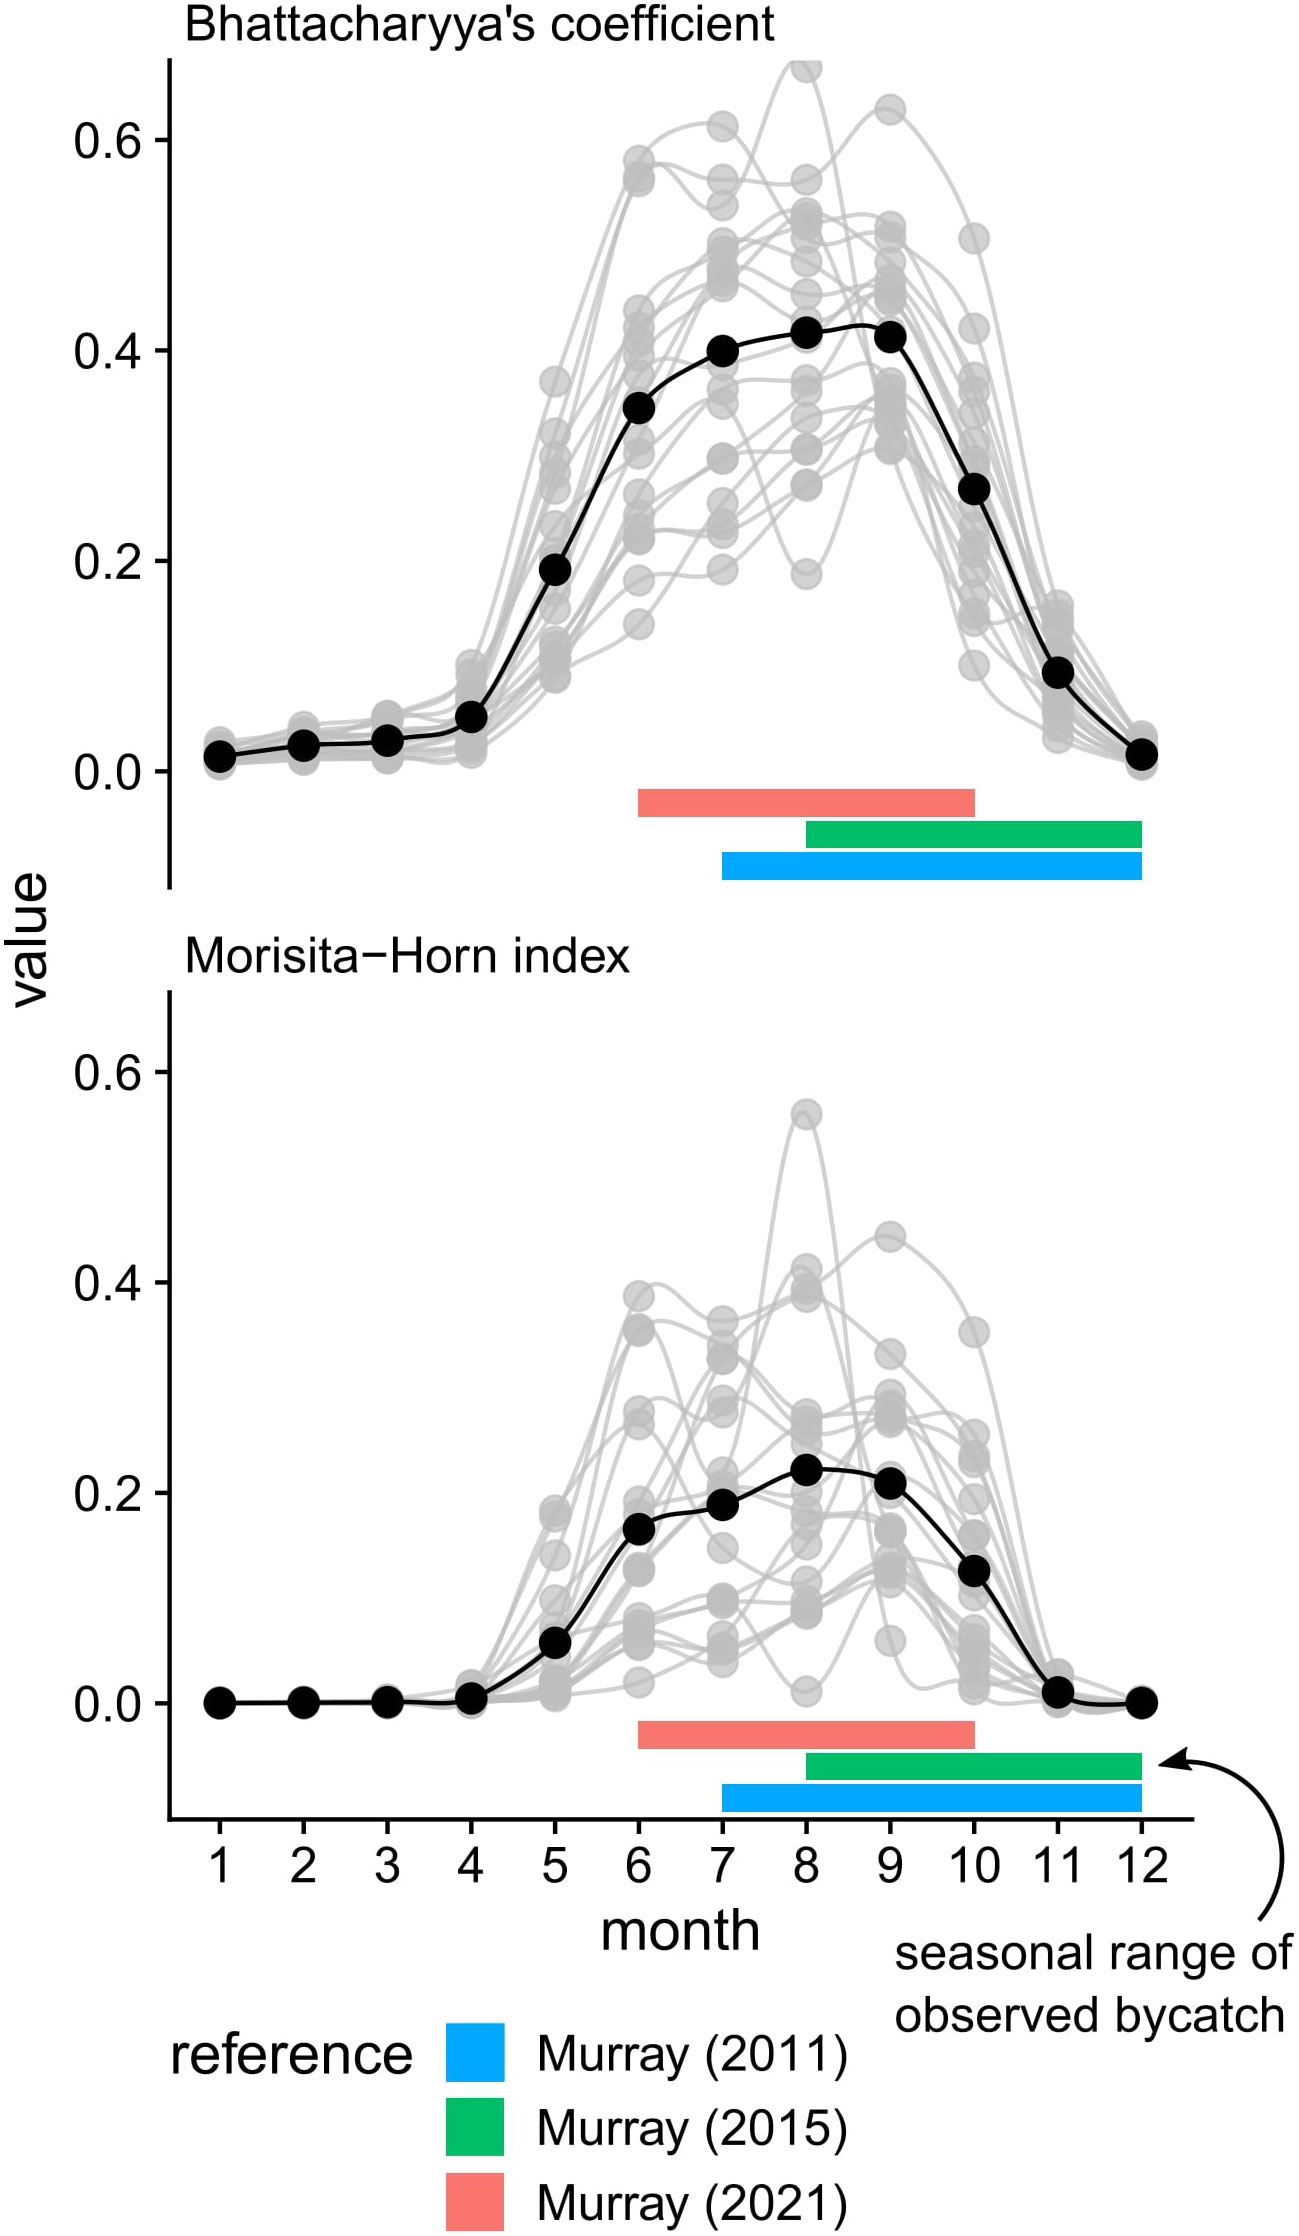
Figure 3 Monthly values of the overlap metrics for each calendar year (light grey dots and lines). Superimposed on the overlap metrics is the average value (black dots and lines). Horizontal bars define the seasonal range of observed loggerhead bycatch occurrence as documented by Murray (2011); Murray (2015); Murray (2021).
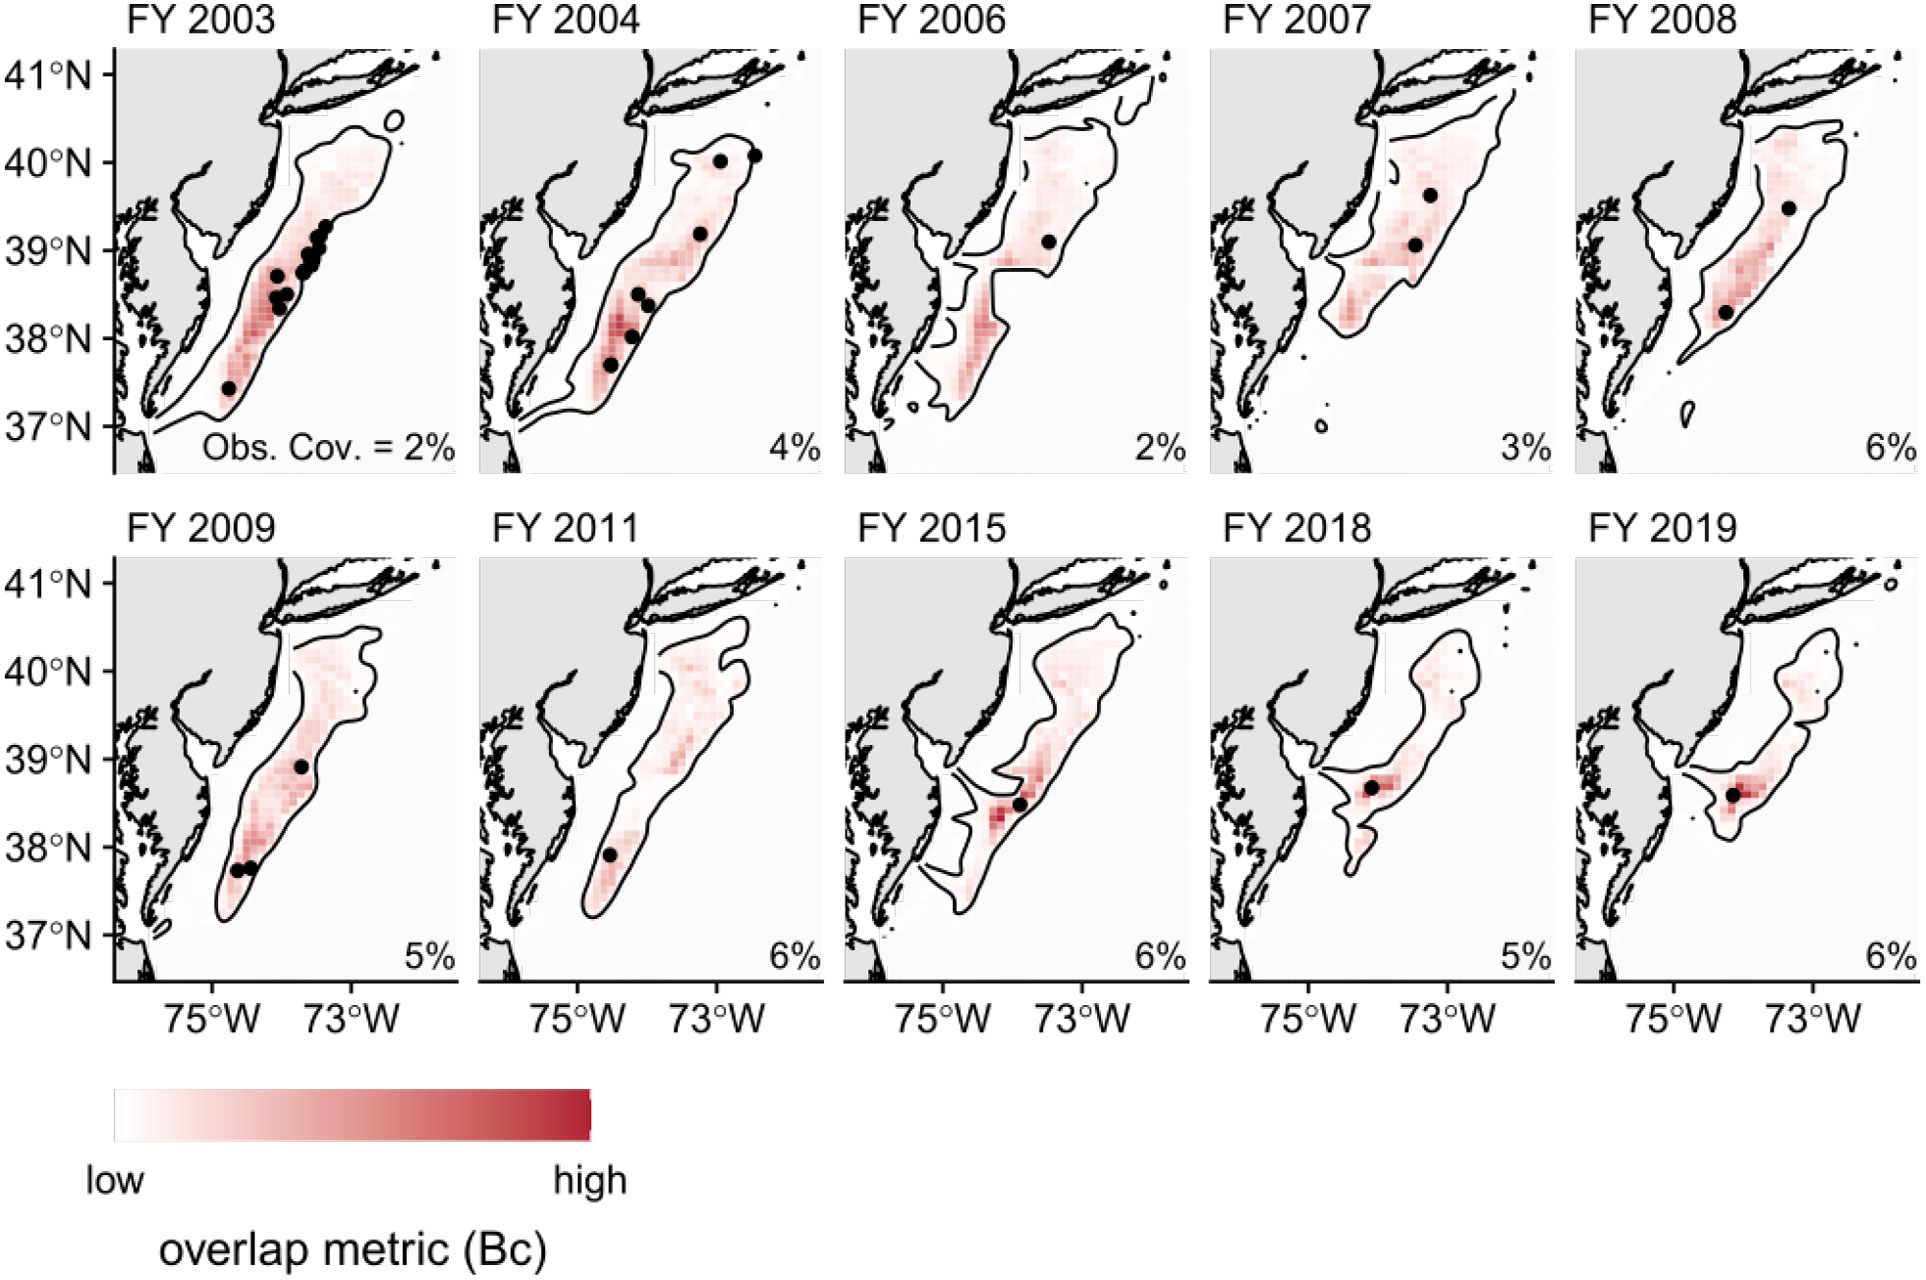
Figure 4 Maps of averaged overlap values across months by fishing year (FY) for years where observed interactions occurred. Superimposed, as black dots, are the corresponding observed interaction locations between loggerhead turtles and the U.S. Atlantic sea scallop fishery. The black, contour line corresponds to the lowest value of the averaged overlap metric associated with an observed location of loggerhead turtle interaction across all years. The observer coverage (Obs. Cov.) for the corresponding calendar year is listed in the lower, right-hand corner of the maps and were extracted from Murray (2011); Murray (2015); Murray (2021).
Estimated fishery interactions
Estimated interactions between loggerhead turtles and the U.S. Atlantic sea scallop fishery were relatively high until 2006, which coincides with the implementation of chain mats. Fishery interactions remained fairly low from 2006 until 2015, with a small potential uptick in 2009 - 2010. Between 2015 - 2019 we again find relatively high estimated fishery interactions (Murray, 2021; Figure 5).
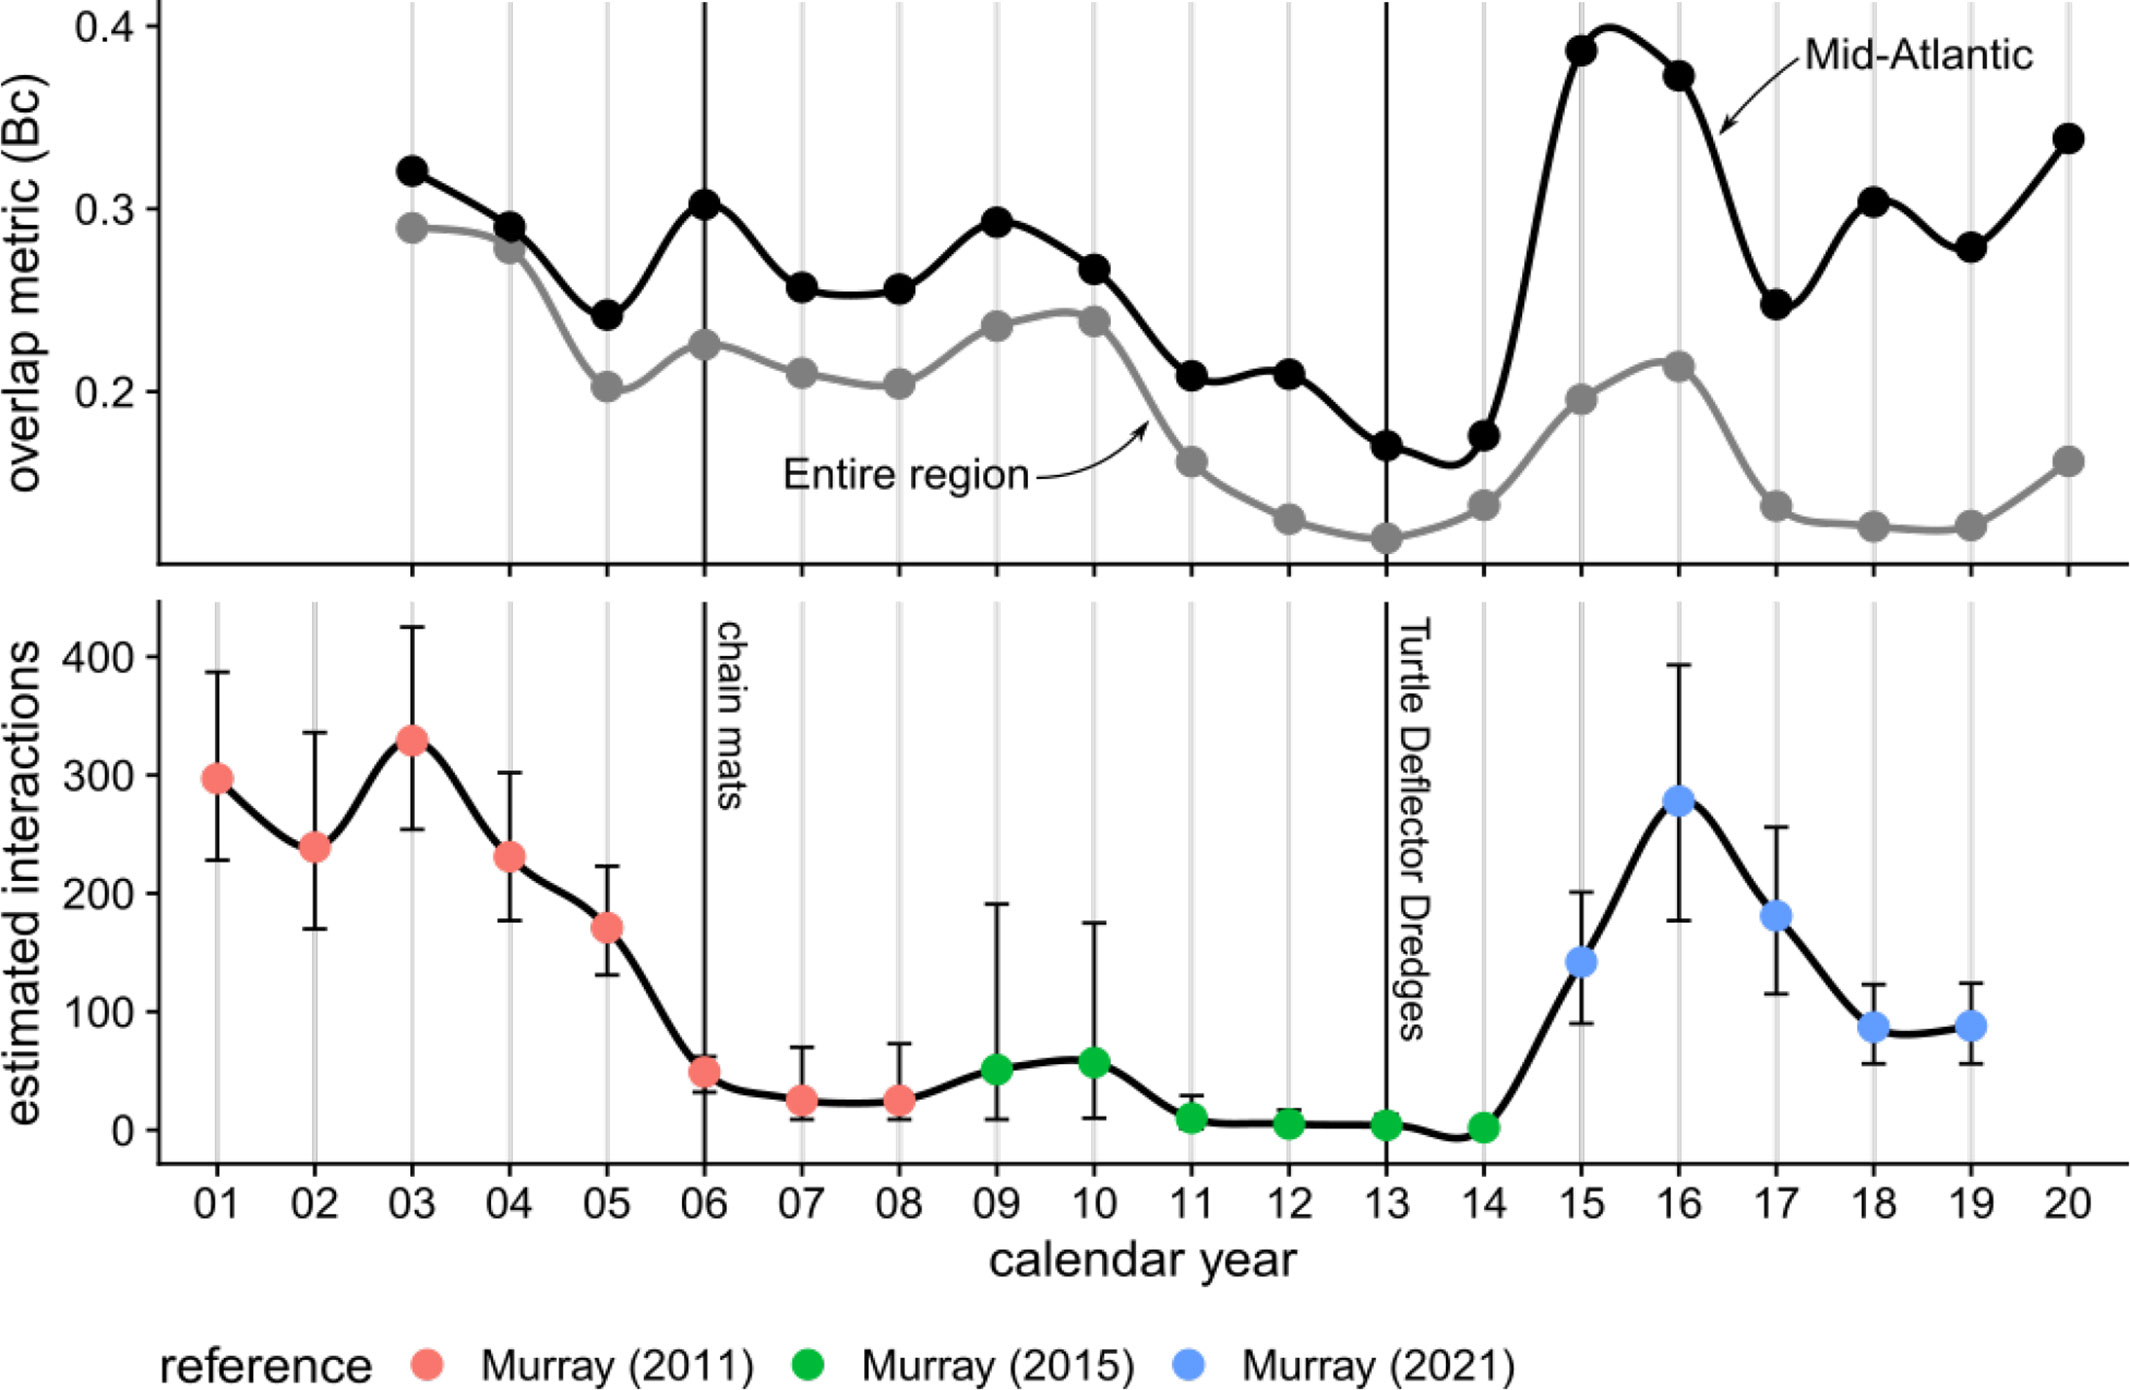
Figure 5 Time series of overlap values averaged across months by calendar year, with grey = entire region and black = Mid-Atlantic region as defined by Murray (2011); Murray (2015); Murray (2021), and published annual interaction estimates for loggerhead turtles in the U.S. Atlantic sea scallop dredge fishery. Years when gear modifications were implemented are noted, with chain mats being implemented since September 2006 and Turtle Deflector Dredges being implemented since May 2013. Both gear modifications are required when fishing for sea scallops between May and November in U.S. waters west of 71°W.
Qualitatively, there appears to be some correspondence between the overlap values averaged across months for each calendar year and published annual interaction estimates (Figure 5). This correspondence was further explored by regressing the annual estimated interactions against the averaged overlap values, accounting for the known errors of the interaction estimates (Appendix B) using a Bayesian approach. Inspection of posterior density plots, trace plots, and values suggested convergence of the Bayesian estimator. The estimated slope from the Bayesian regression model was significantly different from 0, with strong evidence in favor of the estimated slope being non-zero using Bayes factors (BF ⋙ 1; Figure B1). The R2 for the Bayesian regression model was 0.296 (95% CI [0.226, 0.366]; Gelman et al., 2019), indicating relatively low predictive performance.
Discussion
While higher degrees of overlap were associated with more estimated interactions between loggerhead turtles and the U.S. Atlantic sea scallop fishery, we would not characterize that relationship as strong. The overlap between distributions of loggerhead turtles and the U.S. sea scallop fishery poorly reflected the estimated number of interactions (R2 = 0.296), yet the times and areas of higher risk aligned well with patterns in observed bycatch (Figures 3, 4, C1). This suggests that while overlap does not encode enough information to be indicative of the magnitude of interactions, it may still be a good indicator of when and where interactions are likely to occur. With overlap in space and time being a relatively limited measure of encounter risk and probability of interaction (Murua et al., 2021, as well as this case), further refinements would be necessary to use overlap as a measure of absolute risk between turtles and U.S. commercial fisheries (Hobday et al., 2011).
We might expect that overlap metrics and interaction estimates would correlate given their direct linkages to commercial fishing effort. Interaction estimates are produced by expanding observed bycatch rates to the entire fleet using fishing effort, most of which is not observed. The overlap metrics cited in this paper, by definition, include the relative intensity of fishing effort over space and time. While the data sources used to define commercial fishing effort differ between the two (VMS for overlap and VTR for interaction estimates), they should conceivably be tracking similar patterns. So it is not surprising that overlap and interactions would associate, at least to some degree. But the low R2 value suggests poor predictive performance in the ability of overlap to predict interactions, at least in our case, again reinforcing the complexity of the fine-scale dynamics that produce bycatch and the inability of simple overlap measures to capture that complexity (Hobday et al., 2011; Murua et al., 2021), as well as potential data issues that could influence the comparison between the two (discussed in more detail below).
Fisheries bycatch is the culmination of a complicated process that starts with overlap in space and time and ends with incidental mortality (Hobday et al., 2011). The progression through this complicated process may ultimately determine the strength of association between overlap and interaction. For example, scallop vessels can dredge around the clock and turtles are known to have diel patterns in behavior (Ogden et al., 1983; James et al., 2006; Casey et al., 2010; Christiansen et al., 2017). This context-dependent behavior may influence encounterability and hence the potential for a dredge to catch a turtle during daytime vs. nighttime operations. Overlap and gear selectivity, then, may be high in this example, but encounterability would vary depending on the time of day resulting in a continuum of encounter risk. This shows the multifaceted nature of interactions and the processes leading up to them, and it illustrates a need to better understand what variables could influence risk (e.g., animal behavior and abundance, fishery characteristics, spatial and temporal scale and extent, etc.) using a more integrated approach (Gilman et al., 2019).
The veracity, quality, and comprehensiveness of data are other sources of uncertainty in the comparison between overlap and interactions. First, both of the derived data products (commercial fishing effort and loggerhead turtle distribution) used in the overlap calculations have their limitations. The VMS data does not capture the type (net or dredge) or number of gear (1 or 2) used by a vessel and may not be compatible with the measure of commercial fishing effort used to estimate interactions derived from self-reported VTRs (Murray, 2011; Murray, 2015; Murray, 2021). Similarly, a simple speed-rule approach was used to define fishing activity from the VMS polls for convenience, but there are other methods (Muench et al., 2018). In addition, the relative distribution of loggerhead turtles is based on a limited number of satellite-tagged animals compared to their population size (Winton et al., 2018) and assumed to be static over the 18-year study period; yet climate change may affect turtle distribution (Patel et al., 2021), especially in what appears to be a period of slow (or no) recovery for this threatened population (Ceriani et al., 2019). Second, the limited number of observed interactions has led to high uncertainty in the estimates and has prompted the adoption of different analytical methods for different time periods, possibly resulting in an inconsistent time series (Murray, 2011; Murray, 2015; Murray, 2021).
The ability of overlap to capture some of the observed patterns in bycatch is promising for certain aspects of mitigation. Simple measures of overlap may be useful in determining where and when more research is needed (Hatch et al., 2016; Murray et al., 2021) or the targeting of observer coverage when resources are limited (Baird et al., 2021). Examples exist where simple approaches of quantifying bycatch risk using overlap have been successful at providing near real-time information to fishers (Howell et al., 2008; Howell et al., 2015). Although, as pointed out by Eguchi et al. (2017), the success of overlap as an indicator of bycatch risk might ultimately be context-specific and depend on the complexity of the ecosystem and the amount of data available to capture that complexity through statistical modeling.
In summary, we found that overlap can be loosely thought of as an indicator of relative but not absolute risk. Simple measures of spatial and temporal overlap can provide a way to identify when and where bycatch is likely to occur relative to other times and areas. However, those measures may be limited in their ability to determine the probability of interaction and subsequent interaction estimates needed for fisheries management. Simple overlap studies, then, might be best suited for informing prioritization of resources in a relative sense, like focusing research in certain times and areas, providing targeted observer coverage, or initiating management discussions to delineate where and when bycatch mitigation approaches should be implemented. While overlap may contain some information about the actual risk of an interaction, we would caution against using it as a meaningful predictor of absolute risk unless there is evidence to suggest otherwise.
Data availability statement
The datasets presented in this article are not readily available because they are confidential. Requests to access the datasets should be directed to https://www.fisheries.noaa.gov/new-england-mid-atlantic/enforcement/vessel-monitoring-contacts.
Author contributions
JH led the conceptualization, analysis, discussion, and writing with input from all authors. All authors contributed to the article and approved the submitted version.
Funding
This study was funded in part by the National Marine Fisheries Protected Species Toolbox Initiative, the United States Department of the Interior, Bureau of Ocean Energy Management through Interagency Agreements M14PG00005, M10PG00075, and M19PG00007 with the United States Department of the Commerce, National Oceanic and Atmospheric Administration (NOAA), National Marine Fisheries Service (NMFS), Northeast Fisheries Science Center (NEFSC), and the scallop industry Sea Scallop Research Set Aside program administered by the Northeast Fisheries Science Center.
Acknowledgments
We thank Kristin Precoda and 2 reviewers for helpful comments on earlier versions of the manuscript. We also thank Benjamin Galuardi, Travis Ford, Michael Palmer, and Burton Shank for helpful discussions about the VMS data and the U.S. Atlantic sea scallop fishery.
Conflict of interest
The authors declare that the research was conducted in the absence of any commercial or financial relationships that could be construed as a potential conflict of interest.
Publisher’s note
All claims expressed in this article are solely those of the authors and do not necessarily represent those of their affiliated organizations, or those of the publisher, the editors and the reviewers. Any product that may be evaluated in this article, or claim that may be made by its manufacturer, is not guaranteed or endorsed by the publisher.
Supplementary material
The Supplementary Material for this article can be found online at: https://www.frontiersin.org/articles/10.3389/fcosc.2023.1118418/full#supplementary-material
Footnotes
- ^ Vessels that participated in the Days-At-Sea program that limited the number of fishing days or the Access Area program that limited the amount of harvested scallops.
References
Baird R. W., Anderson D. B., Kratofil M. A., Webster D. L. (2021). Bringing the right fishermen to the table: Indices of overlap between endangered false killer whales and nearshore fisheries in Hawaii. Biol. Conserv. 255, 108975. doi: 10.1016/j.biocon.2021.108975
Bedriñana-Romano L., Hucke-Gaete R., Viddi F. A., Johnson D., Zerbini A. N., Morales J., et al. (2021). Defining priority areas for blue whale conservation and investigating overlap with vessel traffic in Chilean Patagonia, using a fast-fitting movement model. Sci. Rep. 11, 2709. doi: 10.1038/s41598-021-82220-5
Best B. D., Halpin P. N. (2019). Minimizing wildlife impacts for offshore wind energy development: Winning tradeoffs for seabirds in space and cetaceans in time. PloS One 14 (5), e0215722. doi: 10.1371/journal.pone.0215722
Bhattacharyya A. (1943). On a measure of divergence between two statistical populations defined by their probability distributions. Bull. Calcutta Math. Soc. 35, 99–109.
Bürkner P. (2017). Brms: An r package for Bayesian multilevel models using Stan. J. Stat. Software 80 (1), 1–28. doi: 10.18637/jss.v080.i01
Bürkner P. (2018). Advanced Bayesian multilevel modeling with the r package brms. R J. 10 (1), 395–411. doi: 10.32614/RJ-2018-017
Casey J., Garner J., Garner S., Williard A. S. (2010). Diel foraging behavior of gravid leatherback sea turtles in deep waters of the Caribbean Sea. J. Exp. Biol. 213 (23), 3961–3971. doi: 10.1242/jeb.048611
Ceriani S. A., Casale P., Brost M., Leone E. H., Witherington B. E. (2019). Conservation implications of sea turtle nesting trends: Elusive recovery of a globally important loggerhead population. Ecosphere 10 (11):e02936. doi: 10.1002/ecs2.2936
Christiansen F., Esteban N., Mortimer J. A., Dujon A. M., Hays G. C. (2017). Diel and seasonal patterns in activity and home range size of green turtles on their foraging grounds revealed by extended fastloc-GPS tracking. Mar. Biol. 164, 10. doi: 10.1007/s00227-016-3048-y
Cronin M., Gerritsen H., Reid D., Jessopp M. (2016). Spatial overlap of grey seals and fisheries in Irish waters, some new insights using telemetry technology and VMS. PloS One 11, e0160564. doi: 10.1371/journal.pone.0160564
Crouse D. T., Crowder L. B., Caswell H. (1987). A stage-based population model for loggerhead sea turtles and implications for conservation. Ecology 68, 1412–1423. doi: 10.2307/1939225
Eguchi T., Benson S. R., Foley D. G., Forney K. A. (2017). Predicting overlap between drift gillnet fishing and leatherback turtle habitat in the California current ecosystem. Fisheries Oceanogr. 26, 17–33. doi: 10.1111/fog.12181
FR (2015). Framework adjustment 26 to Atlantic sea scallop and multispecies fishery management plans. Federal Register 80 (76), 22119–22135.
FR (2021). Joint omnibus electronic vessel trip reporting framework adjustment. Federal Register 85 (218), 71575–71577.
Fujiwara M., Caswell H. (2001). Demography of the endangered north Atlantic right whale. Nature 414, 537–541. doi: 10.1038/35107054
Gelman A., Goodrich B., Gabry J., Vehtari A. (2019). R-squared for Bayesian regression models. Am. Statistician 73 (3), 307–309. doi: 10.1080/00031305.2018.1549100
Gilman E., Chaloupka M., Dagorn L., Hall M., Hobday A., Musyl M., et al. (2019). Robbing Peter to pay Paul: Replacing unintended cross-taxa conflicts with intentional tradeoffs by moving from piecemeal to integrated fisheries bycatch management. Rev. Fish Biol. Fisheries 29, 93–123. doi: 10.1007/s11160-019-09547-1
Gray C. A., Kennelly S. J. (2018). Bycatches of endangered, threatened and protected species in marine fisheries. Rev. Fish Biol. Fisheries 28, 521–541. doi: 10.1007/s11160-018-9520-7
Hatch J. M., Haas H. L., Richards P. M., Rose K. A. (2019). Life-history constraints on maximum population growth for loggerhead turtles in the northwest Atlantic. Ecol. Evol. 9 (17), 9442–9452. doi: 10.1002/ece3.5398
Hatch J. M., Wiley D., Murray K. T., Welch L. (2016). Integrating satellite-tagged seabird and fishery-dependent data: A case study of great shearwaters (Puffinus gravis) and the US new England sink gillnet fishery. Conserv. Lett. 9, 43–50. doi: 10.1111/conl.12178
Hazen E. L., Scales K. L., Maxwell S. M., Briscoe D. K., Welch H., Bograd S., et al. (2018). A dynamic ocean management tool to reduce bycatch and support sustainable fisheries. Sci. Adv. 4, eaar3001. doi: 10.1126/sciadv.aar3001
Heppell S., Caswell H., Crowder L. (2000). Life histories and elasticity patterns: Perturbation analysis for species with minimal demographic data. Ecology 81, 654–665. doi: 10.1890/0012-9658(2000)081[0654:LHAEPP]2.0.CO;2
Heppell S. S., Crowder L. B., Menzel T. R. (1999). “Life table analysis of long-lived marine species, with implications for conservation and management,” in Life in the slow lane: Ecology and conservation of long-lived marine animals. Ed. Musick J. A. (Bethesda, MD: American Fisheries Society Symposium 23), 137–148.
Heppell S. S., Heppell S. A., Read A. J., Crowder L. B. (2005). “Effects of fishing on long-lived marine organisms,” in Marine conservation biology: The science of maintaining the sea's biodiversity. Eds. Norse E. A., Crowder L. B. (Washington, D.C: Island Press), 211–231.
Hobday A. J., Smith A. D. M., Stobutzki I. C., Bulman C., Daley R., Dambacher J. M., et al. (2011). Ecological risk assessment for the effects of fishing. Fisheries Res. 108, 372–384. doi: 10.1016/j.fishres.2011.01.013
Howell E. A., Hoover A., Bensen S. R., Bailey H., Polovina J. J., Seminoff J. A., et al. (2015). Enhancing the TurtleWatch product for leatherback sea turtles, a dynamic habitat model for ecosystem-based management. Fisheries Oceanogr. 24, 57–68. doi: 10.1111/fog.12092
Howell E. A., Kobayashi D. R., Parker D. M., Balazs G. H., Polovina J. J. (2008). TurtleWatch: A tool to aid in the bycatch reduction of loggerhead turtles Caretta caretta in the Hawaii-based pelagic longline fishery. Endangered Species Res. 5, 267–278. doi: 10.3354/esr00096
James M. C., Ottensmeyer C. A., Eckert S. A., Myers R. A. (2006). Changes in diel diving patterns accompany shifts between northern foraging and southward migration in leatherback turtles. Can. J. Zool. 84 (5), 754–765. doi: 10.1139/z06-046
Lewison R. L., Freeman S. A., Crowder L. B. (2004). Quantifying the effects of fisheries on threatened species: The impact of pelagic longlines on loggerhead and leatherback sea turtles. Ecol. Lett. 7, 221–231. doi: 10.1111/j.1461-0248.2004.00573.x
Lewison R. L., Soykan C. U., Franklin J. (2009). Mapping the bycatch seascape: Multispecies and multi-scale spatial patterns of fisheries bycatch. Ecol. Appl. 19, 920–930. doi: 10.1890/08-0623.1
Muench A., DePiper G. D., Demarest C. On the precision of predicting fishing location using data from the vessel monitoring system (VMS). Canadian Journal of Fisheries and Aquatic Sciences 75(7):1036–1047. doi: 10.1139/cjfas-2016-0446
Murray K. T. (2011). Interactions between sea turtles and dredge gear in the U.S. sea scallop (Placopecten magellanicus) fishery 2001-2008. Fisheries Res. 107, 137–146. doi: 10.1016/j.fishres.2010.10.017
Murray K. T. (2015). Estimated loggerhead (Caretta caretta) interactions in the mid-Atlantic scallop dredge fishery 2009-2014. Northeast Fish Sci. Cent Ref Doc. 15, 15–20. doi: 10.7289/V5GT5K5W
Murray K. T. (2021). Estimated loggerhead (Caretta caretta) interaction in the mid-Atlantic sea scallop dredge fishery 2015- 2019. NOAA Tech Memo NMFS-NE-270 18, 13. doi: 10.25923/apw2-wh54
Murray K. T., Hatch J. M., DiGiovanni R. A. Jr, Josephson E. (2021). Tracking young-of-the-year gray seals halichoerus grypus to estimate fishery encounter risk. Mar. Ecol. Prog. Ser. 671, 235–245. doi: 10.3354/meps13765
Murua H., Griffiths S. P., Hobday A. J., Clarke S. C., Cortés E., Gilman E. L., et al. (2021). Shark mortality cannot be assessed by fishery overlap alone. Nature 595, E4–E7. doi: 10.1038/s41586-021-03396-4
Myers H. J., Moore M. J. (2020). Reducing effort in the U.S. American lobster (Homarus americanus) fishery to prevent north Atlantic right whale (Eubalaena glacialis) entanglements may support higher profits and long-term sustainability. Mar. Policy 118, 104017. doi: 10.1016/j.marpol.2020.104017
NEFSC (2021). U.S. department of commerce, national oceanic and atmospheric administration, national marine fisheries service, northeast fisheries science center. State of the Ecosystem 2021: Mid-Atlantic. Available at: https://repository.library.noaa.gov/view/noaa/29278.
Niel C., Lebreton J.-D. (2005). Using demographic invariants to detect overharvested bird populations from incomplete data. Conserv. Biol. 19 (3), 826–835. doi: 10.1111/j.1523-1739.2005.00310.x
NMFS (2021) Fisheries of the United States 2019. U.S. department of commerce, NOAA current fishery statistics no. 2019. Available at: https://www.fisheries.noaa.gov/national/sustainable-fisheries/fisheries-united-states.
NOAA Fisheries (2023). Stock SMART data records, Retrieved from https://apps-st.fisheries.noaa.gov/stocksmart?app=homepage.
Ogden J. C., Robinson L., Whitlock K., Daganhardt H., Cebula R. (1983). Diel foraging patterns in juvenile green turtles (Chelonia mydas l.) in st. Croix united states virgin islands. J. Exp. Mar. Biol. Ecol. 66, 199e205. doi: 10.1016/0022-0981(83)90160-0
Panagopoulou A., Meletis Z. A., Margaritoulis D., Spotila J. R. (2017). Caught in the same net? Small-scale fishermen's perceptions of fisheries interactions with Sea turtles and other protected species. Front. Mar. Sci. 4, 180. doi: 10.3389/fmars.2017.00180
Patel S. H., Winton M. V., Hatch J. M., Haas H. L., Saba V. S., Fay G., et al. (2021). Projected shifts in loggerhead sea turtle thermal habitat in the Northwest Atlantic Ocean due to climate change. Sci Rep 11, 8850. doi: 10.1038/s41598-021-88290-9
Read A. J., Drinker P., Northridge S. (2006). Bycatch of marine mammals in U.S. and global fisheries. Conserv. Biol. 20, 163–169. doi: 10.1111/j.1523-1739.2006.00338.x
Rempala G. A., Seweryn M. (2013). Methods for diversity and overlap analysis in T-cell receptor populations. J. Math. Biol. 67 (6-7), 1339–1368. doi: 10.1007/s00285-012-0589-7
Senko J., White E. R., Heppell S. S., Gerber L. R. (2014). Mitigating marine megafauna bycatch. Anim. Conserv. 17, 5–18. doi: 10.1111/acv.12051
Smolowitz R., Haas H., Milliken H. O., Weeks M., Matzen E. (2010). Using sea turtle carcasses to assess the conservation potential of a turtle excluder dredge. North Am. J. Fisheries Manage. 30 (4), 993–1000. doi: 10.1577/M10-061.1
Smolowitz R., Milliken H. O., Weeks M. (2012). Design, evolution, and assessment of a sea turtle deflector dredge for the US northwest Atlantic sea scallop fishery: Impacts on fish bycatch. North Am. J. fisheries Manage. 32 (1), 65–76. doi: 10.1080/02755947.2012.661386
Stepanuk J., Read A., Baird R. W., Webster D. L. (2018). Spatiotemporal patterns of overlap between short-finned pilot whales and the U.S. pelagic longline fishery in the mid-Atlantic bight: An assessment to inform the management of fisheries bycatch. Fisheries Res. 208 (95), 309–320. doi: 10.1016/j.fishres.2018.07.008
Tixier P., Lea M., Hindell M. A., Welsford D., Mazé C., Gourguet S., et al. (2021). When large marine predators feed on fisheries catches: Global patterns of the depredation conflict and directions for coexistence. Fish Fisheries 22, 31–53. doi: 10.1111/faf.12504
Wallace B. P., Lewison R. L., McDonald S. L., McDonald R. K., Kot C. Y., Kelez S., et al. (2010). Global patterns of marine turtle bycatch. Conserv. Lett. 3, 131–142. doi: 10.1111/j.1755-263X.2010.00105.x
Warden M. L., Haas H. L., Rose K. A., Richards P. M. (2015). A spatially explicit population model of simulated fisheries impact on loggerhead sea turtles (Caretta caretta) in the Northwest Atlantic ocean. Ecol. Model. 299, 23–39. doi: 10.1016/j.ecolmodel.2014.11.025
Warden M. L., Murray K. T. (2011). Reframing protected species interactions with commercial fishing gear: Moving toward estimating the unobservable. Fisheries Res. 110, 387–390. doi: 10.1016/j.fishres.2011.05.015
Keywords: Caretta caretta, loggerhead turtles, overlap, U.S. Atlantic sea scallop fishery, interactions
Citation: Hatch JM, Murray KT, Patel S, Smolowitz R and Haas HL (2023) Evaluating simple measures of spatial-temporal overlap as a proxy for encounter risk between a protected species and commercial fishery. Front. Conserv. Sci. 4:1118418. doi: 10.3389/fcosc.2023.1118418
Received: 07 December 2022; Accepted: 16 February 2023;
Published: 29 March 2023.
Edited by:
Kristen Marie Hart, United States Department of the Interior, United StatesReviewed by:
Kelsey Roberts, Louisiana State University, United StatesAllison M. Benscoter, United States Department of the Interior, United States
Copyright © 2023 Hatch, Murray, Patel, Smolowitz and Haas. This is an open-access article distributed under the terms of the Creative Commons Attribution License (CC BY). The use, distribution or reproduction in other forums is permitted, provided the original author(s) and the copyright owner(s) are credited and that the original publication in this journal is cited, in accordance with accepted academic practice. No use, distribution or reproduction is permitted which does not comply with these terms.
*Correspondence: Joshua M. Hatch, am9zaHVhLmhhdGNoQG5vYWEuZ292