 Dan Sandacz
 Pati Vitt
 Tiffany M. Knight4,5,6
 Kayri Havens
- 1Department of Natural Resources, Lake County Forest Preserve District, Libertyville, IL, United States
- 2Program in Plant Biology and Conservation, Northwestern University, Evanston, IL, United States
- 3Negaunee Institute for Plant Conservation Science and Action, Chicago Botanic Garden, Glencoe, IL, United States
- 4Department of Community Ecology, Helmholtz Centre for Environmental Research – UFZ, Halle (Saale), Germany
- 5German Centre for Integrative Biodiversity Research (iDiv) Halle-Jena-Leipzig, Leipzig, Germany
- 6Institute of Biology, Martin Luther University Halle-Wittenberg, Halle (Saale), Germany
Ecological communities are maintained through species interactions, and the resilience of species interactions is critical to the persistence of natural communities. Keystone species play outsized roles in maintaining species interaction networks, and within plant-pollinator communities are high priorities for conservation. The loss of a keystone plant from a plant-pollinator network is expected to cause changes to network structure and composition of pollinator species, with the potential to cause secondary losses of plants and pollinators. To understand how the unmanipulated decline of a keystone plant affects the structure and composition of its network, we studied the plant-pollinator interactions of a Lake Michigan dune plant community where the population of the keystone plant, Cirsium pitcheri, is in rapid decline. The network prior to C. pitcheri decline (2016) was compared to the network as C. pitcheri continued to decline (2021 and 2022) in response to habitat loss. We find evidence that the loss of C. pitcheri altered network structure such that the community may be more sensitive to perturbations. Furthermore, changes in the composition of pollinators were explained by species turnover to a greater extent than by interaction rewiring, including the loss of bumblebees. Short-term negative consequences based on the changes to network structure and composition might lead to long-term effects on the persistence of the dune community. Our study exemplifies that the decline of a keystone plant can have negative implications for conservation of a plant-pollinator community. Using an interaction network framework to assess plant-pollinator communities has potential to develop strategies for best conservation and restoration practices in habitats vulnerable to habitat loss and disturbance.
1 Introduction
Ecological communities are maintained by interactions between species, which are widely threatened by the alteration and loss of habitat (Colwell et al., 2012). Understanding the role a species plays within a community and how that role is mediated by interactions is critical to prioritize conservation efforts, especially if a species exerts an outsized influence on the community. Species that exert a high degree of influence relative to their abundance, commonly known as keystone species, are high priorities in the process of ecological restoration and conservation at the community level to preserve interactions and their related functions (Mills et al., 1993; Power et al., 1996; Goldingay et al., 1997; Piraino et al., 2002; Jenkins et al., 2022). Keystone species within plant-pollinator communities are of high conservation concern for the ecological services they provide to natural communities (Kremen et al., 2007; Burkle et al., 2013; Garibaldi et al., 2013). Keystone plants (also known as framework plants; Dixon, 2009), often interact with a high diversity of pollinators with high frequency and/or have many exclusive interactions. By having large effects on the structure of plant-pollinator interactions, keystone plants regulate important direct and indirect effects of pollination including serving as floral resource hubs for a diverse assemblage of pollinators (Machado and Sazima, 2008; Campbell et al., 2012; Zografou et al., 2020) and facilitating the pollination of other plants in the community (Hunter and Aarssen, 1988; Carvalheiro et al., 2014; Bergamo et al., 2021). The loss of a keystone plant therefore has the potential to cause cascading extinctions in the network and alter network structure (Campbell et al., 2012; Kaiser-Bunbury and Blüthgen, 2015; Kaiser-Bunbury et al., 2010).
Interaction network structure is hypothesized to have important consequences for the stability and persistence of ecological communities (Thébault and Fontaine, 2010). For example, networks that are more specialized and less nested are hypothesized to be less resistant to perturbations (Weiner et al., 2014; Biella et al., 2020). Numerous studies have experimentally removed or simulated the loss of keystone species from interaction networks to quantify the consequences, but few have examined how unmanipulated declines in abundance affect plant-pollinator interactions and network structure. Although the structure of plant-pollinator networks can rewire across a season and from year-to-year (CaraDonna et al., 2017), more drastic changes to plant species diversity and abundance, such as the extirpation of a keystone plant, may be followed by the subsequent loss of pollinators through migration or extirpation in more dire scenarios (Anderson et al., 2011; Burkle et al., 2013; Goldstein and Zych, 2016; CaraDonna et al., 2021; Bain et al., 2022). Alternatively, the loss of a keystone plant may force pollinators to rewire, and pollinators may or may not have the flexibility to visit other plant species after the loss of the keystone resource (Burkle et al., 2013; Goldstein and Zych, 2016; Bain et al., 2022). The loss of pollinators could lead to negative consequences for the fecundity of plants and pollinators remaining in the community (Pauw, 2007; Bascompte and Stouffer, 2009; Pradal et al., 2009; Campbell et al., 2012; Burkle et al., 2013; Vitt et al., 2020). The outstanding challenge is to predict the magnitude of the effects caused by the real losses of keystone plant species within natural communities.
Changes in network structure may largely be due to changes in pollinator composition and their associated interactions, or interaction turnover. Interaction turnover (interaction β-diversity) describes the change in interaction composition over time and has two key components: interaction rewiring (βOS) and species turnover (βST) (Poisot et al., 2012). Interaction rewiring describes how interactions in a community reassemble over time because of changes in which species are interacting with each other within the same pool of species at the site, whereas species turnover describes how interactions in a community are lost or gained as individuals of a species become active or inactive through time (CaraDonna et al., 2017; CaraDonna et al., 2021; Fründ, 2021). Interaction turnover is important to assess as different groups of pollinators are known to have different functions in terms of pollination effectiveness. For instance, native bees are generally more effective pollinators than native flies (Page et al., 2021). It is critical to understand how interactions change respective to both components of interaction turnover to determine how subsets of species respond to changes in resource availability or the loss of a keystone species.
Related to interaction turnover is the distribution of pollinator body size as plant-pollinator network structure changes. Analyzing how average pollinator body size changes over time provides another perspective on how pollinator composition changes in response to floral resource availability. Body size is one functional trait of pollinators that can characterize pollination services (Kühsel and Blüthgen, 2015; Martins et al., 2015; Cullen et al., 2021; Fitzgerald et al., 2022). While body size can be a useful proxy for resource requirements or pollination niche, the primary objective is to understand how both interaction turnover at the functional-group level and pollinator body size at the species level characterize shifts in pollinator composition.
To understand how the loss of a keystone plant affects ecological networks, we studied the plant-pollinator interactions of a Lake Michigan dune plant community where the population of the keystone plant, Cirsium pitcheri (Figure 1), is in rapid decline. Our research builds on previous work in this system (Vitt et al., 2020) by investigating the interaction network as climate change has altered disturbance regimes of the dune habitat, causing the C. pitcheri population to decline. Cirsium pitcheri has been shown to be a keystone plant species in the community by supporting the majority of pollinator species with a unique flowering phenology, from early June through early July when other floral resources are scarce (Vitt et al., 2020). Additionally, the simulated loss of C. pitcheri leads to the prediction that nine pollinator species will be lost from the network—further suggesting the potential importance of C. pitcheri as a keystone plant in this community. Therefore, the conservation challenges associated with C. pitcheri and its role as a floral resource present a unique opportunity to examine how the decline of a keystone plant affects an ecological network.
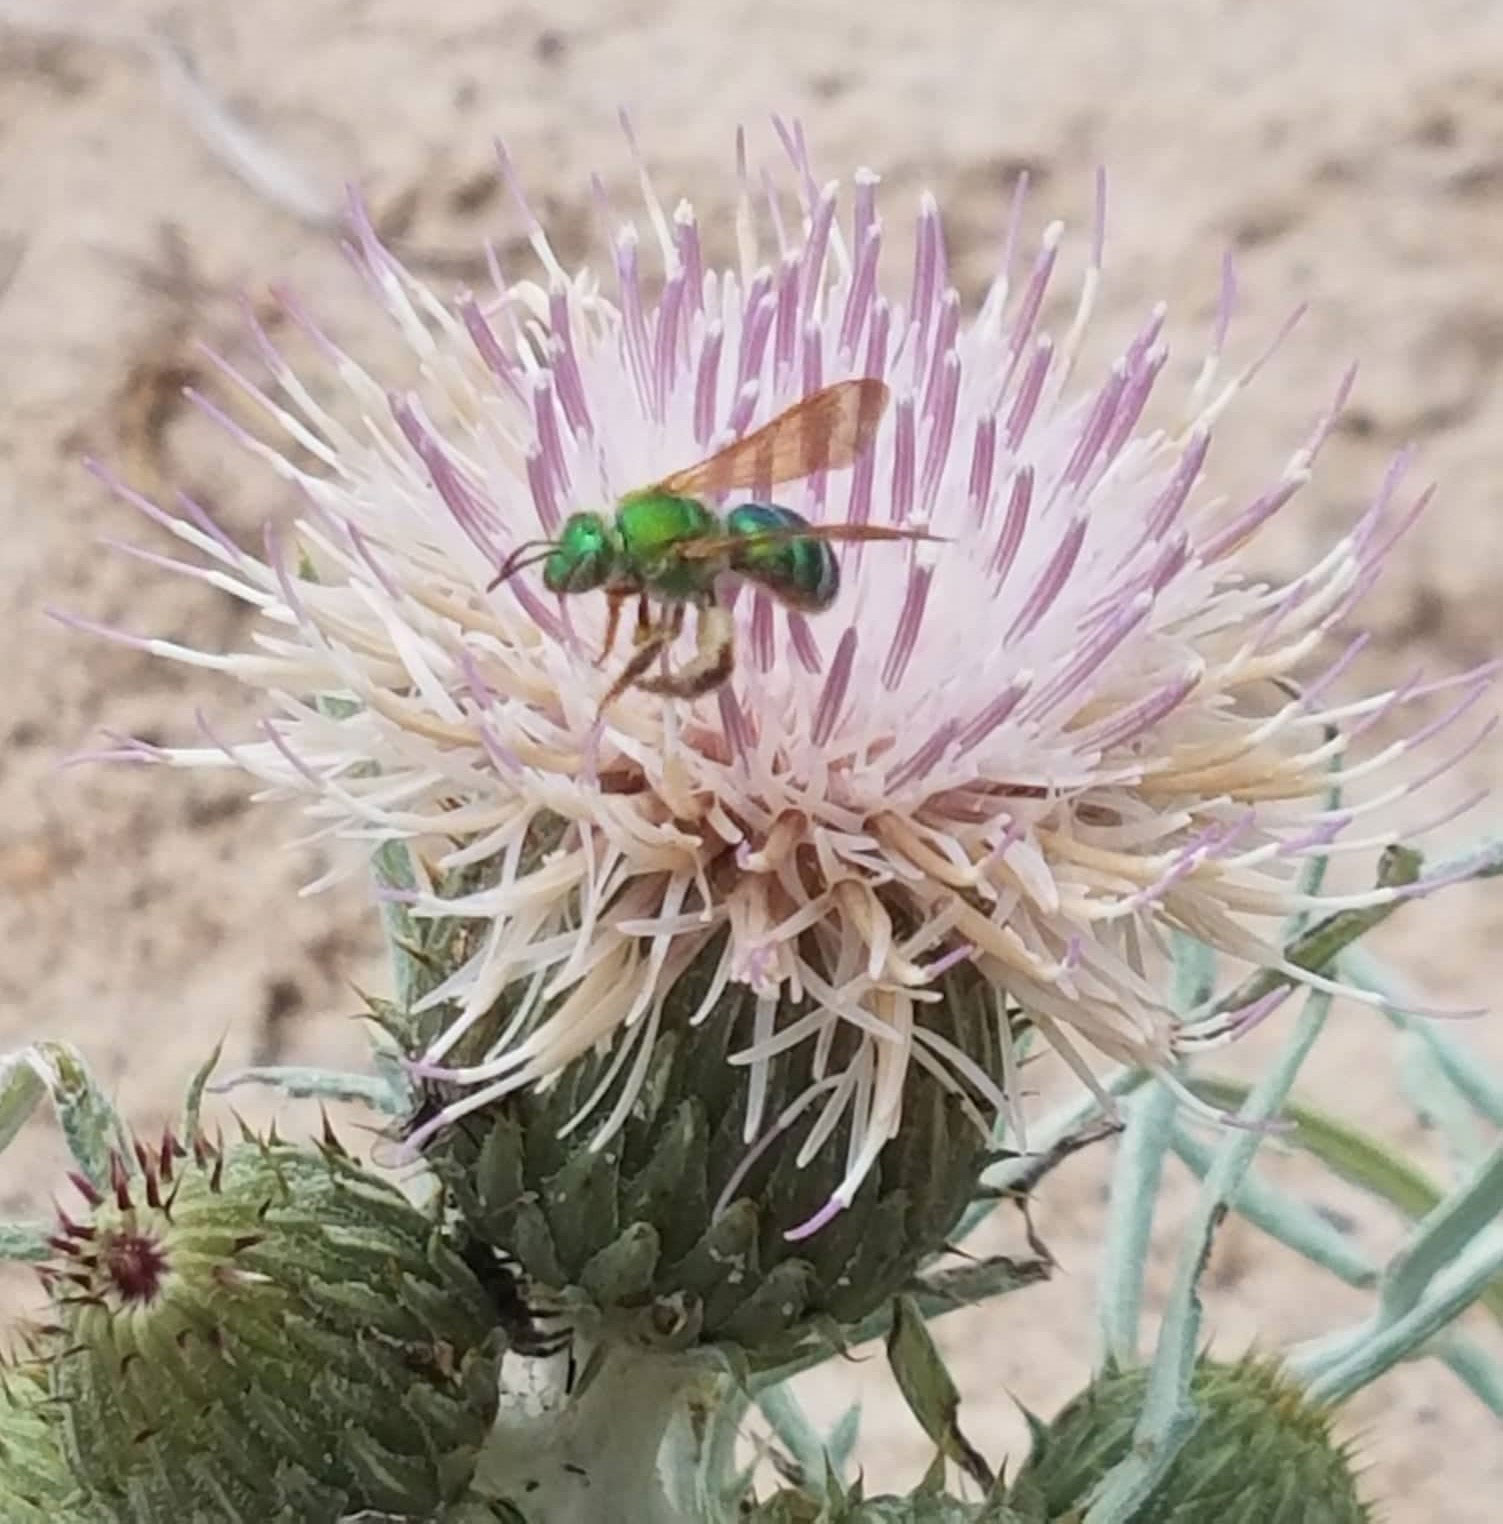
Figure 1 Cirsium pitcheri being visited by a native sweat bee, Agapostemon splendens. At Ship Canal Nature Preserve, C. pitcheri is a keystone floral resource for the plant-pollinator network. It blooms approximately mid-June through late July when other floral resources are scarce in the habitat. Disk florets are arranged in capitula that allow for a generalist pollination syndrome, offering both nectar and pollen to a high diversity of insect visitors. Photo by Dan Sandacz in June 2021.
To evaluate differences in network structure and composition in response to C. pitcheri decline, we compare the plant-pollinator network when C. pitcheri was abundant (2016) and during C. pitcheri decline (2021 and 2022). We predict that in response to the decline in Cirsium pitcheri:
1) interaction network evenness increases and niche overlap of pollinators decreases. Alternatively, another plant could assume the role of C. pitcheri without greatly affecting these measures of network structure.
2) species strength of C. pitcheri will decrease.
3) species turnover of pollinators will increase compared to interaction rewiring.
4) the average size of pollinators will decrease.
Overall, we expect the decline of Cirsium pitcheri to result in shifting network structure and interaction turnover resulting in the network being more sensitive to disturbance and to the loss or decline of the most effective pollinators (Biella et al., 2017; Vitt et al., 2020; Bain et al., 2022).
2 Materials and methods
2.1 Study system and Cirsium pitcheri
This study was conducted in the dune plant communities of Ship Canal Nature Preserve in Sturgeon Bay, Door County, Wisconsin, USA (referred to as “Ship Canal” hereafter). This ecosystem represents high-quality dune habitat on the Lake Michigan coast. Ship Canal is managed by The Door County Land Trust and this site is home to the most genetically diverse population of the federally threatened Cirsium pitcheri (Pitcher’s thistle, Torr. ex Eaton, Asteraceae) in Wisconsin (Fant et al., 2014). The dune habitat at Ship Canal is approximately 10 acres and the population of C. pitcheri includes plants on adjacent privately owned lakefront properties. The Ship Canal population is fragmented from other C. pitcheri populations in the Door County peninsula. Cirsium pitcheri is a state and federal conservation priority as a rare plant endemic to the lower Great Lakes that faces multiple extinction threats throughout its range, including anthropogenic use of dune habitats, invasive species encroachment, and invasive biocontrol weevils that use C. pitcheri as a nontarget host (Hamzé and Jolls, 2000; Havens et al., 2012). Throughout its range, C. pitcheri is a keystone plant and the most visited flowering resource in the plant-pollinator network (Inkster, 2016; Marshall J. M., 2017; Jolls et al., 2019; Vitt et al., 2020). Cirsium pitcheri is a monocarpic perennial that is unique for being an important floral resource despite its rarity, making its conservation and recovery a high priority in the lower Great Lakes region. At Ship Canal, C. pitcheri is visited by over twenty pollinator species, including bumble bees (Bombus spp.), sweat bees (Halictidae), and migrating monarch butterflies (Danaus plexippus) (Vitt et al., 2020). Cirsium pitcheri flowers in the early summer (mid-June through late July) before many other floral resources become available for pollinators.
Since the plant-pollinator network study conducted 2016 (Vitt et al., 2020) sand accretion and the associated loss of dune habitat has presented the biggest change to the plant-pollinator network. While dune habitats are known for dynamic changes, such as shifting topography due to sand accretion (Cowles, 1899), recent storm events exacerbated by climate change may be too intense for the historic dune plant community to persist (Maun, 1998; Miller, 2015; Yurk and Hansen, 2021). An experiment testing the effects of sand burial on C. pitcheri seedlings demonstrated that seedling mortality resulted from burial events that covered seedlings by 100% of their height, with consequences for the fitness of individuals that survived through less intense burial (Maun et al., 1996). With these results in mind, sand movement in the dune habitat since 2016 has likely caused the population of C. pitcheri to decline, which mostly affected plants on the open face foredune. Since 2016, a rapid decline in the C. pitcheri population has occurred across every life stage (Vitt and Havens, unpublished data; Supplemental Table 1). While C. pitcheri thrives in open-face sand dunes with little competition, the extent of the species’ resilience to frequent, intense sand accretion and/or burial events may be limited as a small population that is isolated from source populations (McEachern, 1992; Maun, 1998; Byers, 2017). Like many monocarpic species, the proportion of C. pitcheri plants flowering varies from year to year and 2016 had a higher proportion of flowering plants compared to 2021 and 2022 (Havens and Vitt, unpublished data). The variability in C. pitcheri flowering represents a potential confounding factor when considering plant-pollinator interactions but should be acknowledged in the context of how this variability might interact with habitat disturbance and population decline.
2.2 Field methods
To quantify plant-pollinator interactions at Ship Canal we followed the methods of the 2016 network study (Vitt et al., 2020). At Ship Canal 28 permanent plots for pollinator observations throughout the dune community were established in 2016. The comparison seeks to evaluate the extent of interannual variation in species and resource abundances and abiotic conditions while covering the heterogeneity of the dune habitat across Ship Canal. We relocated all 28 plots (circular, 10m diameter) using a Trimble GPS unit. Since 2016, natural dune dynamics at SCNP related to record high lake levels have altered dune habitat and species abundances. The foredune from 2016 has completely eroded due to high lake levels and wave action from violent winter storms every year since 2018 (Havens and Vitt, personal observation). As of 2021, the new foredune developed approximately 10 meters inland. Consequently nine of the pollinator plots used in 2016 were submerged and had to be moved inland. To assess the network along the new foredune and capture dynamics similar to the old foredune, we randomly chose nine plots along the new foredune. In sum, 19 original plots from 2016 plus 9 relocated plots were used for a total of 28 plots in the 2021 and 2022 sampling years. The 9 relocated plots were similar in plant species and substrate composition, although with reduced abundance of species observed compared to 2016. Plots located on the first hind dune were affected by sand movement, but species abundances and composition were still comparable to that of 2016. Hind dunes further from the lakeshore did not exhibit any changes related to sand movement, but some microsites in swales were notably wetter than previous years with establishment of sedges and other graminoids.
We conducted pollinator observations during the C. pitcheri flowering season (following Vitt et al., 2020). All observations took place from June 17 through July 20 (2016), June 27 through July 26 (2021), and July 3 through July 22 (2022). In 2022, C. pitcheri had a shorter duration of flowering compared to the other study years (Sandacz, personal observation). Observations took place between 09:00 and 15:30 local time on days with clear weather and low wind, conditions ideal for pollinator activity. On observation days throughout the C. pitcheri flowering period (approximately one or two weeks apart), we observed pollinator visitation for a period of ten minutes per flowering species in each plot. In each plot we recorded all flowering species in bloom, the number of open flowers or flower heads, all pollinators that visited flowering plants, and the number of times each pollinator species visited a flower. New species were compared to existing references at Chicago Botanic Garden and pollinators were identified to at least genus and plants were identified to species (Chadde, 2013; Marshall S. A., 2017).
2.3 Comparison of interaction networks
To compare changes in plant-pollinator interactions at Ship Canal, we define three different networks based on year of sampling and management and habitat changes. The first network is derived from Vitt et al. (2020), using interaction data to construct the plant-pollinator network from 2016— before C. pitcheri began to decline. The second and third networks are based on the interaction data collected from 2021 and 2022 respectively—after the decline of C. pitcheri each year since 2018. Each network represents the flowering period of C. pitcheri in the respective year (approximately early June through early July). The three networks are simply named “2016,” “2021,” and “2022” respectively to distinguish the interaction units and how the units will be compared in all subsequent analyses.
With the interaction data we visualized the three networks to examine interactions and species composition. Network diagrams were constructed in R (R Core Team, 2021), with the “plotweb” function (Dormann et al., 2008) from the bipartite package (Dormann et al., 2009). The plots incorporate the weighted interaction frequency to display interactions proportional to the observed number of pollinator visits. We visually represent the network using two methods; we assess the role of each plant and pollinator species individually and the role of each “functional group”. Functional groups were assigned similar to the methods of Motivans Švara et al., 2021. Plant functional groups are based on flower types as described by Kugler (1970) detailed in the BIOFLOR database (Klotz et al., 2002), with C. pitcheri kept as a separate group because of its demonstrated outsized influence on the network (Vitt et al., 2020); displaying C. pitcheri separate from another functional group was done to highlight its role amongst other functional groups. The plant functional groups are lip flower, flower head (capitate), bellflower, jam trap flower, bowl-shaped flower, and stalk disk flower, overall characterizing floral structure and floral rewards. Pollinator functional groups are based on a combination of taxonomy and body size (length). We used body size categories as described in Motivans Švara et al., 2021 to categorize pollinators as having small (0-4.99 mm), medium (5-9.99 mm), or large (>10mm) average body length. Body size of pollinators observed in our system is based on average body length reported on BugGuide.net (VanDyk, 2021). For species that did not have reported body lengths, we measured pinned specimens from the Ship Canal insect collection maintained by Chicago Botanic Garden. Additionally, we considered the taxonomy and phylogeny of pollinators when categorizing pollinators in functional groups. The classification process resulted in 7 distinct groups: bumblebees (large), butterflies (large), halictids (sweat bees, small and medium), hoverflies (small and medium), other flies (small and medium), large bees/wasps, and other bees/wasps (small and medium). Larger versions of the network diagrams at the species level are also provided as Supplements (Figures S1–S3).
2.4 Network structure analysis
To examine structural elements of the whole network, we implemented select “network level” indices that relate to the structure of the network without being overly sensitive to scale (abundance or total number of interactions; Parra-Tabla and Arceo-Gómez, 2021), most of which are frequency-based and consider the frequency of interactions. The first index is connectance, a measure of complexity or “density” of interactions in a network. Connectance as the number of unique interactions divided by the square of species richness (Dunne et al., 2002; Tylianakis et al., 2010), which ranges in value from 0 to 1. Higher values indicate higher connectance, meaning more unique interactions or greater density of interactions. However, connectance is more sensitive to the size of a network and should be examined more conservatively when compared to other indices (Elle et al., 2012). Nestedness (weighted NODF) describes the extent to which interactions are asymmetric, such that generalists are interacting with specialists and specialists are interacting with generalists (Almeida-Neto et al., 2008; Blüthgen, 2010; Almeida-Neto and Ulrich, 2011). Plant-pollinator networks often exhibit relatively high nestedness, which is attributed to the persistence and the robustness of plant-pollinator communities (e.g., Thébault and Fontaine, 2010). Higher levels of nestedness are related to increased robustness in plant-pollinator networks, as the overlap of interactions allows the network to be more robust to disturbance or loss of a species (Memmott et al., 2004, Elle et al., 2012; Bain et al., 2022). Nestedness ranges in value from 0-100, 0 meaning that every plant-pollinator interaction is specialized and 100 meaning all interactions occur in a perfectly subsetted manner. Specialization (H2’) quantifies the level of interaction complementarity within the network (Blüthgen, 2010). Increased specialization in the context of a dune habitat may decrease overall pollination functioning as low abundance of floral resources constrains foraging choices for specialized pollinators (Elle et al., 2012). The value of H2’ ranges from 0-1, with lower values meaning more generalized interactions with higher values meaning more specialized interactions (Blüthgen, 2010). Niche overlap, which is similar to H2’ in that it measures specialization as the extent of how much plants are sharing pollinators and vice versa (Dormann et al., 2008). Niche overlap is calculated separately for plants and pollinators; the value ranges from 0-1, with 0 indicating no common use of interaction partners and 1 indicating that all interaction partners are shared. Overlapping niches are important to plant-pollinator networks for redundancy of functional roles, which is a crucial aspect to maintaining the complementarity in specialization in plant-pollinator interactions and offering pollinators flexibility when foraging (Blüthgen and Klein, 2011). The final network-level index is evenness, which describes the extent to which all links (unique interactions between plants and pollinators) are homogenous based on interaction frequency (Blüthgen et al., 2008; Blüthgen, 2010). Evenness is calculated using Shannon diversity, with the index ranging from 0 (completely heterogeneous) to 1 (completely homogenous). The evenness of interactions can describe how reliant pollinators are on a specific floral resource or if interactions are distributed relatively equally.
To examine the role of each species in the network, we chose the “species level” index species strength, or the contribution of each individual species to network structure. Species strength measures how important a species is to all of its partners (Dormann et al., 2009), or to what extent pollinators depend on a plant relative to other plant species. This index ranges from 0 to 100 and higher values correspond with higher species strength. The calculation of species strength considers the frequency and diversity of interactions. Species in a plant-pollinator network with the highest species strength will be generalists that provide a degree of abundant resources to a diverse assemblage of consumers (pollinators). In other words, plants with high species strength provide a unique function as a floral resource in their plant-pollinator network.
Network-level and species-level indices were evaluated and compared between networks using non-parametric methods. All indices were compared using the “boot_networklevel” or the “boot_specieslevel” functions from the bootstrapnet R package (Ştefan and Knight, 2020), which wraps bipartite functions and bootstraps interactions to generate rarefaction curves of network metrics and number of interactions sampled. This allows for networks to be compared that have different sampling effort or different number of interactions sampled with standardized sampling effort. Non-overlapping 95% confidence intervals near the end of each curve (the observed value) are interpreted as significant differences in metrics between networks. All three interaction networks were compared using the outlined network level indices and the species level index species strength in which the species with the highest species strength in each network are highlighted.
2.4.1 Interaction turnover
To understand pollinator interaction turnover over time across plant-pollinator networks we partitioned interaction rewiring and species turnover by pollinator functional group. Interaction turnover (interaction β-diversity) describes the change in interaction composition over time and has two components: interaction rewiring (βOS) and species turnover (βST) (Poisot et al., 2012). Interaction rewiring describes how interactions in a community reassemble over time because of changes in which species are interacting with each other within the same pool of species at the site” (CaraDonna et al., 2017; CaraDonna et al., 2021; Fründ, 2021). Species turnover describes how “interactions in a community are lost or gained as individuals of a species become active or inactive, through time” (CaraDonna et al., 2017; Fründ, 2021).
Interaction turnover was calculated using the “betalinkr” function (Poisot et al., 2012) that is now part of the bipartite R package (Dormann et al., 2009; Fründ, 2021). Species interactions were grouped into the pollinator functional groups: bumblebees, butterflies, halictids (sweat bees), hoverflies, other flies, large bees/wasps, and other bees/wasps. By analyzing the changes at the functional group level, we can understand how subsets of the pollinator community respond to changes in floral resource availability. The proportion of interaction turnover explained by both interaction rewiring and species turnover are partitioned by pollinator functional groups.
2.4.2 Pollinator body size distribution
To examine the distribution of pollinator body size over time, the average body length of each pollinator species and the number of interactions contributed by each species was compared amongst and between interaction networks. Average body length is based on BugGuide.net reports (VanDyk, 2021) and Chicago Botanic Garden reference specimens. Analysis of variance (ANOVA) was used to test for significant differences in mean body size amongst interaction networks. If there was a significant difference between at least two networks, pairwise t-tests with Holm correction would be conducted using the “paired.t.test” function. All analysis was conducted in R (R Core Team, 2021).
3 Results
3.1 Network comparison
Across all three networks a total of 19 different plant species and 46 different pollinator species were observed during the flowering period of C. pitcheri (Figure 2). Compared to 2016, the relative proportion of interactions with C. pitcheri appears similar in 2021 while it is noticeably reduced in 2022 (Figure 2). Bumblebees, Bombus impatiens and Bombus vagans, reduced in their relative interaction frequency in 2022. Similarly, the functional group “other flies” was largely absent from the 2016 network, but their relative interaction frequency increased in 2021 and 2022. Butterflies were associated with C. pitcheri and Ascelpias syriaca in 2016 and 2021, but butterflies were not observed interacting with either plant in 2022.
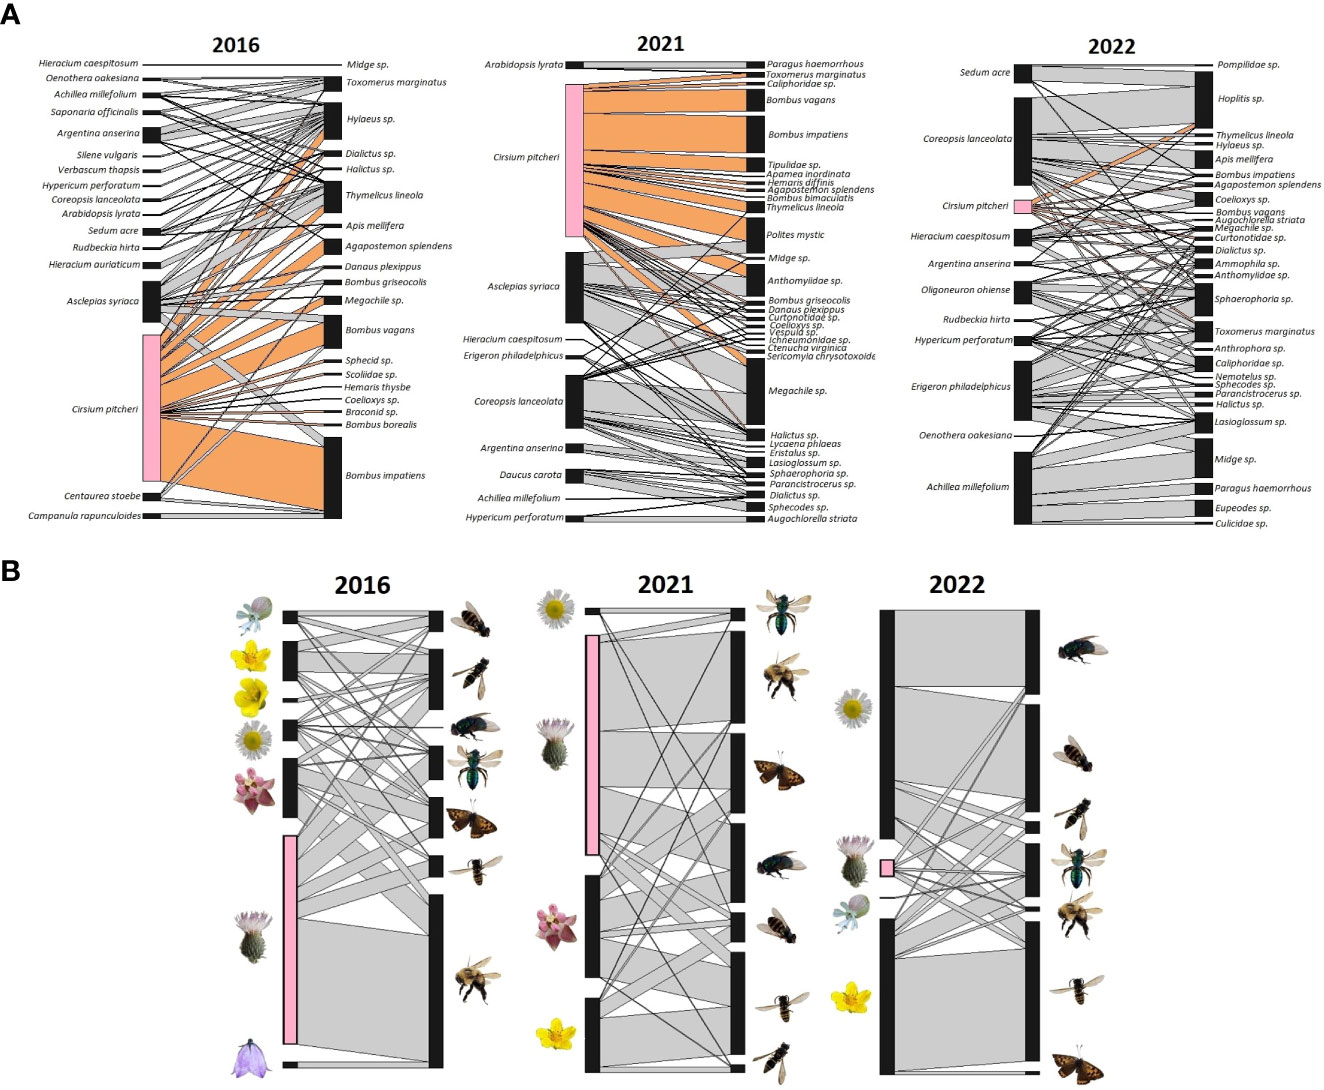
Figure 2 Ship Canal plant-pollinator interaction networks at the species and functional group levels from 2016, 2021, and 2022. (A) At the species level, Cirsium pitcheri (pink) and the interactions it has with pollinators (tan) are highlighted. (B) At the functional group level, plant groups are based on flower type and structure while pollinator groups are based on taxonomy and body size (length). Cirsium pitcheri (pink) is separated from the capitate group (predominantly Asteraceae species) because of its unique role as a keystone floral resource. 2016 is prior to C. pitcheri decline and 2021 and 2022 are during the continued decline of C. pitcheri.
3.2 Network structure analysis
Across networks, differences in network level indices provide evidence of altered plant-pollinator interaction structure (Figure 3). The 2022 network is marginally more connected than the 2016 and 2021 networks. Nestedness (weighted NODF) is significantly higher in 2016 compared to the 2021 and 2022 networks, which do not differ from one another. The difference in specialization (H2’) is significant between all networks, with the 2021 and 2022 networks more specialized to a greater extent compared to the 2016 network. Plant niche overlap is significantly different between all networks, with 2016 being the highest followed by 2022 and 2021. Similarly, pollinator niche overlap is significantly different between all with 2016 being the highest followed by 2021 and 2022. Evenness also significantly differs between all networks, being the highest in 2022 followed by 2021 and 2016.
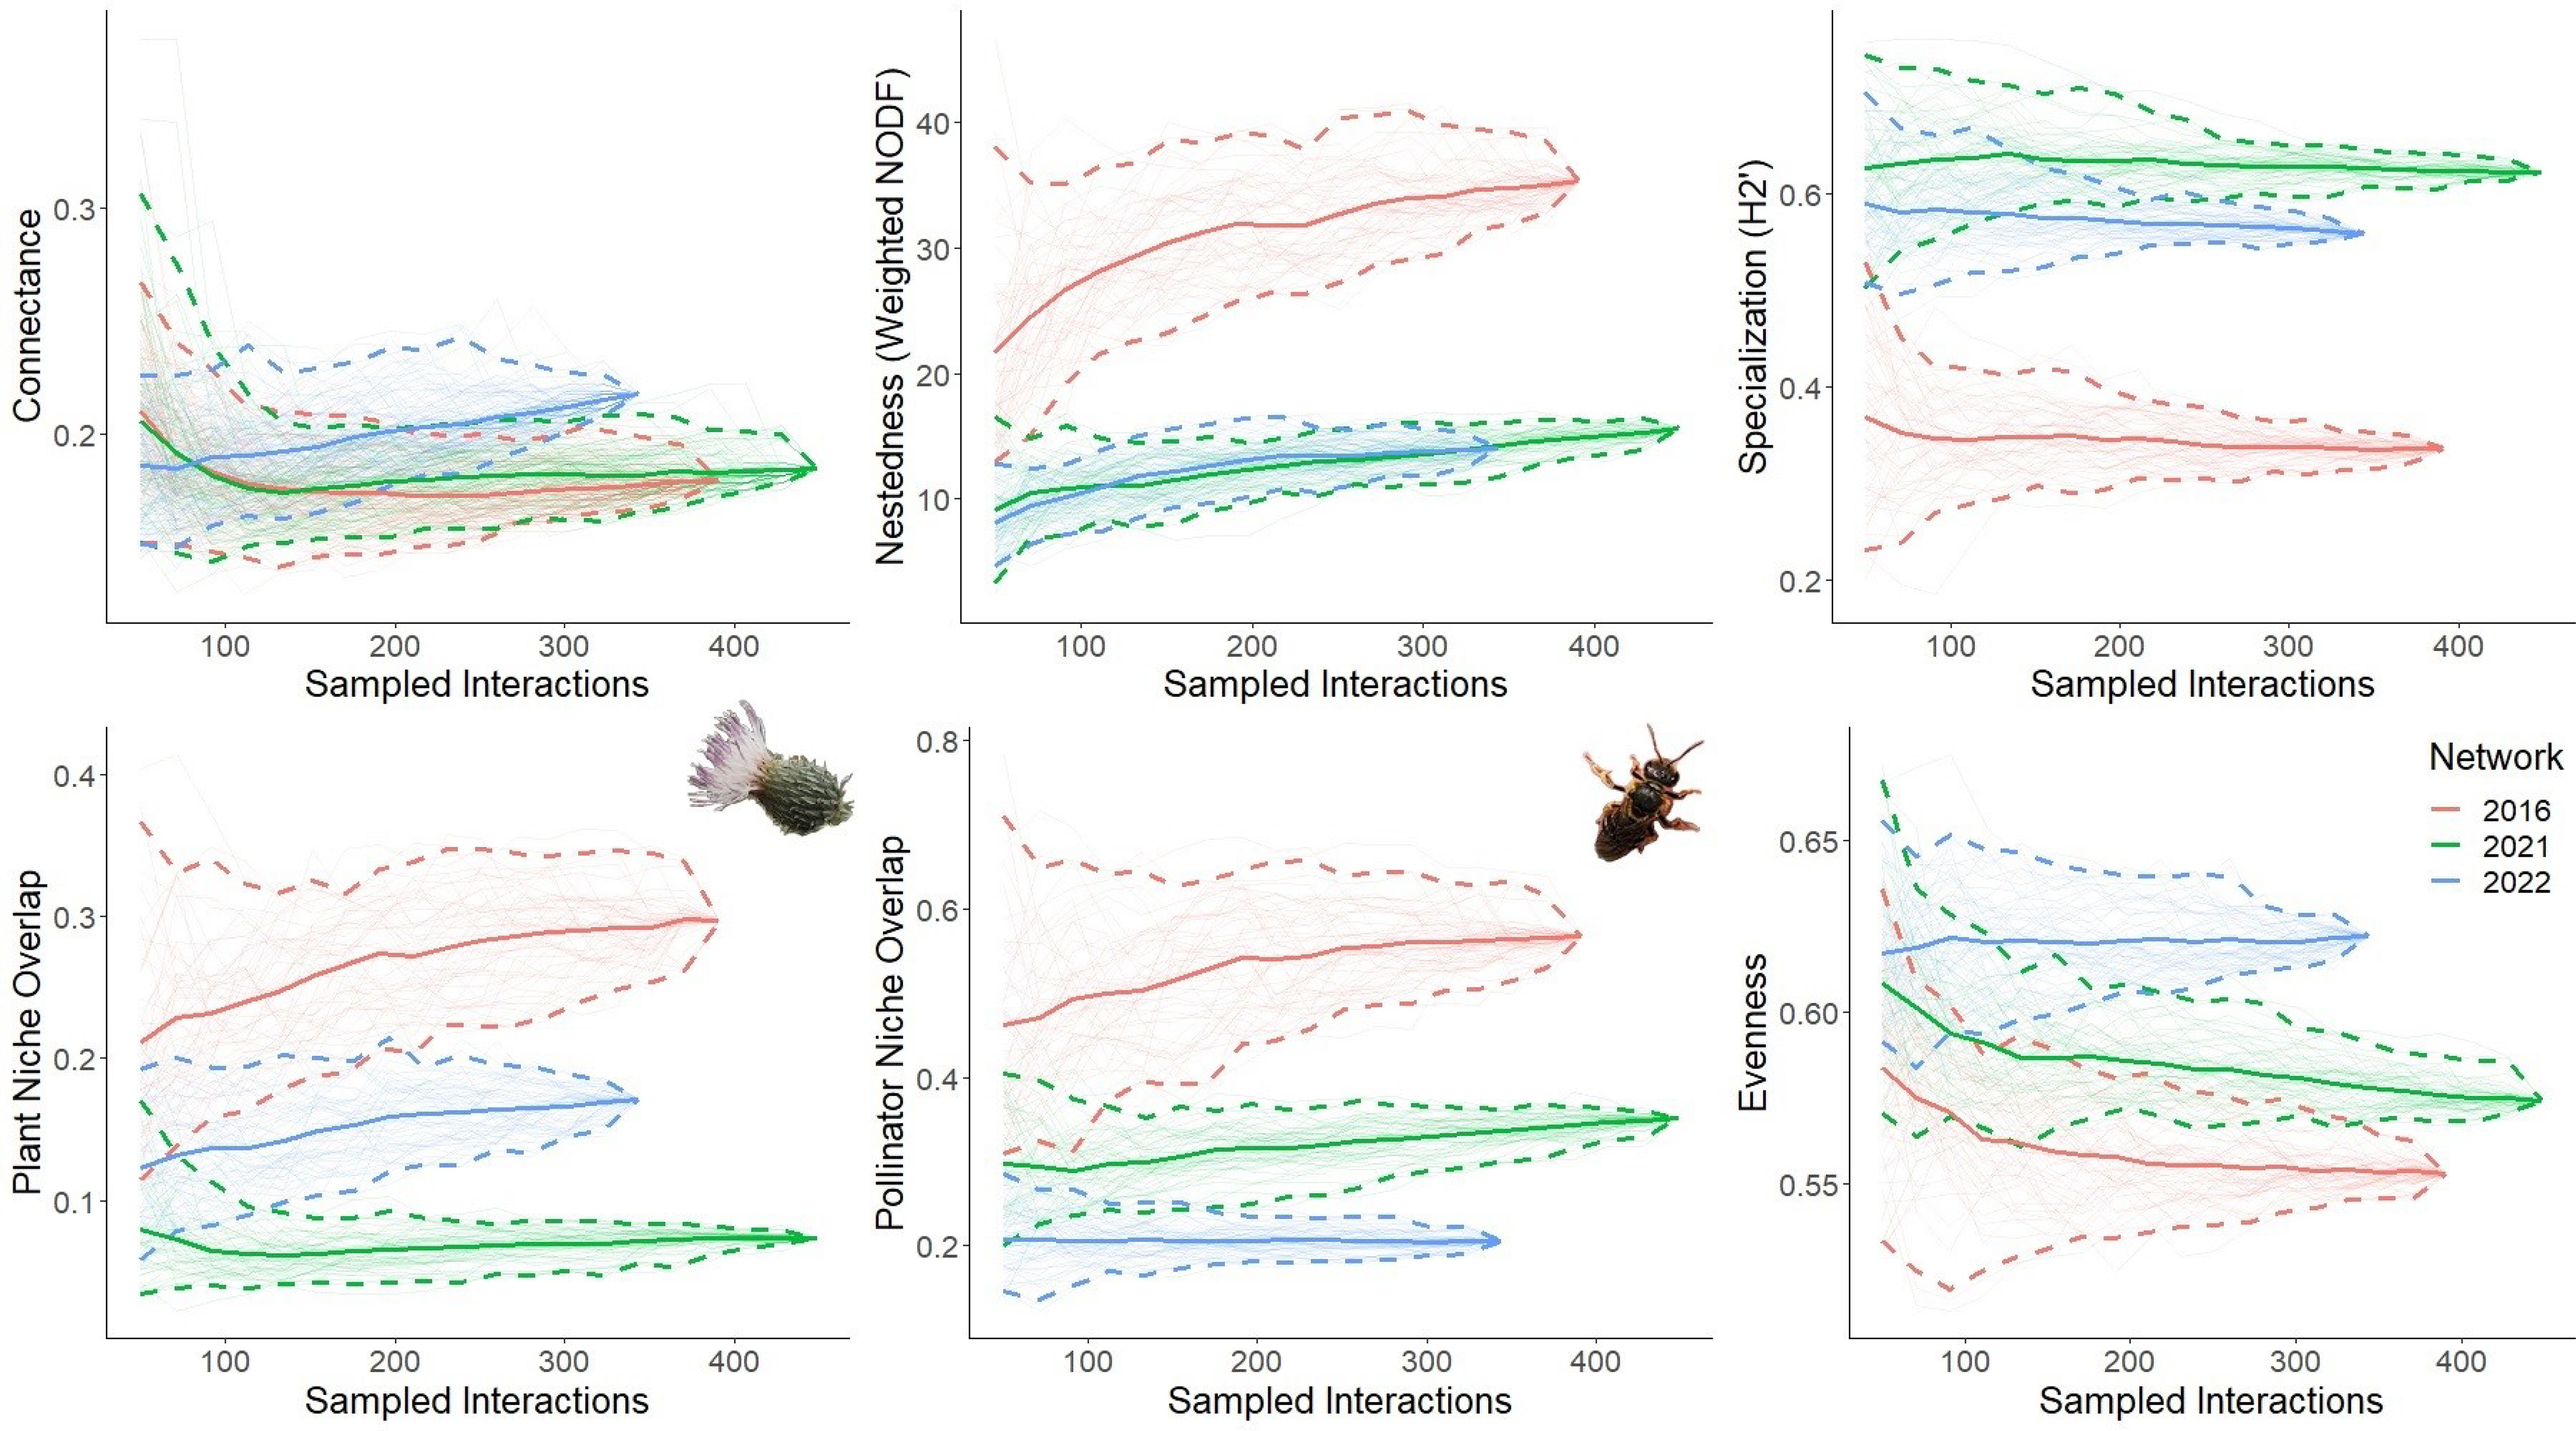
Figure 3 Network level structure across plant-pollinator networks. Rarefaction curves were generated by resampling network interactions without replacement. Five network-level indices were resampled: connectance, nestedness, specialization, niche overlap (plant and pollinator), and evenness. Each curve represents the index for the three networks; 2016 (red) when Cirsium pitcheri was abundant, and 2021 (green) and 2022 (blue) as Cirsium pitcheri was in decline. The endpoint of each solid line is the observed value, while the bootstrapped lines generate the 95% confidence intervals.
The relative differences in species strength decreased over time as well as the composition of the most important species to maintaining plant-pollinator interactions (Figure 4). Cirsium pitcheri maintains the highest species strength in 2016 and 2021 but falls off in 2022. The species strength of C. pitcheri is significantly higher than all other plant species in 2016 and 2021, but in 2022 it is middling regarding species strength and not significantly different from other plants. Secondarily, A. syriaca has the second highest species strength in 2016 and has approximately the same species strength as Coreopsis lanceolata in 2021. Asclepias syriaca is also absent from the 2022 network; in 2022, A. syriaca did not bloom during the C. pitcheri flowering time and bloomed approximately two weeks later than previous years (Sandacz, personal observation).
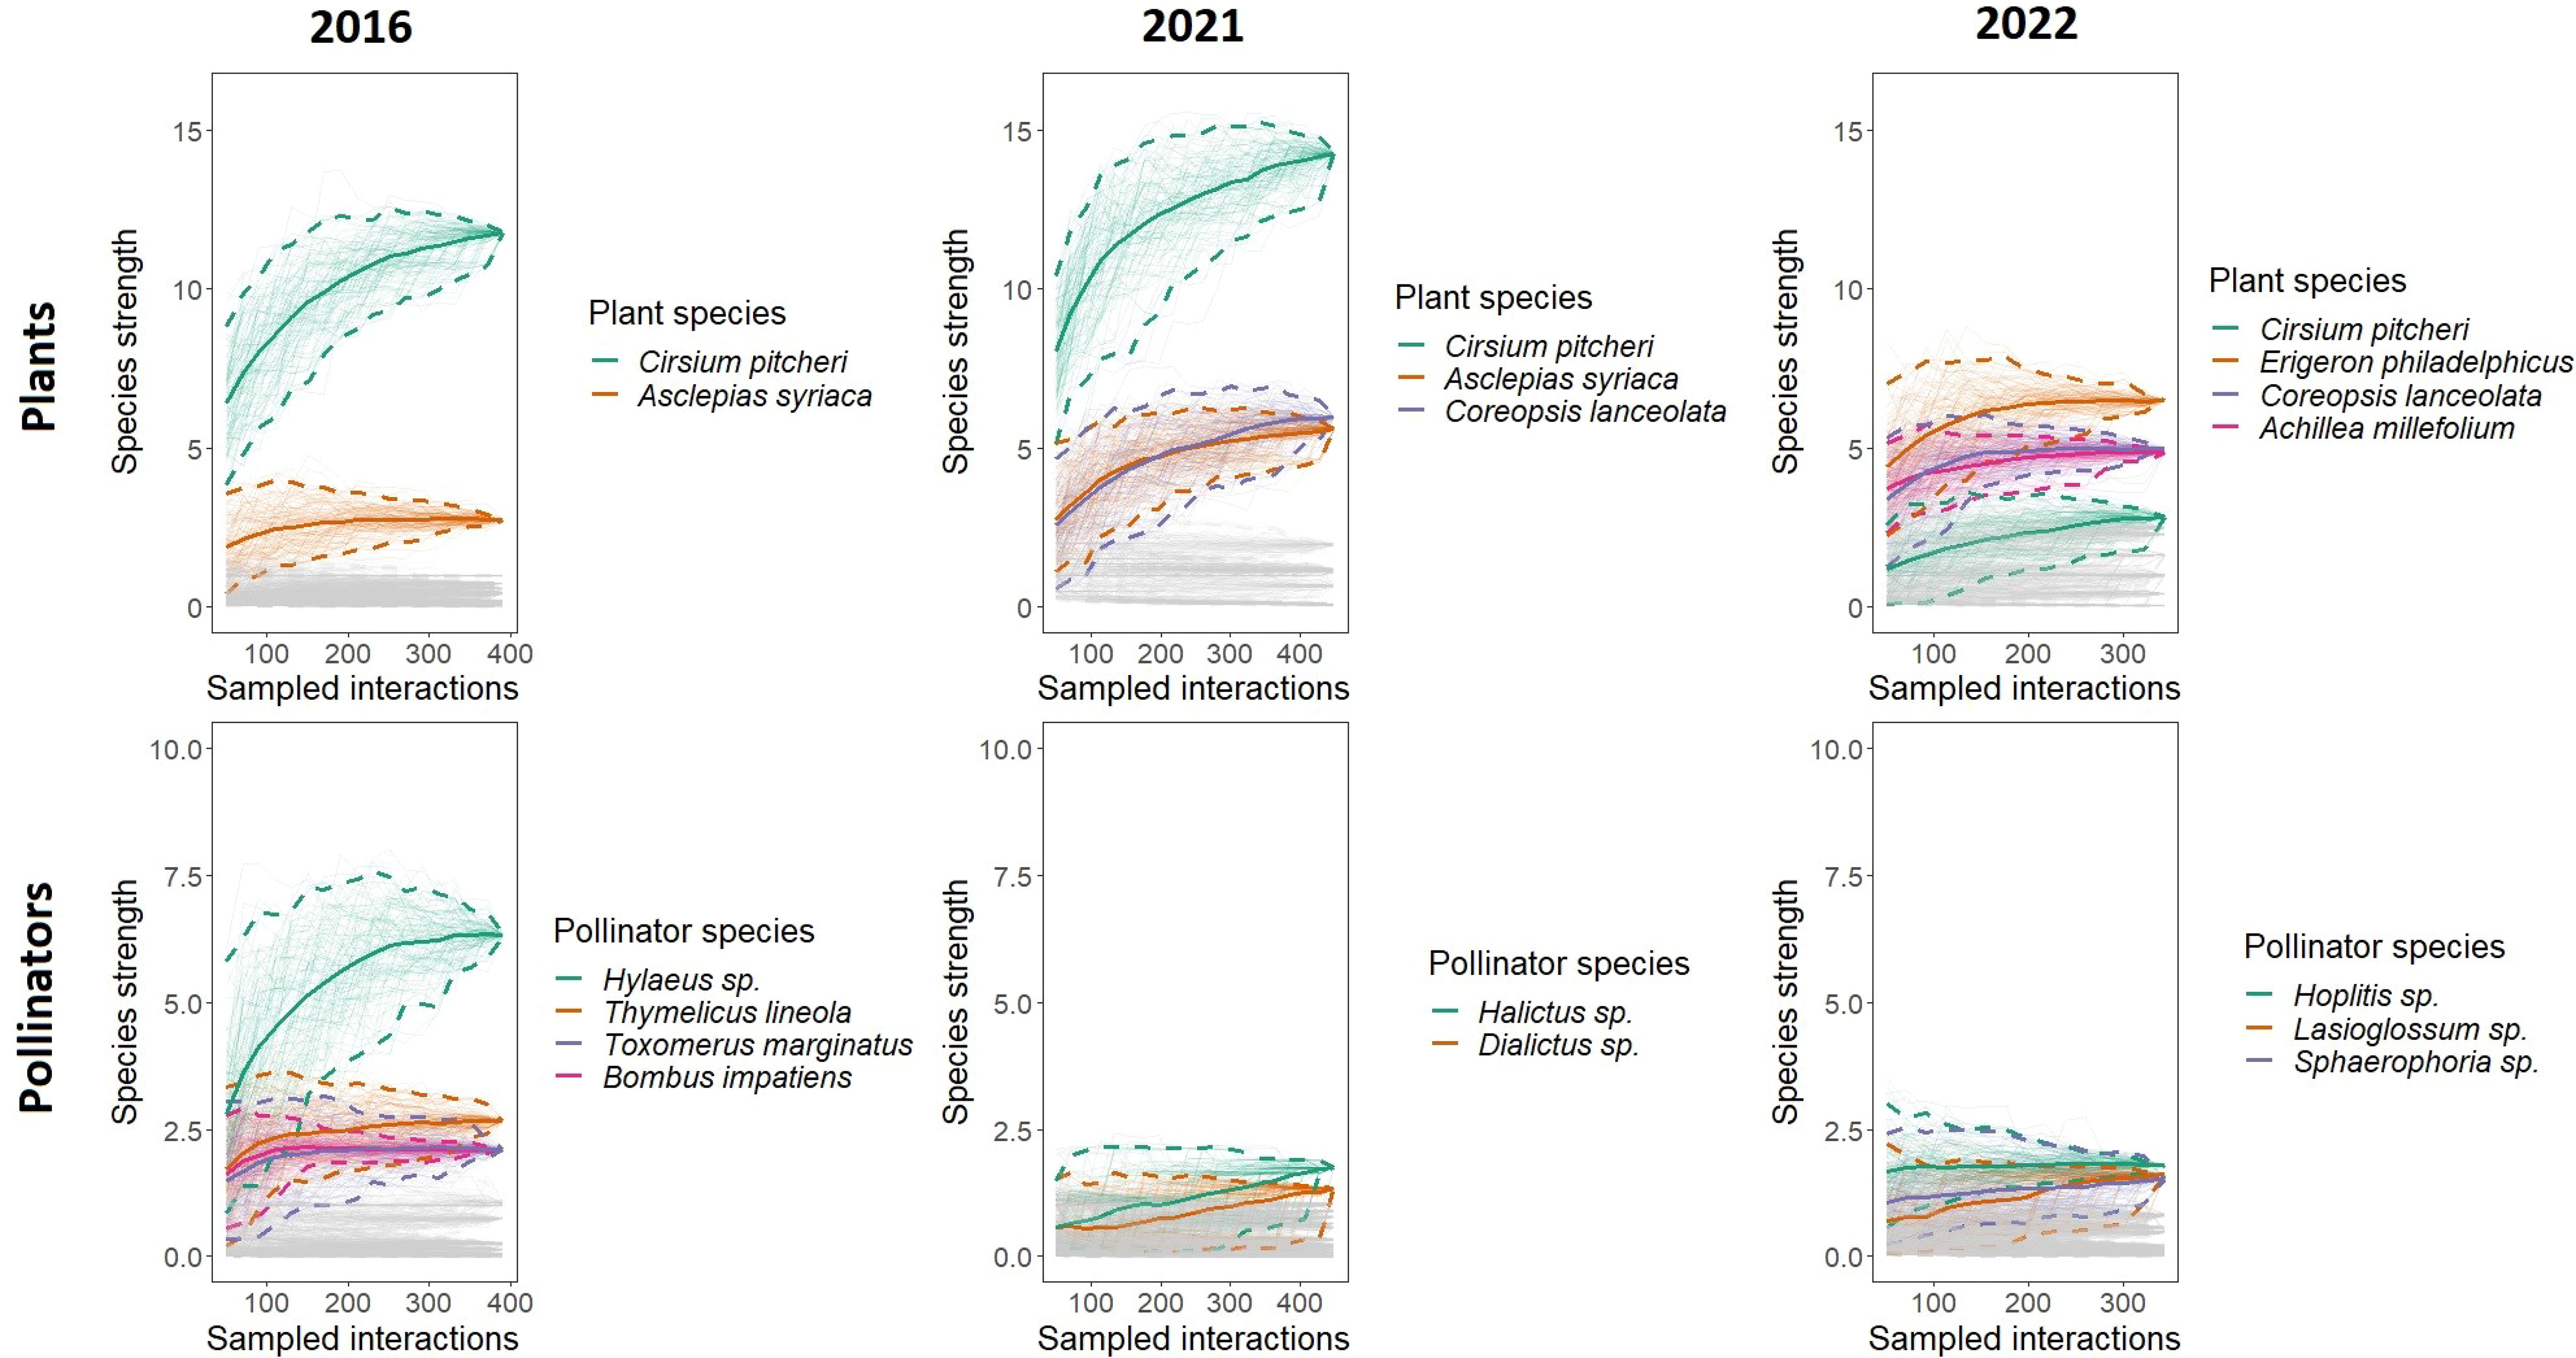
Figure 4 Plant and pollinator species strength across networks. Rarefaction curves were generated by resampling the network interactions without replacement. Each curve represents the species strength of a single species. The top two to four most important species to the structure of each network are highlighted and drawn with 95% confidence intervals. Cirsium pitcheri (green) is one of the most important species in all three networks. 2016 is when Cirsium pitcheri was abundant, and 2021 and 2022 are when Cirsium pitcheri was in decline. For highlighted species the endpoint of each solid line is the observed value, while the bootstrapped lines generate the 95% confidence intervals.
The pollinators with the highest species strength varied over time. Hylaeus sp. has the highest species strength in 2016, followed by Thymelicus lineola, Toxomerus marginatus, and Bombus impatiens. None of these species have the highest species strength in 2021 nor in 2022. In 2021, Halictus sp. and Dialictus sp. are marginally higher in species strength. In 2022, the pollinators with the highest species strength are Hoplitis sp., Lasioglossum sp., Sphaerophoria sp., which are not significantly different from each other.
3.3 Interaction turnover and pollinator body size distribution
Species turnover accounted for all of the changes to all of the interactions from butterflies and other flies (Table 1). In general, the contribution of species turnover to interaction turnover was higher than interaction rewiring. Halictids are the only exception to this pattern, which have a slightly higher contribution from interaction rewiring (0.477) compared to species turnover (0.456).
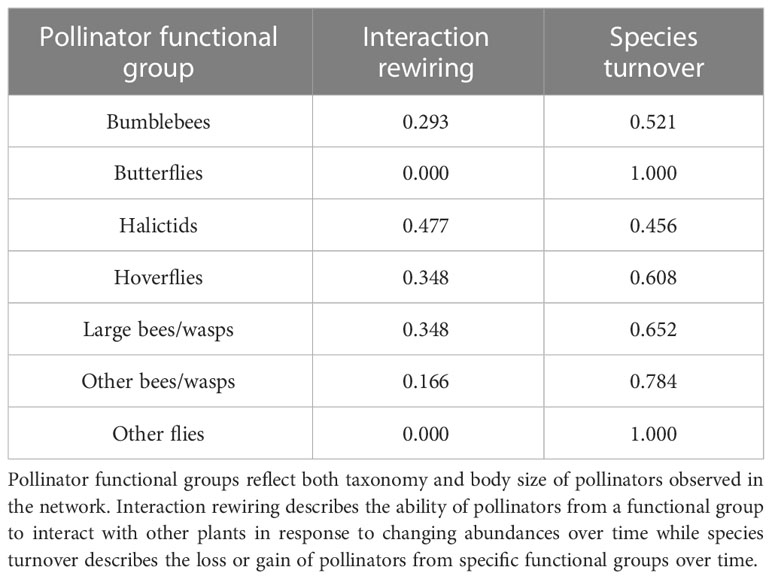
Table 1 Interaction turnover across the Ship Canal Nature Preserve plant-pollinator network from 2016 to 2022 based on contributions of interaction rewiring (βOS) and species turnover (βST).
Average pollinator body size decreased over time (Figure 5). The ANOVA test determined that there is a significant difference between the mean frequency of pollinator body length in at least one combination of network comparison (F(1, 361) = [4.707], p = 0.03). Pairwise t-tests were conducted; the mean pollinator body length is significantly higher in 2016 (9.93 ± 3.04) compared to 2022 (8.80 ± 4.05, p=0.042).
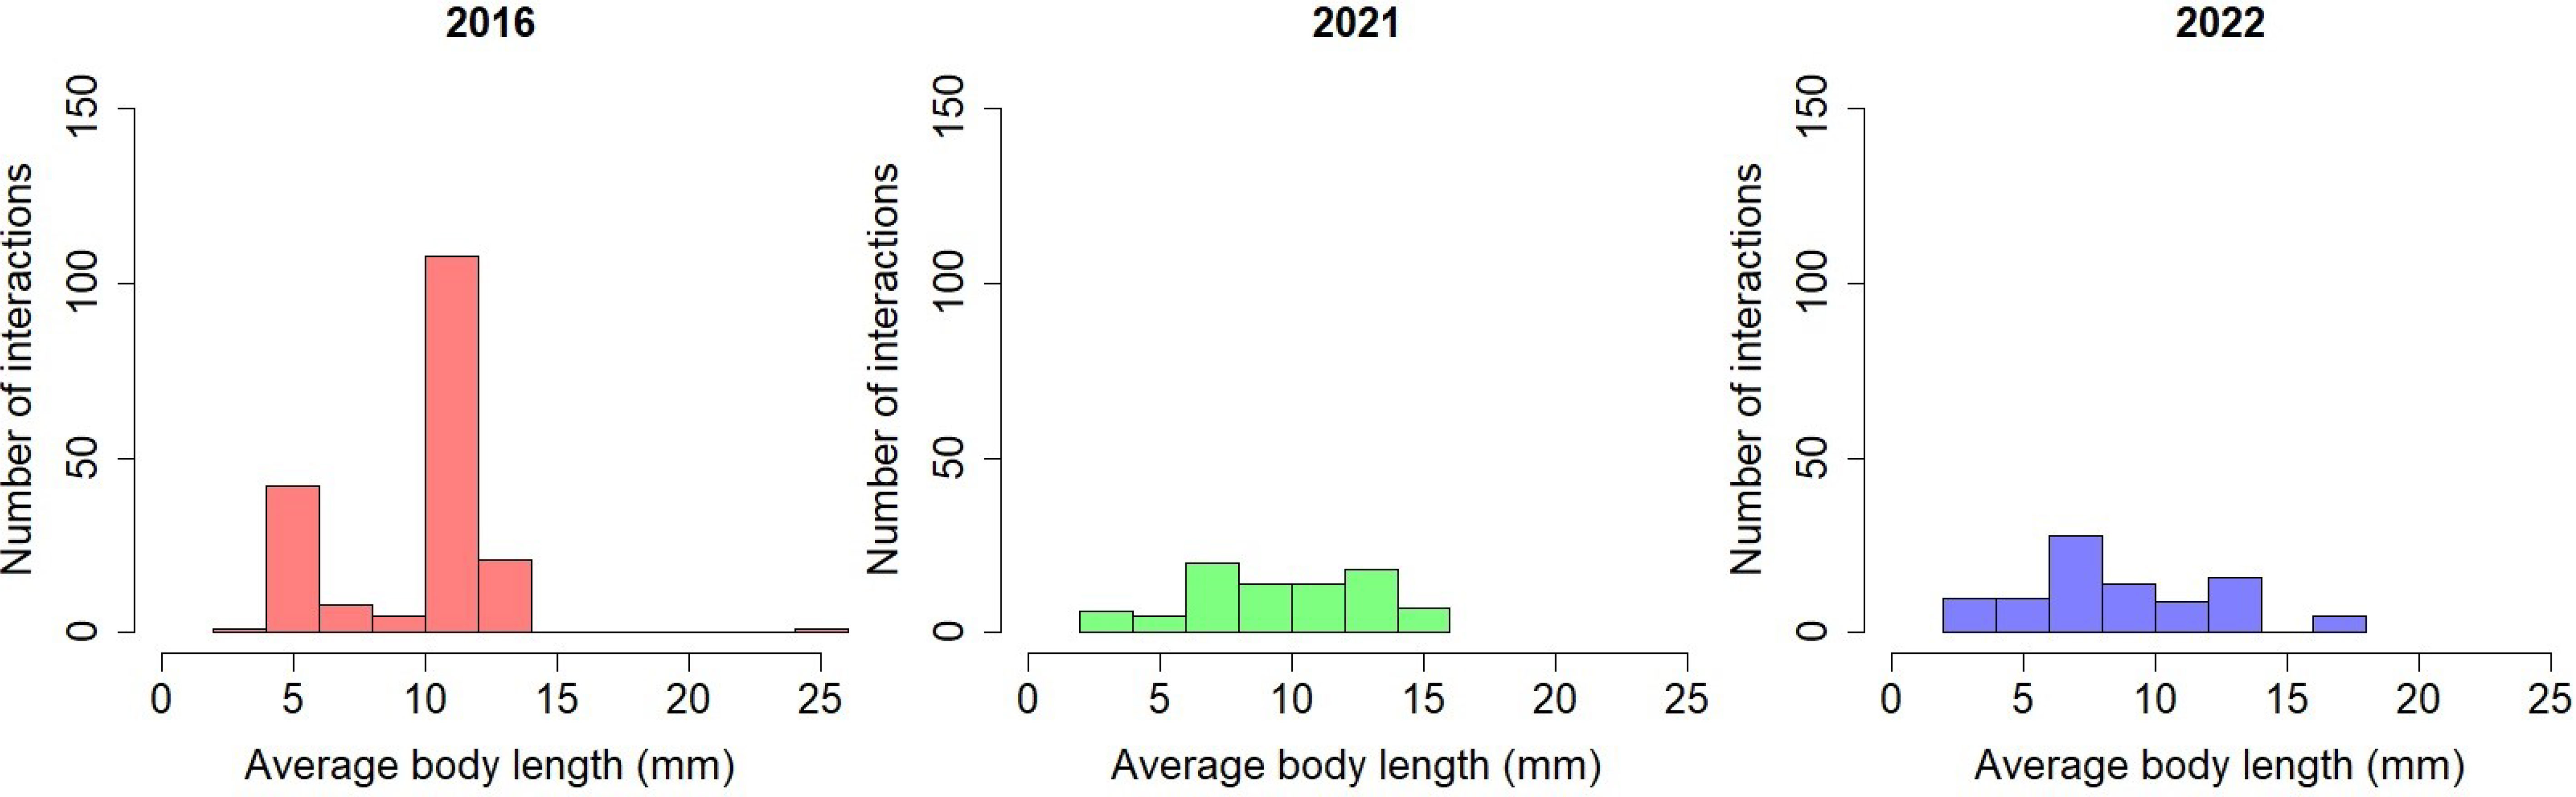
Figure 5 Frequency of pollinator interactions by average body length over time in the Ship Canal plant-pollinator network.
4 Discussion
Our analyses reveal that network structure and the composition of plant-pollinator interactions were altered with the decline of Cirsium pitcheri. Notably, network evenness increased with the decline of C. pitcheri, indicating that pollinators shifted interactions more evenly across flowering plants with the reduced availability of the keystone resource. This finding is reinforced by the results for species strength, that demonstrate the homogenization of species strength for both plants and pollinators. The relative contribution of each plant and each pollinator is now more similar for the maintenance of network structure. While Cirsium pitcheri remains one of the most important floral resources, our results show that its decline resulted in the subsequent loss or reduction of pollinators from the network, such as Bombus borealis and Hylaeus sp., which is consistent with the simulated co-extinction model of plants at the Ship Canal (Vitt et al., 2020). These findings characterize the plant-pollinator network as one that is sensitive to perturbations (less nested, more specialized, lower niche overlap; Brosi et al., 2017; Traveset et al., 2018; Biella et al., 2020; Bain et al., 2022). The assessment of network and species level structure provides evidence that the decline of C. pitcheri weakens the plant-pollinator network in the short-term such that the network is now more sensitive to disturbance or loss of a species.
The results for interaction turnover and pollinator size distribution demonstrate shifts in pollinators interacting in the network with the decline of C. pitcheri: namely, species turnover contributes more to interaction turnover than interaction rewiring, indicating the loss (butterflies, bumblebees) and gain (other flies, other bees/wasps) of key functional groups that have different pollination functions. Similarly, the decrease in the mean pollinator body length over time is indicative of the species turnover as smaller pollinators interact with greater frequency in the Ship Canal network. This is not likely due to differences in observers in 2016 (P. Vitt and K. Havens) vs. 2021-2022 (D. Sandacz), as the most dramatic results were seen between the 2021 and 2022 networks. Many fewer interactions with butterflies and bumblebees were observed in 2022, likely due to the decline in C. pitcheri, which is known to frequently interact with these pollinator functional groups. In 2016 and 2021, butterfly species were supported primarily by C. pitcheri and A. syriaca; the reduced abundance of C. pitcheri and the shift in A. syriaca flowering phenology to later in the 2022 season meant that butterflies were weakly connected to the network. Likewise, bumblebees that had high interaction frequency (namely Bombus impatiens) with C. pitcheri in 2016 drastically decreased with the decline of C. pitcheri in our networks. These larger pollinators were replaced by flies, such as Caliphoridae sp., that may forage with higher incidences of nectar robbing or are less effective at pollinating due to traits that result in lower conspecific pollen transfer (Herrera, 1987; Adler and Irwin, 2006; Földesi et al., 2021; Page et al., 2021). Solitary bees, specifically halictids such as Dialictus sp., rewired to a greater extent than other functional groups and are known to be effective pollinators (Batra, 1984; Bischoff et al., 2013; Marshall J. M., 2017; Willmer et al., 2017). However, the foraging range of solitary bees is much more restricted compared to bumblebees, indicating that Ship Canal may become more genetically isolated from other C. pitcheri populations (Steffan-Dewenter and Tscharntke, 1999; Gathmann and Tscharntke, 2002; Ne’eman et al., 2006; Kay and Sargent, 2009; Grüter and Hayes, 2022).
A less resistant plant-pollinator network with a declining keystone floral resource exemplifies a community that is vulnerable to further loss of species and pollination. Short-term decreases in network robustness are not necessarily found in other habitats (Baskett et al., 2011; Fiedler et al., 2012; Cunningham-Minnick et al., 2020), indicating that environmental context and species composition of a plant-pollinator network before and after major disturbance events may be more determinant of network structure. The loss of a single pollinator from the system could lead to cascading effects, such as reduced C. pitcheri reproduction (Brosi and Briggs, 2013). For example, large-bodied Apidae pollinator visitors (primarily Bombus spp.) were positively correlated with the subsequent number of C. pitcheri seedlings (Marshall J. M., 2017), suggesting short-term negative effects for the fecundity of the Ship Canal population as Bombus spp. turnover from the network.
The changes in network structure, the roles of individual plants, and the factors driving habitat loss are critical to understanding the changes in the resilience of plant-pollinator communities long-term. Sand accretion and other mechanisms altering coastal dunes changing plant species abundances may have been more important in determining the role of C. pitcheri in the 2021 and 2022 networks. Dune dynamics are critical to understanding the biotic and abiotic conditions that the Ship Canal plant-pollinator network faces. Future studies at Ship Canal and similar coastal dune habitats should consider how dune dynamics have altered as a result of climate change. The drastic changes in the Ship Canal foredune habitat due to violent winter storms and sand movement have altered species abundances. Further understanding of how environmental changes impact plant-pollinator interactions may help determine which habitats are most sensitive to changes affecting plant-pollinator network structure and therefore which habitats should be prioritized by management interventions. Resource limited habitats, such as coastal dunes, likely require prompt active restoration to fill gaps in floral resources to mitigate any negative effects of invasive plant removal, especially where they maintain protected species.
The application of network ecology to restoration is the ability to anticipate how changes in pollinator visitation may affect the reproduction of plant-pollinator networks. The decline of keystone species could result in lagging reproductive and demographics effects for both plants and pollinators which is particularly worrisome in the context of global pollinator decline (Bergamo et al., 2021; Rodger et al., 2021). Integrating studies on reproductive ecology and pollinator efficacy into network studies would provide powerful insights into how changes in network structure will affect priority species. Determining specific mechanisms or mutualisms that are most efficacious for supporting keystone plant species can help direct management priorities, such as bolstering floral resources during specific periods of the growing season or increasing nesting habitat for specific pollinators. One consideration for the management of the C. pitcheri population at Ship Canal is to identify suitable native plants that could increase floral coverage with similar flowering phenology, thereby facilitating the pollination of C. pitcheri without direct competition. To determine suitable candidate species, future studies should assess network structure alongside demographics, flowering phenology, and functional traits to best sustain target mutualisms.
Integrating information on the demography and niches of plants in a network may be key to optimizing the success of restorations. Future studies should closely monitor species abundance and abundance of floral displays (such as percent floral cover) to track how abundance generally correlates with resource availability for pollinators. Flowering phenology is also critical to understand the temporal niche a species occupies in a plant-pollinator network. In the case of Ship Canal, the 2016 seasonal phenology is well-documented by Vitt et al., 2020, and species with unique temporal niches are highlighted, such as C. pitcheri and S. acre. As species composition changes (and to account for interannual variation), evaluating a network each month is paramount to assess which periods of time in the growing season a plant-pollinator network is least robust to perturbations to identify gaps in distribution of floral resources. Additionally, it is important to assess which traits of flower morphology make plants important for pollinators in the SCNP plant-pollinator network, and likewise which traits of pollinators drive interactions. Analysis of functional traits in a plant-pollinator network can lead to a more complete understanding of how interactions are structured in a network (Motivans Švara et al., 2021) and which traits are important to consider when introducing native plants. Our study takes a step towards this objective by analyzing subsets (functional groups) of species in the context of network structure and pollinator composition, but more intentional studies of functional traits could identify crucial trends in pollination that might illuminate patterns in different habitats.
In conclusion, the decline of a keystone floral resource reduces the plant-pollinator network’s resistance to perturbations in the short-term and has implications for the long-term functioning and diversity of the plant-pollinator community. The role of individual species should be assessed to predict how the overall network will be affected, which can inform the introduction of native plants (Dixon, 2009; Menz et al., 2011; de Souza et al., 2021; Glenny et al., 2023). For instance, at Ship Canal native plants that provide similar resources to A. syriaca and have a similar - if not earlier - temporal niche could bridge gaps across the flowering season. The application of network ecology to conservation and restoration should assess functional traits and temporal niches to further contextualize network interactions. Network ecology is a potent tool to evaluate pollination in the context of managing rare species and overall habitat restoration; as the methods are increasingly streamlined, a network framework can help prioritize how to best restore pollination through active restoration. Focusing on plant-pollinator interactions and functional roles is a valuable strategy to implement successful restorations that result in more resilient plant-pollinator communities in the face of unmanipulated declines of keystone plant species.
Data availability statement
The raw data supporting the conclusions of this article will be made available by the authors, without undue reservation.
Author contributions
KH, PV, and DS conceived and designed the research and collected data. DS, TK, and PC led the data analysis and visualization of the results. DS led the writing of the manuscript. All authors contributed to the article and approved the submitted version.
Funding
Funding for this research was provided by Door County Land Trust to KH. Additional funding was provided by the Botanical Club of Wisconsin through the John Thomson 2021 Graduate Student Research Award and the Plant Biology and Conservation MS Student Travel Award through Northwestern University to DS.
Acknowledgments
We are grateful for support for this work from the Botanical Club of Wisconsin and Northwestern University to DS and the Door County Land Trust to KH. We thank Door County Land Trust for land access and supporting the ongoing restoration at Ship Canal Nature Preserve. We thank Elena Motivans-Švara and Leana Zoller, both of whom shared R code to help create the species strength figure and to calculate interaction turnover, respectively. We also thank Michael Kaster and Rina Talaba for their assistance with conducting pollinator observations.
Conflict of interest
The authors declare that the research was conducted in the absence of any commercial or financial relationships that could be construed as a potential conflict of interest.
Publisher’s note
All claims expressed in this article are solely those of the authors and do not necessarily represent those of their affiliated organizations, or those of the publisher, the editors and the reviewers. Any product that may be evaluated in this article, or claim that may be made by its manufacturer, is not guaranteed or endorsed by the publisher.
Supplementary material
The Supplementary Material for this article can be found online at: https://www.frontiersin.org/articles/10.3389/fcosc.2023.1183976/full#supplementary-material
References
Ştefan V., Knight T. M. (2020). R package for bootstrapping indices of ecological networks (Zenodo).
Adler L. S., Irwin R. E. (2006). Comparison of pollen transfer dynamics by multiple floral visitors: experiments with pollen and fluorescent dye. Ann. Bot. 97, 141–150. doi: 10.1093/aob/mcj012
Almeida-Neto M., Guimarães P., Guimarães P. R. Jr., Loyola R. D., Ulrich W. (2008). A consistent metric for nestedness analysis in ecological systems: reconciling concept and measurement. Oikos 117, 1227–1239. doi: 10.1111/j.0030-1299.2008.16644.x
Almeida-Neto M., Ulrich W. (2011). A straightforward computational approach for measuring nestedness using quantitative matrices. Environ. Model. Software 26, 173–178. doi: 10.1016/j.envsoft.2010.08.003
Anderson S. H., Kelly D., Ladley J. J., Molloy S., Terry J. (2011). Cascading effects of bird functional extinction reduce pollination and plant density. Science 331, 1068–1071. doi: 10.1126/science.1199092
Bain J. A., Dickson R. G., Gruver A. M., CaraDonna P. J. (2022). Removing flowers of a generalist plant changes pollinator visitation, composition, and interaction network structure. Ecosphere 13, e4154. doi: 10.1002/ecs2.4154
Bascompte J., Stouffer D. B. (2009). The assembly and disassembly of ecological networks. Philos. Trans. R. Soc. B: Biol. Sci. 364, 1781–1787. doi: 10.1098/rstb.2008.0226
Baskett C. A., Emery S. M., Rudgers J. A. (2011). Pollinator visits to threatened species are restored following invasive plant removal. Int. J. Plant Sci. 172, 411–422. doi: 10.1086/658182
Batra S. W. T. (1984). Solitary bees. Sci. Am. 250, 120–127. doi: 10.1038/scientificamerican0284-120
Bergamo P. J., Traveset A., Lázaro A. (2021). Pollinator-mediated indirect effects on plant fecundity revealed by network indices. Am. Nat. 198, 734–749. doi: 10.1086/716896
Biella P., Akter A., Ollerton J., Nielsen A., Klecka J. (2020). An empirical attack tolerance test alters the structure and species richness of plant–pollinator networks. Funct. Ecol. 34, 2246–2258. doi: 10.1111/1365-2435.13642
Biella P., Ollerton J., Barcella M., Assini S. (2017). Network analysis of phenological units to detect important species in plant-pollinator assemblages: can it inform conservation strategies? Community Ecol. 18, 1–10. doi: 10.1556/168.2017.18.1.1
Bischoff M., Campbell D. R., Lord J. M., Robertson A. W. (2013). The relative importance of solitary bees and syrphid flies as pollinators of two outcrossing plant species in the new Zealand alpine. Austral Ecol. 38, 169–176. doi: 10.1111/j.1442-9993.2012.02389.x
Blüthgen N. (2010). Why network analysis is often disconnected from community ecology: a critique and an ecologist’s guide. Basic Appl. Ecol. 11, 185–195. doi: 10.1016/j.baae.2010.01.001
Blüthgen N., Fründ J., Vázquez D. P., Menzel F. (2008). What do interaction network metrics tell us about specialization and biological traits. Ecology 89, 3387–3399. doi: 10.1890/07-2121.1
Blüthgen N., Klein A.-M. (2011). Functional complementarity and specialisation: the role of biodiversity in plant–pollinator interactions. Basic Appl. Ecol. 12, 282–291. doi: 10.1016/j.baae.2010.11.001
Brosi B. J., Briggs H. M. (2013). Single pollinator species losses reduce floral fidelity and plant reproductive function. Proc. Natl. Acad. Sci. 110, 13044–13048. doi: 10.1073/pnas.1307438110
Brosi B. J., Niezgoda K., Briggs H. M. (2017). Experimental species removals impact the architecture of pollination networks. Biol. Lett. 13, 20170243. doi: 10.1098/rsbl.2017.0243
Burkle L. A., Marlin J. C., Knight T. M. (2013). Plant-pollinator interactions over 120 years: loss of species, Co-occurrence, and function. Science 339, 1611–1615. doi: 10.1126/science.1232728
Byers D. L. (2017). Studying plant–pollinator interactions in a changing climate: a review of approaches. Appl. Plant Sci. 5, 1700012. doi: 10.3732/apps.1700012
Campbell C., Yang S., Shea K., Albert R. (2012). Topology of plant-pollinator networks that are vulnerable to collapse from species extinction. Phys. Rev. E 86, 021924. doi: 10.1103/PhysRevE.86.021924
CaraDonna P. J., Burkle L. A., Schwarz B., Resasco J., Knight T. M., Benadi G., et al. (2021). Seeing through the static: the temporal dimension of plant–animal mutualistic interactions. Ecol. Lett. 24, 149–161. doi: 10.1111/ele.13623
CaraDonna P. J., Petry W. K., Brennan R. M., Cunningham J. L., Bronstein J. L., Waser N. M., et al. (2017). Interaction rewiring and the rapid turnover of plant–pollinator networks. Ecol. Lett. 20, 385–394. doi: 10.1111/ele.12740
Carvalheiro L. G., Biesmeijer J. C., Benadi G., Fründ J., Stang M., Bartomeus I., et al. (2014). The potential for indirect effects between co-flowering plants via shared pollinators depends on resource abundance, accessibility and relatedness. Ecol. Lett. 17, 1389–1399. doi: 10.1111/ele.12342
Chadde S. W. (2013). Wisconsin Flora: an illustrated guide to the vascular plants of Wisconsin (CreateSpace Independent Publishing Platform).
Colwell R., Dunn R., Harris N. (2012). Coextinction and persistence of dependent species in a changing world. Annu. Rev. Ecol. Evol. System. 43, 183–203. doi: 10.1146/annurev-ecolsys-110411-160304
Cowles H. C. (1899). The ecological relations of the vegetation on the sand dunes of lake michigan. part i.-geographical relations of the dune floras. Bot. Gazette 27, 95–117. doi: 10.1086/327796
Cullen N., Xia J., Wei N., Kaczorowski R., Arceo-Gómez G., O’Neill E., et al. (2021). Diversity and composition of pollen loads carried by pollinators are primarily driven by insect traits, not floral community characteristics. Oecologia 196, 131–143. doi: 10.1007/s00442-021-04911-0
Cunningham-Minnick M. J., Peters V. E., Crist T. O. (2020). Bee communities and pollination services in adjacent crop fields following flower removal in an invasive forest shrub. Ecol. Appl. 30, e02078. doi: 10.1002/eap.2078
de Souza J. M. T., Vázquez D. P., Varassin I. G. (2021). Abundance and phenology drive plant–pollinator network responses to restoration in the southern Atlantic rainforest in Brazil. Restor. Ecol. 30 (5), e13588. doi: 10.1111/rec.13588
Dormann C. F., Fründ J., Blüthgen N., Gruber B. (2009). Indices, graphs and null models: analyzing bipartite ecological networks. Open Ecol. J. 2, 7–24. doi: 10.2174/1874213000902010007
Dormann C. F., Gruber B., Fründ J. (2008). Introducing the bipartite package: analysing ecological networks, Vol. 8. 4.
Dunne J. A., Williams R. J., Martinez N. D. (2002). Food-web structure and network theory: the role of connectance and size. Proc. Natl. Acad. Sci. 99, 12917–12922. doi: 10.1073/pnas.192407699
Elle E., Elwell S. L., Gielens G. A. (2012). The use of pollination networks in conservation. Botany 90, 525–534. doi: 10.1139/b11-111
Fant J. B., Havens K., Keller J. M., Radosavljevic A., Yates E. D. (2014). The influence of contemporary and historic landscape features on the genetic structure of the sand dune endemic, cirsium pitcheri (Asteraceae). Heredity 112, 519–530. doi: 10.1038/hdy.2013.134
Fiedler A. K., Landis D. A., Arduser M. (2012). Rapid shift in pollinator communities following invasive species removal. Restor. Ecol., 20 (5), 593–602. doi: 10.1111/j.1526-100X.2011.00820.x
Fitzgerald J. L., Ogilvie J. E., CaraDonna P. J. (2022). Ecological drivers and consequences of bumble bee body size variation. Environ. Entomol. 51, 1055–1068. doi: 10.1093/ee/nvac093
Földesi R., Howlett B. G., Grass I., Batáry P. (2021). Larger pollinators deposit more pollen on stigmas across multiple plant species–a meta-analysis. J. Appl. Ecol. 58, 699–707. doi: 10.1111/1365-2664.13798
Fründ J. (2021). Dissimilarity of species interaction networks: how to partition rewiring and species turnover components. Ecosphere 12, e03653. doi: 10.1002/ecs2.3653
Garibaldi L. A., Steffan-Dewenter I., Winfree R., Aizen M. A., Bommarco R., Cunningham S. A., et al. (2013). Wild pollinators enhance fruit set of crops regardless of honey bee abundance. Science 339, 1608–1611. doi: 10.1126/science.1230200
Gathmann A., Tscharntke T. (2002). Foraging ranges of solitary bees. J. Anim. Ecol. 71, 757–764. doi: 10.1046/j.1365-2656.2002.00641.x
Glenny W., Runyon J. B., Burkle L. A. (2023). Plant selection for pollinator restoration in seminatural ecosystems. Front. Ecol. Environ. 21 (3). doi: 10.1002/fee.2595
Goldingay R. L., Kelly P. A., Williams D. F. (1997). The kangaroo rats of California: endemism and conservation of keystone species. Pacific Conserv. Biol. 3, 47–60. doi: 10.1071/PC970047
Goldstein J., Zych M. (2016). What if we lose a hub? experimental testing of pollination network resilience to removal of keystone floral resources. Arthropod-Plant Interact. 10, 263–271. doi: 10.1007/s11829-016-9431-2
Grüter C., Hayes L. (2022). Sociality is a key driver of foraging ranges in bees. Curr. Biol. 32, 5390–5397.e3. doi: 10.1016/j.cub.2022.10.064
Hamzé S. I., Jolls C. L. (2000). Germination ecology of a federally threatened endemic thistle, cirsium pitcheri, of the great lakes. Am. Midland Nat. 143, 141–153. doi: 10.1674/0003-0031(2000)143[0141:GEOAFT]2.0.CO;2
Havens K., Jolls C. L., Marik J. E., Vitt P., McEachern A. K., Kind D. (2012). Effects of a non-native biocontrol weevil, larinus planus, and other emerging threats on populations of the federally threatened pitcher’s thistle, cirsium pitcheri. Biol. Conserv. 155, 202–211. doi: 10.1016/j.biocon.2012.06.010
Herrera C. M. (1987). Components of pollinator “Quality”: comparative analysis of a diverse insect assemblage. Oikos 50, 79–90. doi: 10.2307/3565403
Hunter A. F., Aarssen L. W. (1988). Plants helping plants. BioScience 38, 34–40. doi: 10.2307/1310644
Inkster J. N. (2016). THE ANTAGONISTIC AND MUTUALISTIC PLANT-INSECT INTERACTIONS OF PITCHER’S THISTLE (CIRSIUM PITCHERI [TORR. EX EAT.] TORR. & a. GRAY, ASTERACEAE), a FEDERALLY THREATENED GREAT LAKES DUNE AND COBBLE SHORE ENDEMIC PLANT. East Carolina University.
Jenkins M. B., Schoettle A. W., Wright J. W., Anderson K. A., Fortier J., Hoang L., et al. (2022). Restoring a forest keystone species: a plan for the restoration of whitebark pine (Pinus albicaulis engelm.) in the crown of the continent ecosystem. For. Ecol. Manage. 522, 120282. doi: 10.1016/j.foreco.2022.120282
Jolls C. L., Inkster J. N., Scholtens B. G., Vitt P., Havens K. (2019). An endemic plant and the plant-insect visitor network of a dune ecosystem. Global Ecol. Conserv. 18, e00603. doi: 10.1016/j.gecco.2019.e00603
Kaiser-Bunbury C. N., Blüthgen N. (2015). Integrating network ecology with applied conservation: a synthesis and guide to implementation. AoB Plants 7, plv076. doi: 10.1093/aobpla/plv076
Kaiser-Bunbury C. N., Muff S., Memmott J., Müller C. B., Caflisch A. (2010). The robustness of pollination networks to the loss of species and interactions: a quantitative approach incorporating pollinator behaviour. Ecol. Lett. 13, 442–452. doi: 10.1111/j.1461-0248.2009.01437.x
Kay K. M., Sargent R. D. (2009). The role of animal pollination in plant speciation: integrating ecology, geography, and genetics. Annu. Rev. Ecol. Evol. System. 40, 637–656. doi: 10.1146/annurev.ecolsys.110308.120310
Klotz S., Kühn I., Durka W. (2002). BIOLFLOR – eine datenbank zu biologisch- ökologischen merkmalen der gefäßpflanzen in deutschland. Schriftenreihe für Vegetationskunde 38.
Kremen C., Williams N. M., Aizen M. A., Gemmill-Herren B., LeBuhn G., Minckley R., et al. (2007). Pollination and other ecosystem services produced by mobile organisms: a conceptual framework for the effects of land-use change. Ecol. Lett. 10, 299–314. doi: 10.1111/j.1461-0248.2007.01018.x
Kühsel S., Blüthgen N. (2015). High diversity stabilizes the thermal resilience of pollinator communities in intensively managed grasslands. Nat. Commun. 6, 7989. doi: 10.1038/ncomms8989
Machado I. C., Sazima M. (2008). Pollination and breeding system of melochia tomentosa l. (Malvaceae), a keystone floral resource in the Brazilian caatinga. Flora - Morphol. Distrib. Funct. Ecol. Plants 203, 484–490. doi: 10.1016/j.flora.2007.09.003
Marshall J. M.. (2017). Insect visitors of Cirsium pitcheri, a threatened and endemicdune species, in relation to annual weather variation.
Marshall S. A. (2017). Insects: their natural history and diversity: with a photographic guide to insects of Eastern north America, revised and updated. 2nd ed. (Buffalo, NY: Firefly Books).
Martins K. T., Gonzalez A., Lechowicz M. J. (2015). Pollination services are mediated by bee functional diversity and landscape context. Agricult. Ecosyst. Environ. 200, 12–20. doi: 10.1016/j.agee.2014.10.018
Maun M. (1998). Adaptations of plants to burial in coastal sand dunes. Can. J. Bot. 76, 713–738. doi: 10.1139/b98-058
Maun M. A., Elberling H., D’Ulisse A. (1996). The effects of burial by sand on survival and growth of pitcher’s thistle (Cirsium pitcheri) along lake Huron. J. Coast. Conserv. 2, 3–12. doi: 10.1007/BF02743032
McEachern A. K. (1992). Disturbance dynamics of pitcher’s thistle (Cirsium pitcheri) populations in great lakes sand dune landscapes. The University of Wisconsin - Madison ProQuest Dissertations Publishing.
Memmott J., Waser N. M., Price M. V. (2004). Tolerance of pollination networks to species extinctions. Proc. R. Soc. London. Ser. B: Biol. Sci. 271, 2605–2611. doi: 10.1098/rspb.2004.2909
Menz M. H. M., Phillips R. D., Winfree R., Kremen C., Aizen M. A., Johnson S. D., et al. (2011). Reconnecting plants and pollinators: challenges in the restoration of pollination mutualisms. Trends Plant Sci. 16, 4–12. doi: 10.1016/j.tplants.2010.09.006
Miller T. E. (2015). Effects of disturbance on vegetation by sand accretion and erosion across coastal dune habitats on a barrier island. AoB Plants 7, plv003. doi: 10.1093/aobpla/plv003
Mills L. S., Soulé M. E., Doak D. F. (1993). The keystone-species concept in ecology and conservation. BioScience 43, 219–224. doi: 10.2307/1312122
Motivans Švara E., Ştefan V., Sossai E., Feldmann R., Aguilon D. J., Bontsutsnaja A., et al. (2021). Effects of different types of low-intensity management on plant pollinator interactions in Estonian grasslands. Ecol. Evol. 11, 16909–16926. doi: 10.1002/ece3.8325
Ne’eman G., Shavit O., Shaltiel L., Shmida A. (2006). Foraging by Male and female solitary bees with implications for pollination. J. Insect Behav. 19, 383–401. doi: 10.1007/s10905-006-9030-7
Page M. L., Nicholson C. C., Brennan R. M., Britzman A. T., Greer J., Hemberger J., et al. (2021). A meta-analysis of single visit pollination effectiveness comparing honeybees and other floral visitors. Am. J. Bot. 108, 2196–2207. doi: 10.1002/ajb2.1764
Parra-Tabla V., Arceo-Gómez G. (2021). Impacts of plant invasions in native plant pollinator networks. New Phytol. 230, 2117–2128. doi: 10.1111/nph.17339
Pauw A. (2007). Collapse of a pollination web in small conservation areas. Ecology 88, 1759–1769. doi: 10.1890/06-1383.1
Piraino S., Fanelli G., Boero F. (2002). Variability of species’ roles in marine communities: change of paradigms for conservation priorities. Mar. Biol. 140, 1067–1074. doi: 10.1007/s00227-001-0769-2
Poisot T., Canard E., Mouillot D., Mouquet N., Gravel D. (2012). The dissimilarity of species interaction networks. Ecol. Lett. 15, 1353–1361. doi: 10.1111/ele.12002
Power M. E., Tilman D., Estes J. A., Menge B. A., Bond W. J., Mills L. S., et al. (1996). Challenges in the quest for keystones. BioScience 46, 609–620. doi: 10.2307/1312990
Pradal C., Olesen J. M., Wiuf C. (2009). Temporal development and collapse of an Arctic plant-pollinator network. BMC Ecol. 9, 24. doi: 10.1186/1472-6785-9-24
R Core Team (2021). R: a language and environment for statistical computing (Vienna, Austria: R Foundation for Statistical Computing).
Rodger J. G., Bennett J. M., Razanajatovo M., Knight T. M., van Kleunen M., Ashman T.-L., et al. (2021). Widespread vulnerability of flowering plant seed production to pollinator declines. Sci. Adv. 7, eabd3524. doi: 10.1126/sciadv.abd3524
Steffan-Dewenter I., Tscharntke T. (1999). Effects of habitat isolation on pollinator communities and seed set. Oecologia 121, 432–440. doi: 10.1007/s004420050949
Thébault E., Fontaine C. (2010). Stability of ecological communities and the architecture of mutualistic and trophic networks. Science 329, 853–856. doi: 10.1126/science.1188321
Traveset A., Castro-Urgal R., Rotllàn-Puig X., Lázaro A. (2018). Effects of habitat loss on the plant–flower visitor network structure of a dune community. Oikos 127, 45–55. doi: 10.1111/oik.04154
Tylianakis J. M., Laliberté E., Nielsen A., Bascompte J. (2010). Conservation of species interaction networks. Biol. Conserv. 143, 2270–2279. doi: 10.1016/j.biocon.2009.12.004
VanDyk J. (2021). BugGuide.Net: identification, images, & information for insects, spiders & their kin for the united states & Canada (Iowa State University).
Vitt P., Havens K., Jolls C. L., Knight T. M. (2020). Temporal variation in the roles of exotic and native plant species in plant–pollinator networks. Ecosphere 11, e02981. doi: 10.1002/ecs2.2981
Weiner C. N., Werner M., Linsenmair K. E., Blüthgen N. (2014). Land-use impacts on plant–pollinator networks: interaction strength and specialization predict pollinator declines. Ecology 95, 466–474. doi: 10.1890/13-0436.1
Willmer P. G., Cunnold H., Ballantyne G. (2017). Insights from measuring pollen deposition: quantifying the pre-eminence of bees as flower visitors and effective pollinators. Arthropod-Plant Interact. 11, 411–425. doi: 10.1007/s11829-017-9528-2
Yurk B., Hansen E. (2021). Effects of wind patterns and changing wind velocities on aeolian drift potential along the lake Michigan shore. J. Great Lakes Res. 47, 1504 1517. doi: 10.1016/j.jglr.2021.09.006
Keywords: Cirsium pitcheri, plant-pollinator network, species interactions, habitat loss, species decline, keystone species
Citation: Sandacz D, Vitt P, Knight TM, CaraDonna P and Havens K (2023) The effects of the decline of a keystone plant species on a dune community plant-pollinator network. Front. Conserv. Sci. 4:1183976. doi: 10.3389/fcosc.2023.1183976
Received: 10 March 2023; Accepted: 25 May 2023;
Published: 07 June 2023.
Edited by:
David W. Inouye, College Park, United StatesReviewed by:
Matthew E. Aiello-Lammens, Pace University, United StatesJuan Carlos López-Acosta, Universidad Veracruzana, Mexico
Copyright © 2023 Sandacz, Vitt, Knight, CaraDonna and Havens. This is an open-access article distributed under the terms of the Creative Commons Attribution License (CC BY). The use, distribution or reproduction in other forums is permitted, provided the original author(s) and the copyright owner(s) are credited and that the original publication in this journal is cited, in accordance with accepted academic practice. No use, distribution or reproduction is permitted which does not comply with these terms.
*Correspondence: Dan Sandacz, ZHNhbmRhY3pAbGNmcGQub3Jn