 Pablo Christian Escobar-Flores
 Yoann Ladroit
 Richard Lyell O’Driscoll
- National Institute of Water and Atmospheric Research, Wellington, New Zealand
Micronekton are a key component of the pelagic food web of the Chatham Rise east of New Zealand. The Chatham Rise is an important fishing area for hoki (Macruronus novaezelandiae), New Zealand’s largest finfish fishery, and a predator on mesopelagic fish. Four fisheries oceanographic voyages provided multi-frequency acoustic data (18, 38, 70, 120, and 200 kHz) and midwater trawls, which were used to define a classification tree to separate micronektonic organisms. We carried out validation and sensitivity analyses that showed that we were able to classify pearlside (Maurolicus australis) and euphausiids. Other mesopelagic targets (mainly myctophids) were classified together based on their acoustic frequency response. Using scripting in the open-source software ESP3, we applied our classification tree to an independent time series of acoustic data from trawl surveys on the Chatham Rise between 2009 and 2018, that was not used for model development or validation. Our methodology allowed us to study temporal and spatial patterns of M. australis, euphausiids, and total backscatter in the water column. Total backscatter associated with micronekton has varied over the last 10 years, with no clear trend. The abundance of euphausiids showed a significant decreasing trend over the last 10 years. Abundance of M. australis also decreased since 2012, though this was not significant. This work contributes to on-going efforts to monitor and detect changes in the pelagic ecosystems.
Introduction
The Chatham Rise is a submarine ridge that extends approximately 1500 km east of the South Island of New Zealand and has a total area of around 160,000 km2 (Nodder et al., 2012). This region is highly productive and it is characterized by a stable oceanographic feature where warm subtropical and cold subantarctic waters meet to form the Subtropical Convergence Zone (Heath, 1985; Murphy et al., 2001; Sutton, 2001).
The Chatham Rise sustains a large biodiversity and biomass of benthic, demersal, and pelagic organisms (Koubbi et al., 2011; O’Driscoll et al., 2011b; Nodder et al., 2012; Gauthier et al., 2014). The ridge also provides nursery grounds for hoki (Macruronus novaezelandiae), target of New Zealand’s largest finfish fishery. Hoki make up about 30% of the wild catch of New Zealand (MacDiarmid et al., 2013; Pinkerton, 2014). In addition to food provision, the marine ecosystem of the Chatham Rise provides directly or indirectly ecosystem services to New Zealand through climate regulation, carbon sequestration, and nutrient cycling (MacDiarmid et al., 2013). These ecosystem services, defined broadly as the benefits received by humans from natural habitats (Costanza et al., 1997; Boyd and Banzhaf, 2007), stress the relevance of the Chatham Rise for New Zealand, beyond the ecological and economical aspects.
Relatively small (∼2–20 cm) pelagic organisms inhabiting open-ocean pelagic ecosystems are collectively termed as micronekton. This group includes fish, squid, crustaceans, siphonophores, and gelatinous organisms most of which are capable of swimming. The Chatham Rise has a high diversity of mesopelagic fish. To date, more than 120 species of mesopelagic fish have been described from this region, belonging mainly to the orders Myctophiformes, Stomiiformes, Argentiniformes, and Aulopiformes (Roberts et al., 2015). Lanternfishes (Myctophidae) and the sternoptychid Maurolicus australis (Sternoptychidae) are commonly collected in the mid-water trawls and dominate the biomass of mesopelagic fish on the Chatham Rise (Robertson et al., 1978; McClatchie and Dunford, 2003; O’Driscoll et al., 2009; Gauthier et al., 2014; Escobar-Flores et al., 2018). Usually under-represented in trawl catches due to their small size (i.e., Peña et al., 2014), the bristlemouth Cyclothone spp. (Gonostomatidae), regarded as the most numerically abundant oceanic vertebrate globally (Gjøsaeter and Kawaguchi, 1980), is also likely to be an important component of the micronekton on the Chatham Rise.
Over the last 5 years, studies on micronekton have become more common in the literature. The demand for information reflects the need for understanding the ecological role of these organisms in the biochemical cycles and biological pump (e.g., carbon export and oxygen consumption) (Radchenko, 2007; Robinson et al., 2010; Davison et al., 2013; Irigoien et al., 2014; Proud et al., 2017). Micronekton mediate the energy transfer between lower and higher trophic levels (i.e., Lehodey et al., 2010), playing a key role in oceanic marine ecosystems due to their large, though still largely uncertain, biomass (Gjøsaeter and Kawaguchi, 1980; Lam and Pauly, 2005; Irigoien et al., 2014). Despite their crucial ecological functions and contribution to the ecosystem services that sustain New Zealand’s marine finfish wild harvesting (MacDiarmid et al., 2013), the biology and ecology of micronekton in New Zealand waters is still poorly understood.
On the Chatham Rise mesopelagic fish are an important prey item of commercial and non-commercial species. Several species of myctophids and M. australis are common prey items for hoki at different life stages (Connell et al., 2010). Other organisms known to predate on mesopelagic fish on the Chatham Rise are the arrow squid (Nototodarus sloanii) and the New Zealand fur seal (Arctocephalus forsteri) (Dunn, 2009; Boren, 2010; Allum and Maddigan, 2012).
To inform management of the hoki fishery, trawl surveys have been carried out on the Chatham Rise annually since 1992 until 2014 and biennially since, with the most recent survey in 2018. The main objective of the surveys is to measure the abundance of both juvenile and adult hoki, and other commercially exploited species. The Chatham Rise trawl survey is the most consistent and comprehensive time series of middle depth species abundance in the fisheries science in New Zealand’s Economic Exclusive Zone (EEZ) (O’Driscoll et al., 2011b). In parallel to the trawl survey, acoustic data have been collected routinely since 1995 (except in 2004). Multi-frequency (18, 38, 70, 120, and 200 kHz) data are available since 2008 when a new suite of EK60 echosounders was installed on R/V Tangaroa. Acoustic data have been used to describe acoustic mark classes, to provide estimates of the ratio of acoustic to trawl vulnerability for hoki and other species (O’Driscoll, 2003), and to estimate abundance of mesopelagic fish (e.g., O’Driscoll et al., 2009, 2011a).
Between 2008 and 2015, four multidisciplinary fisheries oceanography research voyages have taken place on the Chatham Rise, all including acoustic data collection and opportunistic midwater trawling on schools and scattering layers associated with micronekton (e.g., Kloser et al., 2009). Some of this information was used by Gauthier et al. (2014) to develop classification trees for the mesopelagic marks (schools and layers) into groups of species using acoustic data and environmental variables; and by Escobar-Flores et al. (2018) to characterize the species composition of the mid-trophic levels in oceanic waters east of New Zealand.
Using acoustic backscatter as proxy for mesopelagic fish abundance, studies by O’Driscoll et al. (2009) and Stevens et al. (2018) have suggested that the abundance of the mesopelagic fish around on the Chatham Rise has remained reasonably stable over the last 10 years. Despite this relative stability, there is no information about changes in the micronekton community composition within this period. In some ecosystems, it has been observed that the two main grazers of zooplankton of the Southern Ocean, Antarctic krill (Euphausia superba) and salps, show marked interannual variability on their abundance, and an inverse trend in biomass (krill decreasing) (Atkinson et al., 2004; Smetacek and Nicol, 2005; Murphy et al., 2007). Similar multi-decadal variability or regime shifts have been described for anchovy and sardine stocks in the coastal ecosystem (see review by Checkley et al., 2017). The fluctuation of these stocks, often asynchronously, before the industrialization of fishing has been associated with changes in climate that altered physical, biological, and chemical conditions (Checkley et al., 2017). Despite the broad fluctuation of their populations, the landings of both species together off Peru remain reasonably stable (Chavez et al., 2003). Consequently, relative stability of the abundance of combined biomass of the micronekton community on the Chatham Rise does not necessarily imply that its species composition is stable.
In this paper, our objectives were to revise the existing classification tree generated by Gauthier et al. (2014) for mesopelagic fish, and to develop a semi-automated methodology to apply the resulting model to a 10-year-time series of acoustic data from the Chatham Rise. This allowed us to assess spatio-temporal patterns in micronekton over a 10-year period between 2009 and 2018. School detection and classification were implemented through an automated process using open-source acoustic post-processing software ESP3 (Ladroit, 2017).
Materials and Methods
To better understand the food-web structure of the Chatham Rise ecosystem and the functions of its different components, the New Zealand government through the Ministry of Business, Innovation and Employment (MBIE), funded four multi-disciplinary fisheries oceanography voyages to the Chatham Rise between 2008 and 2015. One of the objectives of these multidisciplinary voyages was to collect information on the distribution and abundance of mid-trophic level functional groups (e.g., mesopelagic fish), using active acoustics and perform species’ identification trawls (“mark ID trawls”) on the acoustic targets. Data were collected from research vessel (RV) Tangaroa in May–June 2008, November 2011, August 2015, and December 2015 (voyage codes TAN0806, TAN1116, TAN1511, and TAN1516).
For developing the classification tree model, we used all the acoustic recordings from target (mark ID) trawls, where the catch was dominated by the number or weight by one species. Our classification tree was built using the acoustic descriptors derived from multi-frequency data, vertical distribution of school and layers (i.e., minimum and maximum depth), and bottom depth. For model validation we used acoustic files from mark ID trawls where the classified species were present but were not necessarily dominant. Finally, we applied our models on the acoustic data of the Chatham Rise trawl survey time series from 2009 to 2018, to assess the temporal and spatial variability of the micronektonic community composition in the area.
Acoustic Data
Dataset for Model Development and Validation
The R/V Tangaroa is equipped with a hull-mounted multi-frequency system that operates five frequencies (18, 38, 70, 120, and 200 kHz) using Simrad split-beam EK60 echosounders. The transceiver settings used during the research voyages and other important information are provided in Supplementary Table 1.
Calibrations to the multi-frequency system on board R/V Tangaroa were carried on a regular basis, following procedures of Demer et al. (2015) using a 38.1-mm tungsten carbide sphere. Calibrations used this research are shown in Supplementary Table 2.
Because all the mark ID trawls were carried out during day time, the training acoustic data were also restricted to this period, reducing any potential changes in the scattering properties due to diel vertical migrations (e.g., Godø et al., 2009). Although acoustic data were collected down to 1000 m and mark ID trawls were carried down to 800 m, we restricted the analyses to the top 500 m due to low number of deep mark ID tows, as well as the range limitation of the high frequencies (i.e., 70, 120, and 200 kHz) due to sound absorption.
The acoustic data collected during the hoki trawl surveys carried out annually in January between 2009 and biannually since 2014 (total of eight surveys) was used to apply our classification tree model and study the temporal and spatial variability of the micronekton community on the Chatham Rise. We only used data collected during trawling, referred to here to as “acoustic recordings.” We estimated the sunrise and sunset times for 3rd and 30th day of January on the Chatham Rise, using the sunriset function of the R package “maptools” (Bivand and Lewin-Koh, 2015), and used these times to restrict the acoustic dataset to day time files only. A 1.5-h threshold was applied from the sunset/sunrise times to avoid any effect of diel vertical migration on the results.
Biological Sampling
Biological information on species composition was collected with a fine mesh mid-water trawl net, with a 10 mm cod-end mesh, a headline height of 12–15 m, and a door spread of around 140–160 m. This mid-water gear is similar to the International Young Gadoid Pelagic Trawl (IYGPT). Mark ID trawls were carried out during the day time and had variable duration (10–40 min). During the mark ID trawl, the net was towed at the depth of the scattering layer of interest at speeds of 3–4 knots. The total number of mark ID trawls was 73 (Figure 1). Details of all trawls are provided in Supplementary Table 3.
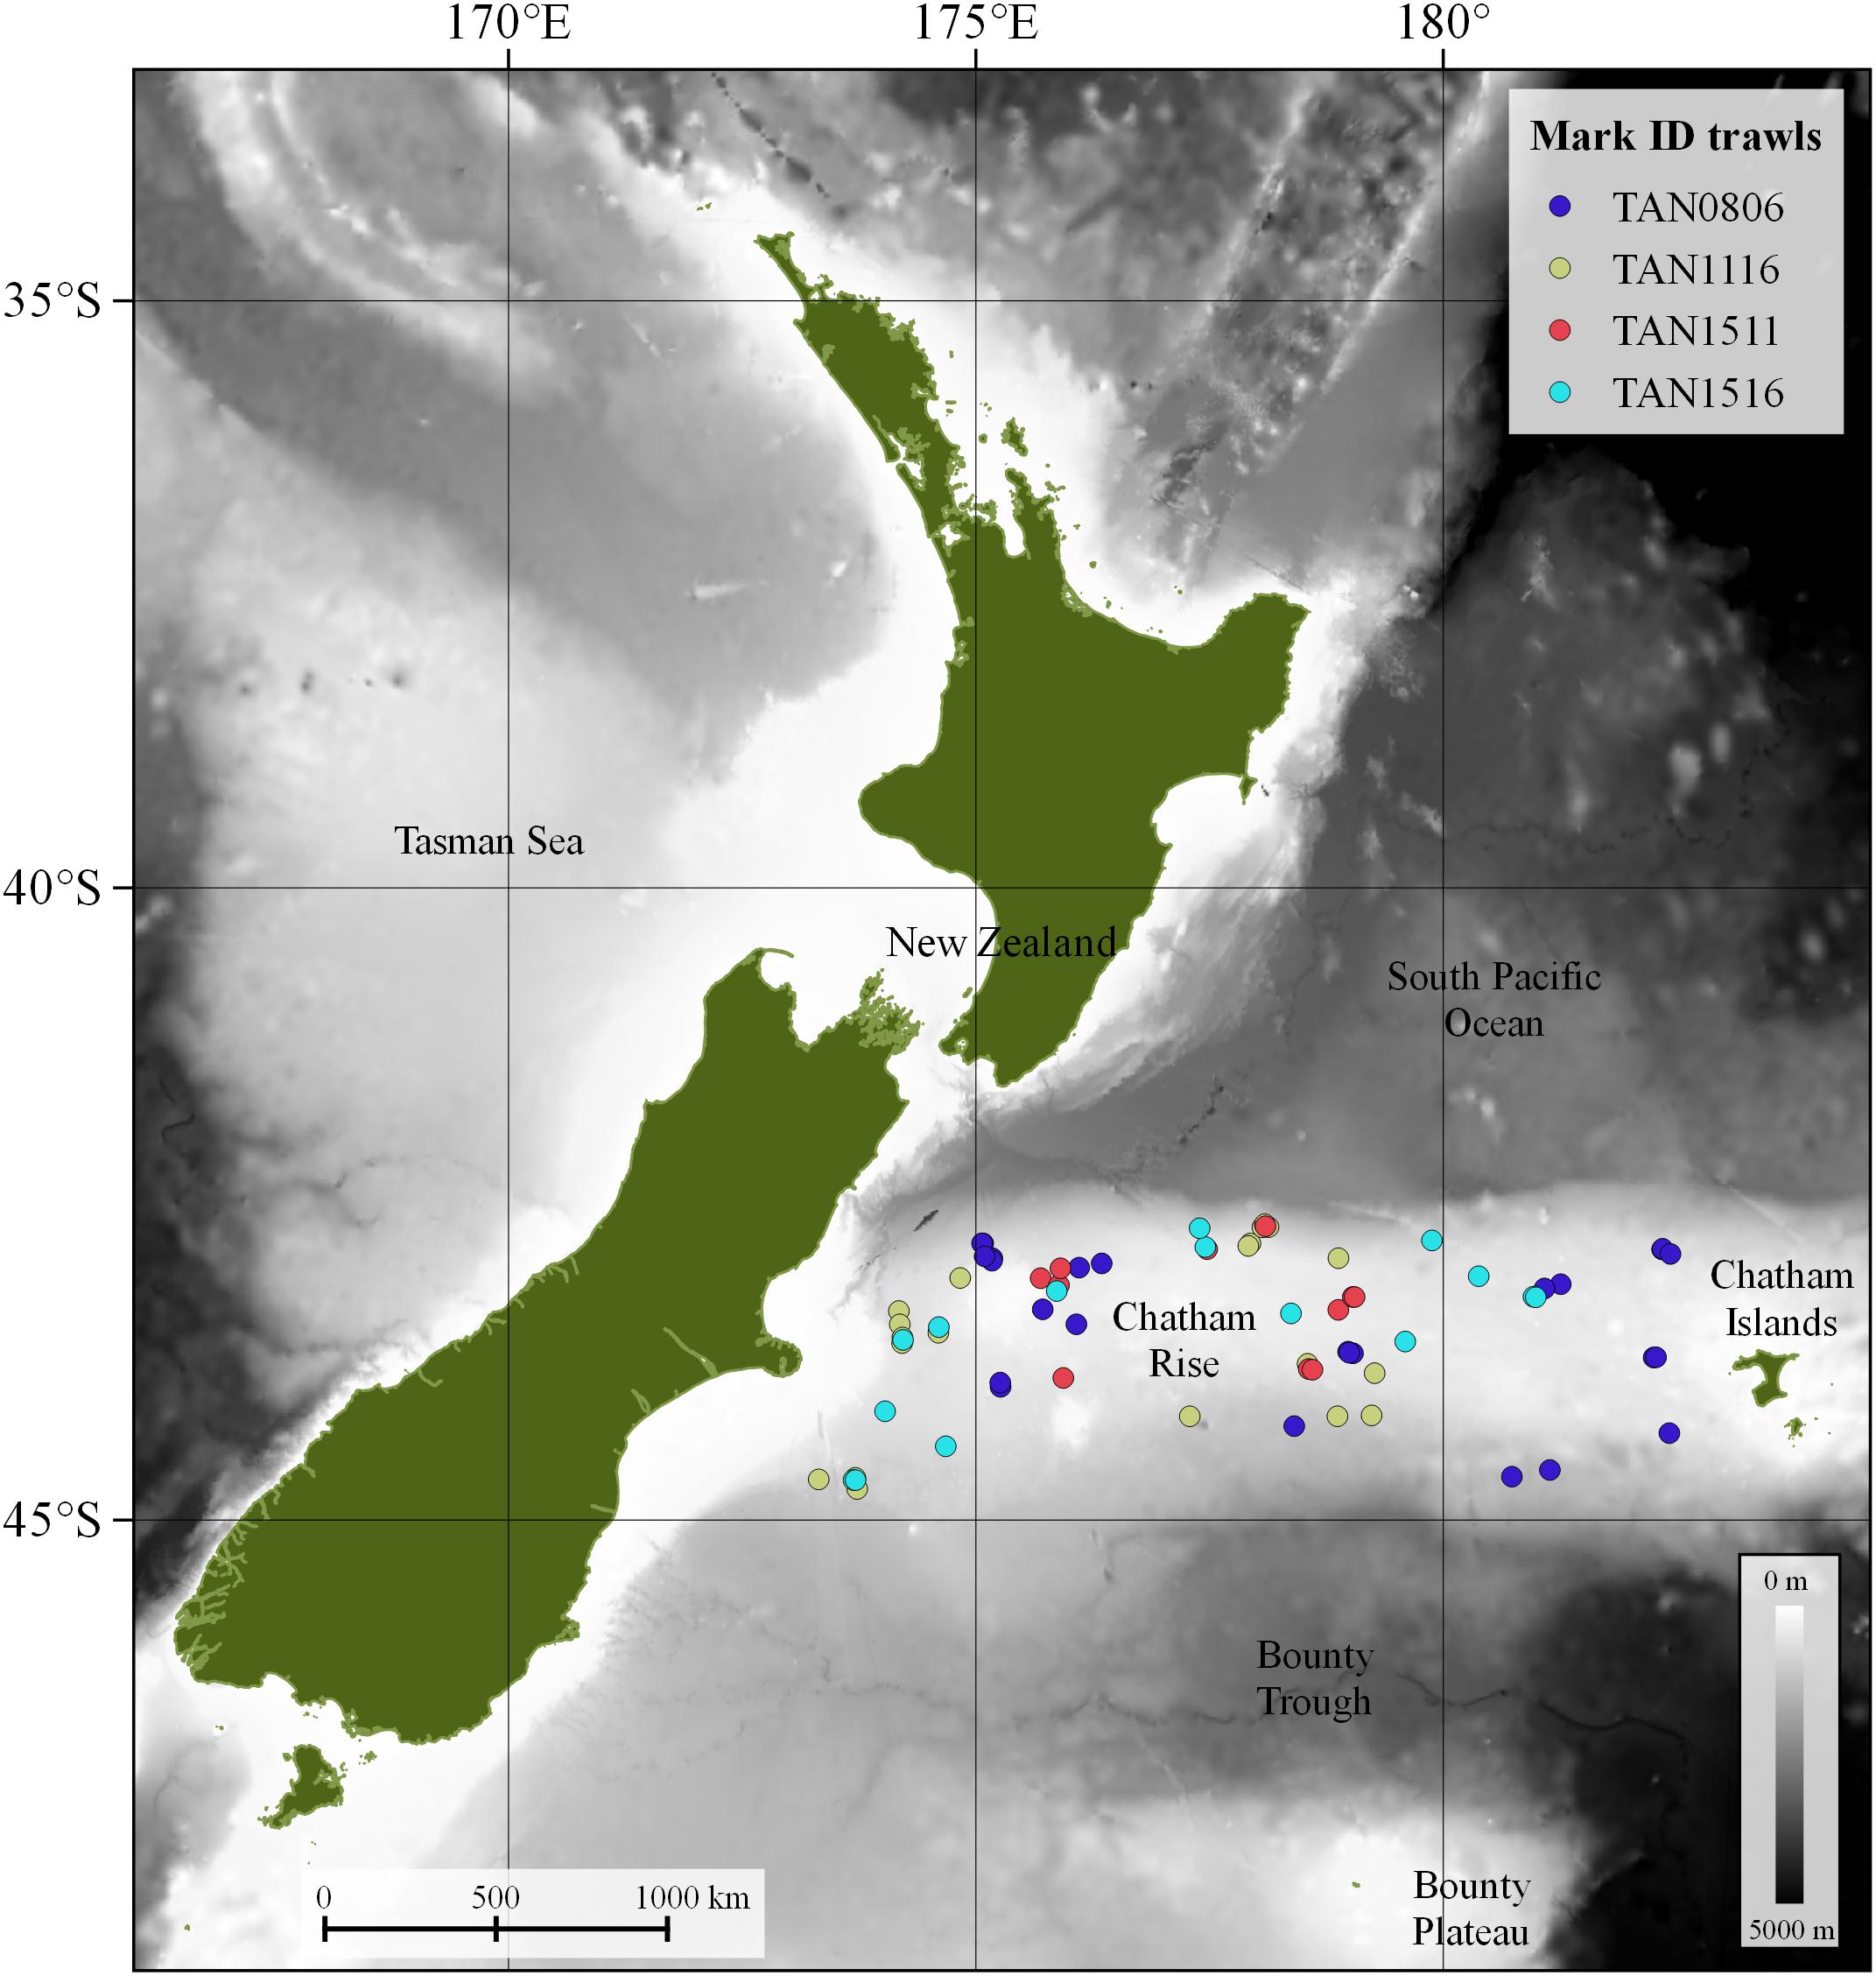
Figure 1. Mark identification (mark ID) trawls (n = 73) carried out in four multi-disciplinary fisheries oceanography voyages on the Chatham Rise by research vessel (R/V) Tangaroa in May–June 2008 (TAN0806), November 2011 (TAN1116), August 2015 (TAN1511), and December 2015 (TAN1516).
An RBR temperature and depth sensor logger1 was attached to the mid-water trawl and this information was used to match the trawl path with the acoustic data (once corrected for offset of the trawl behind the vessel). The temperature information collected by the RBR was also used to estimate the sound speed and frequency-dependent absorption coefficient (Doonan et al., 2003).
After each mark ID trawl the catch was sorted and, where possible, identified to species or family on board the RV Tangaroa. The total sample of each species was weighed on Marel motion-compensating electronic scales accurate to about 0.1 kg, and the total catch calculated on the trawl coordinator system available on the vessel. An approximately random sample of up to 100 individuals of each species of fish in successful mark ID trawl was measured using digital measuring boards, accurate to about 1 mm.
Mark ID trawls believed to have effectively sampled targeted acoustic marks observed on the echograms, and whose catch was largely dominated by of one species, were used for creating (training) our classification tree. Here we refer to acoustic marks as schools and semi- and continuous layers observed on echograms produced from the echosounder measurements. We have therefore assumed that the species composition of the trawls was representative of the targeted aggregations. Mark ID trawls that did not provide compelling evidence for classifying acoustic marks (i.e., trawl path was off the targeted mark, and catch species composition was not dominated by one species) were not used for training, but were included for model validation.
Ethics Statement
All fish used in this research were collected by a mid-water research trawl under special permit for the New Zealand Ministry for Primary Industries. Special permits were granted under Section 97 of the Fisheries Act 1996 to authorize taking aquatic life for the purpose of investigative research. Special permits by research voyage: Ministry of Fisheries Special Permit 421 (Voyage TAN0806), Ministry of Fisheries Special Permit 505 (Voyage TAN1116), and Ministry of Fisheries Special Permit 597 (Voyages TAN1511 and TAN1516). There were no ethical considerations under this special permit. No fish were CITES listed.
Acoustic Data Processing
All the acoustic analyses were done using ESP3, an open-source software developed at NIWA (https://sourceforge.net/projects/esp3/), for visualizing and processing active acoustics data. The data processing was divided into four stages: (1) scrutinization; (2) school detection; (3) classification; and (4) echo-integration.
Scrutinization
We applied two of the built-in algorithms in ESP3, for bottom detection and signal attenuation (bad transmits detection), and the background noise removal algorithm developed by De Robertis and Higginbottom (2007) for reducing the effect of signal degradation.
Bottom detection and bad transmits algorithms used are described in the ESP3 documentation (version 0.9.11). The settings used on these algorithms (Supplementary Table 4) differed between the frequencies where the school detection was carried out (i.e., 38 and 120 kHz).
We used a 40% of bad transmits (“bad pings”) as a data quality metric, to exclude mark ID trawls where the accompanying acoustic files had poor data quality, trying to achieve a good trade-off between removing files with heavily attenuated data but preserving enough files to develop the classification model.
Following the automated application of the bottom definition and bad transmit algorithms, we carried out manual editing where needed (e.g., to exclude double bottom echoes, re-define bottom around abrupt changes in depth, and bad transmit detection on specific regions).
School Detection and Classification
To detect and classify schools and layers associated with micronekton organisms (referred to here as “marks”) in the mark ID trawls, we first imported RBR depth data collected during the trawls into ESP3 and matched it to the acoustic data using time. The RBR data allowed us to obtain an approximate location of the trawl path through the acoustic marks. Where RBR data were missing (n = 5), the mean depth of the trawl gear recorded using a Furuno CN22 depth sensor mounted in the headline of the trawl was used.
We used the ESP3 school detection algorithm based on Nero et al. (1990), Barange (1994), and Scalabrin et al. (1996), to detect and define marks within 20 m above and below the estimated trawl path at 38 kHz for mesopelagic fish and 120 kHz for euphausiids. Euphausiid marks detected at 120 kHz were copied across to the 38 kHz data on ESP3. Acoustic descriptors were extracted and exported from the 38 kHz data only. Echo-integration was done at 38 and 120 kHz to compare the contribution of the marks to the total backscatter in the files. The parameters used for school detection are provided in Supplementary Table 5. We then attributed a mark class (i.e., species) to the detected acoustic marks, using the information on the species composition from the trawl catch. We only used mark ID trawls where the catch was dominated in number or weight by one species of mesopelagic fish to classify marks into species, to minimize misclassification. Previous studies of mesopelagic fish on the Chatham Rise have established good baselines for understanding the characteristics of the aggregations these form, species distribution, and community composition (e.g., McClatchie and Dunford, 2003; Gauthier et al., 2014). Because of this previous experience we are confident that the dominant species in the catch of mark ID tows was also responsible for the marks observed at 38 kHz. Trawls where more than one species was present in the catch were not used in the training data. To assist our mark classification, we also compared the frequency response curves of marks distributed near the trawl path, and only classified marks with similar curves into the same class (Figure 2).
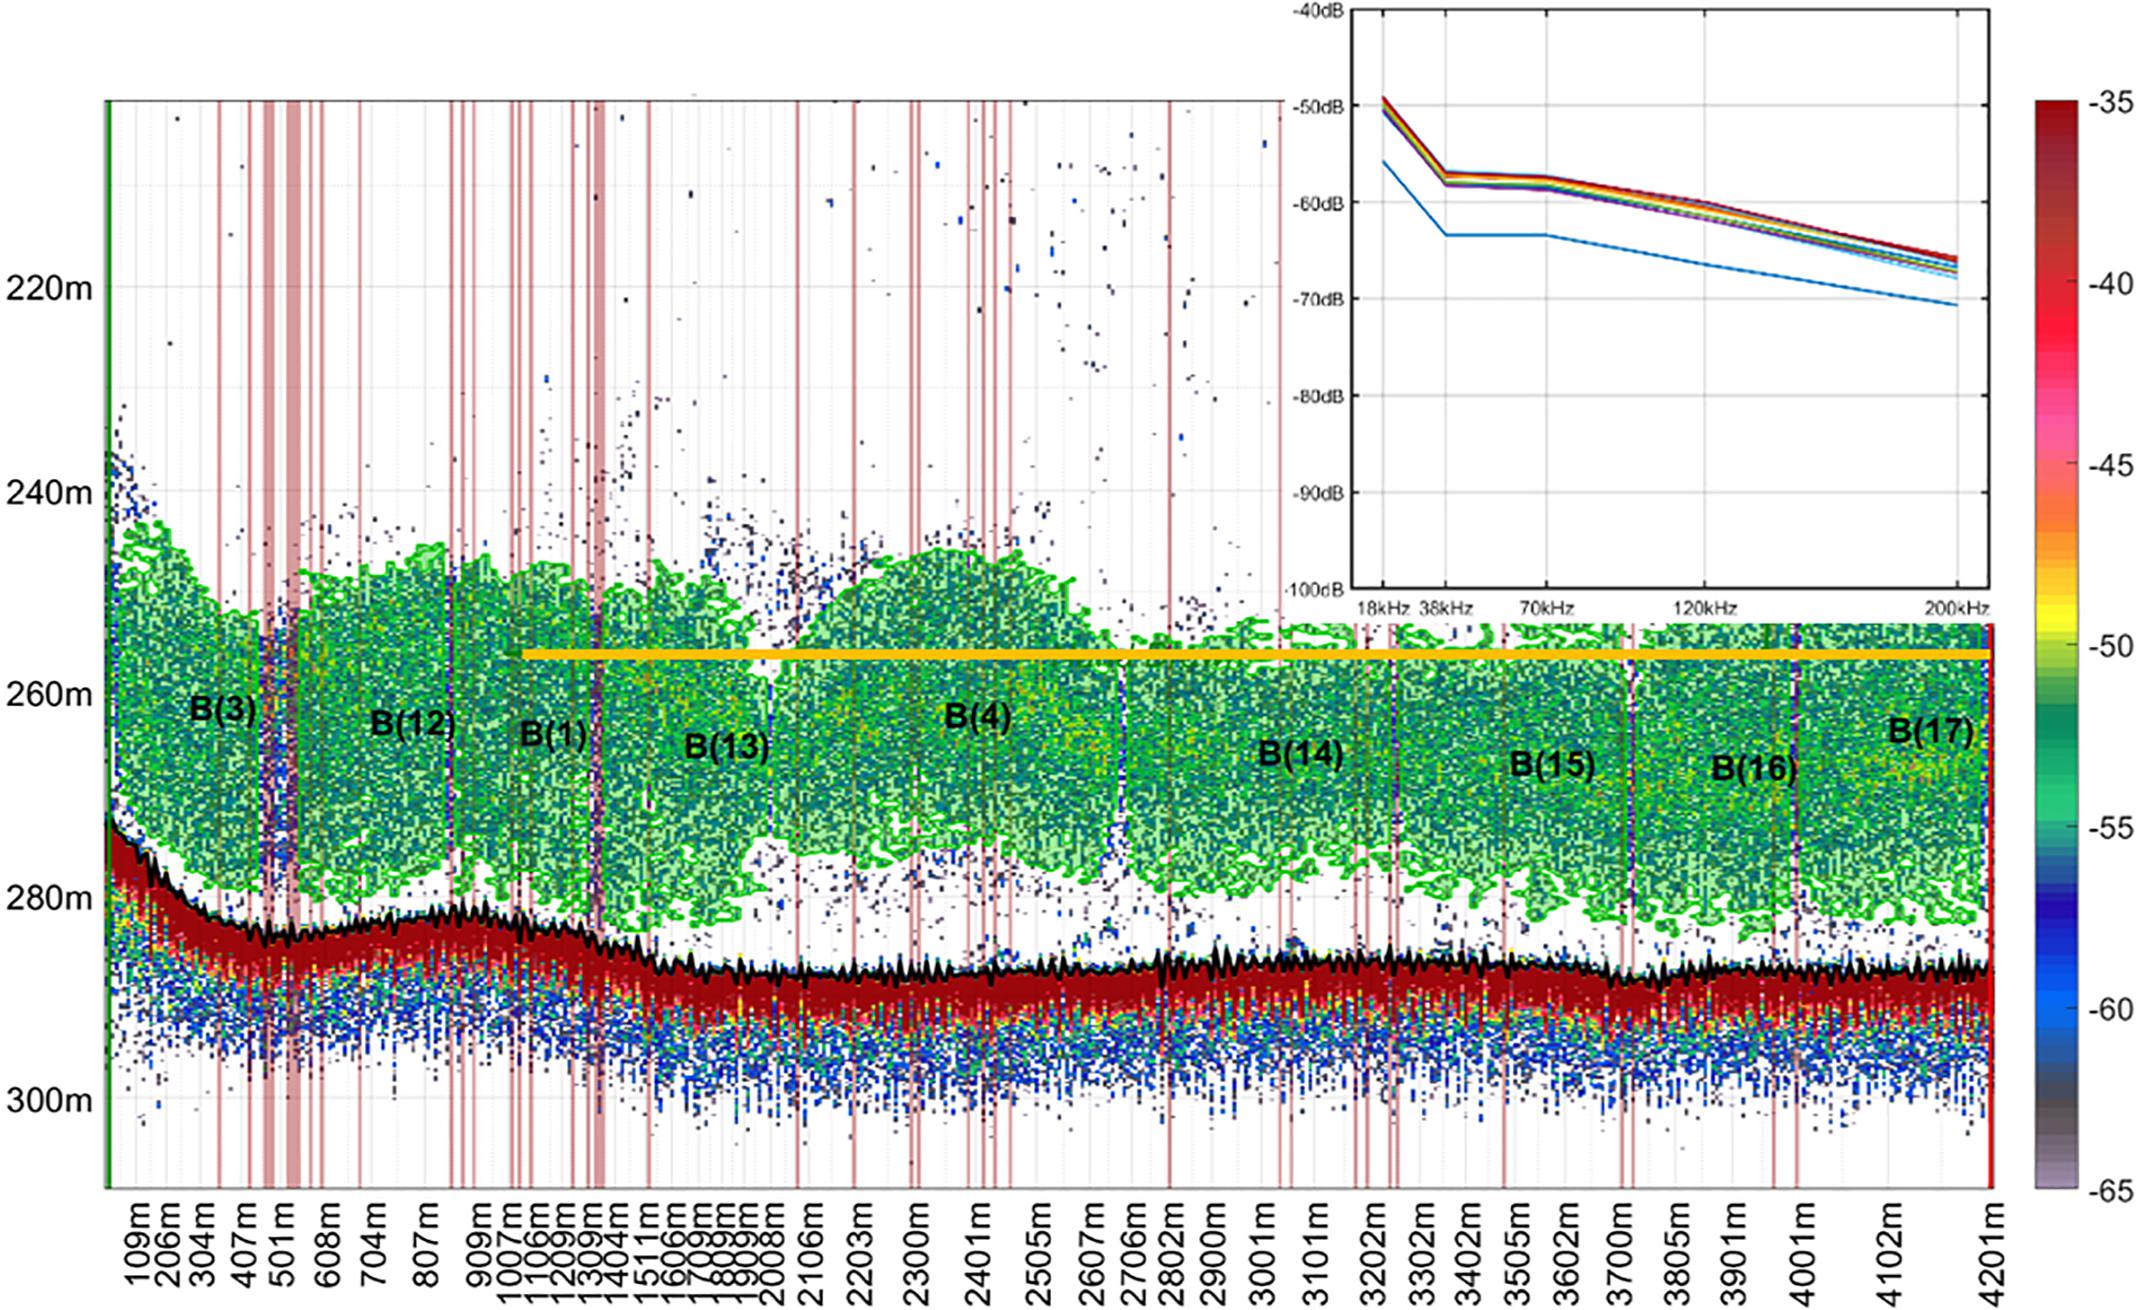
Figure 2. School detection and classification using information from catch composition and frequency response curves drawn from acoustic marks near the trawl path. Echogram corresponds to mark identification trawl 171, collected in voyage TAN1116. Catch composition was 98% Maurolicus australis (MMU). Each detected school has a label (“B”) and a unique identifier number. Yellow line indicates the mean depth of the trawl path. Echogram shows volume backscattering strength in decibels collected at 38 kHz. Sv threshold = –65 dB. Detected schools are shown in green.
For each acoustic mark detected we extracted the following region descriptors: length, perimeter, area, minimum and maximum depth, mean depth, mean bottom depth, volume backscattering strength (Sv) at each frequency, the standard deviation of Sv, and the cell per cell mean difference in decibels between each pair of frequencies (referred to here as dB difference).
Echo-Integration
Echo-integration was automated using xml scripts. These scripts contain metadata information (e.g., survey area, author, species, voyage name, etc.), echo-integration settings and parameters (i.e., absorption coefficients and sound speed, max. and min. depth, grid size, and threshold), algorithms to be applied as well as their settings (e.g., school detection, background noise removal, bad transmits, and bottom detection), full path of the classification tree to be applied, frequencies to load and files, and regions in the files to be echo-integrated and exported. In ESP3 acoustic data can be echo-integrated by region name (i.e., school) or region class (i.e., species name), allowing us to extract their morphometric descriptors and acoustic energy to develop the classification tree from the acoustic files collected during mark ID trawls. We also echo-integrated the backscatter of the top 500 m water column (WC) to estimate the total backscatter. Likewise, to explore any correlation between micronekton and the concentration of organisms in the top 50 m of the WC, we echo-integrated backscatter between 10 and 20, 20 and 50, and 10 and 50 m from the surface.
Classification Tree Model
Developed by Breiman et al. (1984), classification trees are a statistical method for homogenizing predictor variables using a series of binary recursive splits, into a series of categorical or nominal variables. Classification trees are commonly used in ecology because they are robust and flexible, and the graphical interpretation of their outputs is straightforward and intuitive. Likewise, these models can handle non-linear relationships, missing values, several orders of interactions between explanatory variables, and lack of balance on the data (De’ath and Fabricius, 2000). In the application of classification trees a priori relationships between the response and predictor variables are not assumed, so each explanatory variable is considered individually for creating splits onto subgroups or branches. Splits in the trees are applied to maximize deviance explained in the response variable.
We used classification trees to understand how the acoustic properties, morphometric parameters, and vertical distribution of acoustic marks differ between species of micronekton. This technique has already been used in fisheries acoustics for echo-trace classification, showing to be powerful for classifying species using multi-frequency data (e.g., Fernandes, 2009).
The mark class attribute (i.e., species) was defined as our response variable. For each of the acoustic marks we extracted a total of 28 region descriptors (or explanatory variables) (Table 1). To reduce the number of descriptors used to build our classification tree, we used the information provided by principal component analysis (PCA) (see below). We applied the classification trees in the statistical software R, using the package “rpart” (Therneau et al., 2015).
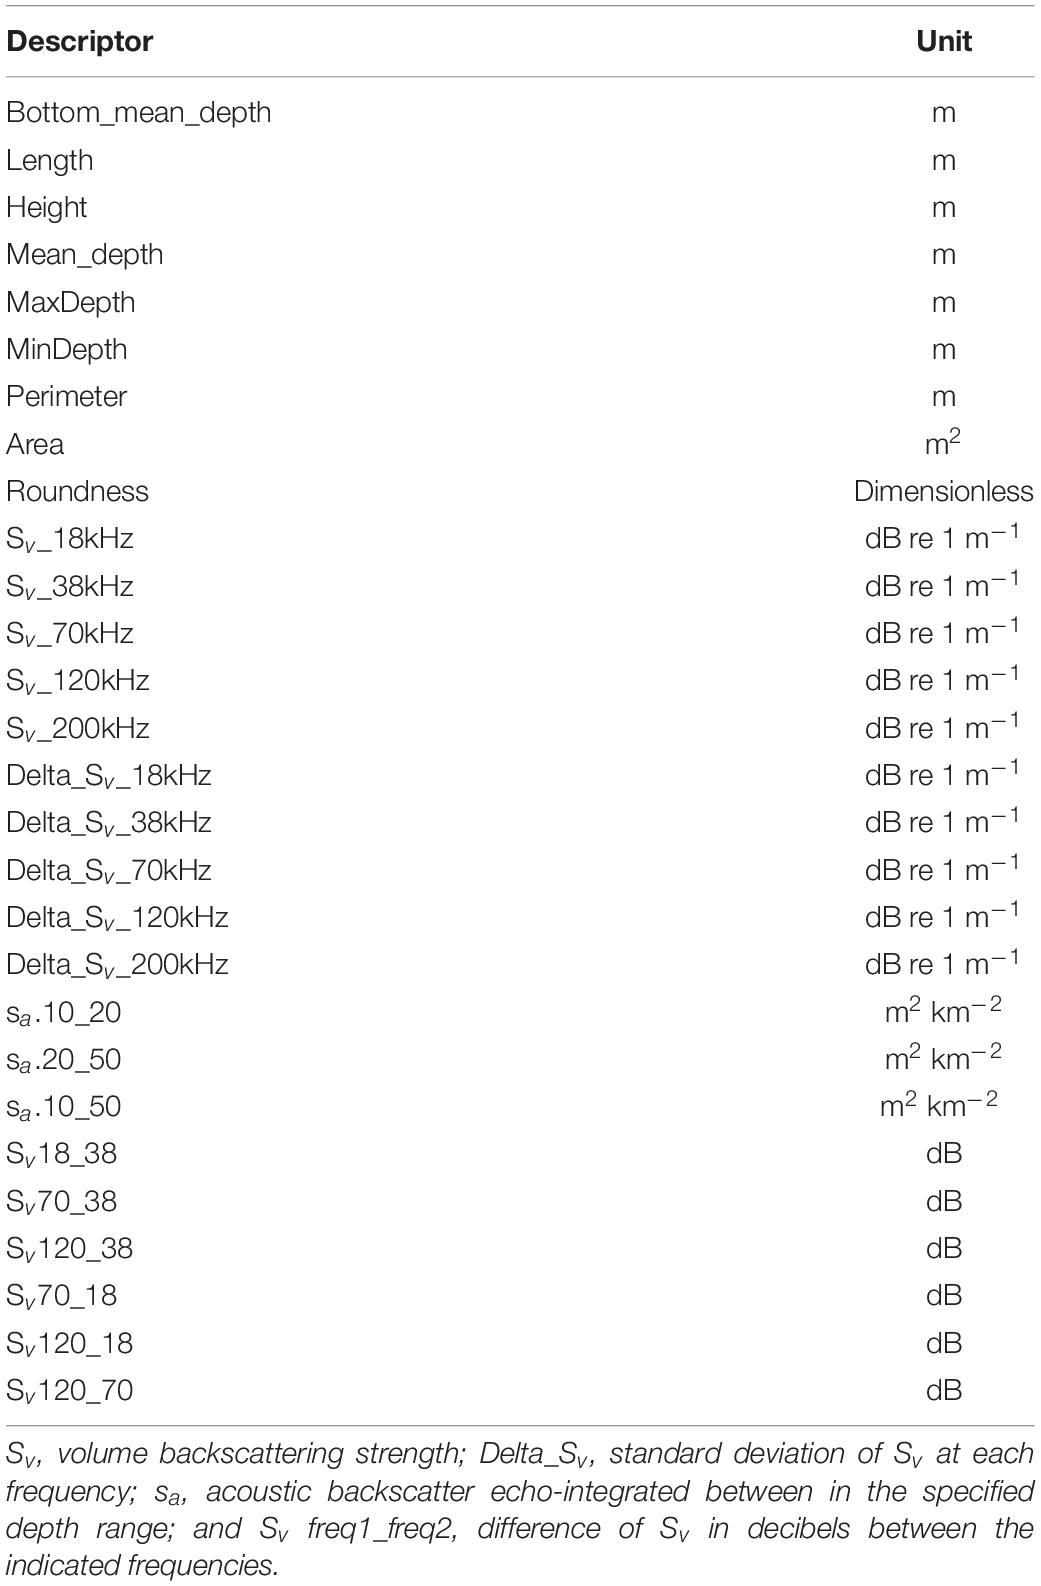
Table 1. Region descriptors extracted from detected acoustic marks for the principal component analysis and to develop the classification tree model.
Principal Component Analysis
Principal component analysis (Gauch, 1982) identifies variables which best describe the different acoustic mark classes, and therefore explain a large fraction of the observed variability. PCA was used to reduce the number of explanatory variables to build a parsimonious classification tree and avoid over-fitting. The PCA was based on a correlation matrix, so the explanatory variables were scaled (normalized) using their mean and standard deviation, which was then used to estimate the scores of the principal component (PC) and loadings. The PCs are defined in orthogonal directions where they find maximal variance in the data, so PC1 explains more variance than PC2 and so on. The amount of variation explained by a PC is expressed as the percentage of total variance.
Principal component analysis has been used in several acoustic studies to classify aggregations using energetic and morphometric descriptors, and assist the construction of classification trees (e.g., Nero et al., 1990; Gauthier et al., 2014). The PCAs were carried out using the PCA function of the R package “FactoMineR” (Lê et al., 2008).
Classification Tree
The terminal nodes or leaves of a tree represent the final classification, where all the response variables have been allocated into a mark class with an associated probability of occurrence. We chose a minimum probability of occurrence criterion of 0.8 for each terminal node. To avoid overfitting, we restricted the creation of splits by defining a minimum number of acoustic marks equals to 10 (default value) on a terminal node and used the prune function to snip the least important split of the tree using 10-fold cross-validation. The resulting classification model was then used to predict the presence of micronekton species on the validation dataset and in the time series of acoustic data from the hoki trawl survey (see below).
The final classification tree model was applied on the validation dataset and acoustic recording from the hoki trawl surveys using ESP3. A description of the implementation of classification tree models in ESP3 is provided in the Supplementary Material.
Validation of the Classification Tree Model
Mark ID trawls that were not used for developing the classification tree were used as the dataset for model validation. To assess the performance of the model, we estimated the positive true detection rate (i.e., presence of a mark class/species in the catch and its subsequent classification by the model). The acoustic data processing and model application followed the procedures described in the section “Acoustic Data Processing” (see above).
In the echograms of the training dataset, we detected and classified acoustic marks near the trawl path using manual selected regions, but the approach for school detection for model validation and application was to follow a fully automated approach. We used the validation dataset to test the model sensitivity to the different school detection parameters, and compared the model performance to find the optimal values. We used the positive true detection rate as an index for model performance.
The model validation was carried out on the 38 kHz data for the mesopelagic fish mark classes and on the 120 kHz data for euphausiids.
Application of the Classification Tree Model in the Hoki Trawl Survey Time Series
The classification tree was applied to daytime acoustic data collected in the hoki trawl survey time series from 2009 to 2018. For the model application in the trawl survey time series we used a more conservative quality control threshold to exclude data from the analysis (20% bad transmit), as this process was fully automated through scripting. The rest of the process followed the procedures described in the section “Acoustic Data Processing.”
Temporal changes of the micronekton community were assessed by comparing the backscatter of each mark class over time using the 38 and 120 kHz acoustic data as a relative index of abundance for mesopelagic fish and euphausiids, respectively. We also compared our estimates of micronekton at 38 kHz to those based on unclassified backscatter [Stevens et al. (2018) following O’Driscoll et al. (2009)] for the Chatham Rise. Changes in the spatial distribution of backscatter on the Chatham Rise were assessed by comparing the mean backscatter of each classified mark class in cells of 1° latitude by 1° longitude in 2018 with the average for each cell in the period 2009–2016. The spatial analysis was done using the R package “PBSmapping” (Schnute et al., 2017).
Results
Acoustic Dataset
Eight of the 73 available mark ID trawls were excluded from our study following the data quality criterion established (i.e., >40% bad transmits), leaving 65 for the analyses. Most of these 65 trawls caught a mix of species. Because we only used mark ID trawls where the catch was dominated by weight or number by one species or group for model training, the training dataset for mesopelagic fish at 38 kHz included only 15 trawls: 6 from TAN0802; 5 from TAN1116; 1 from TAN1511; and 3 from TAN1516. Because our final training dataset was small, we resampled scattering layers by defining several sections of scattering layers as individual acoustic marks. Although the definition of the acoustic marks was subjective, we aimed to capture some variability in the acoustic properties of the acoustic marks as the range of scattering layers and their thickness change (Figure 2). From these 15 trawls we extracted and exported acoustic descriptors from a total of 557 acoustic marks, which were assigned to five classes. Typically mark ID trawls targeted mesopelagic fish marks based on observations made on the echosounders at 18 or 38 kHz, at which euphausiids are weak sound scatters, therefore their presence in the catch was incidental. The training dataset for euphausiids was defined based on the catch composition of mark ID trawls, where we searched for euphausiids marks across the trawl path on the 120 kHz data, at which they are stronger sound scatterers. To aid our detection of euphausiid marks, we looked at their frequency response curves which provided further confirmation (Supplementary Figure 2). The training dataset used to classify acoustic marks of euphausiids at 120 kHz included 16 mark ID trawls: 8 from TAN0802; 1 from TAN1116; 1 from TAN1511; and 6 from TAN1516. A total of 145 acoustic marks of euphausiids were extracted.
The remaining 50 mark ID trawls which were not part of the 38 kHz training set became the model validation dataset, which was used to assess the performance of the model for classifying micronekton marks. Because 13 of these mark ID trawls were part of the training dataset for euphausiids at 120 kHz, we only analyzed the performance of the model for classifying euphausiids using the 120 kHz data from 37 mark ID trawls of the validation dataset. The use of the mark ID trawls for model training and validation is summarized in Supplementary Table 6.
Biological Sampling and Acoustic Mark Classification
Species of mesopelagic fish were the dominant by weight in the catch in more than half of the mark ID trawls (n = 65). The most common dominant species of mesopelagic fish were M. australis (n = 13), Lampanyctodes hectoris (n = 10), Diaphus danae (n = 3), and Symbolophorus boops (n = 3). Another 17 stations were dominated by weight by non-mesopelagic fish species, but their contribution in number was typically low (<1%) (Supplementary Table 7). The dominant non-mesopelagic fish species was Ray’s bream, Brama australis and/or B. brama (n = 13) and hoki, M. novaezelandiae (n = 2). Both these species are known to predate heavily on mesopelagic fish (e.g., Connell et al., 2010; Horn et al., 2013).
Whereas the catch composition of the mark ID trawls used in the training dataset for mesopelagic fish (38 kHz) was mostly dominated by one species (either weight or number or both), the catch composition of the training dataset for euphausiids (120 kHz) was rarely dominated by euphausiids (only mark ID trawl No. 19, collected in voyage TAN0802). Detailed descriptions of the dominant species in the training dataset for mesopelagic fish and euphausiids are given in Tables 2, 3, respectively. Biological information for the dominant species of the training dataset is given in Supplementary Table 8.
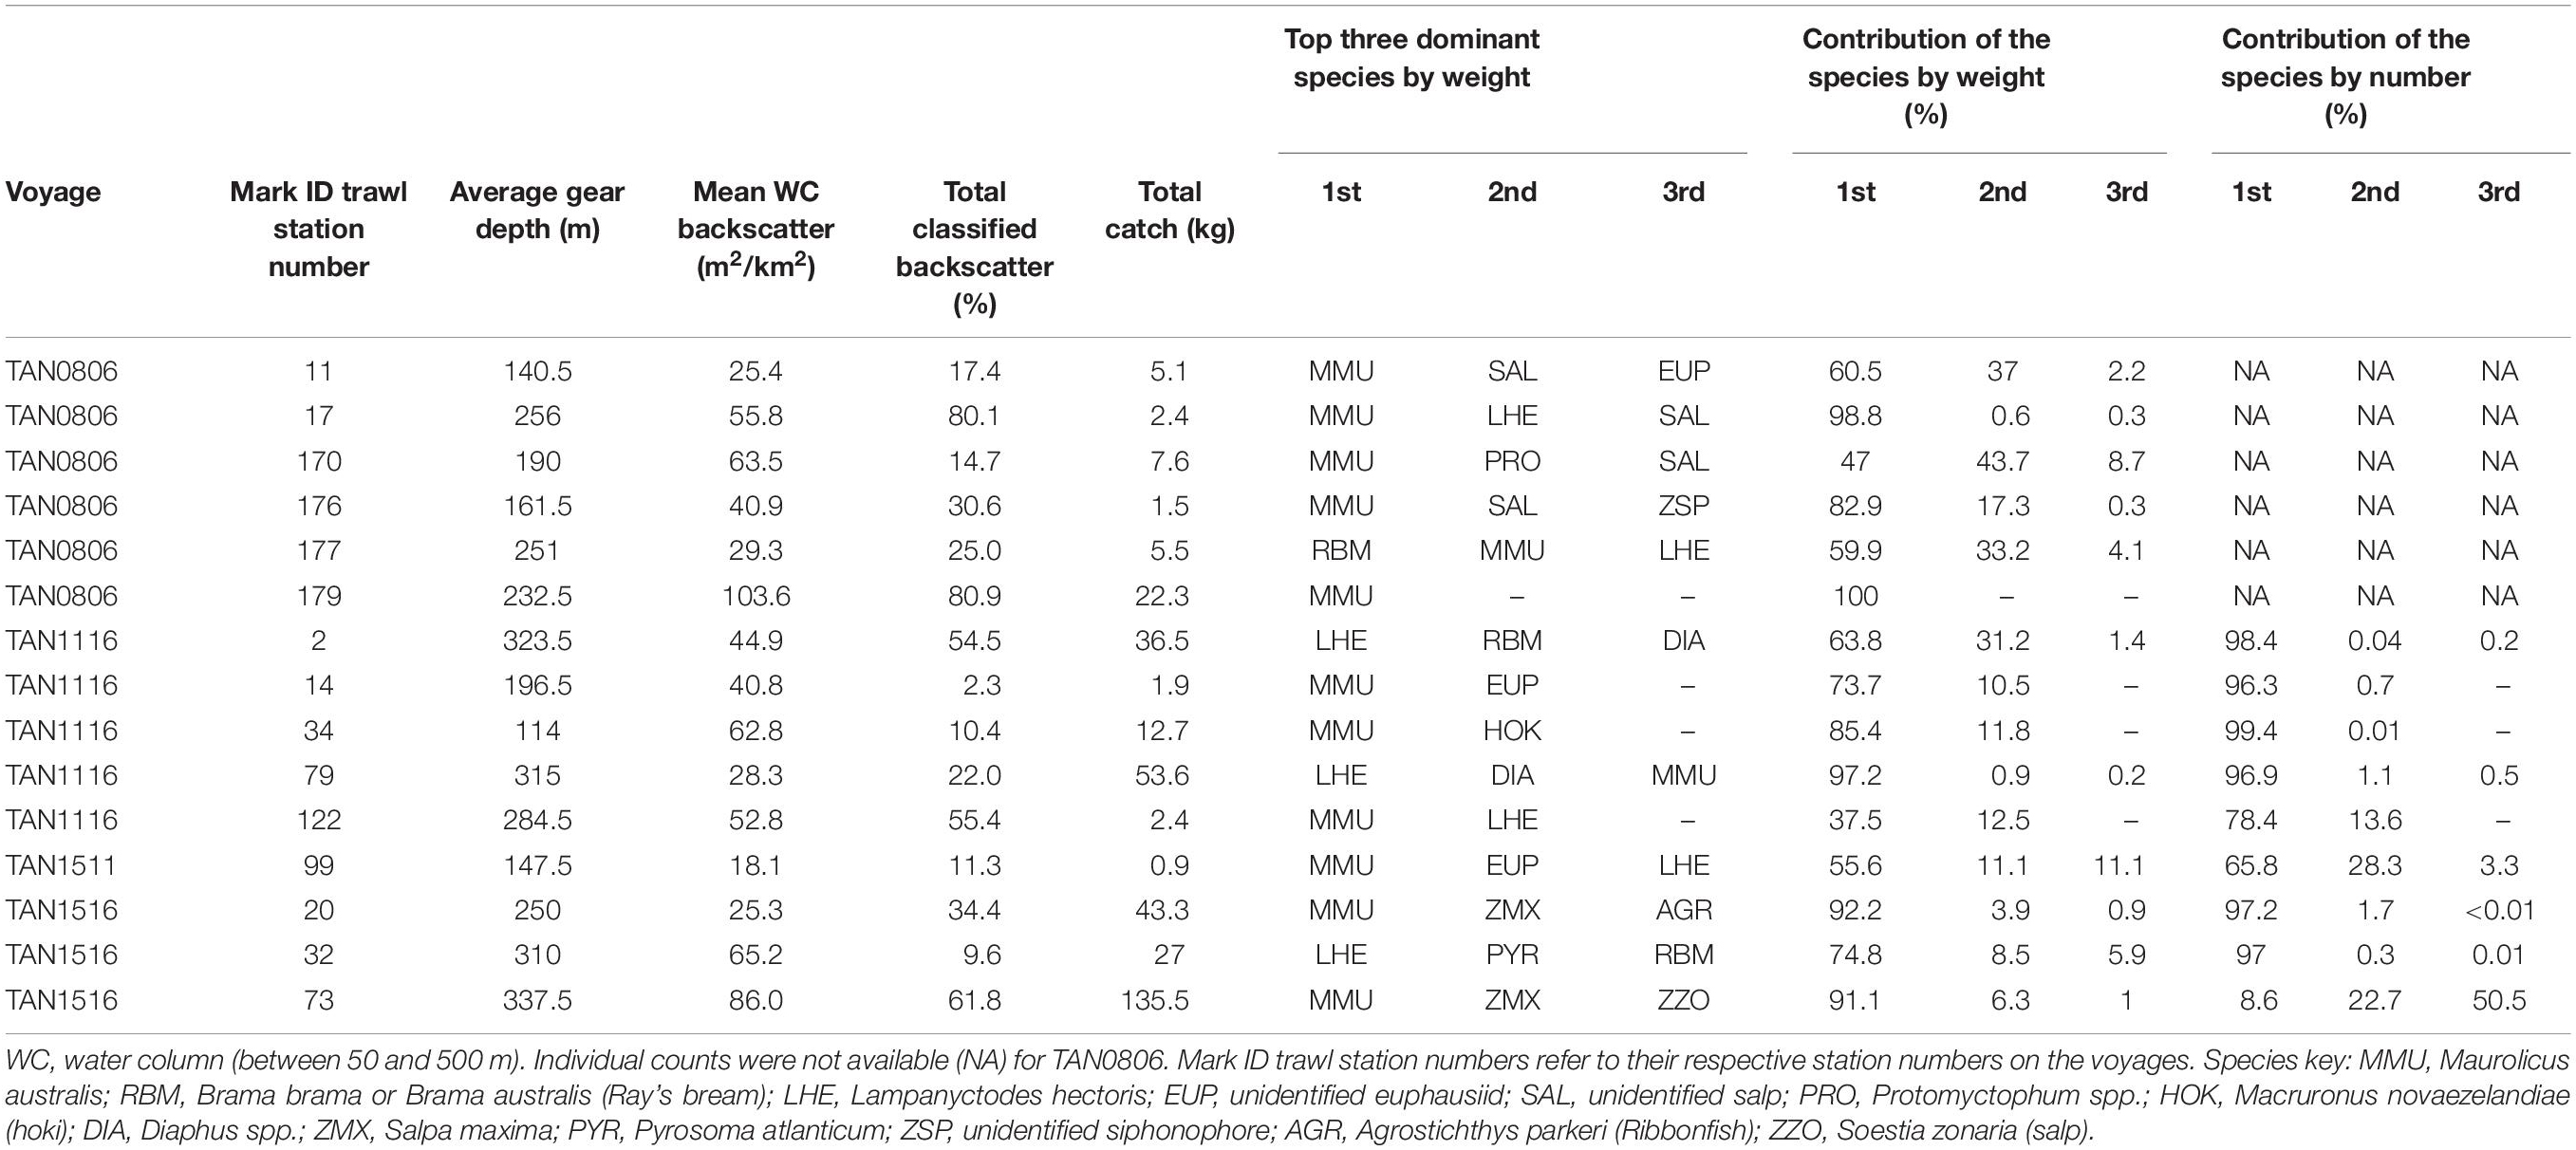
Table 2. Mark identification (mark ID) trawls of the training dataset used for classifying acoustic marks into five classes of mesopelagic fish at 38 kHz: MMU, LHE, U1, U2, and U3 (total number of mark ID trawls = 15).
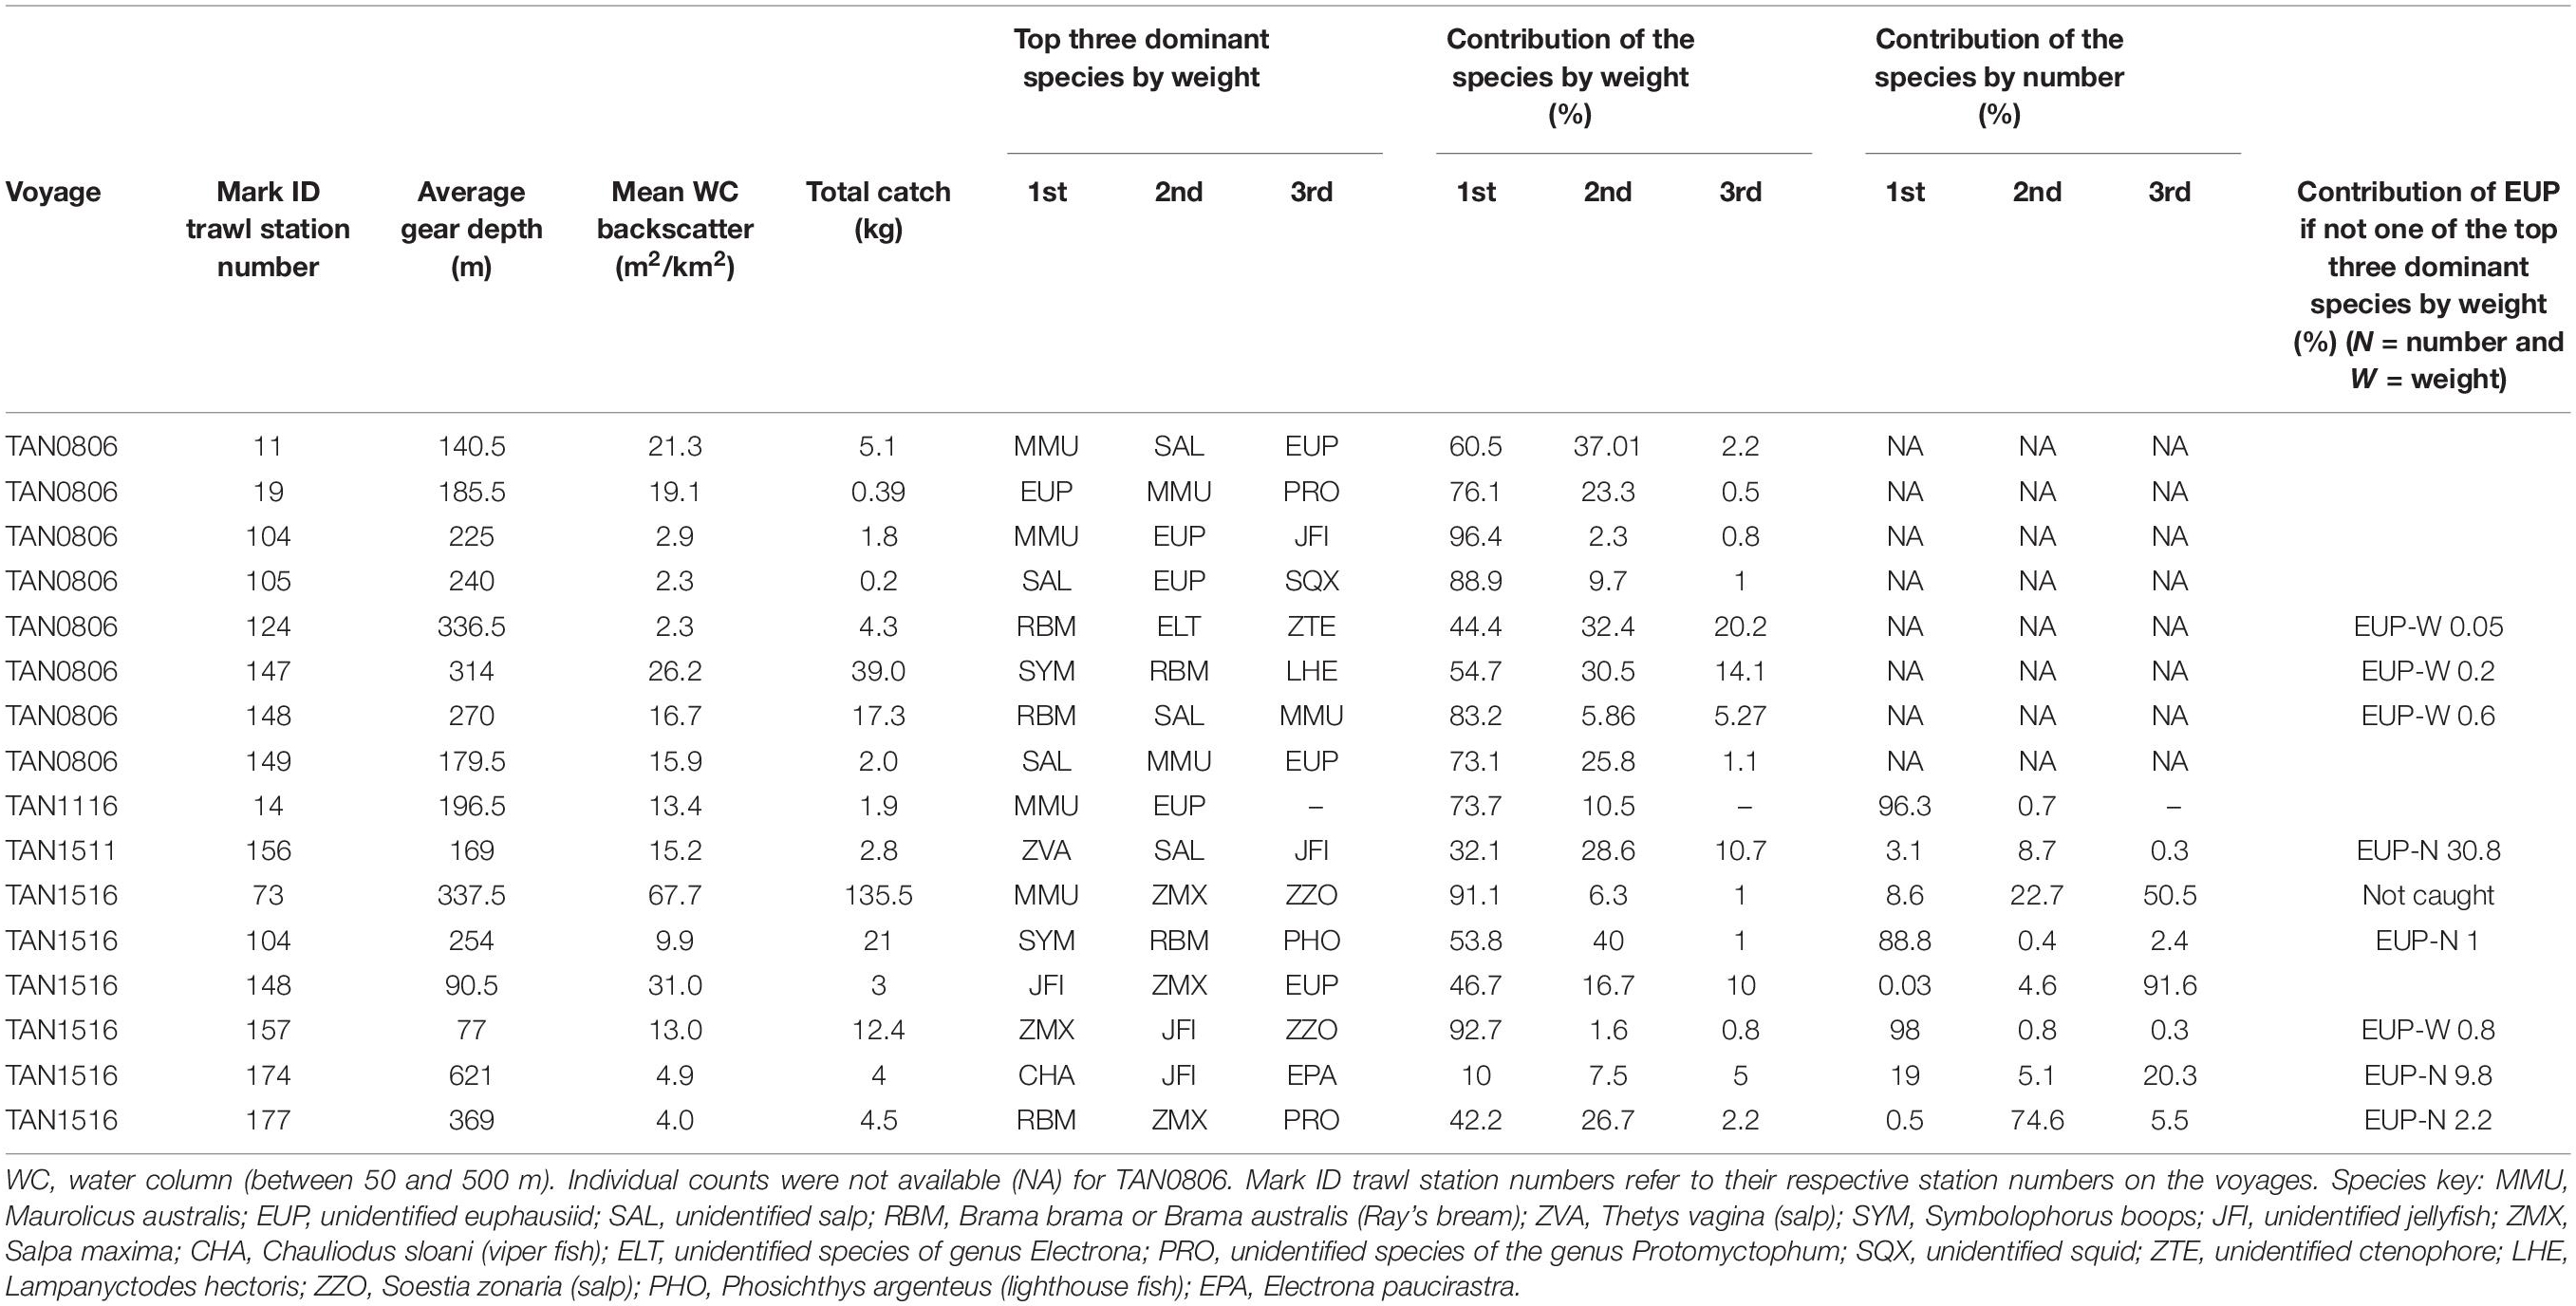
Table 3. Mark identification (mark ID) trawls of the training dataset used for classifying acoustic marks into euphausiids class (EUP) at 120 kHz (total number of mark ID trawls = 16).
We aimed to classify most 38 kHz backscatter from the surface down to 500 m, so often more than one acoustic mark was classified in a mark ID trawl. Five classes of acoustic marks were associated with mesopelagic fish: MMU (n = 189, Sternoptychidae, M. australis); LHE (n = 45, Myctophidae, L. hectoris); and three unidentified groups U1 (n = 199), U2 (n = 26), and U3 (n = 98). Although the catch information and the trawl path did not provide enough evidence to assign these unidentified marks to a species, we grouped them based on their frequency response curves, which were consistent between the different voyages (Supplementary Figure 2). This allowed us to classify as much backscatter as possible in the echograms. The frequency response curves of the unclassified categories (particularly U1 and U3) were also consistent with those obtained from gas-filled scattering models developed for mesopelagic fish, which indicate that resonance of some species occurs near or at 38 kHz (e.g., Kloser et al., 2016; Proud et al., 2018).
Euphausiids were never the target organisms of mark ID trawls and their contribution to the catches was typically small. Therefore to classify acoustic marks as euphausiids (“EUP” class), we compared the frequency response curves of acoustic marks against the well-established reference frequency response curves of euphausiids (e.g., Greenlaw, 1979), and complemented it with information from the mark ID trawls. A total of 145 marks were classified as EUP on the 120 kHz data, and the perimeter of these regions was copied across to the 38 kHz data, where all the descriptors were echo-integrated and exported.
Modeling
Principal Component Analysis
Most of the variation in the data was explained by the first three PCs (53.7%), with the first two having the highest contribution though no proper isolation of a mark class was clearly achieved (Figure 3). The PC loadings (i.e., correlation between the PC scores and the original variables) of the first PC were strong for three groups of descriptors which were all correlated: depth (e.g., mean, minimum, and maximum depth); volume backscattering (Sv_120kHz and Sv_200kHz); and a combination of dB-difference between frequencies (Sv120_38, Sv120_18, and Sv120_70) (Figure 3). Strong loadings for the second PC were: Sv70_18; the height of the marks; and Sv_18kHz, Sv_38kHz, and Sv_70kHz, the last three being correlated. Strong loadings from the remaining PCs were the backscatter in the top 50 m (PC3), length and height metrics (PC4), and Delta_Sv_120kHz (PC5). The loadings of the first five PC are shown in Supplementary Table 9.
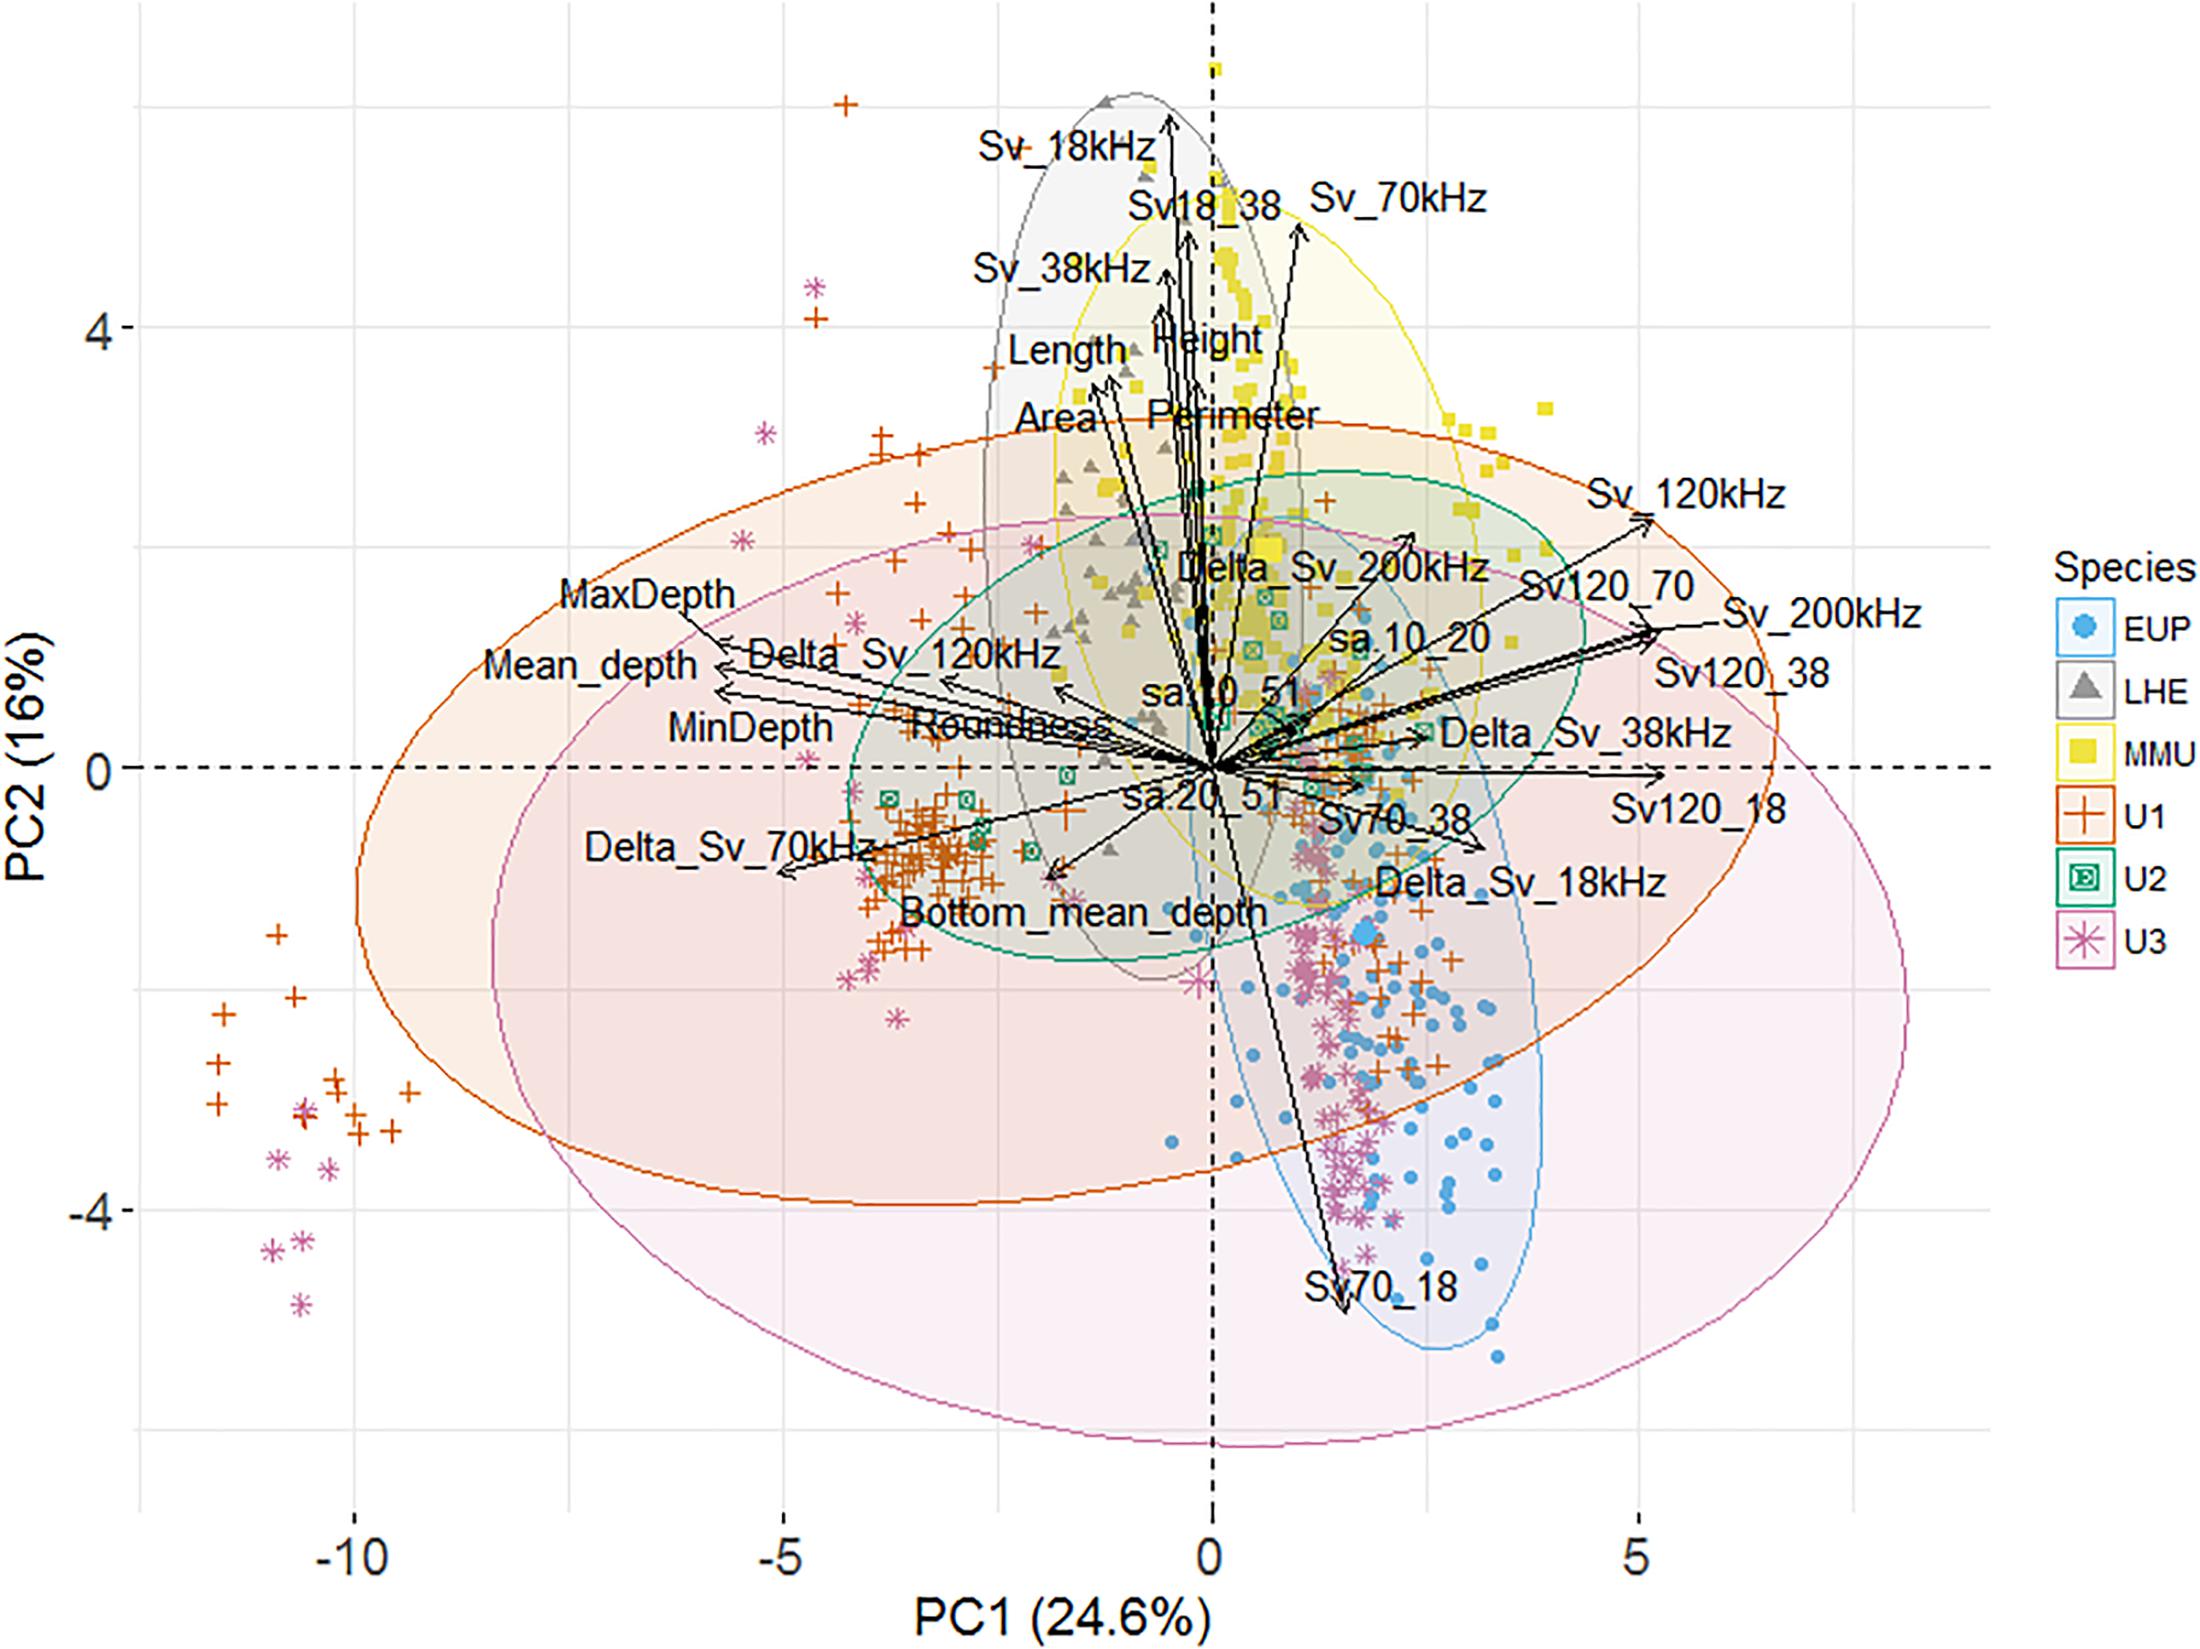
Figure 3. Principal component analysis (PCA) biplot of individuals and explanatory variables (n = 28). The biplot shows the PCA scores of the explanatory variables as vectors (in black) and individuals (i.e., acoustic marks) of each class euphausiids (blue circles) [Lampanyctodes hectoris (LHE – gray triangles), Maurolicus australis (MMU – yellow squares), and three undefined classes (U1, U2, and U3 – solid green squares, red crosses, and pink stars)], of the first (x-axis) and second (y-axis) principal components (PCs). Individuals on the same side as a given variable should be interpreted as having a high contribution on it. The magnitude of the vectors (lines) shows the strength of their contribution to each PC. Vectors pointing in similar directions indicate positively correlated variables, vectors pointing in opposite directions indicate negatively correlated variables, and vectors at proximately right angles indicate low or no correlation. Colored concentration ellipses (size determined by a 0.95-probability level) show the observations grouped by mark class.
Classification Tree
Using the information provided by the PCA we fitted different classification trees to the training dataset. The best classification tree met our established probability criterion (p = 0.8) at seven out of eight terminal nodes, and included four variables: Sv120–Sv38, Sv18–Sv38, minimum depth (or range of the mark), and Sv70 (Figure 4). This tree correctly classified 89.5% of the observations (628/702).
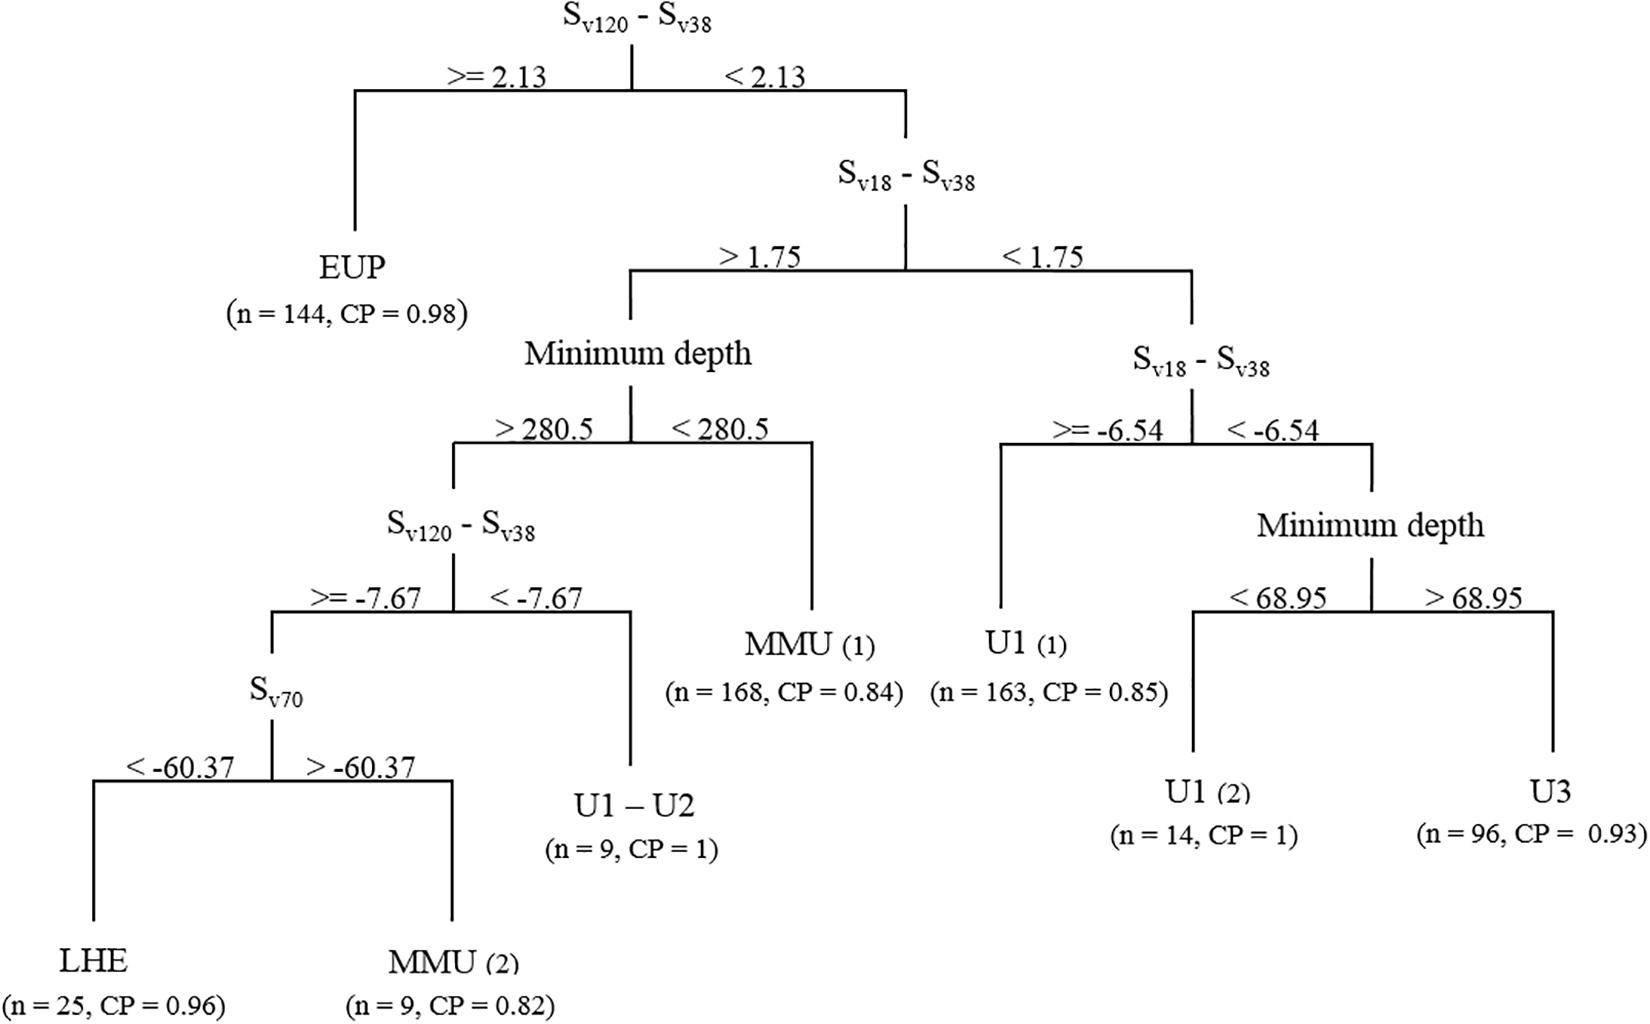
Figure 4. Classification tree generated using the acoustic training dataset and mark classification based on the mark ID trawls. Sv, volume backscattering strength (in decibels). Numbers in brackets indicate the number of marks successfully classified into the respective classes (n) and the class probability (CP) for the eighth terminal nodes.
Euphausiids were classified in the first split using a similar Sv120–Sv38 difference window to what has been described for these organism in the literature (our classification tree Sv120–Sv38 difference > 2.13 dB, literature difference 2−16 dB-difference range, Watkins and Brierley, 2002; Demer, 2004). The classification tree classified almost all the EUP acoustic marks (n = 144).
The mesopelagic fish marks were partitioned into two main branches following the Sv18–Sv38 dB-difference split, using a combination of minimum mark depth, Sv18–Sv38 and Sv120–Sv38 dB-difference and Sv at 70 kHz. On the left branch, the classification tree classified MMU in two terminal nodes, MMU(1) (n = 168), where it was described a shallow species whose scattering at 18 kHz was stronger than at 38 kHz (minimum difference 1.75 dB); and MMU(2) (n = 25) where the species minimum depth was >280 m, the Sv120–Sv38 difference ≥−7.7 dB and Sv70 was >−60.4 dB, which allowed it to be separated from LHE (n = 25). This separation based on Sv70 concurs with the frequency response curves derived for LHE and MMU (Supplementary Figure 2). Although three unidentified classes were defined in the training dataset, the classification tree failed to isolate U2 at the established probability level, and most of these marks ended up in terminal nodes MMU(1) (n = 12) and U1(1) (n = 11). The remaining number of U2 marks (n = 3) was misclassified into a U1 terminal node that failed to meet to classification probability (p = 0.7) because it only consisted of six U1 marks. Consequently, this terminal node combined these two marks into a new mark class, U1−U2. In contrast with MMU(1), U1−U2 was found deeper than 280 m but with Sv120−Sv38 < −7.67 dB, unlike MMU(1) and LHE.
Following the classification of euphausiids and the first Sv18−Sv38 split, the right branch of the tree isolated most of the marks of unidentified classes U1 and U3. The first split on the right branch separated most of the U1(1) marks (n = 163), by using a Sv18−Sv38 difference ≥−6.5 dB. There marks were associated to deep scattering layers (DSLs) often observed in the echograms and that would correspond to unknown species of mesopelagic fish. A further split based on minimum depth separated a small number of U1(2) marks from the U3 mark class. Although the mark class in terminal node U1(2) displayed similar acoustic properties to U1(1), this small subset of marks can be isolated by its vertical distribution range. This suggests that their composition is unlikely to be mesopelagic fish (especially during daytime), and could correspond to small pelagic organisms able to scatter sound following a U1 curve (Supplementary Figure 2). Mark class U3 was classified as having a minimum depth >69 m and a Sv18−Sv38 difference <−6.5 dB, which is supported by the frequency response curves drawn from these marks (Supplementary Figure 2).
Model Validation
The model validation was carried out on a subset of 50 mark ID trawls that were not part of the training dataset for acoustic marks associated with mesopelagic fish. In 48 of these trawls at least one of the identified mark classes was present in the catch (LHE = 29 and MMU = 37). Although euphausiids were present in 34 mark ID trawls of the validation dataset, 13 were excluded for validation of the model for the mark class EUP, because they were part of the training dataset. Catch composition is available in Supplementary Table 10. Compared with the mark ID trawls from the training dataset, the size of specimens of the identified mark classes (i.e., MMU and LHE) collected in mark ID trawls from the validation dataset was very similar suggesting that catches datasets from both datasets are comparable (training dataset mean lengths: MMU = 4.0 cm and LHE 4.7 cm; validation dataset mean lengths: MMU = 4.2 cm and LHE = 4.9 cm). The mean total backscatter of the mark ID trawls of the training dataset was about 30% higher than the mean total backscatter of the mark ID trawls of the validation dataset (mean sa training dataset 38 kHz: 49.5 m2 km–2, 120 kHz: 16.6 m2 km–2, mean sa validation dataset 38 kHz: 35 m2 km–2, 120 kHz: 14.6 m2 km–2).
Model sensitivity to the school detection parameters was tested only on mark ID trawls where the identified mark classes (LHE, MMU, and EUP) were present in the catch. To test the model sensitivity, we used nine different minimum volume backscattering (Sv in dB) threshold between −60 and −76 dB for mesopelagic marks (on 38 kHz data) and −65 and −81 dB for euphausiids (on 120 kHz data), and two minimum total school detection heights, 5 and 10 m, for each mark class. All other school detection parameters remained as in Supplementary Table 5. The sensitivity analyses showed that the model performed best when using a minimum candidate height of 5 m for MMU and EUP, and while there were only subtle differences for LHE (Figure 5). When using a minimum candidate height of 5 m, the model performed better as the minimum Sv threshold decreased; however, no substantial gains in detection rate were obtained as the threshold continued to decrease below −69 dB for MMU and −74 dB for EUP. Considering that the detection rate for LHE was low regardless of the minimum Sv threshold used, and processing time increased as the minimum Sv threshold decreased, we deemed the optimal school detection settings as having minimum candidate height of 5 m and minimum Sv threshold of −69 dB for MMU and LHE and −74 dB for EUP. These values were used for model validation and application.
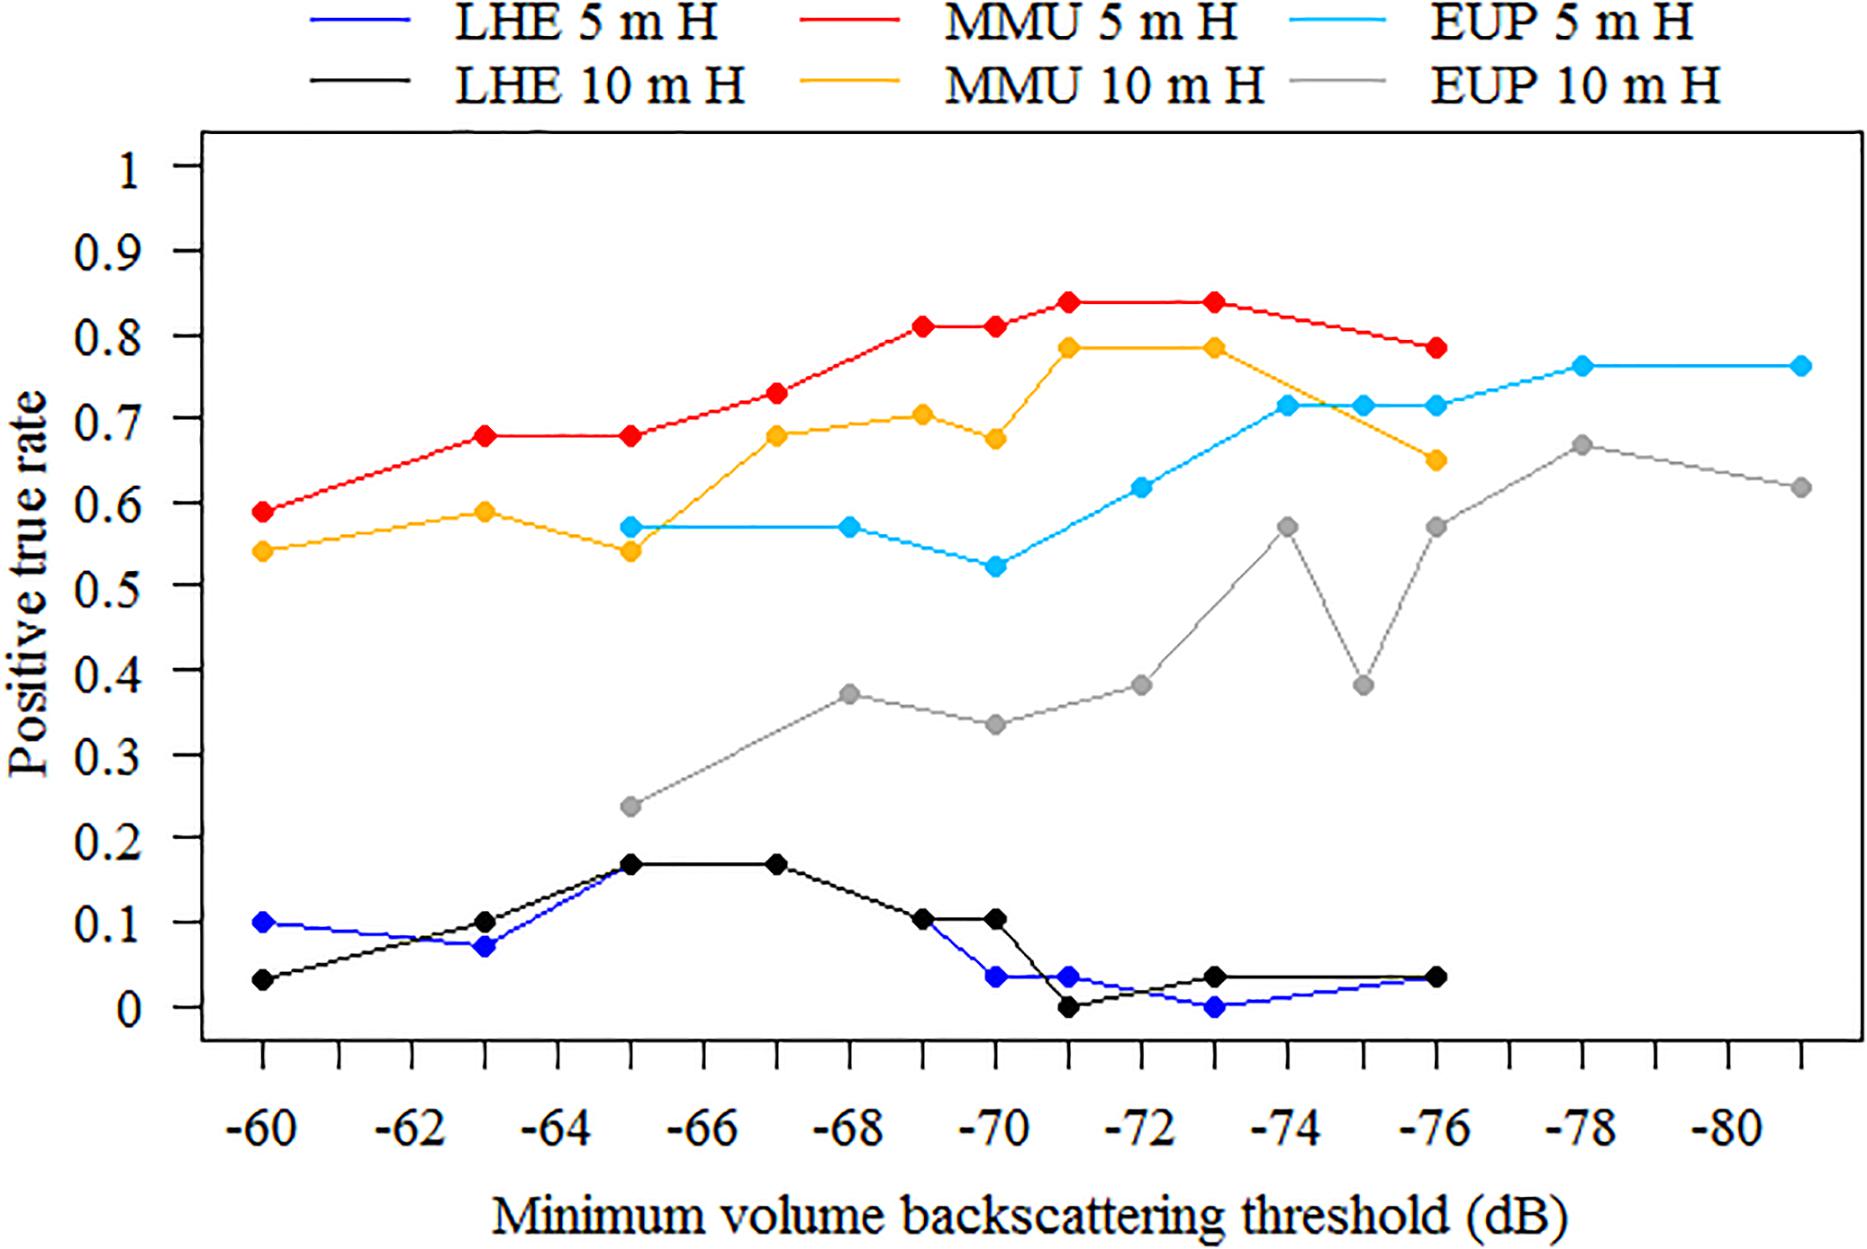
Figure 5. Sensitivity analysis to school detection parameters. Positive true rates were obtained using nine different minimum volume backscattering (Sv) threshold in decibels (dB), between –60 and –76 dB for mesopelagic marks (on 38 kHz data) and –65 and –81 for euphausiids (on 120 kHz data), and two minimum total school detection heights, 5 and 10 m, for each mark class. Number of mark ID trawls used for validation was 29, 37, and 21 for Lampanyctodes hectoris (LHE), Maurolicus australis (MMU) and euphausiids (EUP), respectively.
Model validation was carried out in all mark ID trawls (regardless of the contribution of the identified mark classes to the catch), and also on a subset of mark ID trawls where the identified mark classes contributed at least by 10% of the catch by weight or number for LHE and MMU (18 and 17 mark ID trawls, respectively), and at least 1% of the catch by weight for EUP (16 mark ID trawls). The lower percentage of contribution of EUP was chosen because these organisms were never targeted by mark ID trawls and their incidence in the catches was considered opportunistic. The results of the model validation on all mark ID trawls and on a subset of mark ID trawls are shown in Tables 4, 5, respectively.
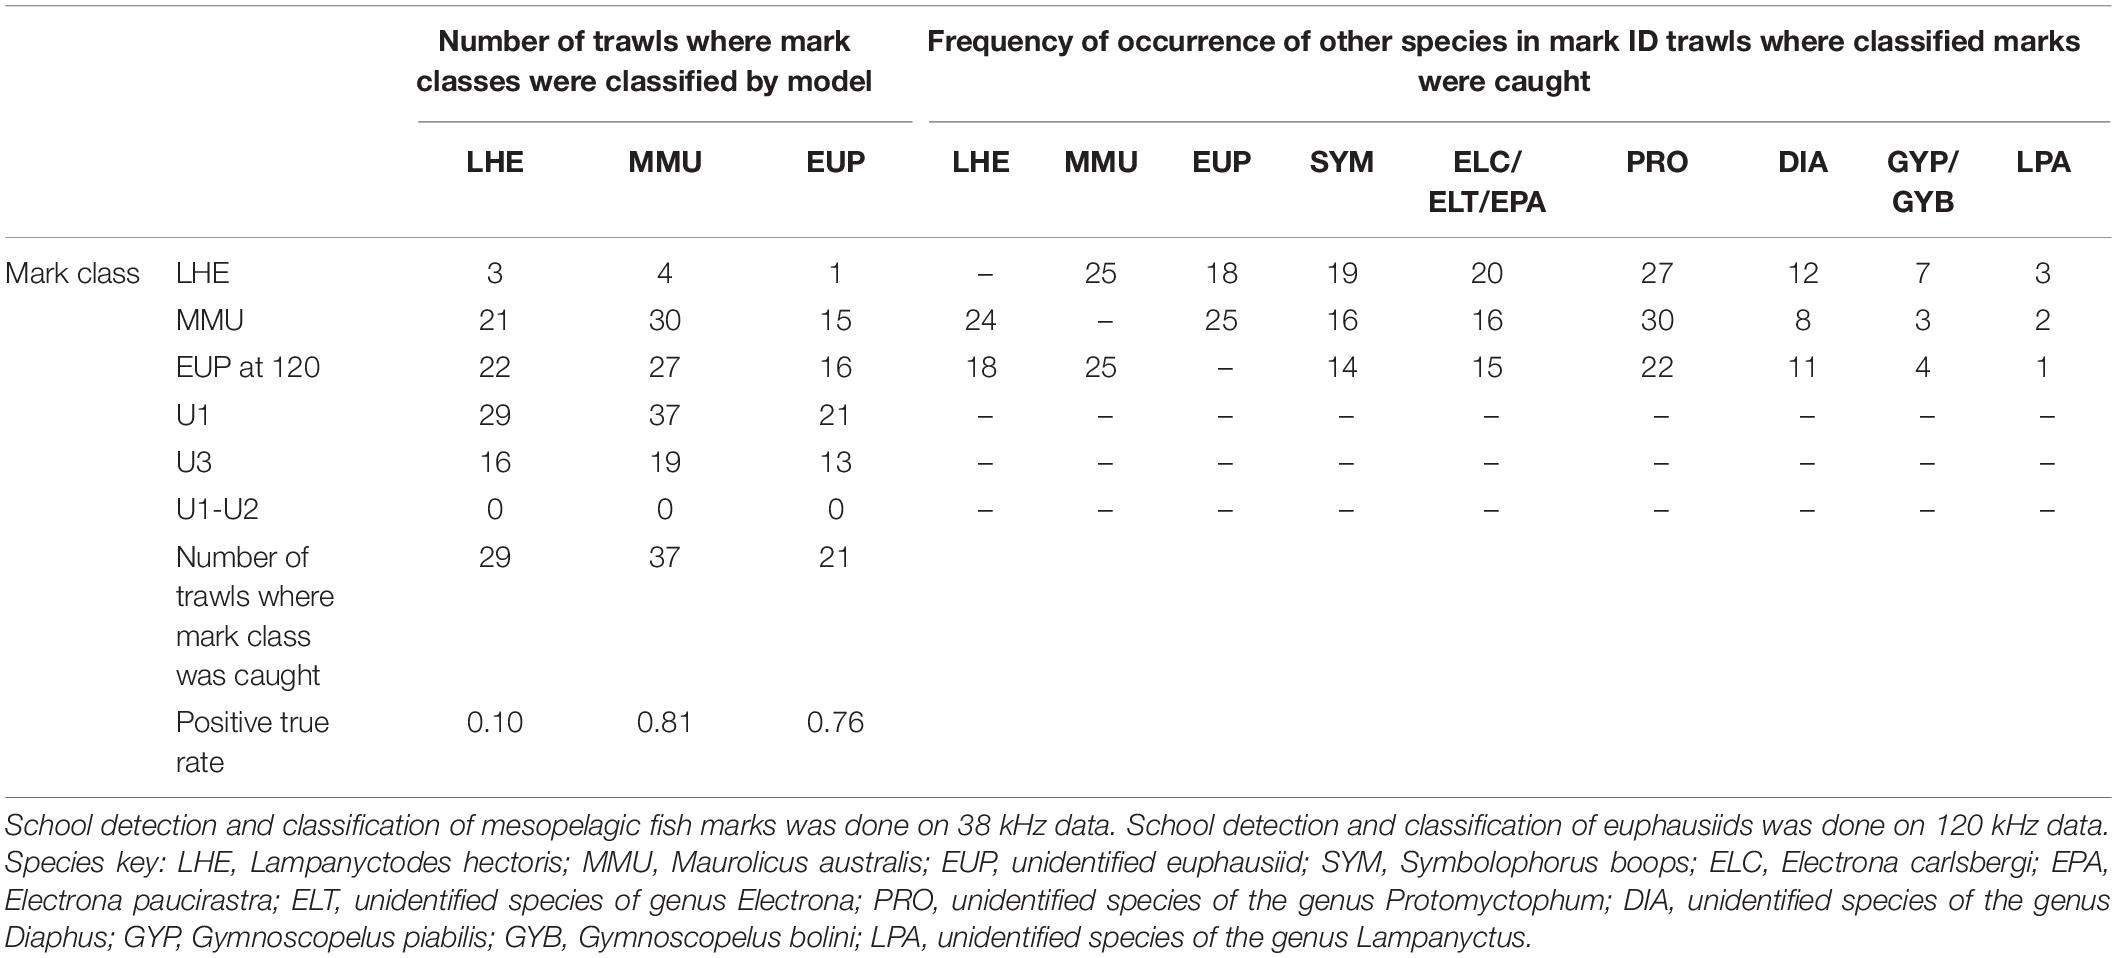
Table 4. Summary of model validation (positive true rate: number of trawls where mark class detected/number of trawls where mark class caught) in mark ID trawls where the species of the known mark classes were caught, regardless their contribution in the catch.
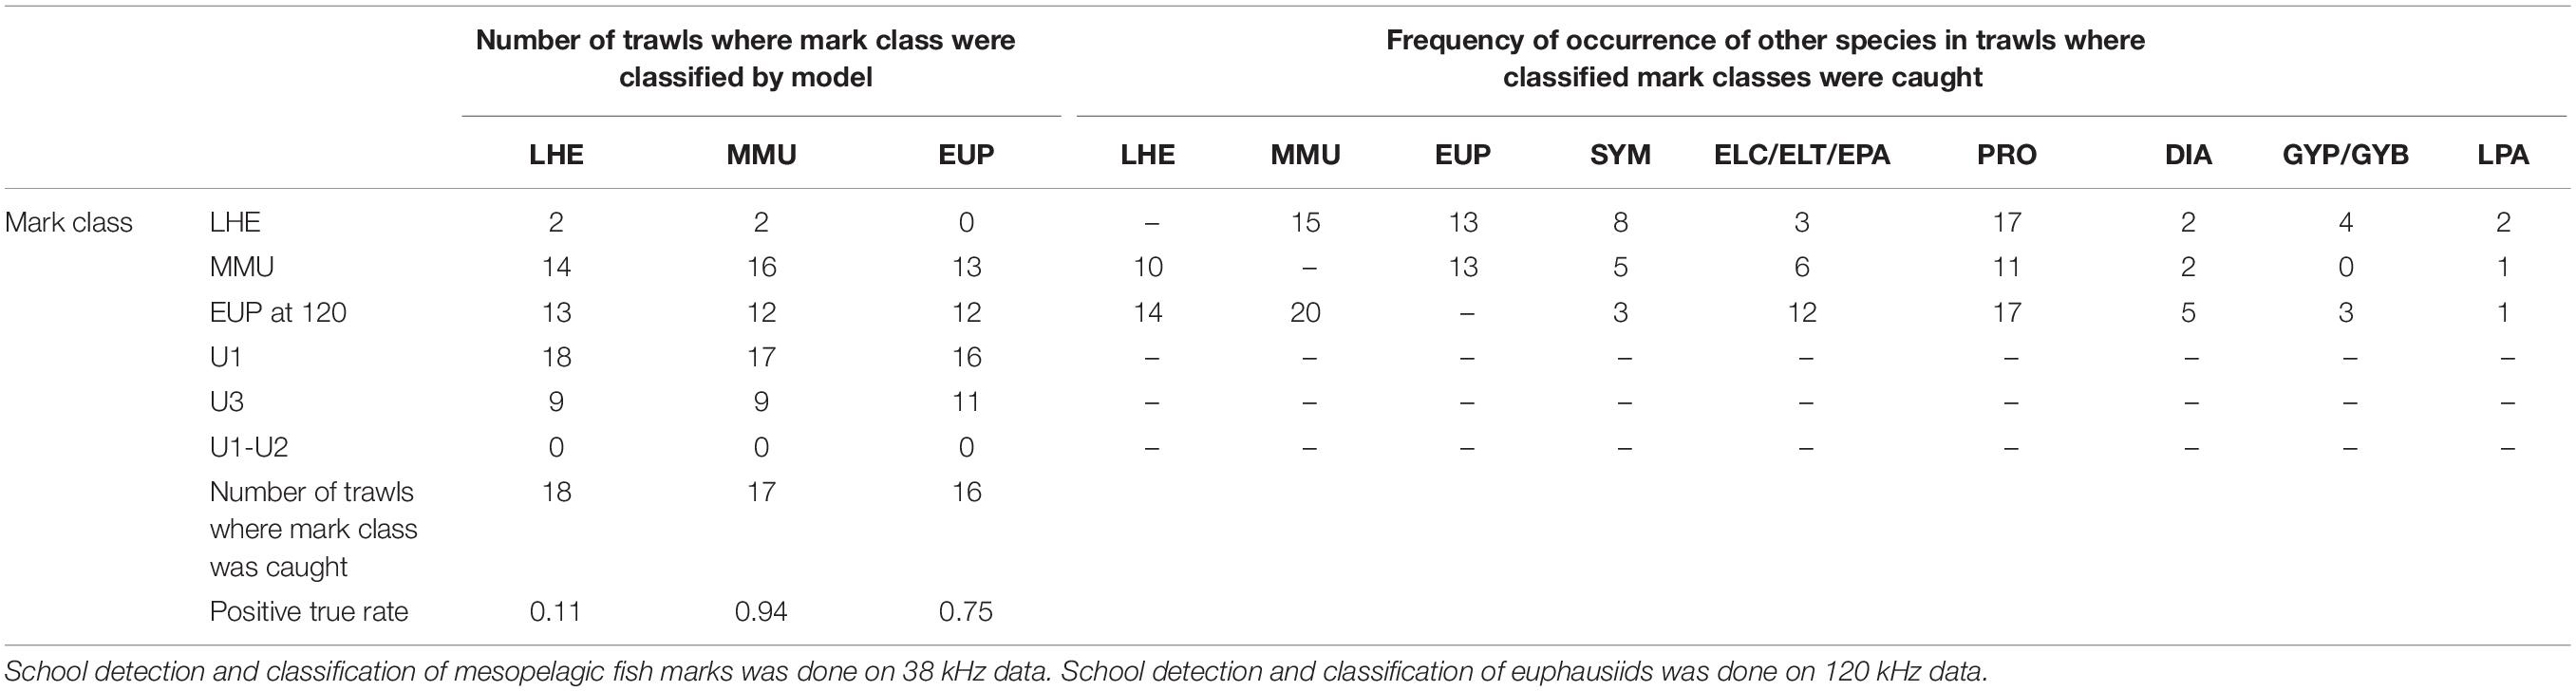
Table 5. Summary of model validation (positive true rate: number of trawls where mark class classified/number of trawls where mark class caught) in mark ID trawls where the species of the known mark classes were caught and their contribution was at least 10% by weight or number for LHE and MMU and 1% for EUP.
The model was successful in classifying MMU and EUP on the 38 and 120 kHz data, respectively, in the full validation dataset (positive classification rate 0.81 and 0.76), but it failed to classify LHE (0.1) (Table 4). As in the training dataset more than one mark class was often classified by mark ID trawl in the validation dataset. Likewise, the unspecified mark classes were frequently present, with U1 being the most classified mark class. This result was not unexpected since we associated U1(1) with the DSL which is ubiquitous in the open ocean ecosystems. The catch of the mark ID trawls was diverse and there were several species of mesopelagic fish species what were commonly caught but that we failed to attribute to a specific acoustic mark class due to the lack of convincing information from the trawl path or because they were caught in, but that are most likely responsible for the mark classes U1(1) and U3. The combination of mark classes U1−U2 was not classified in the model validation.
The results of the model validation in the dataset excluding the mark ID trawls where the presence of the identified mark classes was low showed even a higher positive detection rate for MMU and similar results for LHE and EUP (Table 5).
The percentage of backscatter classified into each mark class varied widely between mark ID trawls (Supplementary Table 10). The mark class LHE was classified in five mark ID trawls, which accounted on average for 0.7% of the backscatter between 50 and 500 m (mean backscatter when present 0.4 m2 km2). The mean backscatter associated with MMU when classified (n = 37) was 9.1 m2 km2, and on average represented 15.5% of the total backscatter between 50 and 500 m. The most commonly classified mark (U1, classified in all 50 mark ID trawls) had the highest mean backscatter (17.5 m2 km2), and on average represented 43% of the backscatter. The mark class U3, classified in 29 mark ID trawls, on average accounted for 16.5% of the backscatter between 50 and 500 m, with a mean backscatter of 6.2 m2 km2. At 120 kHz the mark class EUP was classified in 26 mark ID trawls, where on average it accounted for 5% of the backscatter between 50 and 500 m, with an average backscatter of 0.3 m2 km2.
Model Application in the Hoki Trawl Survey Time Series
The number of acoustic recordings used for monitoring the temporal and spatial trends of the identified acoustic mark classes on the Chatham Rise varied between years (Table 6). The number of recordings excluded from the trawl survey datasets based on the data quality metric (20% of bad transmits) ranged from 0 of 69 in 2013 (i.e., 0% excluded) to 35 of 79 (44% excluded) in 2014. The mean WC backscatter on the 38 and 120 kHz data was comparable to those estimated in the training and validation datasets. A summary table with mean backscatter by mark class in each trawl survey is available in Supplementary Table 11.
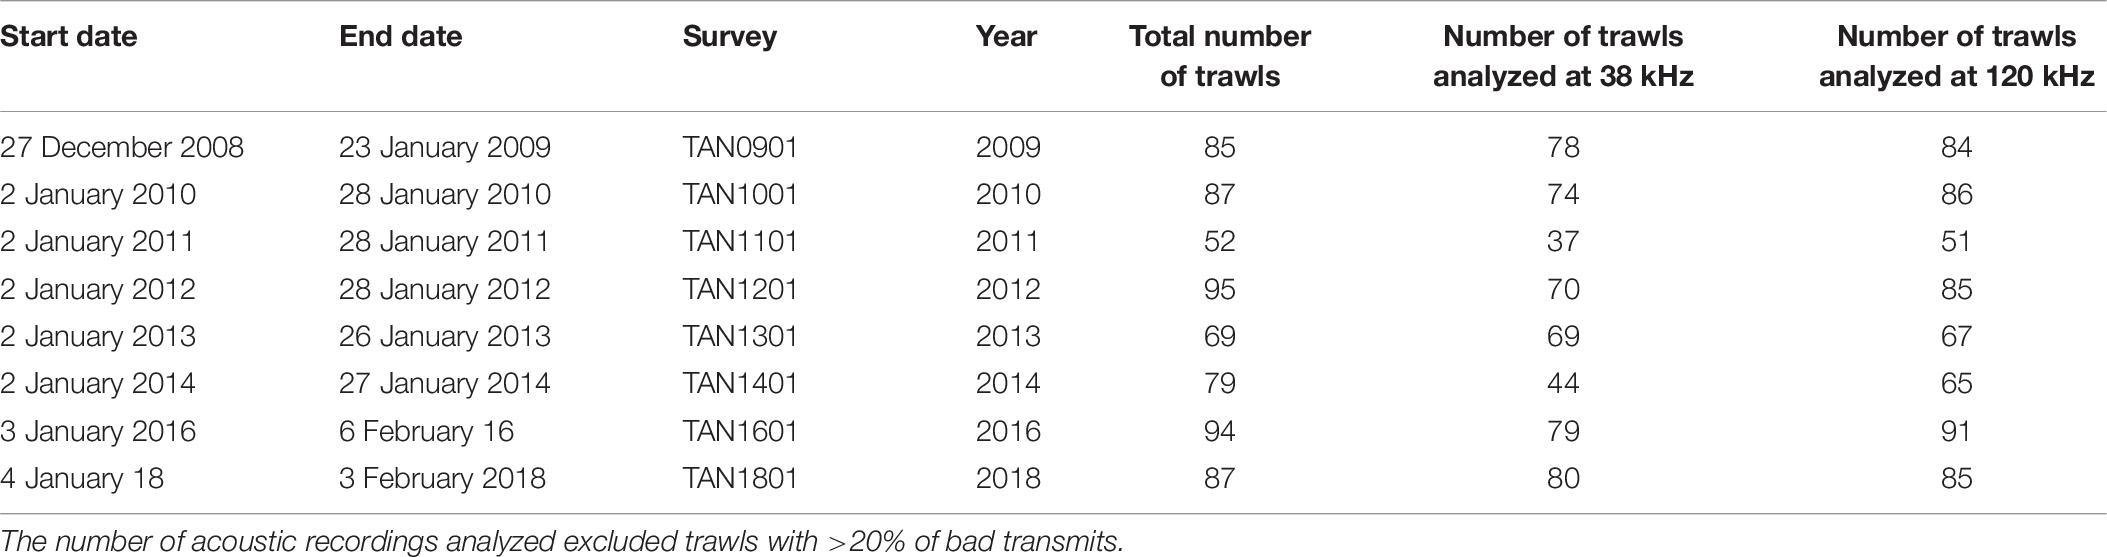
Table 6. Summary of the hoki trawl survey time series of acoustic dataset used for monitoring temporal and spatial trends of the acoustic marks classes in the Chatham Rise.
Temporal Patterns of Backscatter
Using our classification tree and the 38 and 120 kHz data collected in the trawl time series, we were able to provide relative estimates of abundance for each mark class we defined in the Chatham Rise and study temporal and spatial patterns of micronekton in the area. Four out of five mark classes were classified in the trawl time series: MMU, LHE, U1, U3, and EUP.
The temporal pattern of the mark classes defined at 38 kHz data showed variability over the period but no clear trends (Figure 6). The observed trends in WC backscatter did not correlate with trend of the mark class MMU (Pearson’s correlation test, r = 0.04, p-value > 0.05, df = 6), showing that WC backscatter is not a good proxy for abundance of all species of micronekton. The backscatter associated with MMU suggests a decreasing trend since 2011, when it reached the highest mean backscatter (Supplementary Figure 3). High levels of backscatter were associated with the unidentified mark classes U1, which defined the pattern of the backscatter in the WC between 50 and 500 m (Pearson’s correlation test, r = 0.75, p-value < 0.05, df = 6). Lower mean backscatter values were associated with other mark classes, in particular with LHE.
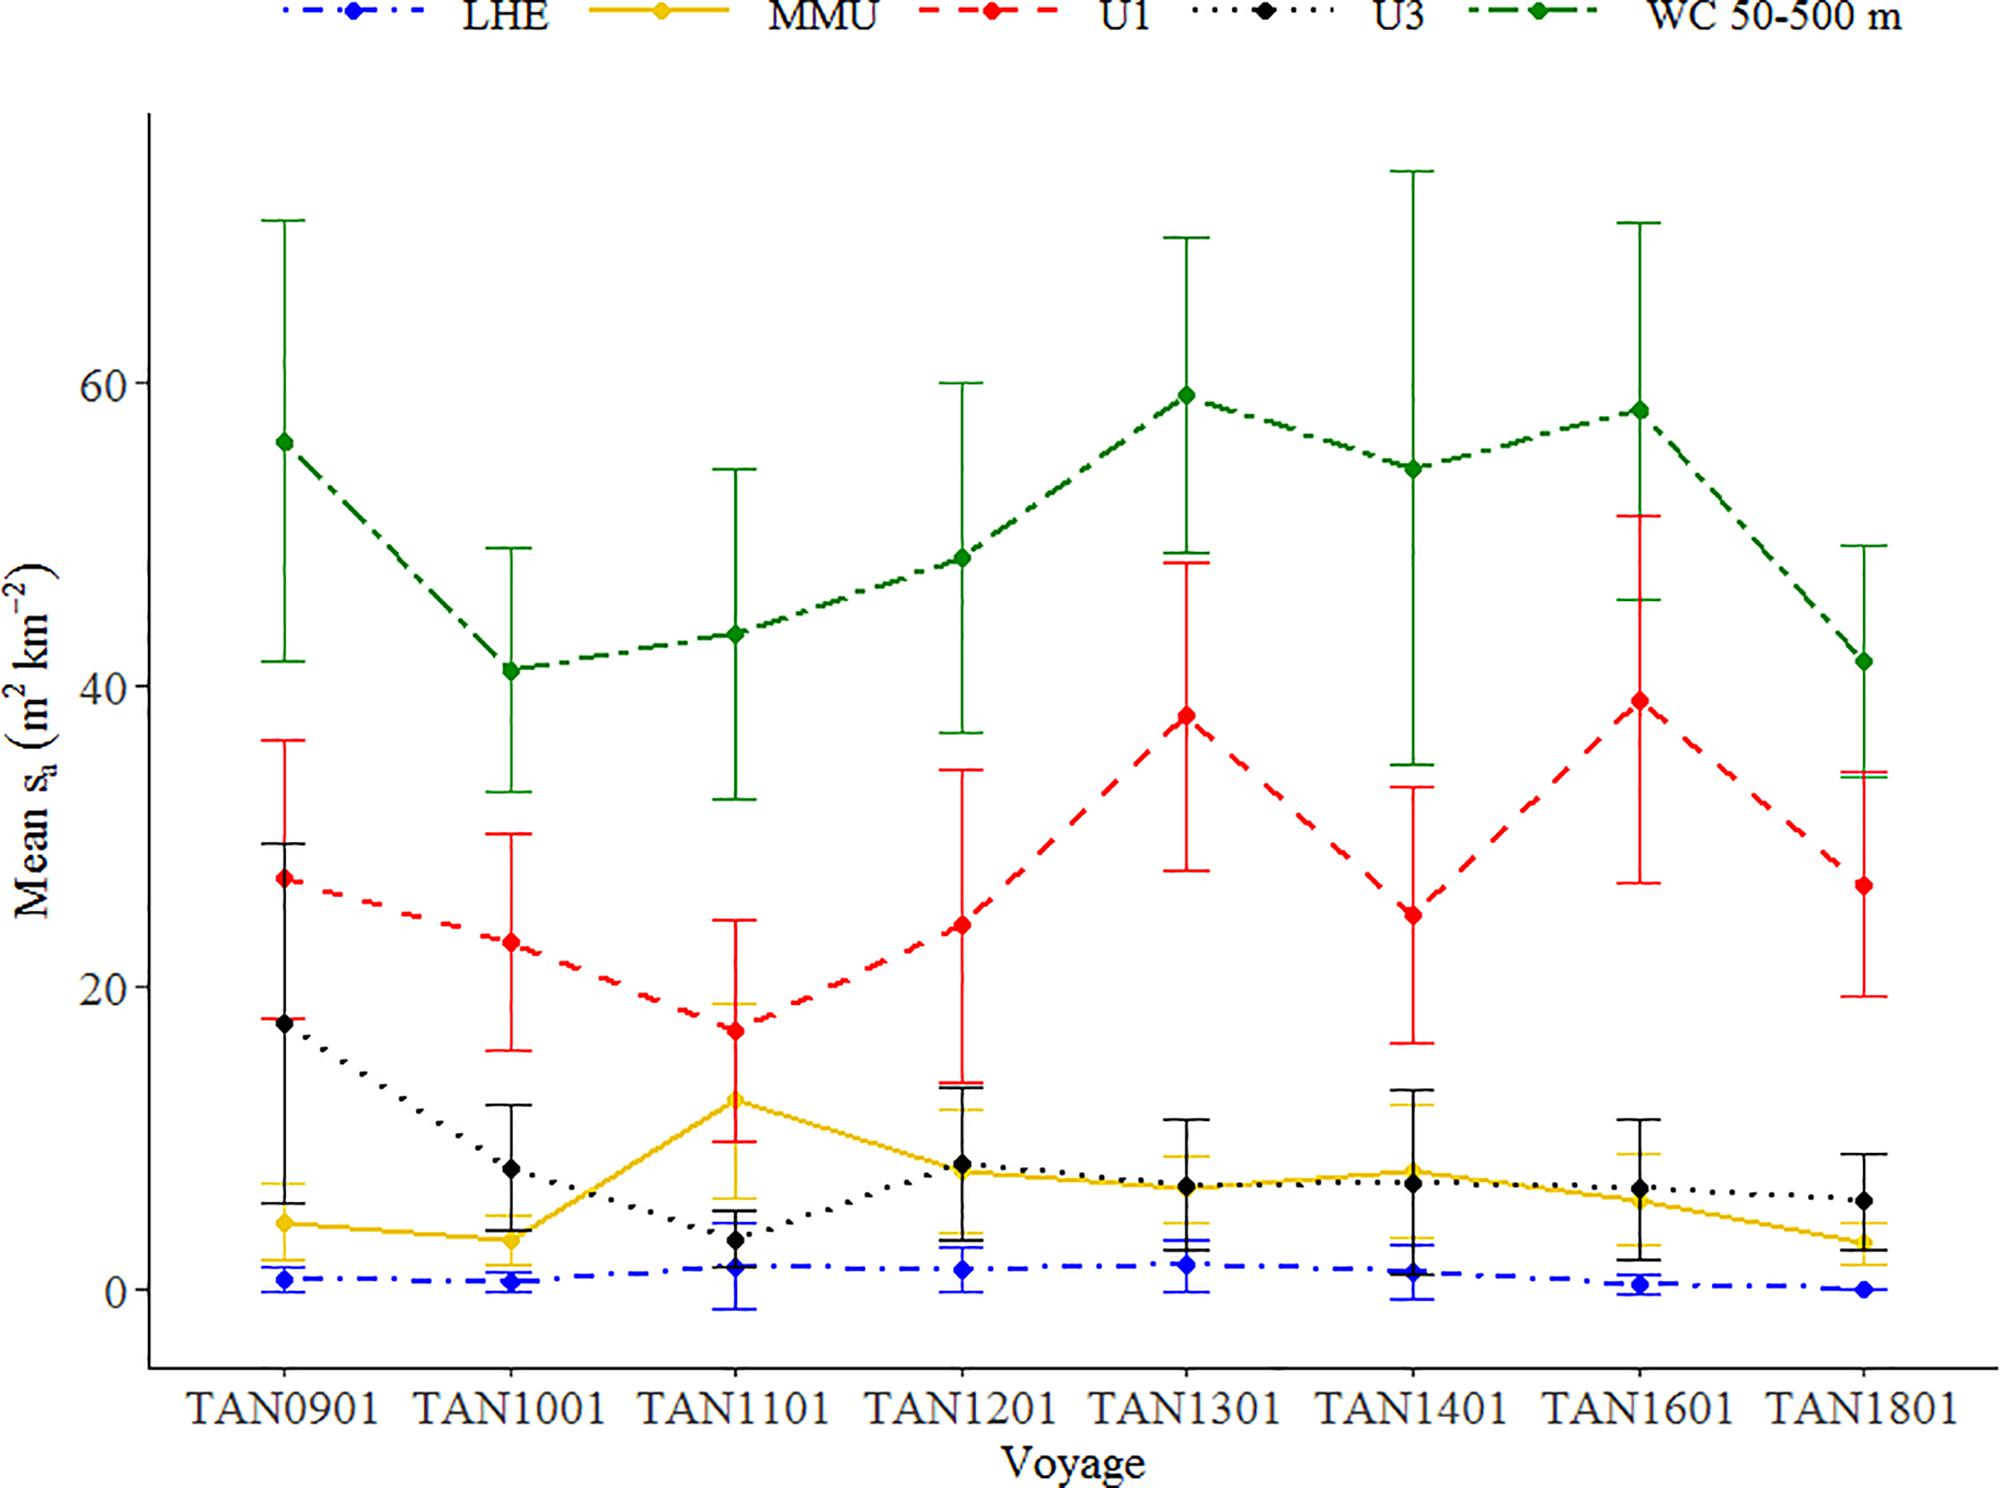
Figure 6. Mean backscatter (sa in m2 km–2) associated with each mark class estimated from the 38 kHz data of the Chatham Rise hoki trawl series. MMU (Maurolicus australis), LHE (Lampanyctodes hectoris), and unidentified classes U1 and U3. Error bars show two times the standard error of the mean. Temporal pattern of backscatter associated with mark classes MMU and LHE alone at 38 kHz and EUP at 120 kHz is available in Supplementary Figures 3, 4.
Mean backscatter associated with euphausiids on 120 kHz data showed a decreasing trend between 2009 and 2018 (Figure 7). To test whether the decrease in backscatter of euphausiids was statistically significant, we fitted a linear regression to the time series of mean backscatter estimated in four different ways: (i) using all trawls, (ii) a spatial grid (1 × 1° cells, Figure 8) with all trawls, (iii) trawls within 98% confidence intervals (CIs), and (iv) spatial grid using trawls within 98% CI. Although the slope of the four linear regressions fitted to the temporal pattern of backscatter was negative and close to the 95% significance level, only the slope of linear regression fitted to mean backscatter estimated using trawls within 98% CI was statistically significant at the established significance level (p-value < 0.01).
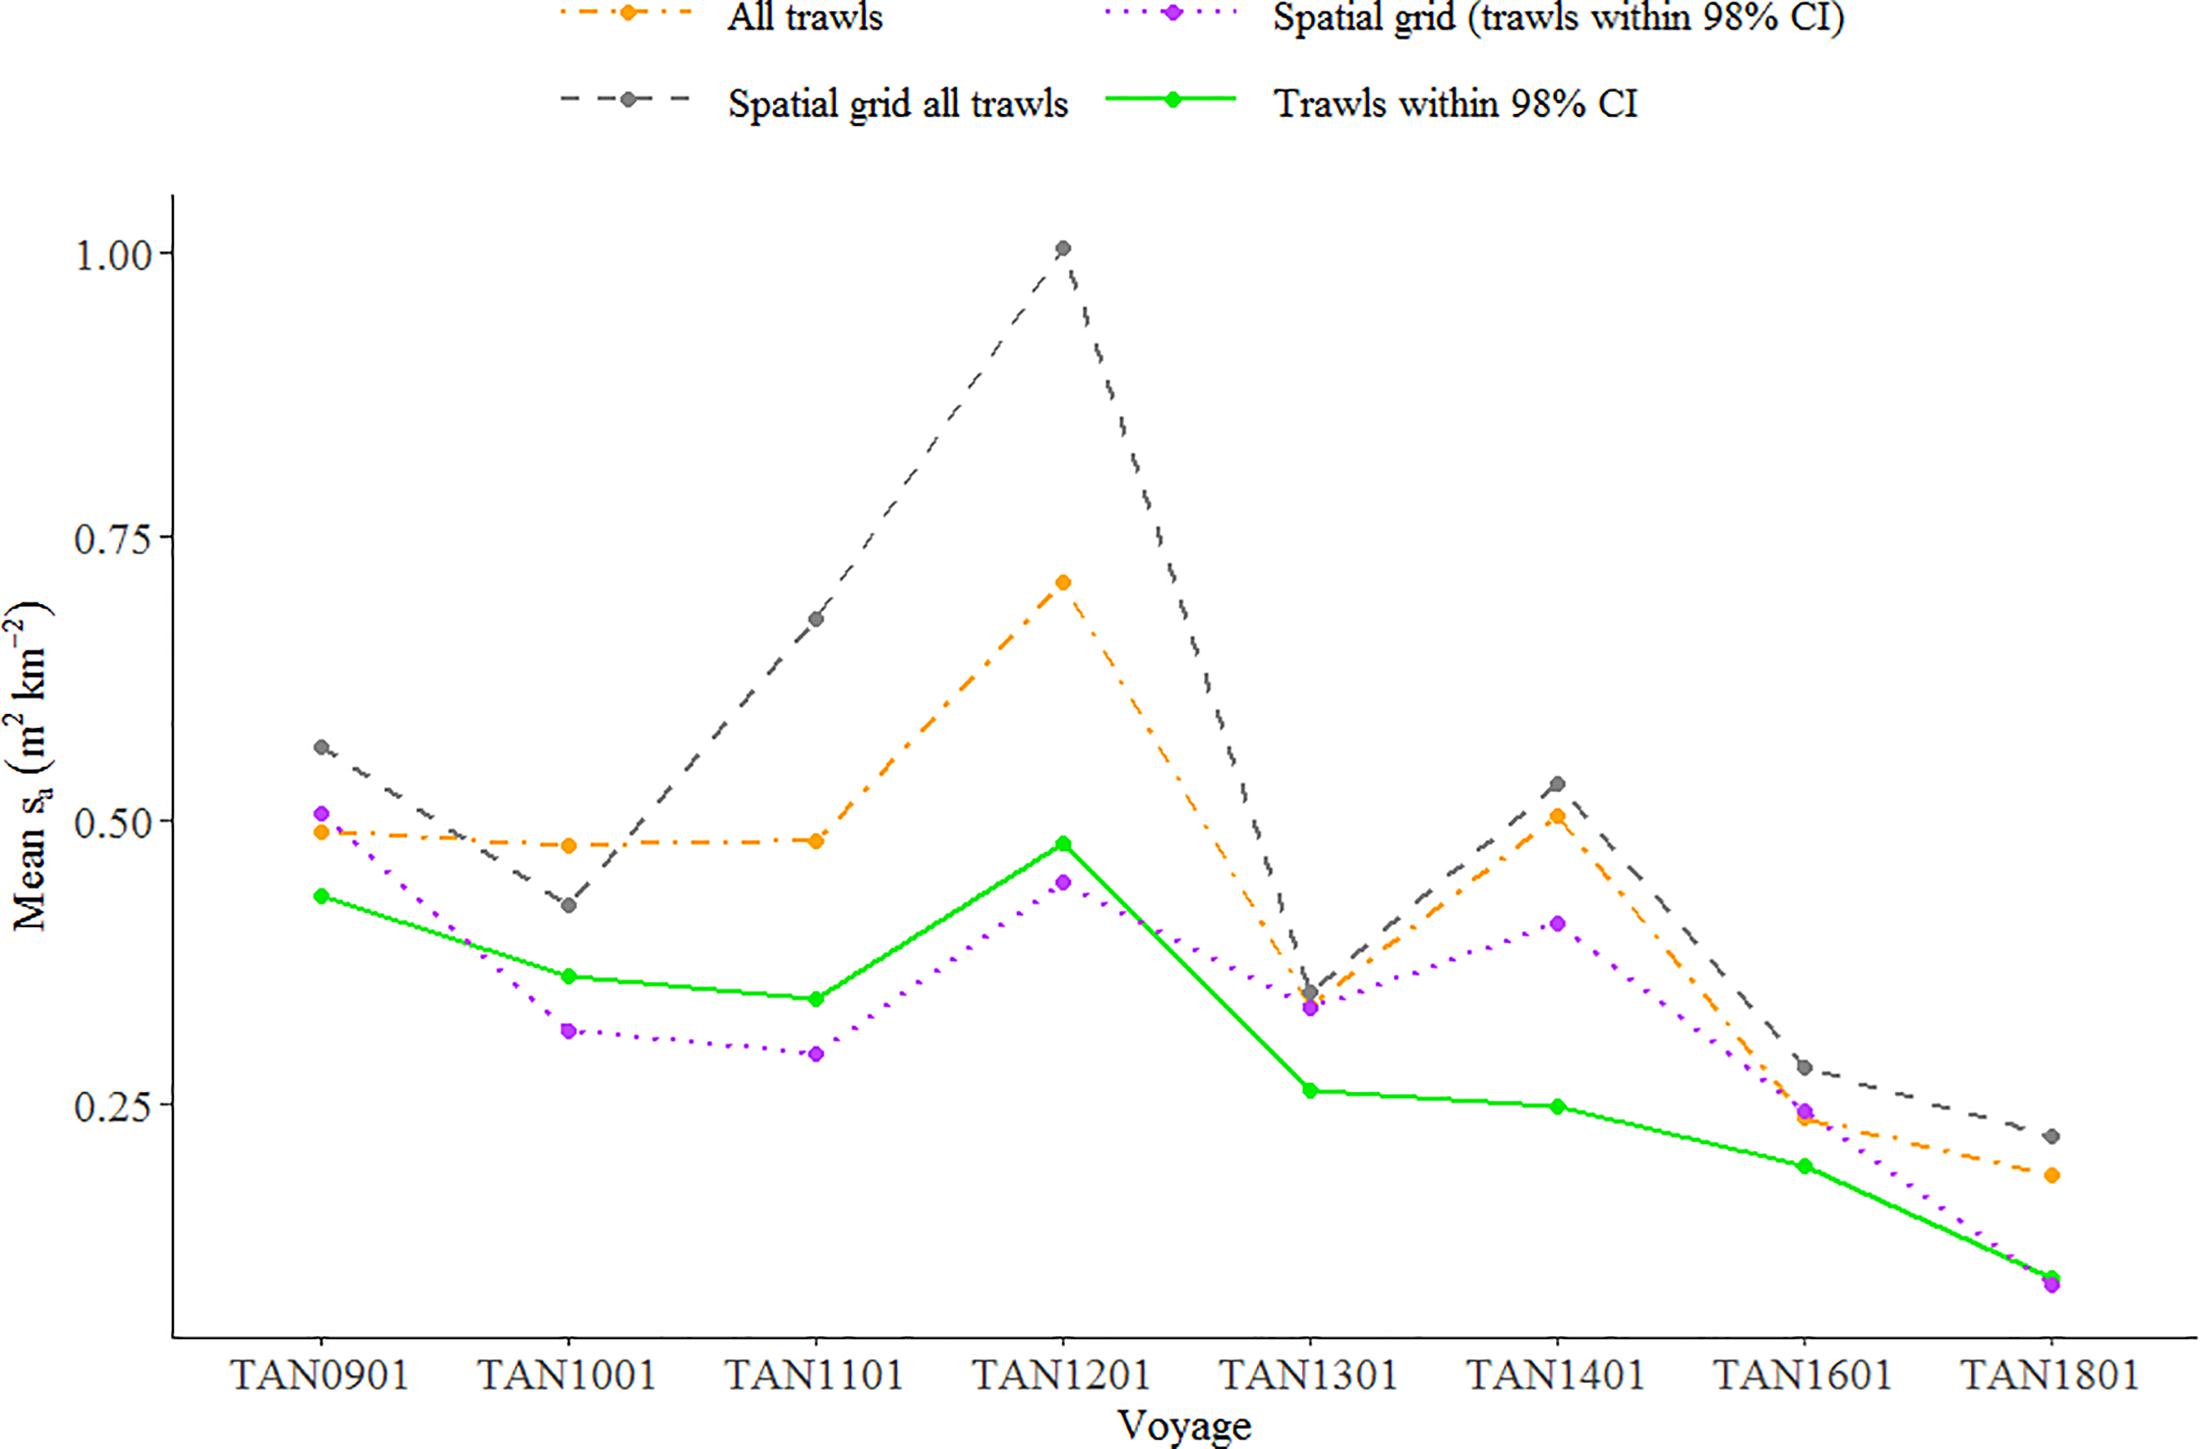
Figure 7. Relative index of euphausiids abundance (acoustic backscatter, sa in m2 km–2) in the Chatham Rise between 2009 and 2018. Each point represents the mean backscatter associated with EUP in the trawls estimated using: all trawls, a spatial grid (1 × 1° cells) with all trawls, trawls within 98% confidence intervals (CIs), and spatial grid using trawls within 98% CI. Mean backscatter estimated using all trawls and associated standard errors available in Supplementary Figure 4.
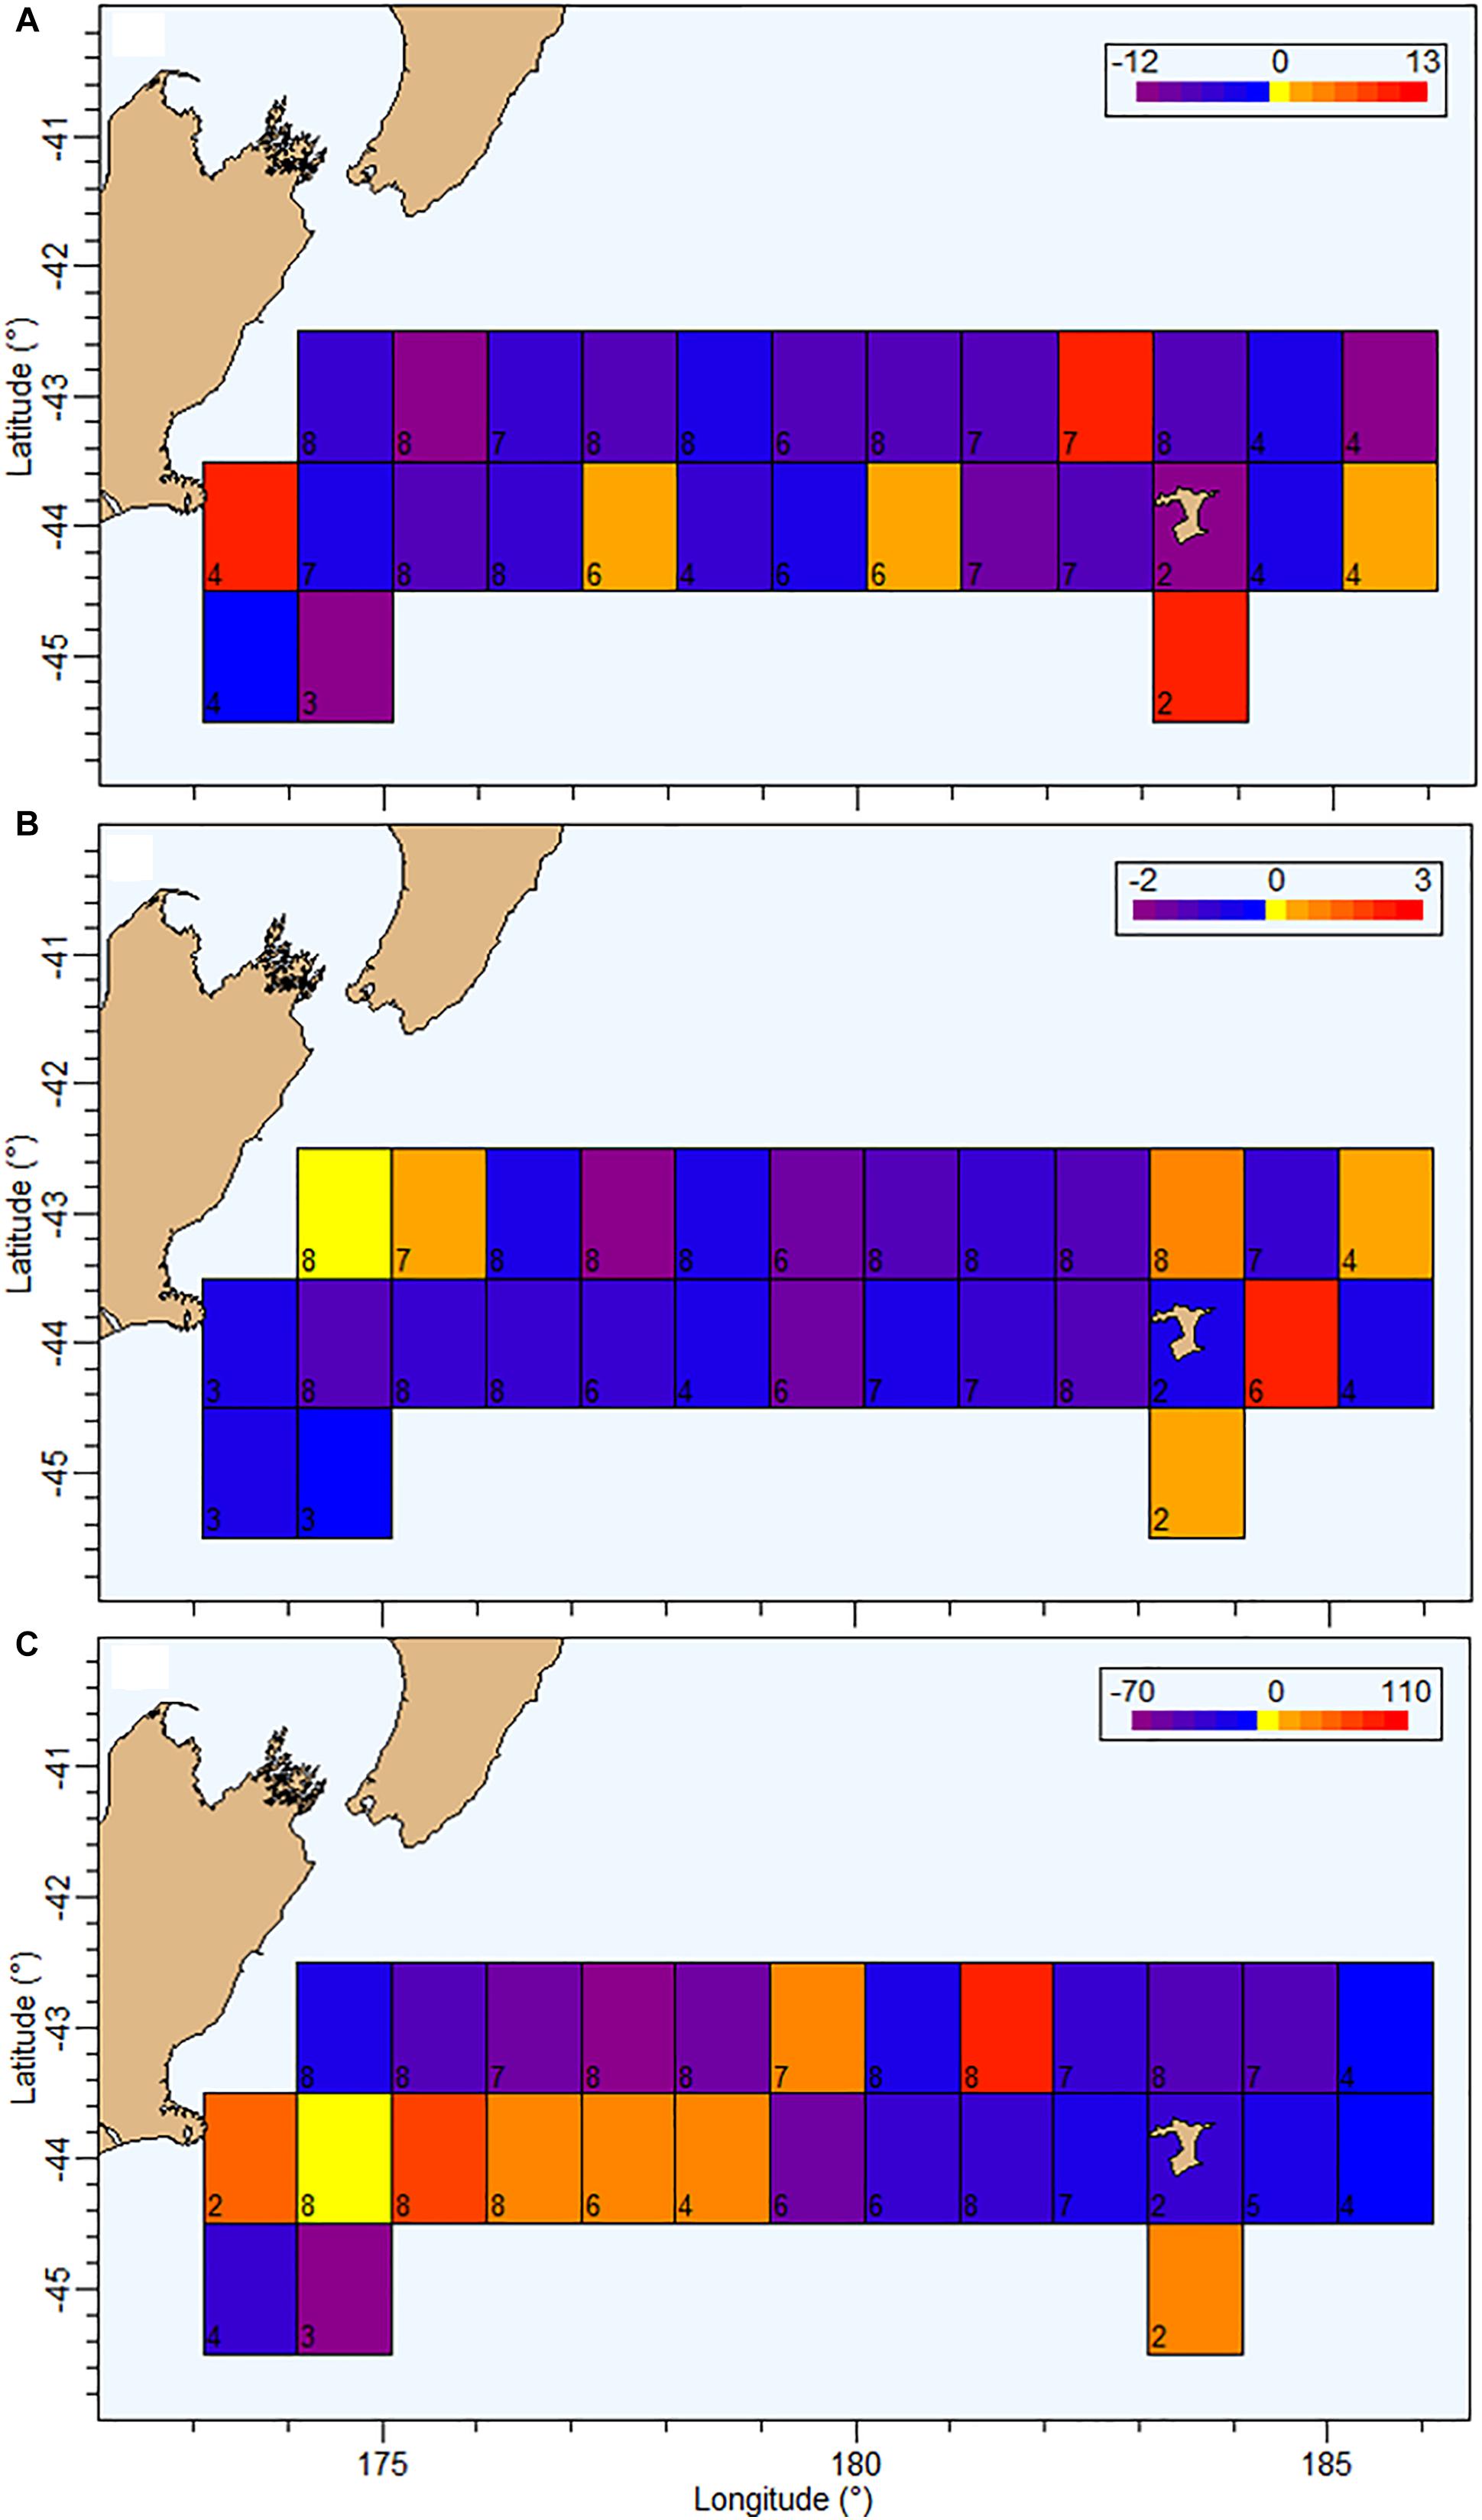
Figure 8. Current status (2018) of MMU (Maurolicus australis) (A), EUP (euphausiids) (B), and micronekton in the water column (WC, between 50 and 500 m) (C) evaluated using acoustic backscatter (a proxy for organisms abundance) at 38 for MMU and the WC, and 120 kHz for euphausiids, relative to period 2009–2016 on the Chatham Rise. Grid size 1 × 1°. Each grid cell represents the difference between the average mean WC backscatter between 2009 and 2016, and the mean backscatter in 2018. Mean backscatter for the whole area between 2009 and 2016 for MMU = 6.93 m2 km–2 and EUP = 0.46 m2 km–2. The number in the bottom-left corner of each cell indicates the total number of data points (years, 2009–2018) of available data in that cell.
Spatial Patterns of Backscatter
The assessment of spatial patterns of backscatter was focused on the identified mark classes MMU and EUP on 38 and 120 kHz data, respectively. The current status of MMU (in 2018) relative to the period between 2009 and 2016 showed a general decrease in abundance over the Chatham Rise particularly north of 44°S and in the central region (174–182°E), with only a few grid cells showing higher mean backscatter in 2018 compared with the 2009–2016 period (Figure 8). The status of EUP in 2018 also showed an overall decrease in comparison with the average mean backscatter estimated between 2009 and 2016, particularly in the central region. In terms of WC backscatter the spatial trend was more heterogeneous, showing higher recent levels of backscatter in the southwestern area of the Chatham Rise and lower levels toward the northeast (Figure 8).
Comparison of Our Relative Index of Micronekton Abundance to Other Studies
O’Driscoll et al. (2009) estimated unclassified mesopelagic backscatter based on the observed backscatter into the upper 200 m at night (corrected by a factor for the upward migration of organisms into the surface blind zone). This index was updated by Stevens et al. (2018) up to and including 2018. Trends in total backscatter estimated by Stevens et al. (2018) down to 800 m and from 50 to 500 m in this study were similar, but patterns in MMU and LHE did not follow trends in estimated mesopelagic backscatter (Figure 9).
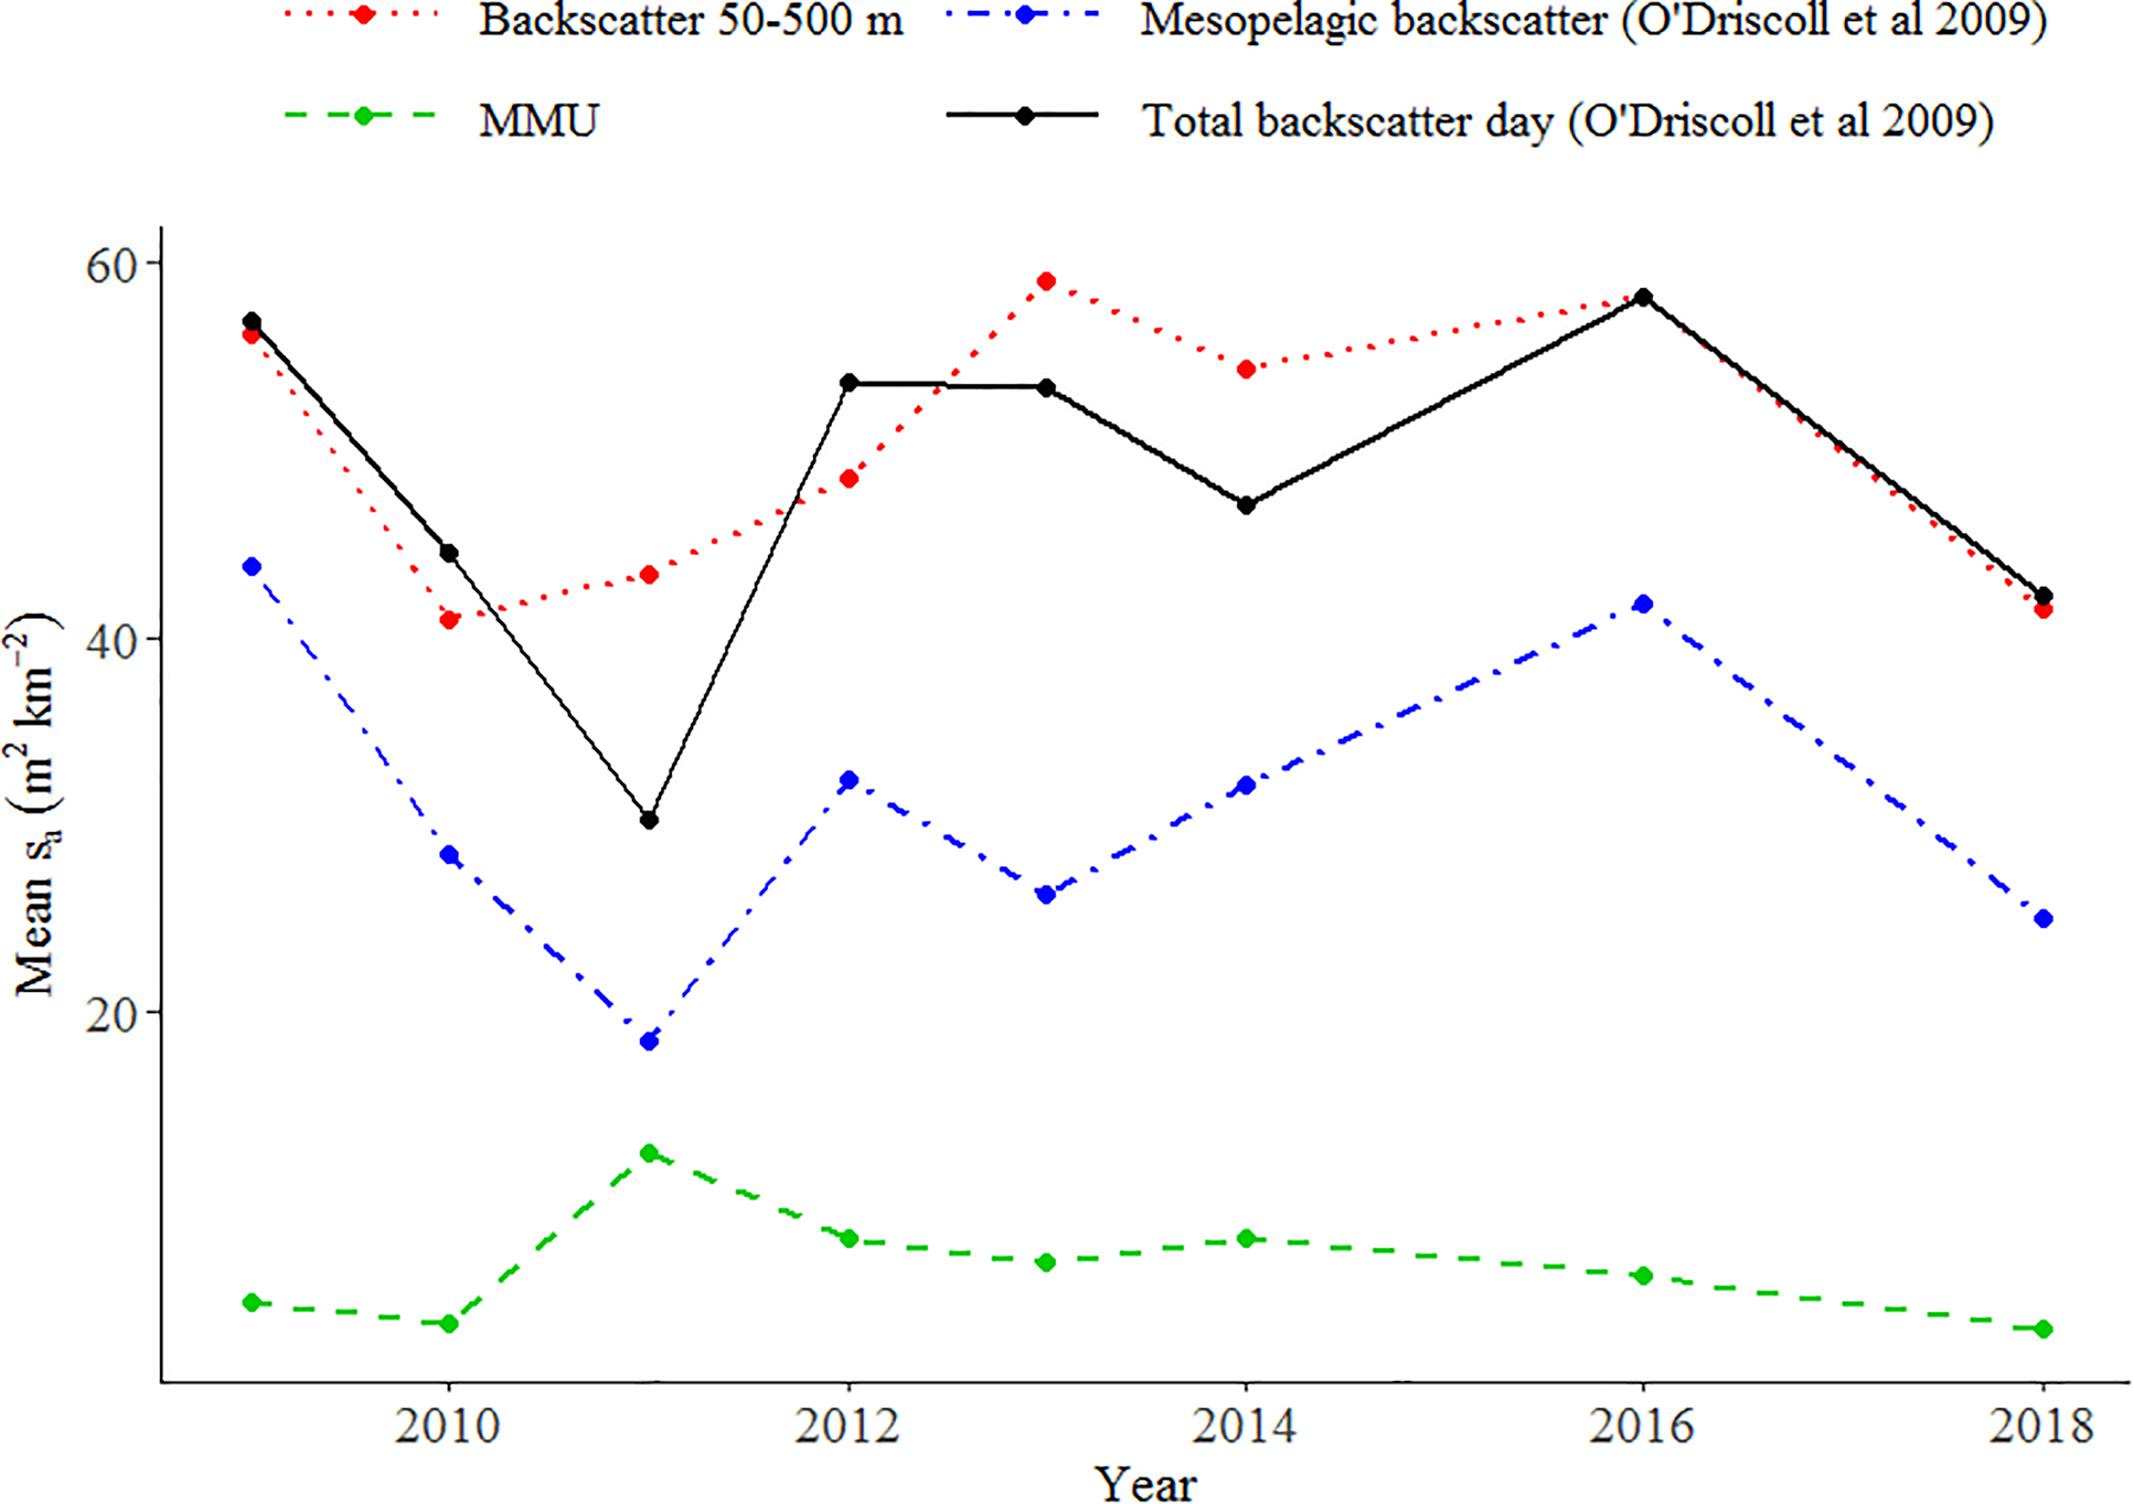
Figure 9. Comparison of the relative indices of mesopelagic fish abundance (acoustic backscatter sa in m2 km–2) obtained from our study with those from Stevens et al. (2018) using the methodology of O’Driscoll et al. (2009) on the Chatham Rise.
Discussion
In this paper, we developed a methodology for detecting and classifying acoustic marks of micronekton and described its implementation using recently developed open source software for processing acoustic data. We defined and implemented a classification tree model for five classes of mesopelagic fish marks and euphausiids, and applied it in a semi-automated manner to a time series of acoustic data to monitor temporal and spatial changes in the mid-trophic levels on the Chatham Rise east of New Zealand. WC backscatter associated with mesopelagic fish marks varied between years but was reasonably stable, while backscatter associated with M. australis appeared to decline from 2011. Backscatter attributed to euphausiids showed a significant negative trend between 2009 and 2018.
Model Performance
The methodology presented here allowed us to detect, classify, and study changes in acoustic backscatter associated to micronekton using a time series of acoustic data on the Chatham Rise. The classification tree was successful at classifying MMU and EUP in the validation dataset and produced plausible trends of relative abundance for these mark classes on the trawl survey time series; however, it failed to classify LHE or other species. This failure is likely due to a combination of factors. First, compared to other mark classes, there were few marks that we could confidently assign to LHE in the training dataset. Second, in the training dataset we used the school detection tool within a manually defined screen selection around the trawl path to detect and assign marks into the LHE class, preventing the inclusion of regions from nearby marks with different acoustic properties. This approach was impractical for the validation and trawl survey time series datasets; therefore, the school detection was applied to the whole echogram; leading to the definition of large regions that included different mark classes or expanded over a wide vertical range. For example, often the model failed to classify LHE on the validation dataset although the species was one of the three dominant species in the catch, and as a result unclassified marks (e.g., U1 or U3 Supplementary Table 10) had high percentage of backscatter associated to them. Additionally, Escobar-Flores et al. (unpublished data) demonstrated that relatively small sizes of LHE are able to produce resonance scattering at 38 kHz at depths >300 m; therefore, it is possible that frequency response of some deep LHE marks resembled a U1 or U3-type curve (Supplementary Figure 2). To improve our classification tree for LHE, we need more mark ID trawls at depth and to ground-truth the model TS for the species to confirm the predicted resonance scattering. In analysis, we could also attempt to restrict the horizontal extend of the school detection algorithm to stop it from defining large regions, and instead classify backscatter using a grid (i.e., depth by time or distance).
Mark Classification
Our ability to classify as much of the WC backscatter into species was hindered by the limited number of trawls and the diverse composition of the catch from the mark ID trawls. Likewise, the classification of fish species that exhibit similar frequency response curves based on narrow band multi-frequency data is not straightforward (De Robertis et al., 2010). The biological information in our study was collected with a mesopelagic mid-water trawl with a headline height of 12–15 m and a door spread of around 140–160 m, which remains open through the WC as it descends to the depth where the targeted acoustic marks for mark identification were observed on the echograms. Traditional trawling does not provide a fine spatial scale resolution causing the loss of crucial information to classify discrete acoustic layers into species (Kracker, 1999; Rosen and Christian, 2013). This issue is accentuated when the sampling aims to collect biological information from one of the DSLs commonly observed in open ocean ecosystems, which are distributed vertically at different depth ranges. To overcome this limitation, we need to move away from traditional single cod end trawl nets to use trawls with opening-closing mouths or cod ends, or in-trawl stereo cameras, or combine different types or trawls, or use acoustic and optic sampling (AOS) devices mounted on trawls and combine their information (Pearcy, 1983; Rosen and Christian, 2013; Kwong et al., 2018).
Sampling of micronekton is still a topic that requires further research and development, as all sampling methods have their particular biases (often referred to as catchability). We acknowledge that our assumption of equal catchability, based on the use of a consistent gear and assuming that the species’ behavior and vertical distribution are unlikely to have changed between voyages, is a great simplification. Small and/or gelatinous organisms may not be retained by trawls (e.g., Gartner et al., 1989; Peña et al., 2014), and larger fish may avoid nets (Davison et al., 2015). This is one reason why our training dataset was small. We aimed to minimize the uncertainty around the mark identification trawls by using only trawls when one species dominated for training, hoping that the effect of catchability was therefore reduced. Likewise, because we believe that is not possible to sample discrete DSLs at >400 m depth, formed by multiple species of mesopelagic fish, without contamination from shallower acoustic marks, deeper trawls were not included in the training dataset. A simple approach to account for trawl capture efficiency on mesopelagic fishes seems unlikely (e.g., Kaartvedt et al., 2012). The most promising approach would be to combine different sampling gears and allow sufficient replication.
The unidentified mark classes most likely consisted of a combination of mesopelagic fish species, mainly myctophids. Most of the mark ID trawls used in our training dataset were shallow (mean depth 240 m, only one was deeper than 400 m), with MMU and LHE frequently the dominant species. This contrasted with the mark ID trawls used in the validation dataset that were on average deeper (mean depth about 320 m). These trawls were dominated by different species of mesopelagic fish, which we were not able to isolate and characterize based on their frequency response, as previously concluded by Gauthier et al. (2014). Modeling work on the target strength (TS) of mesopelagic fish on the Chatham Rise showed that D. danae (DIA), Electrona carlsbergi (ELC), and unidentified species of the genus Protomyctophum of varying sizes are capable of resonance scattering at 38 kHz over a wide range depths (Escobar-Flores et al., unpublished data); therefore, they would fit the frequency response curves of mark classes U1 and U3 we derived from the multifrequency data. Gauthier et al. (2014) characterized the vertical distribution of DIA and ELC and their depth range overlapped with the 50–500 m range of this study. Although at this stage we could not describe the composition of mark classes U1 and U3, the classification of most of the backscatter in the top 500 m into five groups proved to be useful.
We assumed that all backscatter classified at 38 kHz was associated with mesopelagic fish; however, we acknowledge that some of the backscatter may also come from demersal fish species that have gas-filled swim-bladders (e.g., hoki). The Chatham Rise is the main nursery ground of hoki (M. novaezelandiae) and one of the main adult feeding areas (Livingston et al., 2002). The frequency response curves of the unidentified mark classes (e.g., U1) were consistent with those of mesopelagic fish (Supplementary Figure 2). However, it is likely that these marks consisted of a mix of mesopelagic fish and larger fish species whose response curves are characteristic of swim-bladder fish scattering in the geometric region in our frequency range (i.e., frequency independent between 18 and 200 kHz), resulting in a mesopelagic fish type curve. O’Driscoll et al. (2009) developed a methodology for estimating the daytime abundance of mesopelagic fish from acoustics removing proportion of the backscatter that remains deeper than 200 m at night. The comparison between our total abundance index and those obtained by Stevens et al. (2018) using O’Driscoll et al. (2009) (Figure 9) showed that the backscatter trends were similar, indicating that either the biomass of hoki has remained stable over time [not supported by the trawl estimates (Stevens et al., 2018)], or that the methodology developed by O’Driscoll et al. (2009) to remove separate hoki from mesopelagic fish might not be appropriate, as it does not consider changes in the scattering properties of mesopelagic fish between day and night.
Time Series of Backscatter, a Relative Index of Micronekton Abundance
It has been demonstrated that gas-bearing mesopelagic organisms (mainly fish and physonect siphonophores) are capable of producing resonance scattering at 38 kHz, which prevents us from interpreting backscatter as a proportional measurement of biomass (Peña et al., 2014; Davison et al., 2015; Kloser et al., 2016; Proud et al., 2018; Escobar-Flores et al., unpublished data). Our multi-frequency analysis showed that within the vertical range we observed in the training dataset, MMU and LHE were not resonant at 38 kHz, though it has been shown that these species can resonate when sizes and depth (greater than those observed here) act as confounded effects (Escobar-Flores et al., unpublished data). Consequently, the backscatter classified by the model as MMU can be interpreted as an index of abundance and be used for tracking relative changes over time. The interpretation of the time series of backscatter associated with unidentified mark classes is more problematic. The frequency response curve of these marks suggests that at least some of the organism making us these marks produce resonance scattering, and the changes over time can represent changes in abundance, size, species, or even organisms (Escobar-Flores et al., 2018; Proud et al., 2018), that might reflect changes in the ecosystem or the entry of new age classes into the populations of mesopelagic fish. Disentangling all these factors is difficult without the timely and appropriate sampling. The backscatter of the unidentified mark classes still provides a relative index since we are using the same methodology, and in the long term might produce more useful information.
Our results suggest a decreasing trend in abundance of MMU on the Chatham Rise between 2011 until 2019. This is a key prey species for commercial species on the Chatham Rise (e.g., Dunn, 2009; Connell et al., 2010); therefore, a decrease on its abundance might have a negative ecological and economic impact in the region. However, because this species is short-lived, with a life span of about 2 years (Clarke, 1982; Fujino et al., 2013), the peaks in abundance could represent strong year classes and a longer time series might be needed to detect consistent declines in the population. For example, a time series of >20 years provided evidence of effects of climatic regime shifts on the abundance of Maurolicus japonicus in the Japan Sea (Fujino et al., 2013).
The significant decreasing trend on the abundance of euphausiids we observed could be related to environmental factors (e.g., temperature) or productivity in the region. The sea surface temperature (SST) on the Chatham Rise has increased significantly since 1981, with a record SST registered between December 2017 and January 2018 which has been described as a “heat wave” (Pinkerton et al., 2018). Conversely, chlorophyll a showed a decreasing trend on the Chatham Rise between 2012 and 2016 and has increased over the last 2 years, consistent under warmer conditions and more stratified upper ocean with lower nutrient input from subsurface waters causing oligotrophic conditions (Legendre and Rassoulzadegan, 1996). By refining our classification tree and continuing to monitor the mid-trophic level organisms (including euphausiids) on the Chatham Rise, we will be able to detect regimes changes or consistent long-term patterns in the pelagic ecosystem.
Considerations Around Sensitivity Analysis
The sensitivity analyses showed that the school detection settings used are crucial for maximizing positive true detection rate as a measure of model performance. The school detection on ESP3 relies on several parameters; however, we believe that for our study adjusting only the minimum height and threshold in the sensitivity analyses was generally appropriate (except for LHE), as we set relatively short linking distances and school lengths, to detect layers individually and include small schools. We encourage potential users of this methodology and ESP3 to test a combination of settings and perform sensitivity analyses, since the results can vary considerably.
In our validation dataset, we were only able to provide rates for when the model is correct in predicting the occurrence of a mark class, but we were unable to inform false positive rates that provide an index of how often the model predicts a species when in fact the species was absent (known as type I error). The volume sampled with acoustics is much greater than the volume sampled with a trawl; therefore, if a species is absent in the catch it does not necessarily mean that a species could not be detected acoustically. Additionally, if we consider the known catchability, selectivity and avoidance of trawls when sampling micronekton, this becomes even more difficult to evaluate. To provide estimates of false positive rates, we will need to sample thoroughly the whole WC using different sampling gears and allowing repetitions. Even though this is feasible, it is practically inconvenient since time at sea and funding for this type of work is limited.
Free Tool Available for Monitoring Different Ecosystems
Opportunistic data collection using ships of opportunity is a very common practice, and the volume of acoustic data continues to grow with the introduction of the Simrad EK80 broadband systems. Semi-automated methodologies for processing and echo-integrating large amounts of acoustic data have been developed under programs such as the Integrated Observing System (IMOS) and the Southern Ocean Network of Acoustics (SONA); however, the implementation of automated mark classification has not been part of these initiatives.
In our study, we developed, implemented, and made available a methodology for studying micronekton communities in pelagic ecosystems using an open source software for processing acoustic data. ESP3 was developed mainly for processing large number of files of fisheries acoustic surveys, with attention to reproducibility, consistency, and efficiency through scripting. The scripting capability allowed us to process almost 10 years of acoustic data from the hoki trawl survey, automatizing the application of algorithms for removing unwanted signal and noise, which minimizes the subjective decision making during data processing; the application of classification trees and echo-integration process. Evolving from its core functions and application in fisheries, though this study ESP3 has become a more versatile tool that can encourage not only more ecological studies using single and multi-frequency data, but also the automated processing of large datasets for establishing time series of acoustic data that rare and highly needed.
Future Work
Future challenges are to continue collecting biological and acoustic information to refine our classification tree, improve our understanding of the composition of DSL to the level of species or assemblages of species, develop a methodology for subtracting backscatter from non-mesopelagic fish from scattering layers, and replicate the study in other regions where similar time series of acoustic data are available to monitor and detect change in the ecosystems.
Data Availability
The datasets generated for this study are available on request to the corresponding author.
Ethics Statement
All fish used in this research were collected by a mid-water research trawl under special permit for the New Zealand Ministry for Primary Industries. Special permits were granted under Section 97 of the Fisheries Act 1996 to authorize taking aquatic life for the purpose of investigative research. Special permits by research voyage: Ministry of Fisheries Special Permit 421 (Voyage TAN1116), Ministry of Fisheries Special Permit 505 (Voyage TAN1116), and Ministry of Fisheries Special Permit 597 (Voyages TAN1511 and TAN1516). There were no ethical considerations under this special permit. No fish were CITES listed.
Author Contributions
PE-F, YL, and RO were responsible for concept and design of the study. PE-F performed the acoustic data and statistical analysis, and wrote the manuscript with contributions from YL and RO. YL developed and implemented the processing tools and capabilities on the software ESP3 for data analyses. All authors contributed to the manuscript revision, and read and approved the submitted version of the manuscript.
Funding
This work was funded by the National Institute of Water and Atmospheric Research (NIWA) Strategic Science Investment Fund Coasts and Oceans Program 4 “Structure and Function of Marine Ecosystems.”
Conflict of Interest Statement
The authors declare that the research was conducted in the absence of any commercial or financial relationships that could be construed as a potential conflict of interest.
Supplementary Material
The Supplementary Material for this article can be found online at: https://www.frontiersin.org/articles/10.3389/fmars.2019.00507/full#supplementary-material
Footnotes
References
Allum, L. L., and Maddigan, F. W. (2012). Unusual stability of diet of the New Zealand fur seal (Arctocephalus forsteri) at Banks Peninsula, New Zealand. New Zeal. J. Mar. Freshw. Res. 46, 91–96. doi: 10.1080/00288330.2011.604336
Atkinson, A., Siegel, V., Pakhomov, E., and Rothery, P. (2004). Long-term decline in krill stock and increaseinsalps within the Southern Ocean. Nature 432, 100–103. doi: 10.1038/nature02996
Barange, M. (1994). Acoustic identification, classification and structure of biological patchiness on the edge of the Agulhas Bank and its relation to frontal features. South Afr. J. Mar. Sci. 14, 333–347. doi: 10.2989/025776194784286969
Bivand, R., and Lewin-Koh, N. (2015). maptools: Tools for Reading and Handling Spatial Objects. R package version 0.8–34.
Boren, L. (2010). Diet of New Zealand fur Seals (Arctocephalus forsteri): a Summary. Wellington: Departement of Conservation.
Boyd, J., and Banzhaf, S. (2007). What are ecosystem services? The need for standardized environmental accounting units. Ecol. Econ. 63, 616–626. doi: 10.1016/j.ecolecon.2007.01.002
Breiman, L., Friedman, J. H., Olshen, R. A., and Stone, C. J. (1984). Classification and Regression Trees. Belmont, CA: Wadsworth International Group.
Chavez, F. P., Ryan, J., Lluch-cota, S. E., and Miguel, N. (2003). From anchovies to sardines and back: multidecadal change in the Pacific ocean. Science 299, 217–221. doi: 10.1126/science.1075880
Checkley, D. M., Asch, R. G., and Rykaczewski, R. R. (2017). Climate, anchovy, and sardine. Annu. Rev. Mar. Sci. 9, 469–493. doi: 10.1146/annurev-marine-122414-033819
Clarke, T. A. (1982). Distribution, Growth, and Reproduction of the Lightfish Maurolicus muelleri (Sternoptychidae) off South-east Australia. CSIRO Marine Laboratories Report No145. Cronulla, NSW.
Connell, A., Dunn, M., and Forman, J. (2010). Diet and dietary variation of New Zealand hoki Macruronus novaezelandiae. New Zeal. J. Mar. Freshw. Res. 44, 289–308.
Costanza, R., d’Arge, R., de Groot, R., Farber, S., Grasso, M., Hannon, B., et al. (1997). The value of the world’s ecosystem services and natural capital. Nature 387, 253–260. doi: 10.1126/sciadv.1601880
Davison, P. C., Checkley, D. M., Koslow, J. A., and Barlow, J. (2013). Carbon export mediated by mesopelagic fishes in the northeast Pacific Ocean. Prog. Oceanogr. 116, 14–30. doi: 10.1016/j.pocean.2013.05.013
Davison, P. C., Koslow, J. A., and Kloser, R. J. (2015). Acoustic biomass estimation of mesopelagic fish: backscattering from individuals, populations, and communities. ICES J. Mar. Sci. 72, 1413–1424. doi: 10.1093/icesjms/fsv023
De Robertis, A., and Higginbottom, I. (2007). A post-processing technique to estimate the signal-to-noise ratio and remove echosounder background noise. ICES J. Mar. Sci. 64, 1282–1291. doi: 10.1093/icesjms/fsm112
De Robertis, A., McKelvey, D. R., and Ressler, P. H. (2010). Development and application of an empirical multifrequency method for backscatter classification. Can. J. Fish. Aquat. Sci. 67, 1459–1474. doi: 10.1139/f10-075
De’ath, G., and Fabricius, K. E. (2000). Classification and regression trees: a powerful yet simple technique for ecological data analysis. Ecology 81, 3178–3192. doi: 10.1890/0012-9658(2000)081
Demer, D. A. (2004). An estimate of error for the CCAMLR 2000 survey estimate of krill biomass. Deep Sea Res. Part II Top. Stud. Oceanogr. 51, 1237–1251. doi: 10.1016/j.dsr2.2004.06.012
Demer, D. A., Berger, L., Bernasconi, M., Bethke, E., Boswell, K., Chu, D., et al. (2015). Calibration of Acoustic Instruments. ICES Cooperative Research Report No: 326. Copenhagen.
Doonan, I. J., Coombs, R. F., and Mcclatchie, S. (2003). The absorption of sound in seawater in relation to the estimation of deep-water fish biomass. ICES J. Mar. Sci. 60, 1047–1055. doi: 10.1016/s1054-3139(03)00120-6
Dunn, M. R. (2009). Feeding habits of the ommastrephid squid Nototodarus sloanii on the Chatham Rise, New Zealand. New Zeal. J. Mar. Freshw. Res. 43, 1103–1113. doi: 10.1080/00288330.2009.9626533
Escobar-Flores, P. C., O’Driscoll, R. L., and Montgomery, J. C. (2018). Spatial and temporal distribution patterns of acoustic backscatter in the New Zealand sector of the Southern Ocean. Mar. Ecol. Prog. Ser. 592, 19–35. doi: 10.3354/meps12489
Fernandes, P. G. (2009). Classification trees for species identification of fish-school echotraces. ICES J. Mar. Sci. 66, 1073–1080. doi: 10.1093/icesjms/fsp060
Fujino, T., Goto, T., Shimura, T., Yasuma, H., Tian, Y., Kidokoro, H., et al. (2013). Decadal variation in egg abundance of a mesopelagic fish, maurolicus japonicus, in the japan sea during 1981-2005. J. Mar. Sci Technol. 21, 58–62.
Gartner, J. V., Conley, W. J., and Hopkins, T. L. (1989). Escapement by fishes from midwater trawls: a case study using lanternfishes (Pisces: Myctophidae). Fish. Bull. 87, 213–222.
Gauch, H. G. (1982). Multivariate Analysis in Community Ecology. Cambridge: Cambridge University Press.
Gauthier, S., Oeffner, J., and O’Driscoll, R. L. (2014). Species composition and acoustic signatures of mesopelagic organisms in a subtropical convergence zone, the New Zealand Chatham Rise. Mar. Ecol. Prog. Ser. 503, 23–40. doi: 10.3354/meps10731
Gjøsaeter, J., and Kawaguchi, K. (1980). A review of the world resources of mesopelagic fish FAO Fisheries Technical Paper No 193, Rome: Food And Agriculture Organization Of The United Nations.
Godø, O. R., Patel, R., and Pedersen, G. (2009). Diel migration and swimbladder resonance of small fish: some implications for analyses of multifrequency echo data. ICES J. Mar. Sci. 66, 1143–1148. doi: 10.1093/icesjms/fsp098
Greenlaw, C. F. (1979). Acoustical estimation of zooplankton populations. Limnol. Oceanogr. 24, 226–242. doi: 10.4319/lo.1979.24.2.0226
Heath, R. (1985). A review of the physical oceanography of the seas around New Zealand-1982. New Zeal. J. Mar. Freshw. Res. 19, 79–124. doi: 10.1080/00288330.1985.9516077
Horn, P. L., Forman, J. S., and Dunn, M. R. (2013). Moon phase influences the diet of southern Ray’s bream Brama australis. J. Fish. Biol. 82, 1376–1389. doi: 10.1111/jfb.12090
Irigoien, X., Klevjer, T. A., Røstad, A., Martinez, U., Boyra, G., Acuña, J. L., et al. (2014). Large mesopelagic fishes biomass and trophic efficiency in the open ocean. Nat. Commun. 5:3271. doi: 10.1038/ncomms4271
Kaartvedt, S., Staby, A., and Aksnes, D. L. (2012). Efficient trawl avoidance by mesopelagic fishes causes large underestimation of their biomass. Mar. Ecol. Prog. Ser. 456, 1–6. doi: 10.3354/meps09785
Kloser, R. J., Ryan, T. E., Keith, G., and Gershwim, L. (2016). Deep-scattering layer, gas-bladder density, and size estimates using a two-frequency acoustic and optical probe. ICES J. Mar. Sci. 73, 2037–2048. doi: 10.1093/icesjms/fsv257
Kloser, R. J., Ryan, T. E., Young, J. W., and Lewis, M. E. (2009). Acoustic observations of micronekton fish on the scale of an ocean basin: potential and challenges. ICES J. Mar. Sci. 66, 998–1006. doi: 10.1093/icesjms/fsp077
Koubbi, P., Moteki, M., Duhamel, G., Goarant, A., Hulley, P.-A., O’Driscoll, R. L., et al. (2011). Ecoregionalization of myctophid fish in the Indian sector of the Southern Ocean: results from generalized dissimilarity models. Deep Sea Res. Part II Top. Stud. Oceanogr. 58, 170–180. doi: 10.1016/j.dsr2.2010.09.007
Kracker, L. M. (1999). The geography of fish: the use of remote sensing and spatial analysis tools in fisheries research. Prof. Geogr. 51, 440–450. doi: 10.1111/0033-0124.00178
Kwong, L. E., Pakhomov, E. A., Suntsov, A. V., Seki, M. P., Brodeur, R. D., Pakhomova, L. G., et al. (2018). An intercomparison of the taxonomic and size composition of tropical macrozooplankton and micronekton collected using three sampling gears. Deep Res. Part I Oceanogr. Res. Pap. 135, 34–45. doi: 10.1016/j.dsr.2018.03.013
Ladroit, Y. (2017). ESP3: an Open-Source Software for fisheries Acoustic Data Processing. Available at: https://bitbucket.org/echoanalysis/esp3 (accessed March, 2018).
Lam, V., and Pauly, D. (2005). Mapping the global biomass of mesopelagic fishes. Sea Around U.S. Proj. Newsl. 30:4.
Lê, S., Josse, J., and Husson, F. (2008). FactoMineR: an R package for multivariate analysis. J. Stat. Softw. 25, 253–258.
Legendre, L., and Rassoulzadegan, F. (1996). Food-web mediated export of biogenic carbon in oceans: hydrodynamic control. Mar. Ecol. Prog. Ser. 145, 179–193. doi: 10.3354/meps145179
Lehodey, P., Murtugudde, R., and Senina, I. (2010). Bridging the gap from ocean models to population dynamics of large marine predators: a model of mid-trophic functional groups. Prog. Oceanogr. 84, 69–84. doi: 10.1016/j.pocean.2009.09.008
Livingston, M. E., Bull, B., and Stevens, D. W. (2002). Migration Patterns During the Life-Cycle of hoki (Macruronus novaezelandiae): an Analysis of Trawl Survey Data in New Zealand Waters 1991–2002. Final Research Report for Ministry of Fisheries Research Project HOK2000/01 Objective 6. Wellington.
MacDiarmid, A. B., Law, C. S., Pinkerton, M., and Zeldis, J. (2013). “New Zealand Marine Ecosystem Services,” in Ecosystem services in New Zealand – conditions and trends, ed. J. R. Dymond (Lincoln: Manaaki Whenua Press), 238–253.
McClatchie, S., and Dunford, A. (2003). Estimated biomass of vertically migrating mesopelagic fish off New Zealand. Deep Sea Res. Part I Oceanogr. Res. Pap. 50, 1263–1281. doi: 10.1016/s0967-0637(03)00128-6
Murphy, E. J., Watkins, J. L., Trathan, P. N., Reid, K., Meredith, M. P., Thorpe, S. E., et al. (2007). Spatial and temporal operation of the Scotia Sea ecosystem: a review of large-scale links in a krill centred food web. Philos. Trans. R. Soc. B 362, 113–148. doi: 10.1098/rstb.2006.1957
Murphy, R. J., Pinkerton, M. H., Richardson, K. M., Bradford-Grieve, J. M., and Boyd, P. W. (2001). Phytoplankton distributions around New Zealand derived from SeaWiFS remotely-sensed ocean colour data. New Zeal. J. Mar. Freshw. Res. 35, 343–362. doi: 10.1080/00288330.2001.9517005
Nero, R. W., Magnuson, J. J., Brandt, S. B., Stanton, T. K., and Jech, J. M. (1990). Finescale biological patchiness of 70 kHz acoustic scattering at the edge of the Gulf Stream-EchoFront 85. Deep Sea Res. Part A Oceanogr. Res. Pap. 37, 999–1016. doi: 10.1016/0198-0149(90)90107-7
Nodder, S. D., Bowden, D. A., Pallentin, A., and Mackay, K. (2012). “Seafloor Habitats and Benthos of a Continental Ridge: Chatham Rise, New Zealand,” in Seafloor Geomorphology as Benthic Habitat. Geohab Atlas of Seafloor Geomorphic Features and Benthic Habitats, First, eds P. T. Harris, and E. K. Baker (London: Elsevier), 900.
O’Driscoll, R. L. (2003). Determining species composition in mixed-species marks: an example from the New Zealand hoki (Macruronus novaezelandiae) fishery. ICES J. Mar. Sci. 60, 609–616. doi: 10.1016/S1054-3139(03)00034-1
O’Driscoll, R. L., Gauthier, S., and Devine, J. A. (2009). Acoustic estimates of mesopelagic fish: as clear as day and night? ICES J. Mar. Sci. 66, 1310–1317. doi: 10.1093/icesjms/fsp015
O’Driscoll, R. L., Hurst, R. J., Dunn, M. R., Gauthier, S., and Ballara, S. L. (2011a). Trends in relative mesopelagic biomass using time series of acoustic backscatter data from trawl surveys. New Zealand Aquatic Environment and Biodiversity Report 2011/76. Wellington.
O’Driscoll, R. L., Macgibbon, D., Fu, D., Lyon, W., and Stevens, D. W. (2011b). A review of hoki and middle depth trawl surveys of the Chatham Rise, January 1992–2010. New Zealand Fisheries Assessment Report 2011/47. Wellington.
Pearcy, W. G. (1983). Quantitative assessment of the vertical distributions of micronektonic fishes with opening/closing midwater trawls. Biol. Oceanogr. 2, 289–310.
Peña, M., Olivar, M. P., Balbín, R., López-Jurado, J. L., Iglesias, M., Miquel, J., et al. (2014). Acoustic detection of mesopelagic fishes in scattering layers of the Balearic Sea (western Mediterranean). Can. J. Fish. Aquat. Sci. 71, 1186–1197. doi: 10.1139/cjfas-2013-0331
Pinkerton, M., Sutton, P., and Wood, S. (2018). Satellite Indicators of Phytoplankton and Ocean Surface Temperature for New Zealand. Wellington: Ministry for the Environment.
Pinkerton, M. H. (2014). Ecosystem Modelling of the Chatham Rise. Wellington: National Institute of Water & Atmospheric Research Ltd.
Proud, R., Cox, M. J., and Brierley, A. S. (2017). Biogeography of the global Ocean’s Mesopelagic Zone. Curr. Biol. 27, 113–119. doi: 10.1016/j.cub.2016.11.003
Proud, R., Handegard, N. O., Kloser, R. J., Cox, M. J., and Brierley, A. S. (2018). From siphonophores to deep scattering layers: uncertainty ranges for the estimation of global mesopelagic fish biomass. ICES J. Mar. Sci. 76, 718–733. doi: 10.1093/icesjms/fsy037
Radchenko, V. I. (2007). Mesopelagic fish community supplies “biological pump”. Raffles Bull. Zool. 14, 265–271.
Roberts, C. D., Stewart, A. L., and Struthers, C. D. (eds) (2015). The fishes of New Zealand, Vol. 4. Wellington: Te Papa Press.
Robertson, D. A., Roberts, P. E., and Wilson, J. B. (1978). Mesopelagic faunal transition across the Subtropical Convergence east of New Zealand. New Zeal J Mar Freshw Res 12, 295–312. doi: 10.1080/00288330.1978.9515757
Robinson, C., Steinberg, D. K., Anderson, T. R., Arístegui, J., Carlson, C. A., Frost, J. R., et al. (2010). Mesopelagic zone ecology and biogeochemistry - A synthesis. Deep Res. Part II Top. Stud. Oceanogr. 57, 1504–1518. doi: 10.1016/j.dsr2.2010.02.018
Rosen, S., and Christian, J. (2013). DeepVision in-trawl imaging: Sampling the water column in four dimensions. Fish. Res. 148, 64–73. doi: 10.1016/j.fishres.2013.08.002
Scalabrin, C., Diner, N., Weill, A., Hillion, A., and Mouchot, M. C. (1996). Narrowband acoustic identification of monospecific fish shoals. ICES J. Mar. Sci. 53, 181–188. doi: 10.1006/jmsc.1996.0020
Schnute, J. T., Boers, N., and Haigh, R. (2017). PBSmapping: Mapping Fisheries Data and Spatial Analysis Tools. R package version 2.70.4.
Smetacek, V., and Nicol, S. (2005). Polar ocean ecosystems in a changing world. Nature 437, 362–368. doi: 10.1038/nature04161
Stevens, D. W., O’Driscoll, R. L., Ballara, S. L., and Schimel, A. C. G. (2018). Trawl survey of hoki and middle-depth species on the Chatham Rise, January 2018 (TAN1801). New Zealand Fisheries Assessment Report 2018/41. Wellington.
Sutton, P. (2001). Detailed structure of the subtropical front over Chatham Rise, east of New Zealand. J. Geophys. Res. 106, 31045–31056. doi: 10.1029/2000jc000562
Therneau, T., Atkinson, B., and Ripley, B. (2015). rpart: Recursive Partitioning and Regression Trees. R package version 4.1-10. Available at: http://CRAN.R-project.org/package=rpart (accessed April 12, 2019).
Keywords: micronekton, acoustics, food web, ESP3, Chatham Rise, classification trees, multi-frequency
Citation: Escobar-Flores PC, Ladroit Y and O’Driscoll RL (2019) Acoustic Assessment of the Micronekton Community on the Chatham Rise, New Zealand, Using a Semi-Automated Approach. Front. Mar. Sci. 6:507. doi: 10.3389/fmars.2019.00507
Received: 20 March 2019; Accepted: 31 July 2019;
Published: 28 August 2019.
Edited by:
Stelios Katsanevakis, University of the Aegean, GreeceReviewed by:
Kresimir Williams, Alaska Fisheries Science Center (NOAA), United StatesAna Lara-Lopez, University of Tasmania, Australia
Copyright © 2019 Escobar-Flores, Ladroit and O’Driscoll. This is an open-access article distributed under the terms of the Creative Commons Attribution License (CC BY). The use, distribution or reproduction in other forums is permitted, provided the original author(s) and the copyright owner(s) are credited and that the original publication in this journal is cited, in accordance with accepted academic practice. No use, distribution or reproduction is permitted which does not comply with these terms.
*Correspondence: Pablo Christian Escobar-Flores, pablo.escobar@niwa.co.nz