 Richard Hugh Bulmer1*
 Fabrice Stephenson1
 Hannah F. E. Jones2
 Michael Townsend2
 Jenny R. Hillman3
 Luitgard Schwendenmann4
 Carolyn J. Lundquist1,3
- 1Marine Ecology, National Institute of Water and Atmospheric Research, Hamilton, New Zealand
- 2Waikato Regional Council, Hamilton, New Zealand
- 3Institute of Marine Science, University of Auckland, Auckland, New Zealand
- 4School of Environment, University of Auckland, Auckland, New Zealand
Blue carbon ecosystems (including saltmarsh, mangrove, seagrass meadows, and other soft sediment habitats) play a valuable role in aquatic carbon dynamics and contribute significantly to global climate change mitigation. However, these habitats are undergoing rapid and accelerating shifts in extent due to climate change and anthropogenic impacts. Here, we demonstrate that blue carbon stocks vary across habitats and that cross-habitat subsidies of carbon contribute significantly to blue carbon stocks. Using a case study estuary from New Zealand, organic carbon stocks in above ground biomass and sediment to 100 cm varied significantly between habitat types, from saltmarsh (90 t ha–1), to mangrove (46 t ha–1), to seagrass (27 t ha–1) and unvegetated habitats (26 t ha–1). Despite being typically overlooked in blue carbon literature, unvegetated habitats contained the majority of estuarine carbon stocks when adjusted for their large extent within the estuary (occupying 68.4% of the estuarine area and containing 57% of carbon stocks). When carbon stocks were further refined based on δ13C and δ15N mixing model results, coastal vegetation (saltmarsh, mangrove, and seagrass) was found to provide important cross-habitat subsidies of carbon throughout the estuary, including contributing an estimated 41% of organic carbon within unvegetated sediments, and 51% of the total carbon stock throughout the estuary (yet occupying only 31.6% of the estuary). Given the connected nature of blue carbon ecosystems these findings illustrate the importance of considering the contribution and cross-habitat subsidies of both vegetated and unvegetated habitats to blue carbon stocks in estuaries. This provides critical context when assessing the impact of shifts in habitat distributions due to impacts from climate change and anthropogenic stressors.
Introduction
Increasing greenhouse gas emissions and associated impacts on global warming (IPCC, 2013) have led to an urgent need to identify and protect ecosystems with high carbon stock capacity (Canadell and Raupach, 2008). “Blue Carbon” ecosystems (including saltmarsh, mangrove, and seagrass meadows) are known to be hotspots of carbon storage, in many instances containing considerably higher amounts of carbon per unit area than terrestrial systems (McLeod et al., 2011; Bauer et al., 2013). Despite the value of blue carbon ecosystems, they are undergoing rapid and accelerating shifts in extent due anthropogenic stressors (such as resource extraction, dredging, reclamation, declamation, catchment management influencing downstream inputs of sediments, nutrients, and other pollutants) and climate change (Waycott et al., 2009; Polidoro et al., 2010; Deegan et al., 2012). These shifts in habitat extent have potentially negative consequences for ecological and environmental health (Donato et al., 2011; McLeod et al., 2011; Fourqurean et al., 2012; Pendleton et al., 2012; Bauer et al., 2013). Therefore, our ability to assess and predict how changes in habitat distributions may impact carbon storage is critical.
Most studies investigating the impact of habitat loss measure stocks in a single habitat in isolation (e.g., mangroves or saltmarsh), without measurements in adjacent habitat types which may replace or be replaced (Donato et al., 2011; Fourqurean et al., 2012; Pendleton et al., 2012). Without understanding stocks across habitats, it is difficult to accurately estimate how changes in habitat types may affect carbon stocks at the estuarine level (i.e., what happens to stocks if mangrove replaces mudflat habitat, and vice versa). This lack of estuarine level approach is compounded by a lack of studies investigating the primary sources of organic matter within habitats (to attribute the proportion of the carbon received from that habitat or the carbon subsidy provided by other habitat types). As carbon within habitats is derived from both in situ production as well as imported from external sources (such as estuarine detritus, terrestrial/riverine, and oceanic input), it is also important to consider the relative contribution of different carbon sources. This is important as organic matter from one habitat is not simply contained within the habitat of origin, and instead may contribute to multiple habitats (Canuel and Hardison, 2016; Chen et al., 2017).
The aim of this study is to: (1) quantify carbon stocks within and across a range of estuarine habitats; (2) quantify carbon sources and cross-habitat carbon exchange; and (3) extrapolate values to illustrate how changes in habitat distributions may impact carbon stocks across an estuary.
Materials And Methods
This study was conducted at Tairua estuary, a barrier-enclosed lagoon located on the east coast of the North Island, New Zealand, during May–June 2016. The total estuary area is 660 ha, which is dominated by unvegetated sand and mudflats, occupying 451.5 ha (unvegetated intertidal 320 ha, unvegetated subtidal 131.5 ha). Saltmarsh (Juncus kraussii – dominant species) occupy 41.7 ha, mangroves 36.1 ha (Avicennia marina – single species), and seagrass 130.7 ha (Zostera muelleri – single species) (Needham et al., 2013). The maximum tidal range within the estuary is 1.8 m.
Sampling was undertaken at four sites throughout the estuary: Tairua Upper, Tairua Mid, Pauanui, Tairua Entrance (Figure 1). At each site a transect was established running from the upper to the lower intertidal, covering a range of estuarine habitats (salt marsh, mangrove, seagrass, unvegetated intertidal sand-, and mud-flats). Three sampling points were established within each habitat along each transect, positioned approximately equidistantly along the transect depending on the length of the habitat covered.
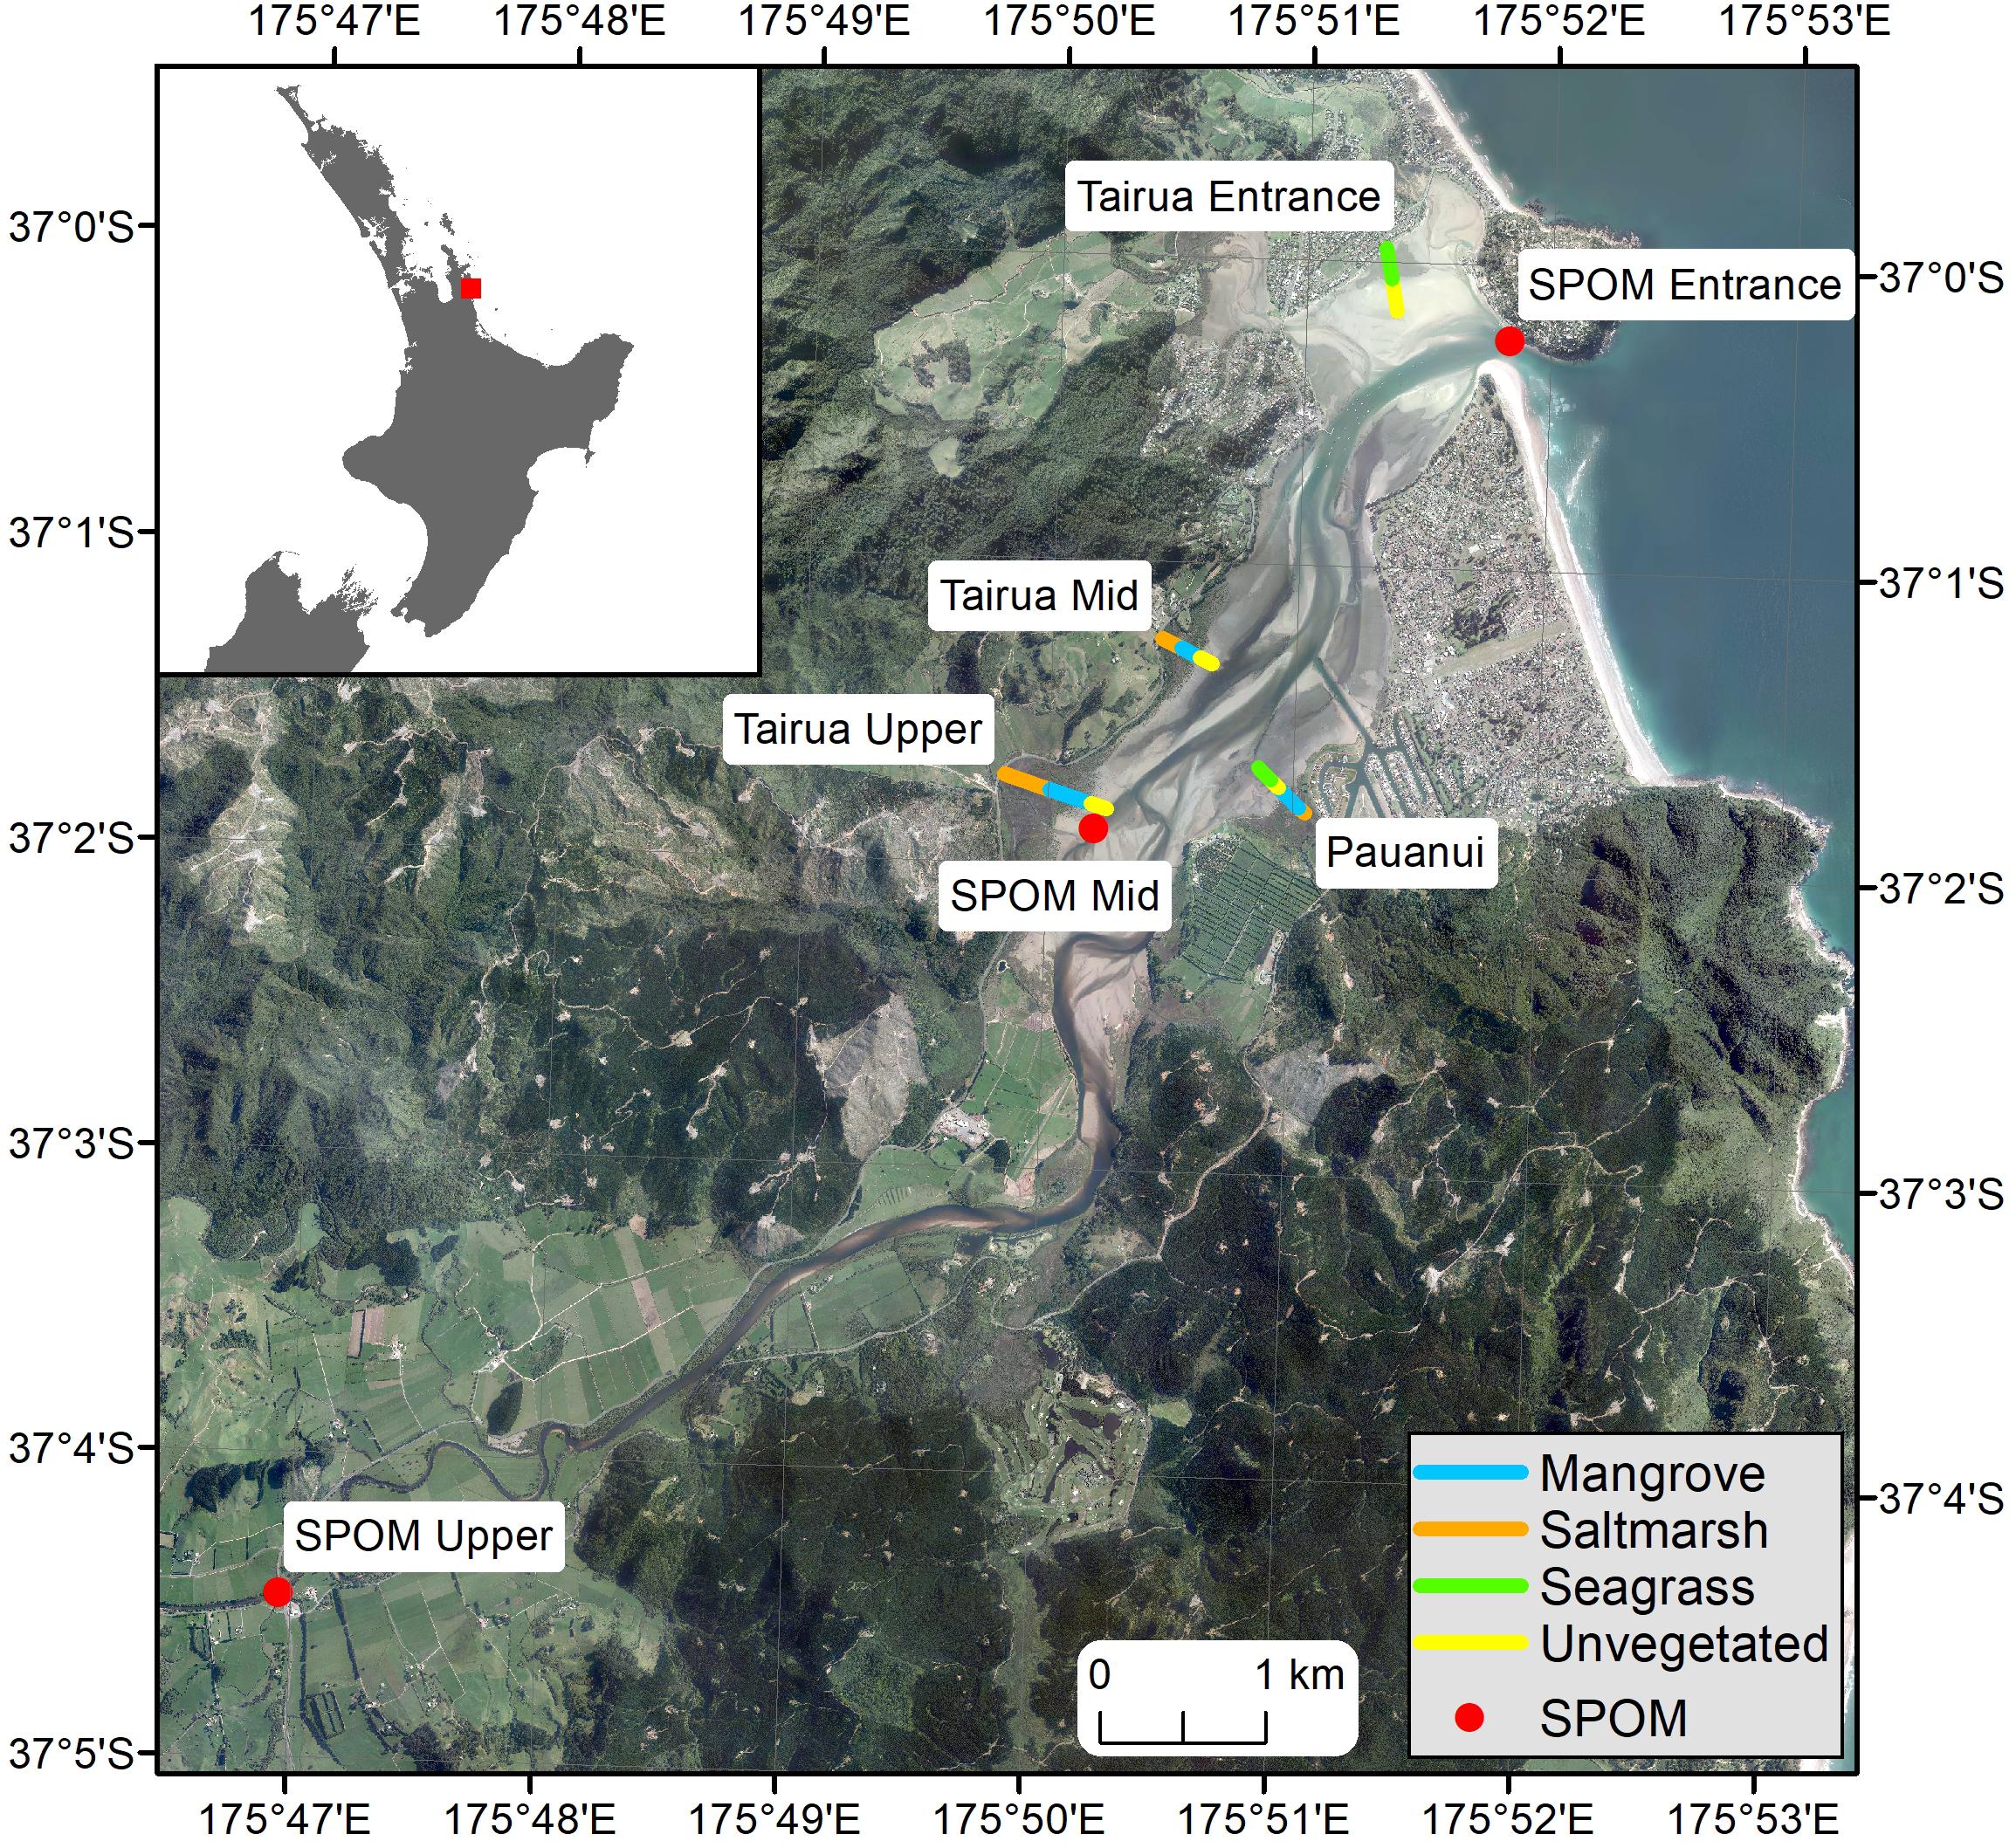
Figure 1. Map of Tairua estuary, showing location and name of transects and SPOM collection points, color coded by habitat type. Orange, Saltmarsh; Blue, Mangrove; Green, Seagrass; Yellow, Unvegetated; Red, SPOM, Suspended Particulate Organic Matter collection point.
At each sampling point within saltmarsh, mangrove, and seagrass habitat, a suite of measures were collected to estimate above ground biomass. Within saltmarsh, two 0.25 × 0.25 m quadrats were haphazardly placed and the number of individual shoots and maximum height of shoots was recorded. The saltmarsh shoots within one of the two quadrats were also removed just above the sediment surface and dried at 60°C for 7 days to estimate dry weights. Linear relationships were developed between the number of shoots and maximum shoot height and used to estimate dry weight for the remaining quadrats {Ln [above ground biomass g DW m2] = 3.08 - [2.61 × Ln (number of shoots m2)] + [2.13 × Ln (average shoot height)]; r2 = 0.7, p < 0.001}. Saltmarsh dry weight was converted to carbon stocks based on an estimated carbon concentration of 32.17% for Juncus kraussii shoots (see section “Organic Carbon Sources”). Within mangrove habitat, the point-centered quarter method was used to measure height, circumference at 30 cm height, and distance to the closest four trees. Above ground mangrove biomass was estimated using the field based tree measures and allometric equations (Bulmer et al., 2016). Seagrass was collected in root biomass cores (as detailed in the section below) and above ground and belowground biomass was separated to estimate above ground biomass. Seagrass biomass was converted to carbon stocks based on an estimated carbon concentration of 21.80% for Zostera muelleri blades (see section “Organic Carbon Sources”).
A sediment core (piston corer; 3.8 cm diameter to a depth of 100 cm) and root biomass core (10 cm diameter to a depth of 10 cm) were collected at each sampling point within each habitat along each transect. Each sediment core was separated into depths of 0–2 cm, 2–10 cm, and then at 10 cm intervals, and used to measure sediment bulk density and C concentrations throughout the sediment column.
Bulk Density, Carbon Concentration
Samples were dried (60°C for 7 days), weighed for bulk density, and then pulverized using mortar and pestle. Total carbon (C) concentration was determined using an elemental analyzer (TruSpec LECO CNS, Leco Corporation, St. Joseph, MI, United States). Two to three randomly samples from each core (out of a total of 7–10 samples per core, depending on core depth) were acidified to remove the inorganic C, along with all the samples collected for isotopic analysis (all dried sediment samples collected at the middle sampling point within each habitat along each transect – see section below) (Brodie et al., 2011). Briefly, 300 mg sediment was mixed with 0.5 ml de-ionized water and 1.5 ml of 20% HCl and then dried on a hot plate. Organic carbon concentration was then determined by running samples through the elemental analyzer, and relationships between total carbon and organic carbon for each core were used to estimate organic carbon across remaining non-acidified samples.
Grain Size and Chlorophyll a
The surface (0–2 cm) section of each sediment core was analyzed for grain size and Chlorophyll a. Grain size: The sample was homogenized and a subsample of ∼5 g of sediment was digested in ∼9% hydrogen peroxide until bubbling ceased (Day, 1965). The sediment sample was then wet sieved through 2,000, 500, 250, and 63 μm mesh sieves. All fractions were then dried at 60°C until a constant weight was achieved (fractions were weighed at ∼ 40 h and then again at 48 h). Grain size fractions were calculated as percentage weight of gravel/shell hash (>2,000 μm), coarse and very coarse sand (500–2,000 μm), medium sand (250–500 μm), fine and very fine sand (63–250 μm), silt and clay (≤62.9 μm). Chlorophyll a: The sample was frozen immediately after sampling. Within 1 month of sampling, the sample was freeze dried, weighed, then homogenized and a subsample (∼5 g) taken for analysis. Chlorophyll a was extracted by boiling the sediment in 90% ethanol, and the extract processed using a spectrophotometer (Shimadzu UV Spectrophotometer UV-1800). An acidification step was used to separate degradation products from Chlorophyll a (Moed and Hallegraeff, 1978; Hansson, 1988).
Root Biomass
Root biomass cores (10 cm diameter × 10 cm depth) were collected with sediment cores. Root biomass cores were sieved through a 500 μm mesh. All vegetative material was retained and oven dried at 60°C for ∼7 days until dry weight stabilized. Dry weights were then recorded. Root mass within seagrass samples was separated into above and below ground biomass prior to drying.
Organic Carbon Sources
Isotope analysis (δ13C, δ15N) was run on all dried sediment samples collected at the middle sampling point within each habitat along each transect. Potential carbon sources were also analyzed for isotopes (δ13C, δ15N), including a sample of leaves/blades and roots at each sample point within each habitat along each transect.
In addition, triplicate Suspended Particulate Organic Matter (SPOM) water samples were collected at three locations throughout the estuary (locations on the map), at 50 cm below the water surface. Upstream water samples were collected 2 h before low tide on the ebb (to capture terrestrial/freshwater source signatures), middle estuary samples were collected around low tide (to capture estuarine source signatures), and entrance samples were collected 2 h after low on the incoming tide (to capture estuarine/marine source signatures). The water samples were filtered (ashed Whatmann GF/F, 0.7 μm pore size) and isotopic signatures determined from the SPOM retained on the filters. Acid fumigation (HCL) was used to remove inorganics from the filters prior to isotopic analysis. To further expand the isotope source dataset, additional δ13C, δ15N source measurements from Tairua estuary collected in an earlier study by Savage et al. (2012) were pooled with isotope source data from this study [duplicate samples of saltmarsh, mangrove, and seagrass leaves/blades, and microphytobenthos (MPB) at four sites distributed throughout the estuary, and duplicate water samples from Tairua River at locations upstream and at the entrance to the harbor for analysis of SPOM]. MPB was sampled using opaque sediment cores (5 cm internal diameter) that were kept upright and in the dark for 6–8 h. A double layer of filter paper was placed on the sediment surface inside each core and the cores were exposed to overhead light for another 10 h, stimulating the MPB to migrate upwards into the filter paper. The filter paper containing MPB was frozen at −20°C and kept in darkness until analysis. See Supplementary Table S1 for a summary of combined isotope results.
Stable isotope analyses of acidified (HCL) sediment samples were analyzed on a Thermo Flash HT/EA coupled to a Thermo Delta V Advantage at the KU Leuven University stable isotope laboratory. Stable isotope analyses of isotope sources were carried out on a Delta V Plus continuous flow isotope ratio mass spectrometer linked to a Flash 2000 elemental analyzer using a MAS 200 R autosampler (Thermo Fisher Scientific, Bremen, Germany) at the NIWA Environmental Stable Isotope Laboratory (Wellington, New Zealand).
Data Analysis
PERMANOVA (PRIMER 7.0.12; Clarke and Gorley, 2015) was used to test for significant (p < 0.05) differences in sediment characteristics and carbon stocks between habitats and sites. PERMANOVA was also used to test for significant (p < 0.05) differences in sediment carbon stocks with depth for individual habitats. Pairwise post hoc tests were used to isolate differences between habitats, sites, and depth.
A Bayesian mixing model (JAGS – Just Another Gibbs Sampler) was used to estimate the contributions of potential sources of carbon to each of the habitat types (SIMMR package, Parnell and Inger, 2016, R v 3.4.1). To inform the mixing model, δ13C and δ15N values from individual sediment samples from each depth interval collected at the middle sampling point within each habitat along each transect were used. Means ± 1 SD δ13C and δ15N of potential sources were used (above and below ground samples of saltmarsh, mangrove, seagrass, MPB, and SPOM from the upper, middle and entrance of Tairua estuary). Below ground root samples were only used as a potential isotopic source in their respective habitats as the primary source of allochthonous carbon from vegetated habitats was assumed to be from above ground material (i.e., mangrove below ground material was only used as a potential carbon source in mangrove sediment). No adjustment was made for isotopic fractionation or concentration-dependency, with the assumption that diagenesis plays a relatively minor role altering the stable isotope composition of potential estuarine organic matter sources, and even if diagenetic effects were evident, this would not substantially change mixing model results (Khan et al., 2015; Greiner et al., 2016; Oreska et al., 2018).
Results
Sediment silt and clay content, Chlorophyll a, and bulk density varied significantly between habitats (Table 1) and sites (p < 0.05).
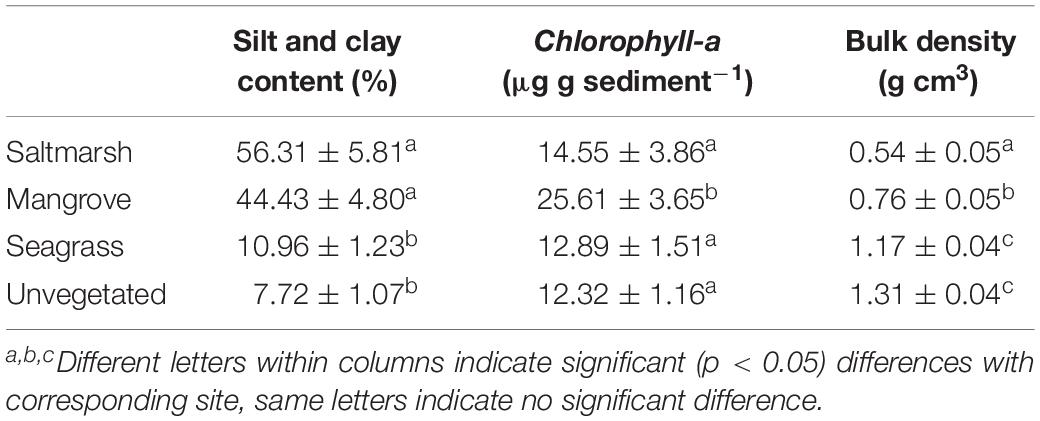
Table 1. Mean sediment characteristics for estuarine habitats within Tairua estuary, ± SE.
The combined organic carbon (OC) stocks within above ground biomass and sediment to 100 cm were highest in saltmarsh (90 t ha–1), followed by mangrove (46 t ha–1), seagrass (27 t ha–1), and unvegetated habitats (26 t ha–1) (Figure 2). Organic carbon stocks varied significantly across sites and habitats (Supplementary Table S2). PERMANOVA results for significance for each test can be found in Supplementary Table S3. The majority of carbon in each of the habitat types was below ground (> 90%) (Figure 2). Below ground OC stocks (100 cm depth) comprised 97.3 ± 0.5% of total OC stocks in saltmarsh, 90.6 ± 1.3% of total OC stocks in mangrove, and 99.7 ± 0.1% of total OC stocks in seagrass habitat (Figure 2).
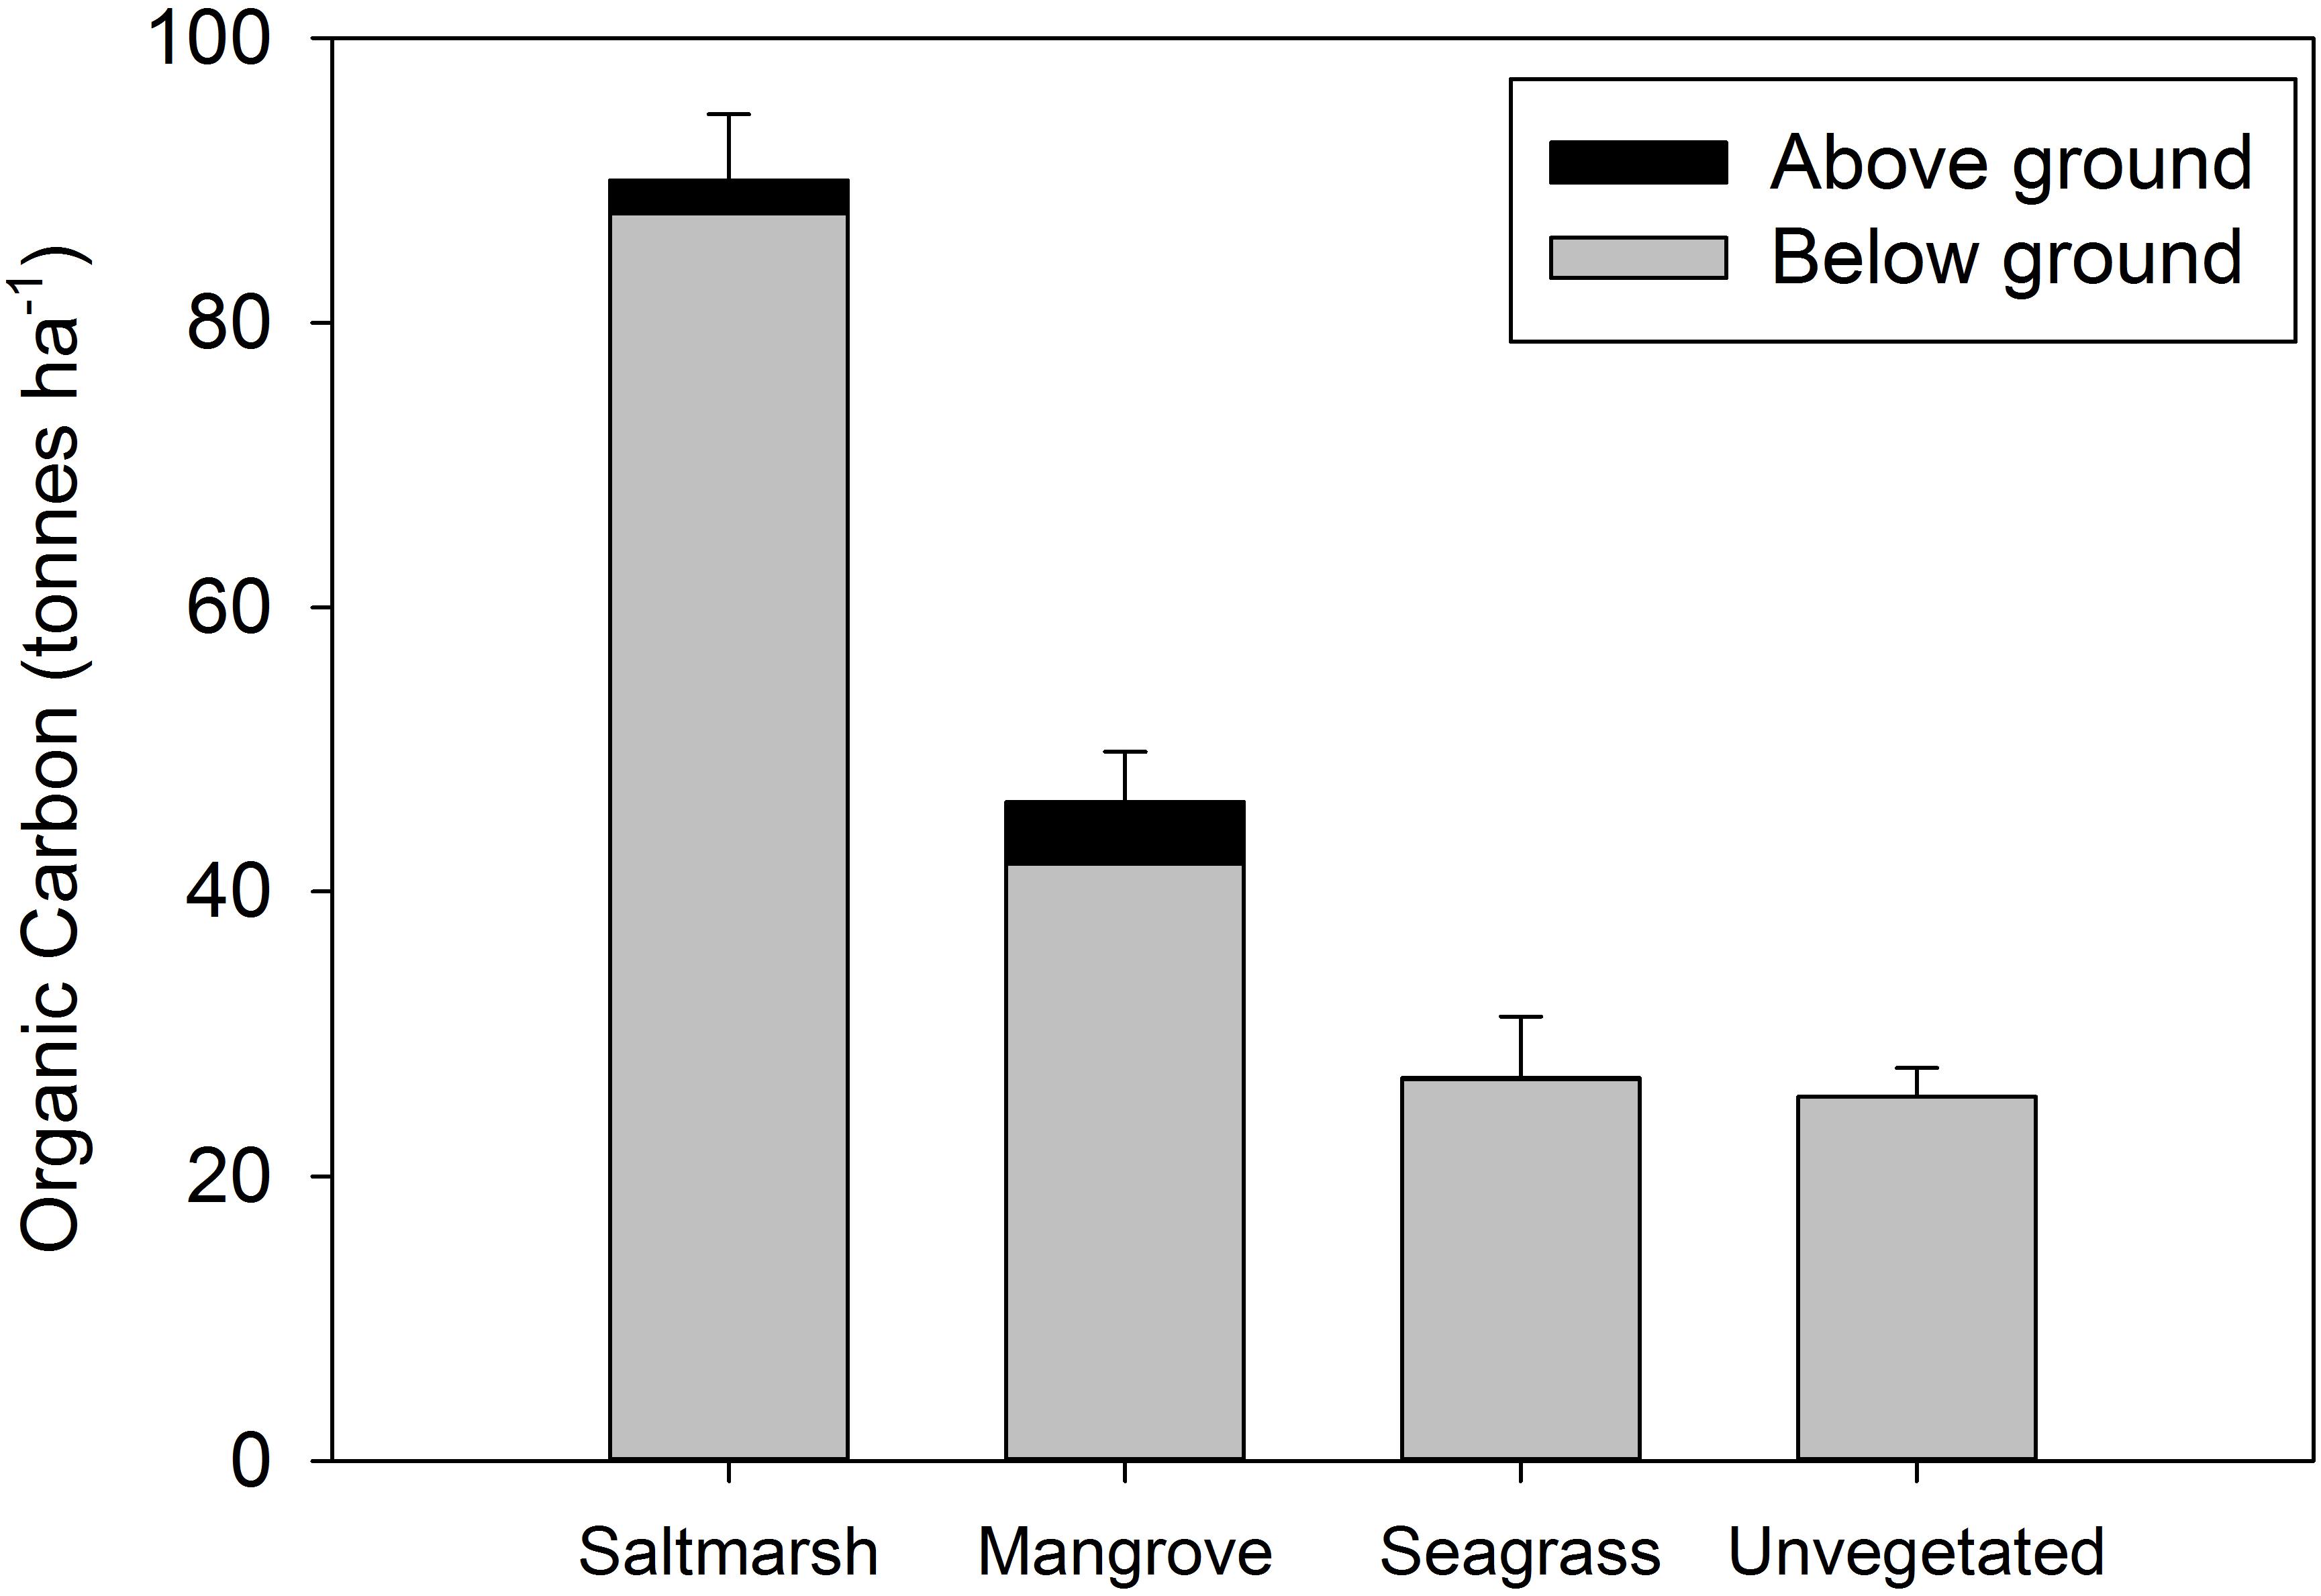
Figure 2. Total organic carbon stocks (above ground plus sediment to 100 cm) at four estuarine habitats within Tairua estuary. Values are mean ± SE. Saltmarsh, n = 9; mangrove, n = 9; seagrass, n = 6; unvegetated, n = 15 cores.
In saltmarsh habitat, sediment OC storage within 0–2, 2–10, 10–20, and 20–30 cm intervals of the sediment column was significantly greater than deeper intervals (p < 0.05). In mangrove habitat, sediment OC storage within 0–2, 2–10, and, 10–20 cm intervals of the sediment column was significantly greater than deeper intervals (p < 0.05). In seagrass habitat, sediment OC storage within 0–2 cm interval of the sediment column was significantly greater than deeper intervals (p < 0.05). No significant difference in OC with depth was observed in unvegetated habitat (Figure 3).
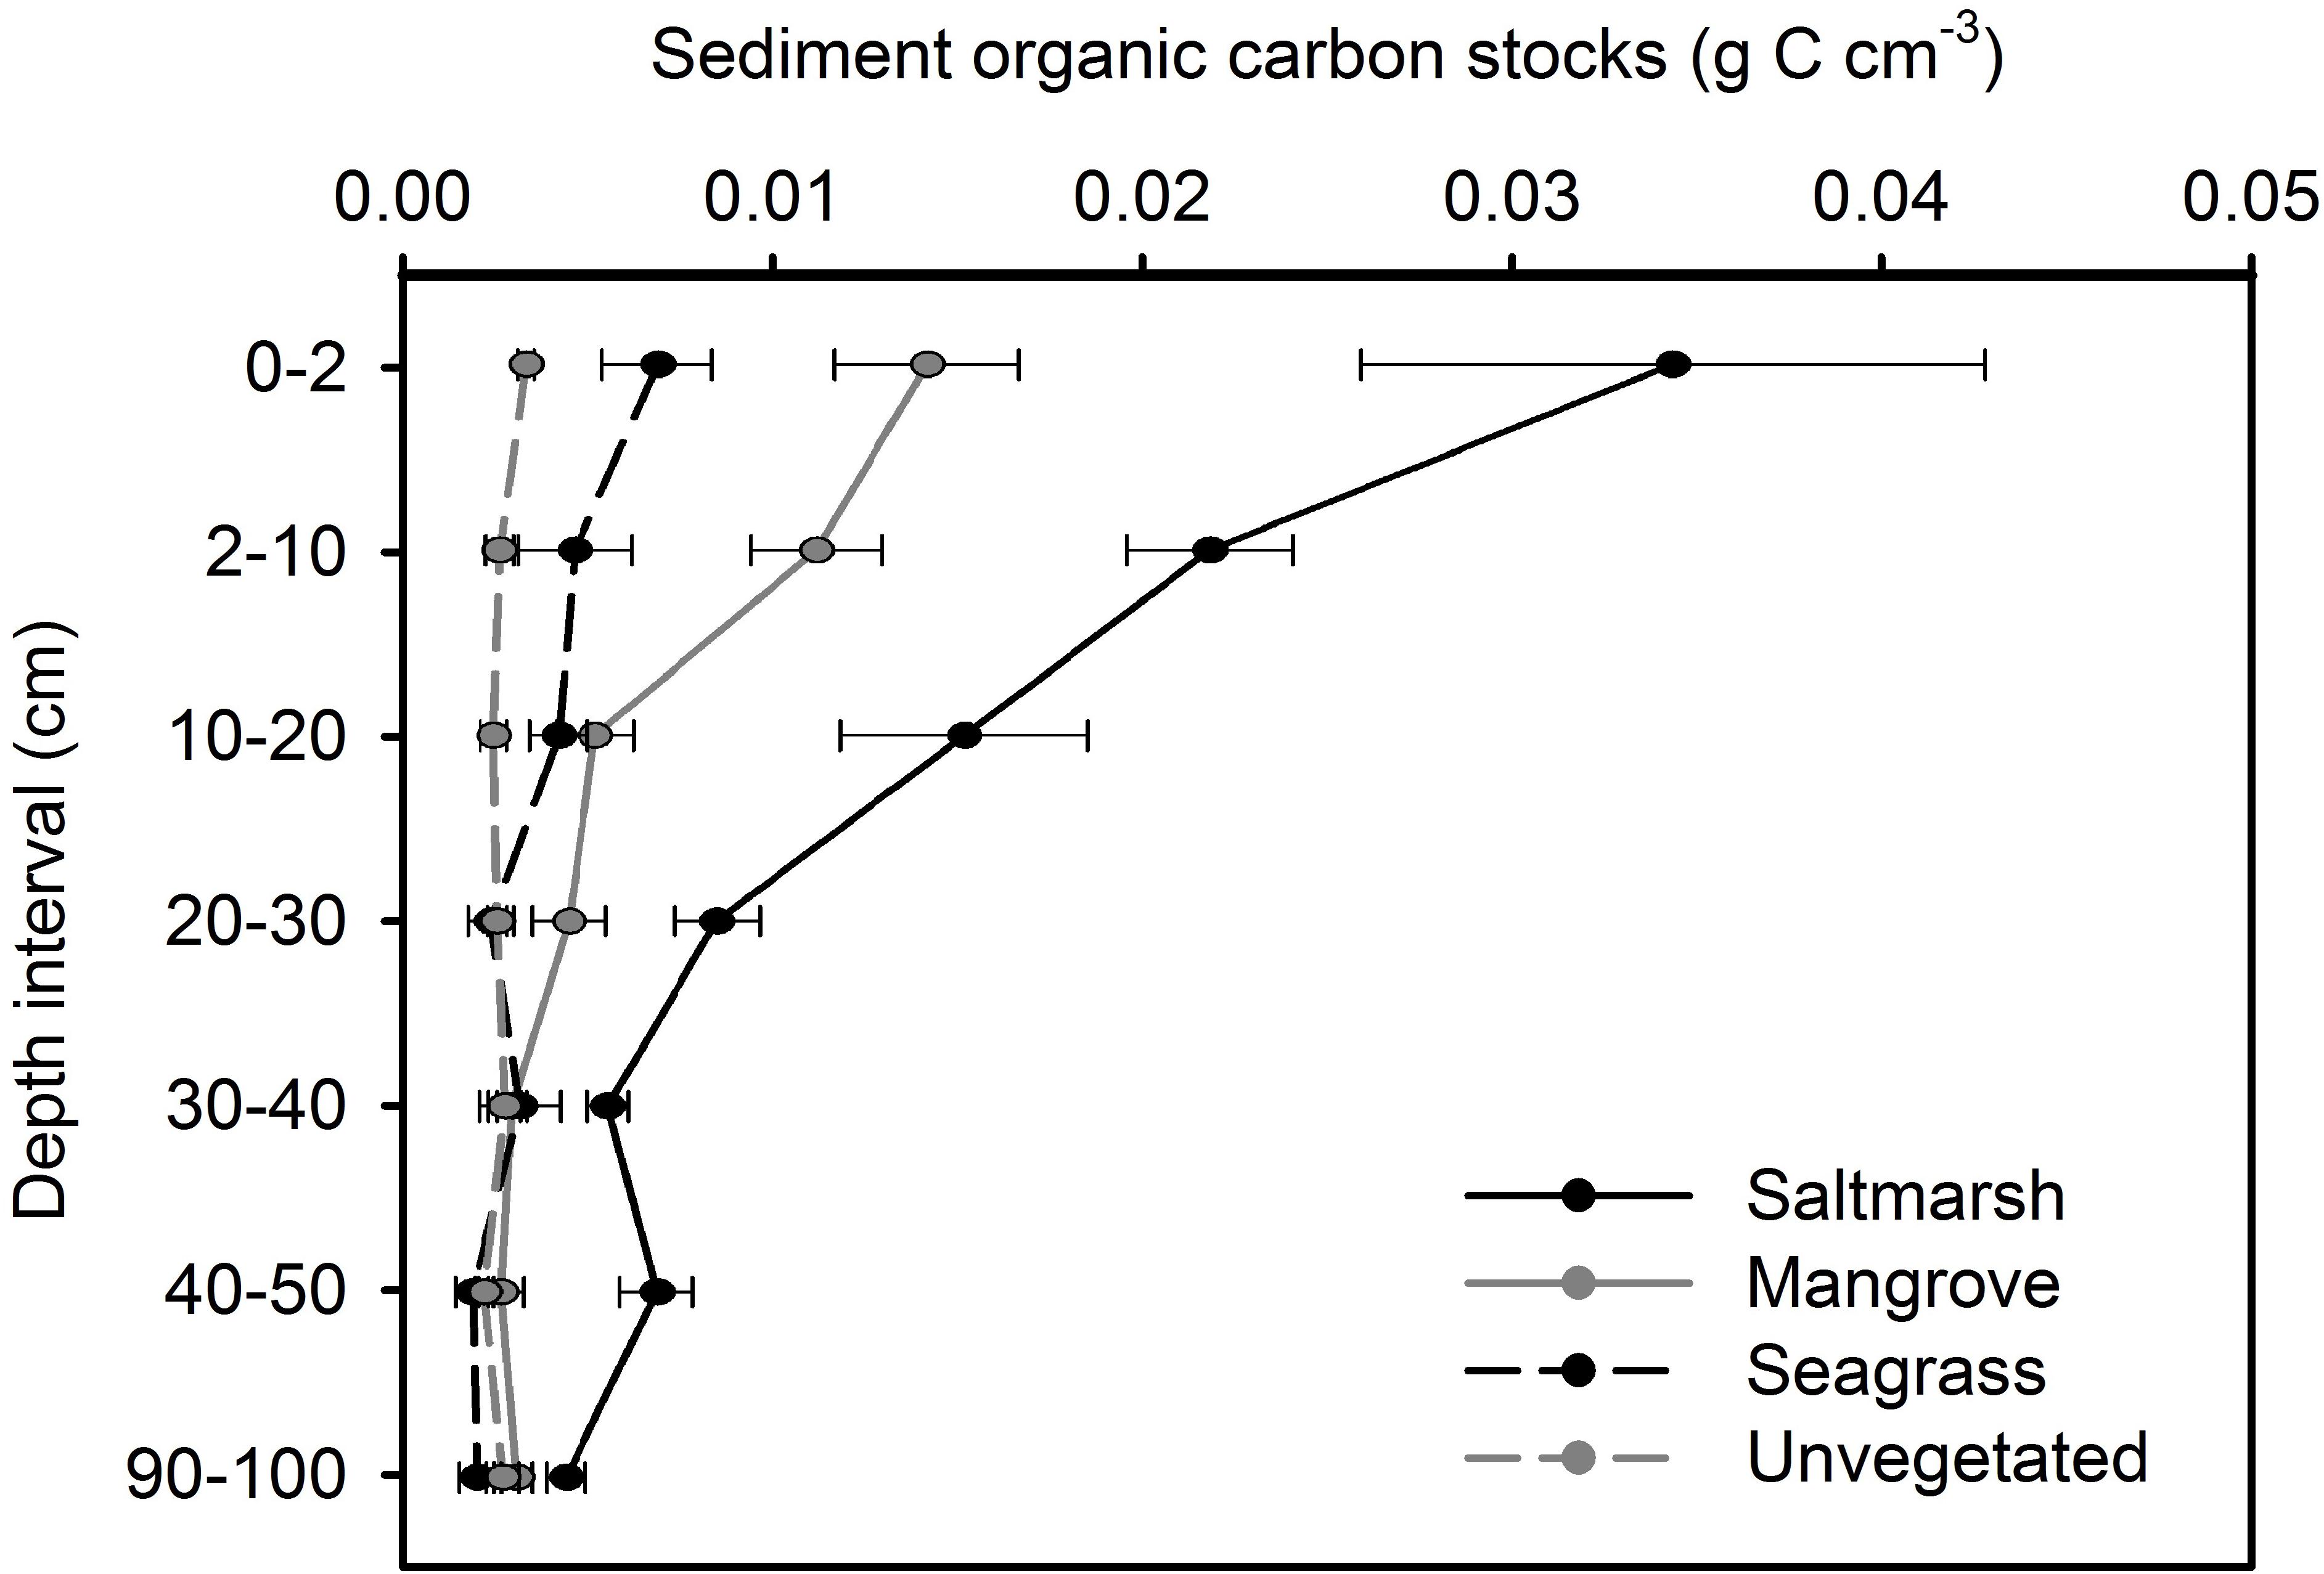
Figure 3. Organic carbon stocks with depth at four estuarine habitats within Tairua estuary. Values are mean ± SE. Saltmarsh, n = 9; mangrove, n = 9; seagrass, n = 6; unvegetated, n = 15 cores.
The δ13C and δ15N mixing model suggested that ∼34% of the organic carbon within saltmarsh sediment, 44% of the organic carbon within mangrove, and 24% of the organic carbon with seagrass sediments was autochthonous (i.e., saltmarsh, mangrove or seagrass derived, respectively). Approximately 41% of the organic carbon within unvegetated habitats was derived from coastal vegetation (saltmarsh, mangrove, and seagrass), 13% by microphytobenthos, and 52% by SPOM, the latter which subsequently settles out on the seafloor and becomes integrated into the sediment. Breaking down the SPOM contribution to further components, mixing model results suggested that SPOM collected upstream contributed more to organic carbon stocks within saltmarsh habitat than SPOM collected at the middle or entrance to the estuary. Within mangrove and seagrass, SPOM from the estuary entrance contributed similar proportions of organic carbon than SPOM collected at the upstream or middle of the estuary. Within unvegetated sediments, the majority of the SPOM contribution was derived from the middle and entrance of the estuary (Table 2 and Figures 4, 5).
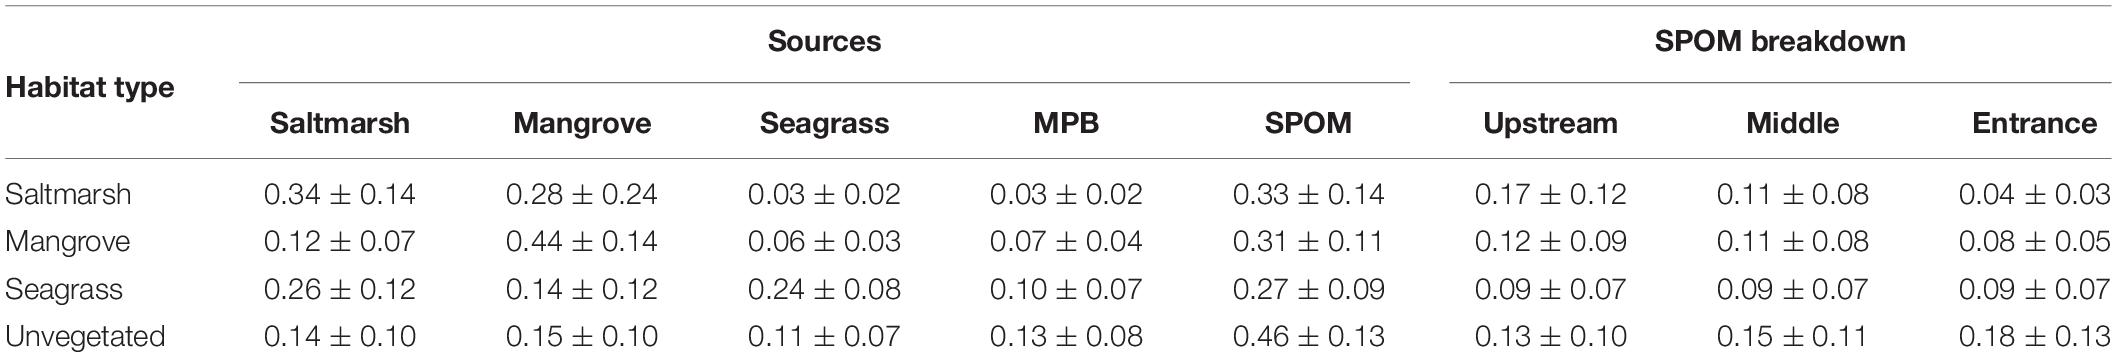
Table 2. Proportional contributions of four potential sources to the sediment organic carbon within each habitat type based on SIMMR mixing model results (mean ± standard deviation).
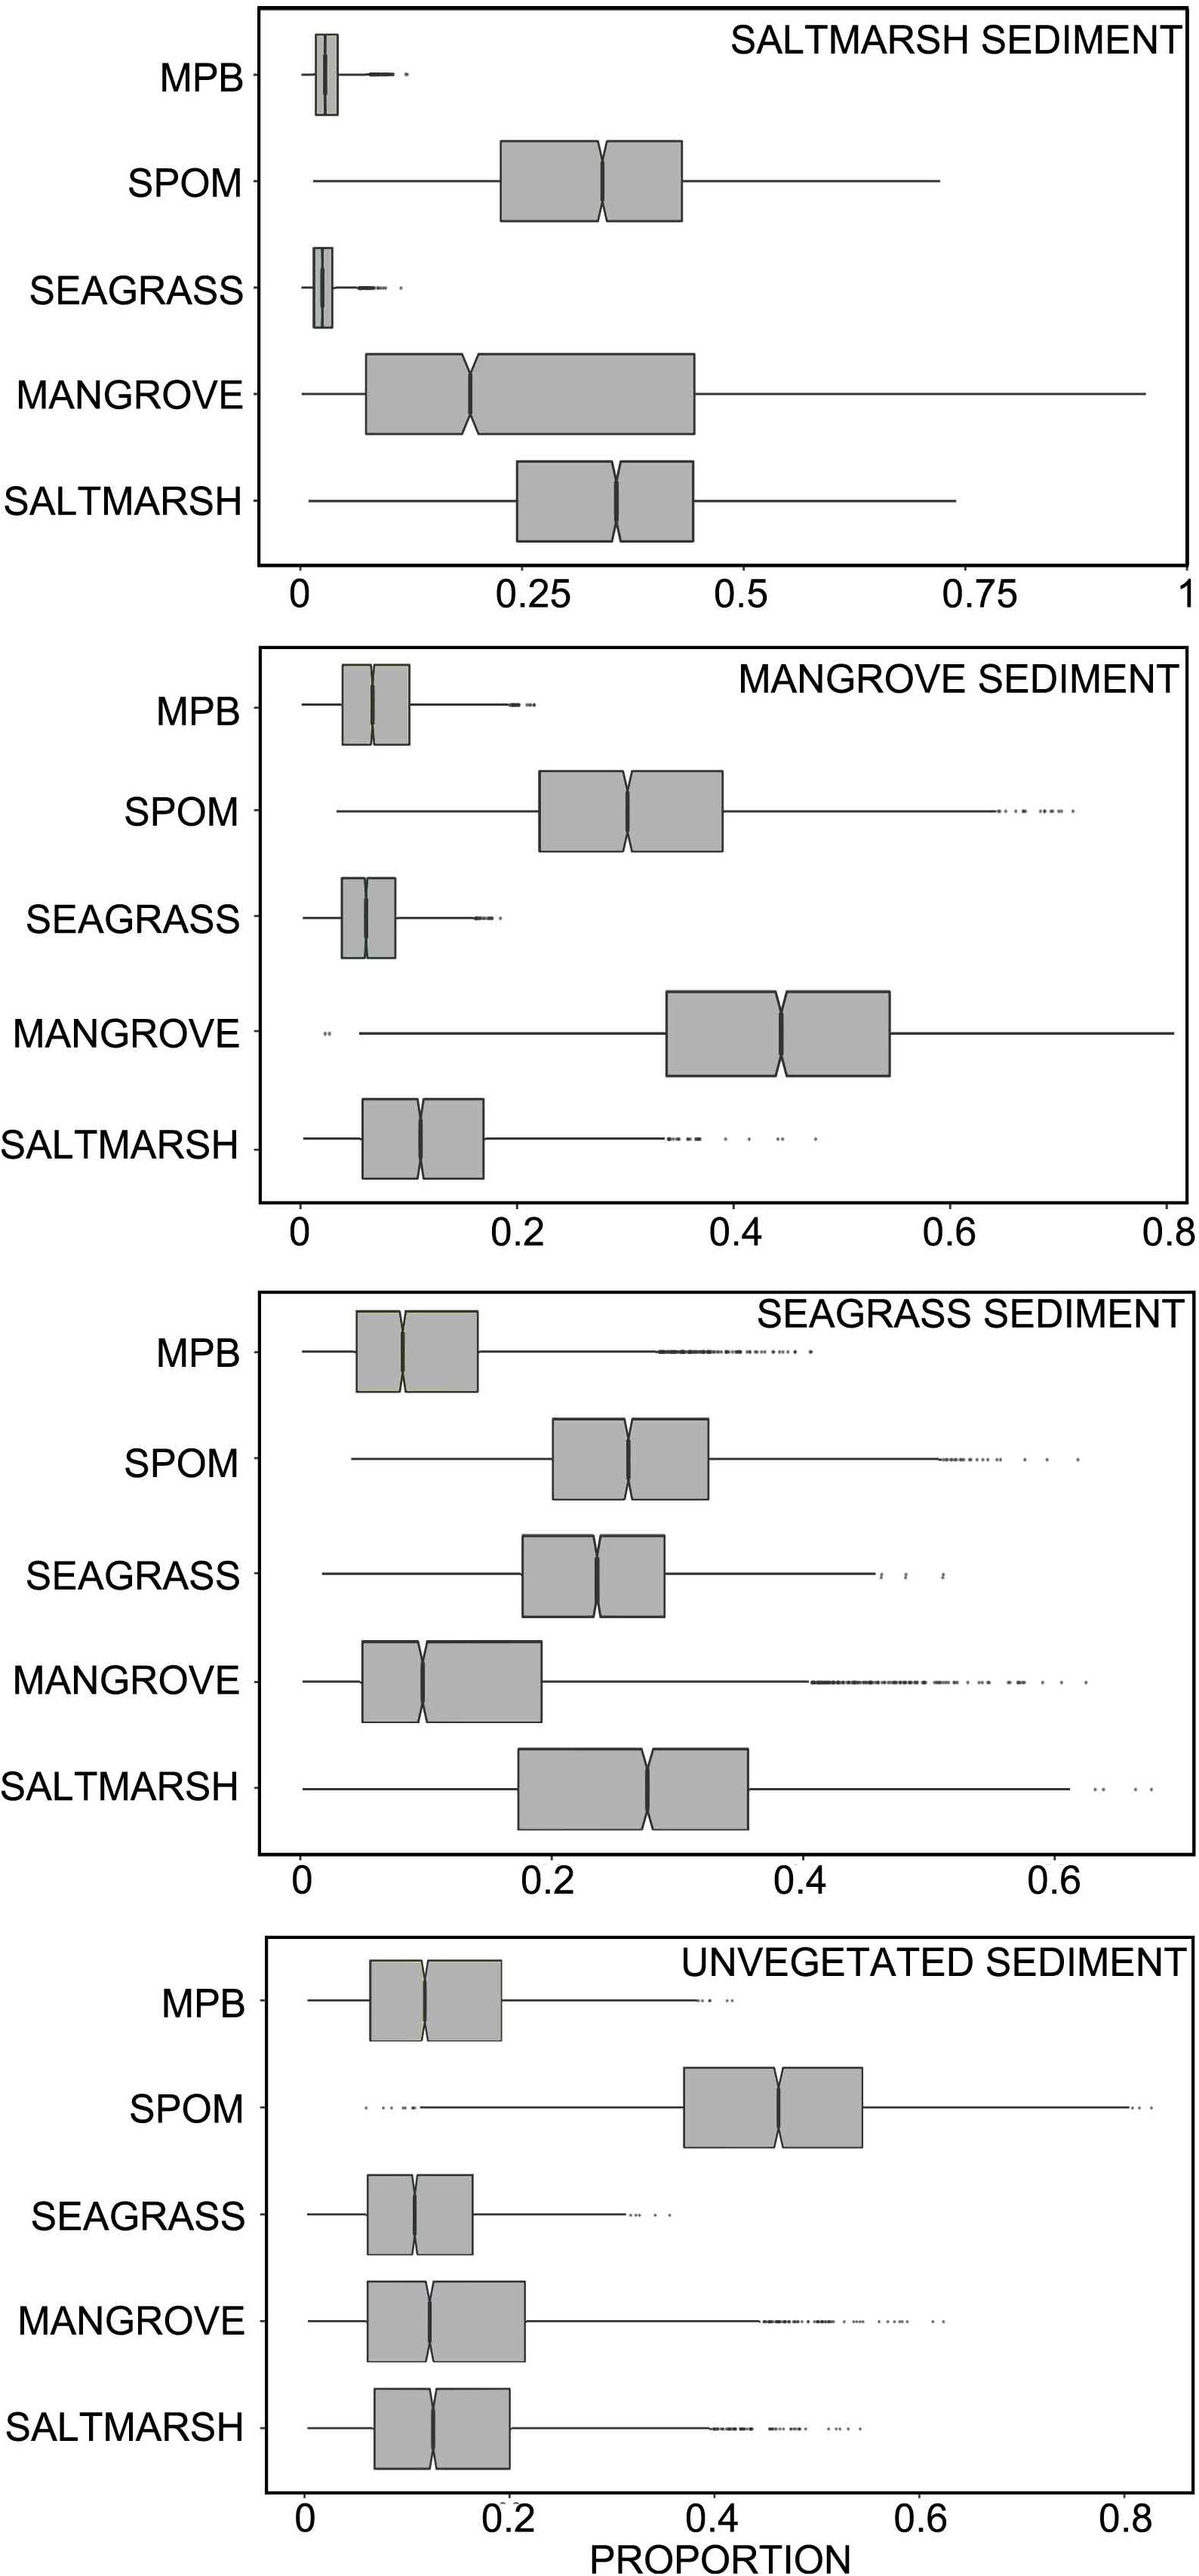
Figure 4. Credibility interval plot of the contribution of different sources to sediment organic carbon within each habitat type based on SIMMR mixing model results (boxes enclose the 50% credibility interval; lines within boxes represent median values, tails represent 2.5 and 97.5% intervals). MPB, microphytobenthos; SPOM, suspended particulate organic matter.
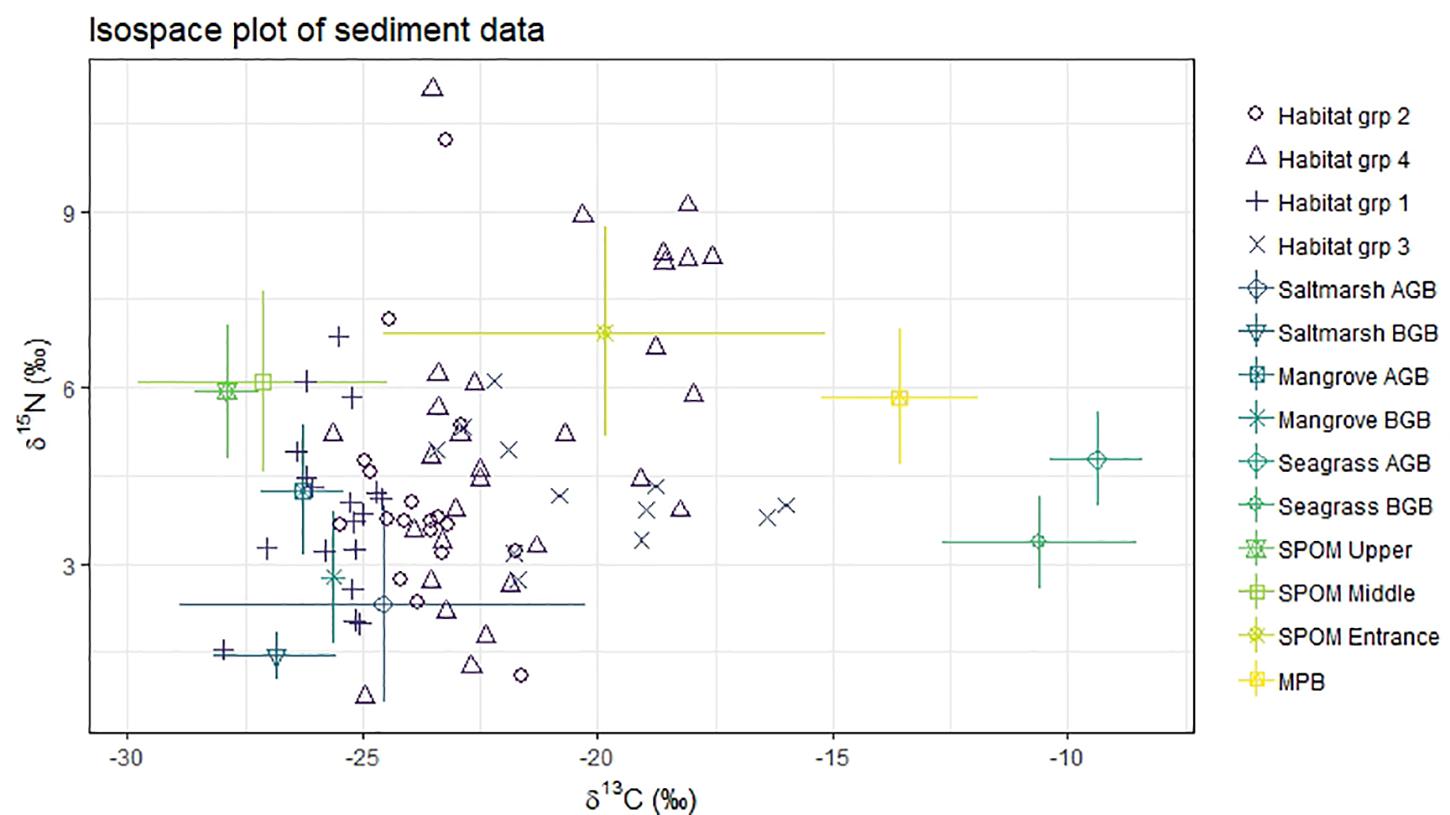
Figure 5. Isospace of sediment samples and potential sources isotopic signatures (δ13C‰, δ15N‰). Habitat group (sediment samples). 1, saltmarsh; 2, Mangrove; 3, Seagrass; 4, Unvegetated. AGB, above ground biomass; BGB, below ground biomass; MPB, microphytobenthos; SPOM, suspended particulate organic matter.
Extrapolation of Carbon Stock Data to Estimate Estuarine Carbon Stocks
Tairua estuary is dominated by unvegetated sand and mud flats, occupying 451.5 ha (intertidal 320 ha, subtidal 131.5 ha), 68.4% of the total area of the estuary. Based on carbon stock data from this study, carbon stocks throughout the estuary were calculated (Table 3). The estimated organic carbon (100 cm depth) within each habitat type was further refined based on carbon source analysis (Table 2) to estimate the amount of carbon provided by each vegetated habitat type to carbon stocks at the estuary scale (Table 4). This data suggests that saltmarsh occupy 6.30% of the estuary yet contribute 19.50% of organic carbon stocks, mangroves occupy 5.50% of estuary area yet contribute 19.34% of organic carbon stocks, whereas seagrass occupy 19.80% of the estuary and contribute 11.43% of organic carbon stocks. Further, microphytobenthos and SPOM are estimated to contribute 10.22 and 39.23% of estuarine organic carbon stocks, respectively.
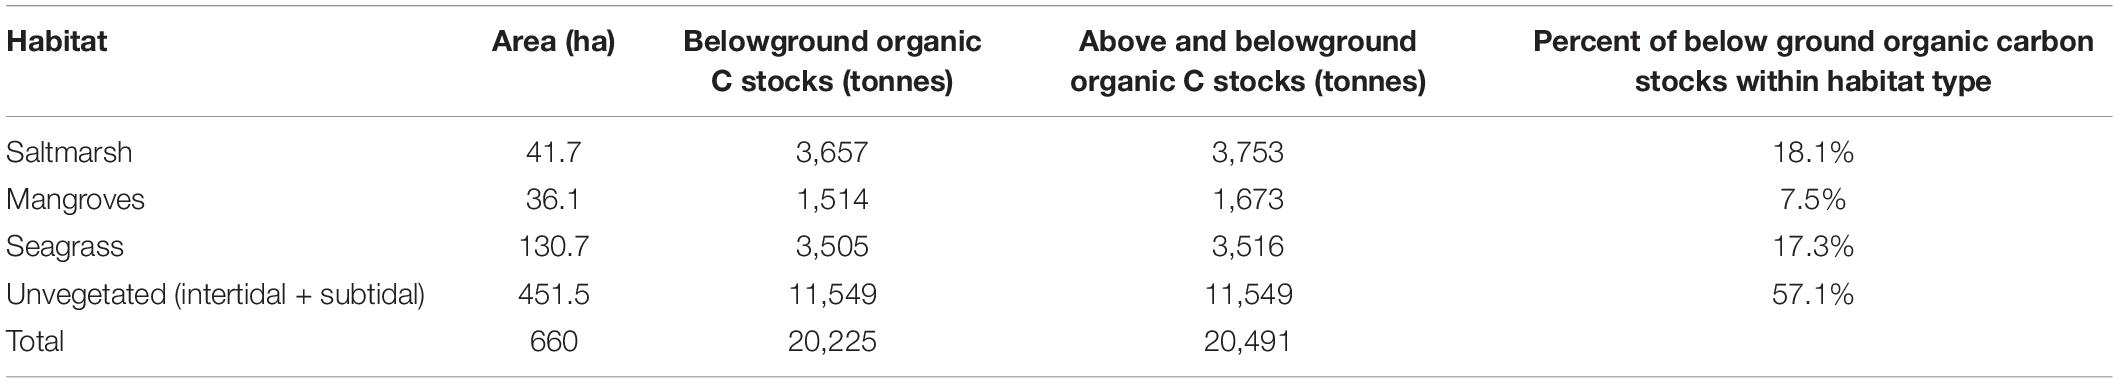
Table 3. Habitat area and total estimated organic carbon (100 cm depth) within each habitat type.
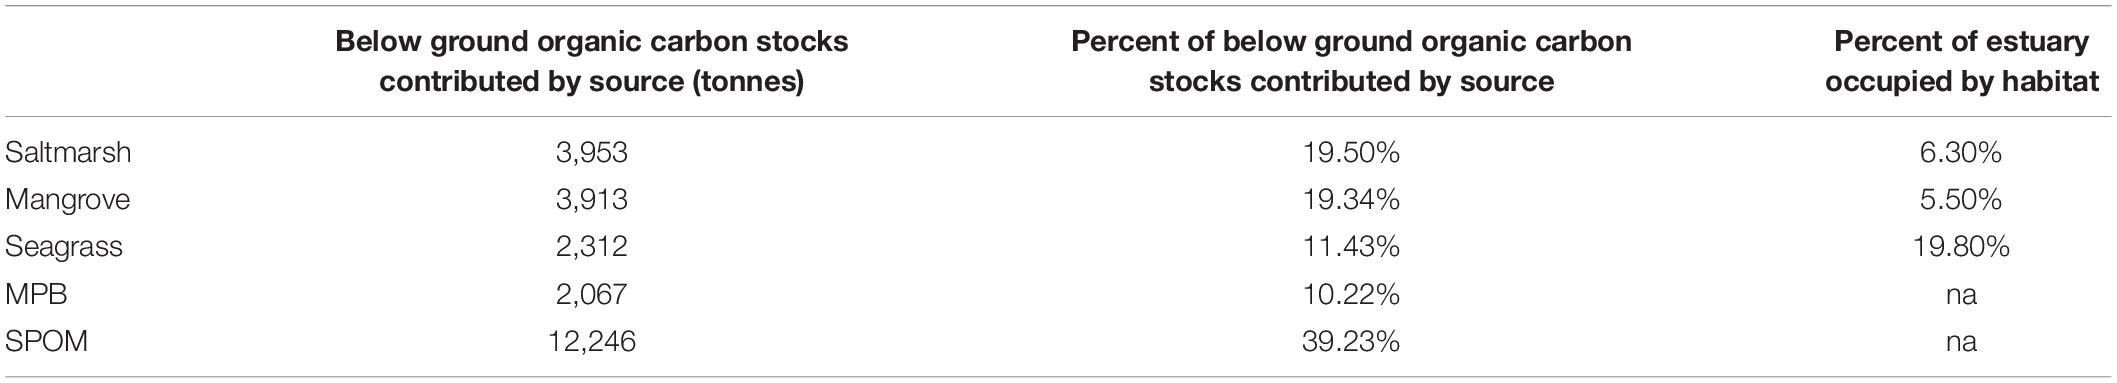
Table 4. Estimated organic carbon stocks (100 cm depth) contributed by each organic matter source (adjusted by habitat area and carbon source analysis).
Discussion
Our study demonstrates that blue carbon stocks vary among estuarine habitats and that cross-habitat subsidies of carbon contribute significantly to estuarine carbon dynamics. Organic carbon stocks in above ground biomass and sediment to 100 cm was highest in saltmarsh (90 t ha–1), followed by mangrove (46 t ha–1), to seagrass (27 t ha–1) and unvegetated habitats (26 t ha–1). Organic carbon varied with depth between habitats, with the majority of differences occurring in the top 20 to 30 cm of the sediment column. The majority of organic carbon was below ground for all habitats (97% for saltmarsh, 91% for mangrove, > 99% for seagrass), demonstrating the importance of below ground stocks. Despite being typically overlooked in blue carbon literature, unvegetated habitats contained significant carbon stocks, particularly when adjusted for their relatively large extent within the estuary (occupying 68.4% of the estuarine area and containing 57.1% of carbon stocks). Our observations are consistent with other studies which have shown that saltmarsh and mangrove typically contain greater amounts of organic carbon per ha–1 when compared to seagrass or unvegetated habitats (Phang et al., 2015; Brown et al., 2016; Hayes et al., 2017; Ewers Lewis et al., 2018).
When carbon stocks were further refined based on δ13C and δ15N mixing model results, coastal vegetation (saltmarsh, mangrove, seagrass) was found to provide important cross-habitat subsidies of carbon throughout the estuary, including contributing an estimated 41% of organic carbon within unvegetated sediments, and 51% of the total carbon stock throughout the estuary (yet occupying only 31.6% of the estuary). Proportional to area, mangrove and saltmarsh habitats contributed the most carbon to the estuary (contributing 19.3 and 19.5% of stocks, despite covering 5.5 and 6.3% of total estuarine area, respectively). Seagrass derived organic matter was also detected in all habitat types, however, its estimated contribution to estuarine carbon stocks was lower than saltmarsh or mangrove (contributing 11.4% of stocks, despite covering 19.8% of total estuarine area). Microphytobenthos were also found to be a significant contributor of carbon to the estuary (contributing 10.2% of estuarine carbon stocks), consistent with observations elsewhere throughout the world (Santos et al., 2019).
SPOM was estimated to contibute approximately one third of the organic matter to saltmarsh, mangrove, and seagrass habitats, and was particularly important within unvegetated habitats (contributing 46%). Sources of SPOM in estuaries include soil and plant material from the land, sewage and urban runoff, and aquatic and marine primary production, such as phytoplankton, coastal vegetation and benthic microalgae (McIntosh et al., 2015). The mixing model showed that the relative contribution of upstream SPOM:entrance SPOM decreased from saltmarsh to mangrove to seagrass to unvegetated habitat. This indicates that terrestrially/freshwater derived organic carbon (which is likely to be the dominant organic carbon source within upstream SPOM samples) contributed proportionately more to saltmarsh habitat, whereas phytoplankton and other aquatic and marine production contributed progressively more to stocks in mangrove, seagrass and unvegetated habitat, consistent with intertidal zonation influencing horizontal exchange and distance from estuarine mouth influencing sea-estuary exchange.
We note that our stable isotope analysis is intended to provide a probabilistic indication of likely carbon sources for each habitat type based on the information available, however, we acknowledge a number of limitations of this methodology (Canuel and Hardison, 2016). One such limitation is that stable isotope values vary through time, for example as tissue degrades. As there remains considerable uncertainty about how best to address this (Khan et al., 2015; Greiner et al., 2016; Oreska et al., 2018), in part due to high levels of variability in rates of isotopic degradation through time (Kennedy et al., 2010), no adjustment was made to account for this. Estimating the relative contribution of different sources to sediment organic matter is also complicated by limited isotopic separation between potential sources of organic matter within estuarine and coastal systems (Canuel and Hardison, 2016; Oreska et al., 2018).
Despite these limitations, our stable isotope results provide valuable insights regarding the importance of different estuarine habitat types to estuarine carbon stocks, and are consistent with observations from other studies (Bouillon et al., 2003a; Chen et al., 2017; Kusumaningtyas et al., 2019). For example, using stable isotope analysis Kusumaningtyas et al. (2019) found that mangrove organic material contributes significantly to sediment organic matter stocks within mangrove habitat, and Chen et al. (2017) found that mangroves provide important cross-habitat subsidies of carbon to adjacent seagrass beds. Our results are also consistent with Bouillon et al. (2003b) who found that deposited estuarine or marine suspended matter can be a dominant source of carbon within mangrove ecosystems, and with Greiner et al. (2016) who made similar observations for seagrass ecosystems. These results are also consistent with other studies from Tairua estuary that reported considerable detrital production and export from vegetated habitats. For example, Gladstone-Gallagher et al. (2013) estimated that mangroves from Whangamata Harbor, an estuary comparable in size and shape to Tairua and located ∼15 km south, produce 3.24–5.38 tonnes dry weight ha–1 of leaf litter each year. Furthermore, within one of the arms of Tairua estuary, Pepe Inlet, microdetrital export was estimated at 449 kg dry weight per annum, and each hectare of vegetated area (saltmarsh, mangrove, seagrass) was estimated to export on average 30 kg DW per annum out of the inlet (Gladstone-Gallagher et al., 2017).
Based on our results it is possible to make some general inferences on the impact of changing habitat distributions on carbon stocks within Tairua estuary. For instance, the loss of saltmarsh or mangrove will have a disproportionate impact on carbon stocks within the estuary. Furthermore, it is likely that the loss of saltmarsh or mangrove habitat will eventually result in a decline in carbon stocks in other habitats throughout the estuary, given the considerable export of detrital matter to seagrass and unvegetated habitats. In addition, our dataset suggests that despite seagrass covering relatively large areas of the estuary, changes in seagrass distribution may have a relatively minor impact on carbon stocks compared to changes in other vegetated habitats. However, this study does not quantify the differences in lability between seagrass and other organic matter sources. We note measures of carbon stocks incorporate both non-labile and labile carbon stocks within vegetative biomass and sediment. This is not a static value, instead carbon stored in this system undergoes continual transformation (e.g., through the remineralization of labile carbon, or the conversion of atmospheric CO2 into plant or algal material), and forms a critical component of the carbon and nutrient cycle within estuarine systems (Alongi, 2014). For example, seagrass detritus is known to degrade faster than mangrove (Gladstone-Gallagher et al., 2016), and therefore although its contribution to carbon stocks may be lower, its role in carbon and nutrient cycling processes within the estuary may be disproportionately valuable and not captured in sediment cores.
Carbon stocks within habitats in Tairua estuary varied spatially (Supplementary Table S2). Therefore, it is likely if our sampling was expanded to cover a greater spatial spread our estimates of carbon stocks and sources would be further refined. For example, our unvegetated samples were collected within 50 m of vegetated habitats. Samples from further away (e.g., subtidal unvegetated habitat) may have lower vegetated detrital inputs due to hydrodynamics or redistribution by fauna (Connolly et al., 2005). It is also important to note that carbon stocks are not based simply on habitat presence or absence. For example, newly colonized areas of mangrove or saltmarsh are unlikely to contain the same quantity of carbon as areas which have been occupied for many years (Alongi, 2012), and this may explain some of the differences in stocks observed in this study. Habitat specific sequestration rate values have not yet been quantified for Tairua estuary, and there is limited information throughout New Zealand and no studies across habitat gradients. However, in Whangamata Harbor, carbon sequestration rates have been estimated in mangrove (intact = 65.5 ± 16.3 g m–2 yr–1) and saltmarsh (23.5 ± 15.9 g m–2 yr–1) (Pérez et al., 2017), suggesting that sequestration rates can vary considerably between habitat types. This is consistent with Lovelock et al. (2014), who suggest that carbon sequestration varies among different tidal wetland plant community types due to variation in sediment characteristics and rates of sediment accretion over time.
This study demonstrates the importance of considering carbon stocks in both the habitat of interest, as well as the habitat/s which will replace or be lost, when estimating the impacts of changing habitat distributions on blue carbon stocks. Our results show that vegetated habitat provide a 2–3-fold increase to total estuarine carbon stocks and provide valuable cross-habitat carbon subsidies. Further, we demonstrate that unvegetated habitats can contain considerably more carbon than other habitat types when adjusted for their large extent in many estuaries. This highlights the critical importance of considering the contribution of unvegetated sediments to blue carbon stocks in future studies. As habitats change due to impacts such as climate change and degradation, this study provides valuable context for understanding the impact of shift habitat distributions on blue carbon stocks.
Data Availability Statement
The datasets generated for this study are available on request to the corresponding author.
Author Contributions
RB led the study (experimental design, fieldwork, analysis, and writing). CL and JH contributed to the experimental design and fieldwork. All authors contributed toward writing the manuscript.
Funding
We thank Waikato Regional Council and NIWA Coasts and Oceans Program for funding.
Conflict of Interest
The authors declare that the research was conducted in the absence of any commercial or financial relationships that could be construed as a potential conflict of interest.
Acknowledgments
We thank Dr. Hilke Giles, Dr. Drew Lohrer, and Prof. Judi Hewitt for reviewing earlier drafts, and Mike Meredyth-Young for field assistance. We also thank Dr. Candida Savage from the University of Otago, NIWA stable isotope facility and KE LEUVEN for stable isotope analysis.
Supplementary Material
The Supplementary Material for this article can be found online at: https://www.frontiersin.org/articles/10.3389/fmars.2020.00380/full#supplementary-material
References
Alongi, D. M. (2012). Carbon sequestration in mangrove forests. Carbon Manag. 3, 313–322. doi: 10.4155/cmt.12.20
Alongi, D. M. (2014). Carbon cycling and storage in mangrove forests. Annu. Rev. Mar. Sci. 6, 195–219. doi: 10.1146/annurev-marine-010213-135020
Bauer, J. E., Cai, W.-J., Raymond, P. A., Bianchi, T. S., Hopkinson, C. S., and Regnier, P. A. G. (2013). The changing carbon cycle of the coastal ocean. Nature 504, 61–70. doi: 10.1038/nature12857
Bouillon, S., Dahdouh-Guebas, F., Rao, A. V. V. S., Koedam, N., and Dehairs, F. (2003a). Sources of organic carbon in mangrove sediments: variability and possible ecological implications. Hydrobiologia 495, 33–39. doi: 10.1023/A:1025411506526
Bouillon, S., Frankignoulle, M., Dehairs, F., Velimirov, B., Eiler, A., Abril, G., et al. (2003b). Inorganic and organic carbon biogeochemistry in the Gautami Godavari estuary (Andhra Pradesh, India) during pre-monsoon: the local impact of extensive mangrove forests. Glob. Biogeochem.Cycles 17:1114. doi: 10.1029/2002GB002026
Brodie, C. R., Leng, M. J., Casford, J. S. L., Kendrick, C. P., Lloyd, J. M., Yongqiang, Z., et al. (2011). Evidence for bias in C and N concentrations and δ13C composition of terrestrial and aquatic organic materials due to pre-analysis acid preparation methods. Chem. Geol. 282, 67–83. doi: 10.1016/j.chemgeo.2011.01.007
Brown, D. R., Conrad, S., Akkerman, K., Fairfax, S., Fredericks, J., Hanrio, E., et al. (2016). Seagrass, mangrove and saltmarsh sedimentary carbon stocks in an urban estuary, Coffs Harbour, Australia. Reg. Stud. Mar. Sci. 8, 1–6. doi: 10.1016/j.rsma.2016.08.005
Bulmer, R. H., Schwendenmann, L., and Lundquist, C. J. (2016). Allometric models for estimating aboveground biomass, carbon and nitrogen stocks in temperate Avicennia marina forests. Wetlands 1–8. doi: 10.1007/s13157-016-0793-0
Canadell, J. G., and Raupach, M. R. (2008). Managing forests for climate change mitigation. Science 320, 1456–1457. doi: 10.1126/science.1155458
Canuel, E. A., and Hardison, A. K. (2016). Sources, ages, and alteration of organic matter in estuaries. Annu. Rev. Mar. Sci. 8, 409–434. doi: 10.1146/annurev-marine-122414-034058
Chen, G., Azkab, M. H., Chmura, G. L., Chen, S., Sastrosuwondo, P., Ma, Z., et al. (2017). Mangroves as a major source of soil carbon storage in adjacent seagrass meadows. Sci. Rep. 7:42406. doi: 10.1038/srep42406
Connolly, R. M., Gorman, D., and Guest, M. A. (2005). Movement of carbon among estuarine habitats and its assimilation by invertebrates. Oecologia 144, 684–691. doi: 10.1007/s00442-005-0167-4
Day, P. R. (1965). “Particle fractionation and particle-size analysis,” in Methods of Soil Analysis. Part 1. Physical and Mineralogical Properties, Including Statistics of Measurement and Sampling. ed. C. A. Black (Madison, USA: American Society of Agronomy, Soil Science Society of America), 545–567.
Deegan, L. A., Johnson, D. S., Warren, R. S., Peterson, B. J., Fleeger, J. W., Fagherazzi, S., et al. (2012). Coastal eutrophication as a driver of salt marsh loss. Nature 490, 388–392. doi: 10.1038/nature11533
Donato, D. C., Kauffman, J. B., Murdiyarso, D., Kurnianto, S., Stidham, M., and Kanninen, M. (2011). Mangroves among the most carbon-rich forests in the tropics. Nat. Geosci. 4, 293–297. doi: 10.1186/s40168-019-0675-9
Ewers Lewis, C. J., Carnell, P. E., Sanderman, J., Baldock, J. A., and Macreadie, P. I. (2018). Variability and vulnerability of coastal ‘Blue Carbon’ stocks: a case study from Southeast Australia. Ecosystems 21, 263–279. doi: 10.1007/s10021-017-0150-z
Fourqurean, J. W., Duarte, C. M., Kennedy, H., Marba, N., Holmer, M., Mateo, M. A., et al. (2012). Seagrass ecosystems as a globally significant carbon stock. Nat. Geosci. 5, 505–509. doi: 10.1002/eap.1489
Gladstone-Gallagher, R. V., Lohrer, A. M., Lundquist, C. J., and Pilditch, C. A. (2016). Effects of detrital subsidies on soft-sediment ecosystem function are transient and source-dependent. PLoS One 11:e0154790. doi: 10.1371/journal.pone.0154790
Gladstone-Gallagher, R. V., Lundquist, C. J., and Pilditch, C. A. (2013). Mangrove (Avicennia marina subsp. australasica) litter production and decomposition in a temperate estuary. N. Z. J. Mar. Freshw. Res. 48, 24–37. doi: 10.1080/00288330.2013.827124
Gladstone-Gallagher, R. V., Sandwell, D. R., Lohrer, A. M., Lundquist, C. J., and Pilditch, C. A. (2017). Quantifying macrodetritus fluxes from a small temperate estuary. Mar. Freshw. Res. 68, 2289–2305. doi: 10.1071/MF16408
Greiner, J. T., Wilkinson, G. M., McGlathery, K. J., and Emery, K. A. (2016). Sources of sediment carbon sequestered in restored seagrass meadows. Mar. Ecol. Prog. Ser. 551, 95–105.
Hansson, L.-A. (1988). Chlorophyll a determination of periphyton on sediments: identification of problems and recommendation of method. Freshwater Biol. 20, 347–352. doi: 10.1111/j.1365-2427.1988.tb00460.x
Hayes, M. A., Jesse, A., Hawke, B., Baldock, J., Tabet, B., Lockington, D., et al. (2017). Dynamics of sediment carbon stocks across intertidal wetland habitats of Moreton Bay, Australia. Glob. Chang. Biol. 23, 4222–4234. doi: 10.1111/gcb.13722
IPCC (2013). Climate Change 2013: The Physical Science Basis. Contribution of Working Group I to the First Assessment Report of the Intergovernmental Panel on Climate Change, eds T. F. Stocker, D. Qin, G.-K. Plattner, M. Tignor, S. K. Allen, J. Boschung, et al. (Cambridge: Cambridge University Press), 1535.
Kennedy, H., Beggins, J., Duarte, C. M., Fourqurean, J. W., Holmer, M., Marbà, N., et al. (2010). Seagrass sediments as a global carbon sink: isotopic constraints. Glob. Biogeochem. Cycles 24:GB4026. doi: 10.1029/2010GB003848
Khan, N. S., Vane, C. H., and Horton, B. P. (2015). “Stable carbon isotope and C/N geochemistry of coastal wetland sediments as a sea-level indicator,” in Handbook of Sea−Level Research, eds I. Shennan, A. J. Long, and B. P. Horton (Chichester: John Wiley), 295–311.
Kusumaningtyas, M. A., Hutahaean, A. A., Fischer, H. W., Pérez-Mayo, M., Ransby, D., and Jennerjahn, T. C. (2019). Variability in the organic carbon stocks, sources, and accumulation rates of Indonesian mangrove ecosystems. Estuar. Coast. Shelf Sci. 218, 310–323. doi: 10.1016/j.ecss.2018.12.007
Lovelock, C. E., Adame, M. F., Bennion, V., Hayes, M., O’Mara, J., Reef, R., et al. (2014). Contemporary rates of carbon sequestration through vertical accretion of sediments in mangrove forests and saltmarshes of South East Queensland, Australia. Estuaries Coasts 37, 763–771. doi: 10.1007/s12237-013-9702-4
McIntosh, H. A., McNichol, A. P., Xu, L., and Canuel, E. A. (2015). Source-age dynamics of estuarine particulate organic matter using fatty acid δ13C and Δ14C composition. Limnol. Oceanogr. 60, 611–628. doi: 10.1002/lno.10053
McLeod, E., Chmura, G. L., Bouillon, S., Salm, R., Björk, M., Duarte, C. M., et al. (2011). A blueprint for blue carbon: toward an improved understanding of the role of vegetated coastal habitats in sequestering CO2. Front. Ecol. Environ. 9, 552–560. doi: 10.1890/110004
Moed, J. R., and Hallegraeff, G. M. (1978). Some problems in the estimation of chlorophyll-a and phaeopigments from pre- and post-acidification spectrophotometrie measurements. Internationale Revue der gesamten Hydrobiologie und Hydrographie 63, 787–800.
Needham, H., Townsend, M., Hewitt, J., and Hailes, S. (2013). Intertidal Habitat Mapping for Ecosystem Goods and Services: Waikato Estuaries. Prepared for Waikato Regional Council. NIWA Technical Report HAM2013-085. Hamilton: Waikato Regional Council.
Oreska, M. P. J., Wilkinson, G. M., McGlathery, K. J., Bost, M., and McKee, B. A. (2018). Non-seagrass carbon contributions to seagrass sediment blue carbon. Limnol. Oceanogr. 63, S3–S18. doi: 10.1002/lno.10718
Parnell, A., and Inger, R. (2016). Stable Isotope Mixing Models in R With Simmr. R Version 3.4.1. Available online at: https://cran.r-project.org/web/packages/simmr/vignettes/simmr.html
Pendleton, L., Donato, D. C., Murray, B. C., Crooks, S., Jenkins, W. A., Sifleet, S., et al. (2012). Estimating global “Blue Carbon” emissions from conversion and degradation of vegetated coastal ecosystems. PLoS One 7:e43542. doi: 10.1371/journal.pone.0043542
Pérez, A., Machado, W., Gutierrez, D., Stokes, D., Sanders, L., Smoak, J. M., et al. (2017). Changes in soil organic carbon accumulation driven by mangrove expansion and deforestation in a New Zealand estuary. Estuar. Coast. Shelf Sci. 192, 108–116. doi: 10.1016/j.ecss.2017.05.009
Phang, V. X. H., Chou, L. M., and Friess, D. A. (2015). Ecosystem carbon stocks across a tropical intertidal habitat mosaic of mangrove forest, seagrass meadow, mudflat and sandbar. Earth Surf. Process. Landf. 40, 1387–1400. doi: 10.1002/esp.3745
Polidoro, B. A., Carpenter, K. E., Collins, L., Duke, N. C., Ellison, A. M., Ellison, J. C., et al. (2010). The loss of species: mangrove extinction risk and geographic areas of global concern. PLoS One 5:e10095. doi: 10.1371/journal.pone.0010095
Santos, R., Duque-Núñez, N., de los Santos, C. B., Martins, M., Carrasco, A. R., and Veiga-Pires, C. (2019). Superficial sedimentary stocks and sources of carbon and nitrogen in coastal vegetated assemblages along a flow gradient. Sci. Rep. 9:610. doi: 10.1038/s41598-018-37031-6
Savage, C., Thrush, S. F., Lohrer, A. M., and Hewitt, J. E. (2012). Ecosystem services transcend boundaries: estuaries provide resource subsidies and influence functional diversity in coastal benthic communities. PLoS One 7:e42708. doi: 10.1371/journal.pone.0042708
Keywords: blue carbon, saltmarsh, mangrove, seagrass, estuary, stable isotopes
Citation: Bulmer RH, Stephenson F, Jones HFE, Townsend M, Hillman JR, Schwendenmann L and Lundquist CJ (2020) Blue Carbon Stocks and Cross-Habitat Subsidies. Front. Mar. Sci. 7:380. doi: 10.3389/fmars.2020.00380
Received: 14 October 2019; Accepted: 04 May 2020;
Published: 11 June 2020.
Edited by:
Alberto Basset, University of Salento, ItalyReviewed by:
Paolo Magni, National Research Council (CNR), ItalyGuillem Chust, Technological Center Expert in Marine and Food Innovation (AZTI), Spain
Copyright © 2020 Bulmer, Stephenson, Jones, Townsend, Hillman, Schwendenmann and Lundquist. This is an open-access article distributed under the terms of the Creative Commons Attribution License (CC BY). The use, distribution or reproduction in other forums is permitted, provided the original author(s) and the copyright owner(s) are credited and that the original publication in this journal is cited, in accordance with accepted academic practice. No use, distribution or reproduction is permitted which does not comply with these terms.
*Correspondence: Richard Hugh Bulmer, richard.bulmer@niwa.co.nz