 Peter G. Ryan
 Eleanor A. Weideman
 Vonica Perold1
- 1FitzPatrick Institute of African Ornithology, DST-NRF Centre of Excellence, University of Cape Town, Cape Town, South Africa
- 2Department of Biological Sciences and Marine Research Institute, University of Cape Town, Cape Town, South Africa
Most studies report the abundance of plastic items in the environment, but mass is an equally important currency for monitoring plastic pollution, particularly given attempts to balance the global plastic budget. We determined the size/mass composition of litter stranded on a remote, infrequently-cleaned sandy beach on the west coast of South Africa. Traditional surveys of superficial macro-litter were augmented by sieved transects for buried macro-litter (8-mm mesh), meso-litter (2-mm mesh) and sediment cores for micro-litter. Aggregating the data across all sampling scales, the total density was ∼1.9 × 10⁵ anthropogenic particulate pollutants per linear meter of beach, 99.7% of which were microfibers (most of which are likely not ‘plastic’). Plastics comprised 99.6% of beach macro- and meso-litter by number and 89% by mass. Small items dominated samples numerically, but were trivial relative to larger items in terms of their mass. Buried litter accounted for 86% of macro-plastic items, but only 5% of the mass of macro-plastics, because smaller items are buried more easily than large items. The total density of plastic (∼1.2 kg⋅m–1), at least half of which was from fisheries and shipping, is much lower than predicted by global models of plastic leakage from land-based sources. Ongoing degradation of plastic items already in the environment, particularly on beaches, is likely to result in a marked increase in plastic fragments, even if we stop leaking additional plastic. The collection of large items from beaches is a useful stop-gap measure to limit the formation of micro-plastics while we formulate effective steps to prevent plastic leakage into the environment.
Introduction
Plastics are a diverse group of synthetic chemicals that have a myriad of uses thanks to their lightness, strength, durability, and insulative and barrier properties. However, these traits combine to make inappropriately discarded plastics a major pollution threat, with a diverse array of environmental impacts (UNEP, 2009). Plastic litter is now ubiquitous in marine systems, where it occurs as floating litter, on the sea floor, suspended in mid-water, buried in sediments and stranded along coastlines (Bergmann et al., 2015; GESAMP, 2019). There is growing concern about micro-plastics, typically defined as plastic fragments < 5 mm in diameter (Hartmann et al., 2019), which are common constituents in sediments and surface waters (Thompson et al., 2004). Not only are micro-plastics by far the most abundant type of plastic pollution (e.g., Lee et al., 2013; Cózar et al., 2014; Eriksen et al., 2014), but small items probably have a larger impact on marine ecosystems than larger litter items (Barnes et al., 2009; Bergmann et al., 2015). Micro-plastics are ingested by a greater range of organisms than macro-plastic items (Ryan, 2016), and their much greater surface area to volume ratios promote the transfer of persistent organic pollutants and plastic-associated toxins into marine foodwebs (Takada and Karapanagioti, 2018).
Although much of the environmental focus in the last decade has been on micro-plastics, it is clear that, at least among floating plastics, most of the mass is in macro-plastic items. For example, Eriksen et al. (2014) estimated that macro-plastics (>5 mm) accounted for more than 85% of the mass of floating plastic at sea, despite accounting for < 8% of floating items > 0.3 mm. Indeed, the items larger than 200 mm (only 0.2% of floating plastic items) were estimated to be responsible for 75% of the mass of floating plastic. The empirical data for macro-plastics was less robust than for micro-plastics (Eriksen et al., 2014), but the same pattern emerged in a detailed study of the North Pacific ‘garbage patch,’ where macro-plastics accounted for 92% of the mass of plastics despite comprising only 6% of floating plastic items (Lebreton et al., 2018).
Tracking the mass of plastics is important for understanding the dynamics of plastic litter in marine ecosystems (Ryan et al., 2009, 2020). In particular, it is critical to try to balance the global plastic budget. Jambeck et al. (2015) estimated that in 2010 alone, some 5–12 million tons of plastic leaked into the sea from land-based sources, 20–50 times more than the total estimate of plastic floating at sea (even allowing for the fact that Eriksen et al., 2014 may have underestimated the amount of micro-plastics; van Sebille et al., 2015). Although estimated inputs from rivers (0.5–2.7 million tons per year; Lebreton et al., 2017; Schmidt et al., 2017) are less than the Jambeck et al. (2015) estimate, they are still much greater than at-sea estimates of floating plastic. Even allowing for sinking of polymers that are more dense than seawater (e.g., PET, PVC, PS which comprise some 40% of global plastic production by mass), there is a gross mismatch between the estimate of land-based sources of plastics and what we can account for at sea. One possible explanation for the mismatch is that most plastics entering the sea rapidly fragment and sink to the seafloor (Koelmans et al., 2017). However, most dated items found floating in the North Pacific gyre (Lebreton et al., 2018) are much older than the average 3-year residence time for floating items predicted by Koelmans et al. (2017).
Lebreton et al. (2019) included beached plastic in their model of plastic flux, and were able to balance the global plastic budget if almost all plastic items from land-based sources (96–98%) strand within 1 year of entering the sea, and if only 1% of stranded/seabed macro-plastic is resuspended and returned to coastal surface waters each year. These estimates appear to be quite extreme, but physical models also predict that a high proportion of micro-plastic litter leaking into coastal waters washes ashore (Collins and Hermes, 2019; van Sebille et al., 2020) and coastal surveys suggest that most macro-litter from land-based sources strands close to where it enters the sea (Rech et al., 2014; Willis et al., 2017; Ryan, 2020a). These results suggest that beaches are important sinks for plastic litter, and thus a thorough understanding of the amount of plastic on beaches is central to balancing the global plastic budget.
Beaches are the marine compartment where we have the best information on the abundance and composition of plastic pollution (GESAMP, 2019; Ryan et al., 2020), but there remains considerable confusion about how best to characterize plastics on beaches (Browne et al., 2015). Early studies of beach litter reported the amount per linear meter of beach for both macro (e.g., Dixon and Dixon, 1983; Merrell, 1984) and micro-plastics (Gregory, 1978; Ryan and Moloney, 1990). This makes sense because litter washes up in a linear front and accumulates in a series of strandlines ranging from the most recent wave front, through the last high tide line and a succession of older strandlines to the extreme storm strandline (GESAMP, 2019; Ryan et al., 2020). Lightweight items often blow farther inland until they become trapped by vegetation. All these areas were sampled in traditional beach litter studies, which reported densities per unit length of beach. Density estimates per unit area are greatly influenced by beach width, which plays little role in determining the amount of litter washing ashore. The increasing focus on micro-plastics has seen a shift toward reporting densities per unit area or volume of beach, which is more compatible with the small scale of sampling appropriate for micro-plastics. However, this method largely ignores the systematic variation in litter density across the beach profile (Chubarenko et al., 2018, 2020b), with most studies deliberately targeting the ‘main’ strandline, usually without any attempt to assess how this relates to other parts of the beach, or even if plastic concentrations are indeed greatest along this strandline. Attempts to extrapolate total litter loads on beaches from area-based density estimates are thus fraught with difficulty, with estimates at best using a stratified approach that acknowledges the predictable structure linked to position on the shoreline (e.g., Lavers and Bond, 2017). The most comprehensive method remains sampling across the width of the beach, as was done in traditional beach litter studies.
Olivelli et al. (2020) highlight the importance of integrating all litter items from the waterline to the backshore vegetation. However, their visual survey approach ignores critical processes within the beach. The pattern of increasing litter item size from the sea to the backshore is a simple consequence of the much greater abundance of small plastic items at sea (which means most items washing ashore are small) and the differential burial of smaller items as you move toward the back of the beach (because smaller items are buried much more rapidly by windblown sand or infiltration than large items; see section “Results”). To date, few studies have sampled buried litter on beaches, even though it may account for a significant proportion of beach litter (Browne et al., 2015). Kusui and Noda (2003) conducted perhaps the best study to date, but it is unclear how comparative their area-based approach is, given sampling at very different scales for differently-sized litter items (100 m2 quadrats for surface macro-litter and 0.16 m2 quadrats for buried litter). Also, they only sampled the top 5 cm of the beach, even though micro-plastics occur up to 2 m deep in beaches (Turra et al., 2014; Chubarenko et al., 2018).
Finally, most studies of beach litter focus on only one size class of litter, and thus there is no way to assess the proportion of the total litter load represented by different size fractions. The few studies that have sampled across different size classes have tended to report numbers of items, not mass (e.g., Lee et al., 2013). Only Martins and Sobral (2011) have characterized both numbers and masses of plastics in beaches and reported that micro-plastics (<5 mm) accounted for just over 50% by number but < 5% by mass. However, they only sampled the top 2 cm of sand, and their largest quadrats (2 m × 2 m) were too small to sample megalitter items (>1 m), which account for most of the mass of floating plastic at sea (Lebreton et al., 2018) and require large areas to sample adequately on beaches (OSPAR, 2010).
In this study, we characterize beach plastic and other anthropogenic litter across the full size spectrum from micro to megalitter items. To do so, we pool data from samples collected from the surface and buried to 15–20 cm deep across a range of spatial scales and integrated from the waterline to the backshore dune vegetation. By selecting a remote beach with very few visitors and little if any beach cleaning effort, we provide a snapshot of the plastic load typical of marine inputs, which can be compared to the size distribution of plastics recorded at sea. By reporting the relative contribution of different size classes, we provide the first estimate of the proportion of beach litter mass represented by superficial macro-litter. Such estimates are needed to infer how much plastic is stored in global beaches, although the proportion likely varies with beach type and recent patterns of erosion/deposition as well as cleaning effort.
Materials and Methods
Field Sampling
We sampled stranded litter along a 500 m-stretch of open sandy beach near the center of 16 Mile Beach (33.214°S, 18.082°E), a long, remote beach in the West Coast National Park, 85 km north of Cape Town, South Africa (Supplementary Figure S1). Like most beaches in the region, it is a dissipative beach with a gently shelving low shore, increasing in slope toward the backshore. The intertidal zone averages around 30–40 m wide, with a further 5–10 m from the spring high tide line to the start of the dune vegetation. The beach lies in the downstream plume of litter emanating from Cape Town (Collins and Hermes, 2019) and is characterized by a mix of local, land-based litter and fishery/marine inputs (Fazey and Ryan, 2016). By sampling 10 km from the north end of the beach, distant from easy access points, we reduced the risk of significant local inputs by beach-goers and loss of items to beachcombers or informal cleaning efforts (cf. Ryan et al., 2009). Prior to 2010, only the ends of the beach were cleaned once or twice per year by volunteers and park staff. The central section was not cleaned, other than informal efforts by members of the public (e.g., selective removal of sought after items like fishing floats). Since 2010, teams employed by the government’s ‘Working for the Coast’ program1 have cleaned the beach more systematically, and so no surveys of macro-litter were conducted after 2010.
We used four approaches to sample three size classes of litter items. Items large enough to be collected by hand, similar to those removed by manual cleaning efforts (roughly > 10 mm), were picked from the surface of the beach. These traditional surveys of superficial macro-litter were augmented by sieved transects for buried macro-litter (8-mm mesh), meso-litter (2-mm mesh) and sediment cores for micro-litter. Although these mesh sizes do not correspond exactly with the definitions of macro-, meso-, and micro-plastics (e.g., Hartmann et al., 2019) they are close enough that we use these terms as a convenient shorthand to report the results from the different sampling approaches.
Macro- and meso-litter were sampled during the austral summer in March 2010, and meso- and micro-litter were sampled in November 2017. The relative importance of buried versus superficial macro-litter was estimated from eight 1-m wide transects running from the waterline to above the storm strandline. Transects were located 50 m apart. After demarcating each transect, all surface litter was collected from the water line to above the storm strand line (retaining items that straddled the transect boundary if they were more than half in the transect). We then sampled buried litter from the most recent high tide line to above the storm strand line (Figure 1). Spades were used to dig up the sand, which was passed through a 1 × 1 m raised sieve with a 8 × 10 mm-mesh (Supplementary Figure S2). We sampled two depth strata: first the top 5 cm of sand was sieved, and then sand 5–15 cm deep was sieved. All retained material was sorted to collect macro-litter items, which were returned to the lab for processing (see below). Macro-litter from a further 10 such transects was collected in March 2008, increasing the sample size and providing an indication of inter-year variability in buried litter loads.
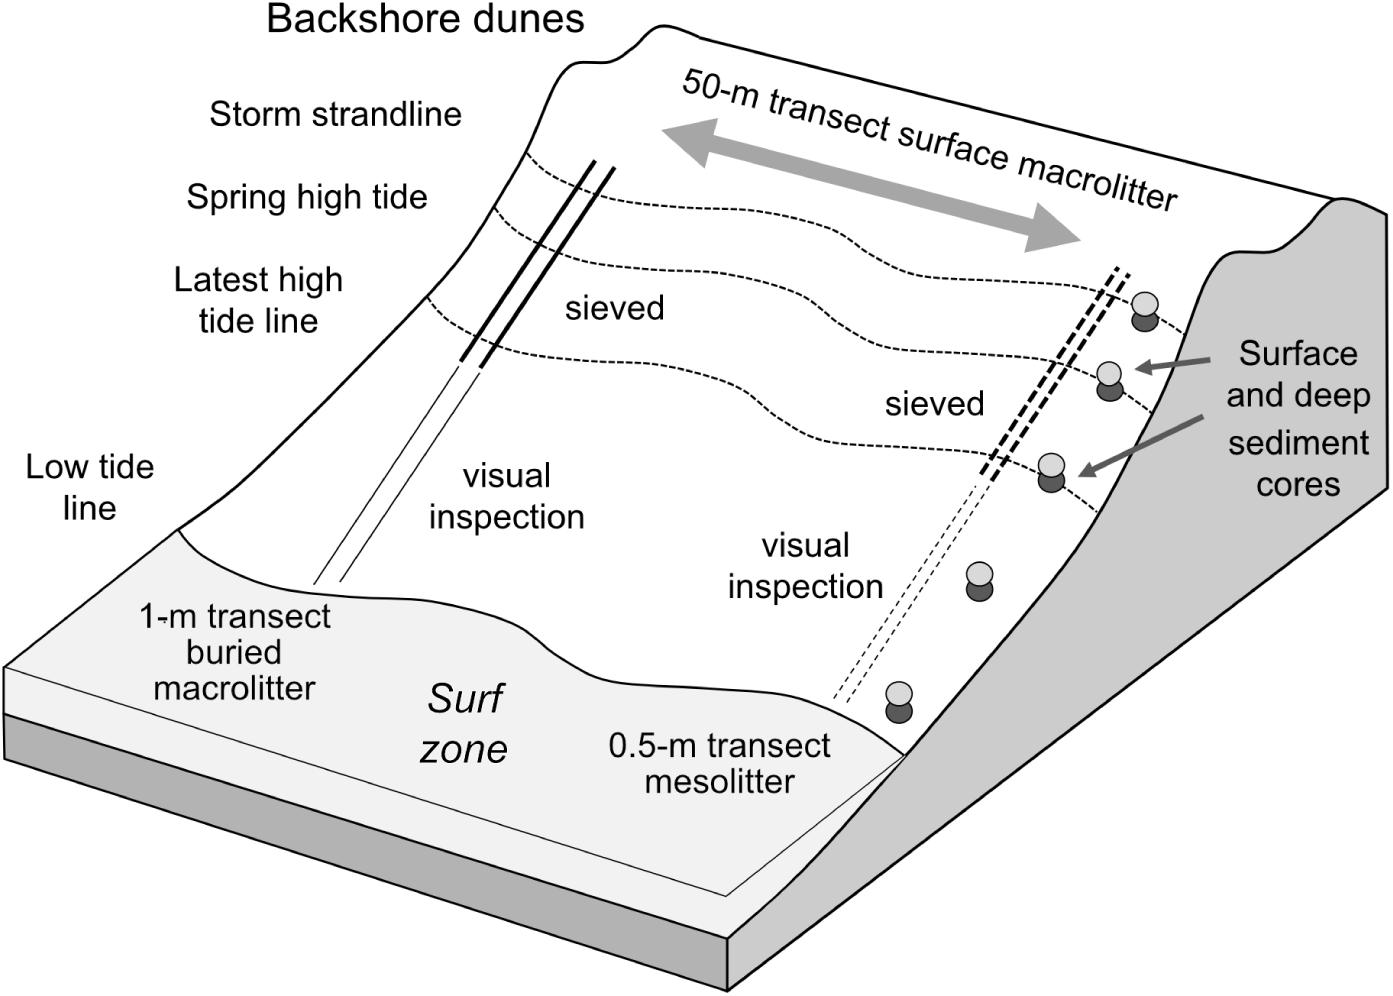
Figure 1. Schematic diagram of sampling protocols, combining 50-m transects for surface macro-litter, 1-m coarse-sieved samples for buried macro-litter, 0.5-m fine sieved samples for meso-plastics, and paired sediment cores (shallow and deep) at five sites across the beach profile for micro-plastics.
In 2010, we augmented the 1-m macro-litter transects with more extensive macro-litter surveys in four 50 m-wide stretches of beach, each bounded by two 1-m macro-litter transects (Figure 1). Teams scoured the area from the waterline to the back of the storm strand line and into the adjacent vegetated dune fringe, where wind-blown litter from the beach accumulates. In tandem with each 1-m macro-litter transect we also sampled meso-litter in the top 5 cm of sand in a 0.5-m wide transect with a 2-mm mesh sieve (Ryan et al., 2018). The sand deeper than 5 cm was too wet and coarse to sieve with the fine-meshed sieve. The area of wet sand below the recent high tide line was searched visually for any recently-stranded meso-litter items, which were added to the samples. Litter was collected from the sieved material by searching visually. All remaining material was then poured into a large bucket of seawater to detect any small floating litter that may have been confused with denser particles such as shell fragments. Repeated swirling of the bucket contents detected plastics with densities greater than seawater (because they remain in motion for much longer than more dense shells and stones). Again, all anthropogenic material was returned to the lab for processing.
In 2017, we sampled micro-plastics at the same site using a series of core samples. A 7-cm diameter metal corer was used to collect surface and deep core samples, each ∼12 cm deep (∼480 cm3) and comprising 828 ± 81 (SD) g of sand (dry mass). The surface core was removed, and then a second, deeper core taken from immediately beneath the surface core. Each core was stored in a foil tray with a card lid for transport to the laboratory. The paired surface and deep samples were collected at low tide from five locations up the beach profile: at the low shore, mid shore, most recent high tide line, the spring high tide line and storm strand line (Figure 1). The distances between each sample site were measured to the nearest 0.5 m. Three such transects were sampled, 50 m apart. The average (± SD) distances between core sites extending up the shore from the low shore were 15.3 ± 1.5 m (low to mid shore), 9.3 ± 0.6 m (mid shore to high tide line), 6.5 ± 1.2 m (high tide to spring high) and 2.5 ± 0.5 m (spring high to storm strandline). Each micro-plastic core transect was paired with a 0.5-m meso-litter sieved transect as conducted in 2010 (see above). These sieved samples were divided into three levels on the shore, linked to the top three coring sites: from the recent high tide line to 1.5 m below the spring high tide line; from there to midway between the spring high and storm strandlines; and from there to 1 m above the storm strandline. Another 0.5-m sieved sample collected in 2015 from the same site (Ryan et al., 2018) was also included to give a total of 12 meso-litter samples.
Sample Processing
All macro- and meso-litter was categorized by material (plastic, glass, wood, paper, metal, etc.) following standard beach survey protocols employed since the 1980s on South African beaches (Ryan and Moloney, 1990). Most macro items were also placed into major categories of use: different types of packaging, other single-use items, fishing and shipping gear, other user items, etc. After cleaning off any sand, large items (>1 kg) were weighed in situ with one of a series of spring balances (5–25 kg). All remaining items were removed from the beach, cleaned of sand, dried and weighed on top pan balances. Macro-litter items were weighed to the nearest 0.1 g, meso-litter to the nearest 0.1 mg. Not all macro items were weighed individually; groups of similar items were weighed together (e.g., small ropes, sweet wrappers, etc.), assigning each item the average weight for the group (i.e., mass/n).
In the lab, each micro-litter sand core was dried, weighed to the nearest 0.1 g and then added to 2 L of a saturated salt (NaCl) solution in a well-rinsed 5-L glass beaker (Mathalon and Hill, 2014; Nel and Froneman, 2015). The salt solution was pre-filtered through a 25 μm filter because even the laboratory-grade salt we used contained microfibers. The beaker was stirred vigorously with a metal spoon, covered with metal foil and allowed to settle for 24 h, after which the supernatant was filtered through a 25 μm nylon filter. The filter was examined under a dissecting microscope to collect all visible anthropogenic particles. Fibers were identified as anthropogenic in origin if they were an homogeneous color, had a constant width, if there were no organic or cellular structures visible and if they did not break apart when pulled using tweezers (Hidalgo-Ruz et al., 2012; Horton et al., 2017). All items were measured (approximate length and diameter for fibers; mean length, breadth, and depth for fragments) to the nearest 1 μm using a graticule. The approximate mass of items was inferred from item volume (l⋅b⋅d for fragments; l⋅π⋅r2 for fibers), assuming a mean density of 1.0 mg⋅mm–3 for plastic fragments, 1.2 mg⋅mm–3 for fibers and 0.016 mg⋅mm–3 for expanded polystyrene (Andrady, 2017). Every attempt was made to reduce the risk of contamination. All lab equipment was covered with metal foil when not in use and thoroughly rinsed with Milli-Q water prior to use. All filters were triple-rinsed with Milli-Q water prior to use. To estimate levels of contamination in the lab, a control filter was exposed whenever a sample was uncovered. Control filters contained 0–3 fibers (average 0.59 ± 1.01 SD, n = 33 controls), with 67% of controls containing 0 fibers. The fiber count from each control filter was subtracted from the matched sample count data (Suaria et al., 2020). Overall, this reduced the number of fibers counted in samples by only 6%. Three core samples were extracted a second time to estimate the proportion of items not recovered during the initial extraction process; only one fiber was recovered during the second extraction, from a sample with 0 fibers on the initial extraction, and may well have been a contaminant.
Data Analysis
The various data sets were combined to estimate the average total number and mass of plastic items per linear meter of beach. To integrate across the full size spectrum of litter sampled, we were perforce obliged to combine data across years, using macro-litter data from 2010, micro-litter data from 2017 and meso-litter data from both years. Although this is not ideal, long-term monitoring at the site [including five-yearly surveys of meso-litter and superficial macro-litter since the 1980s (Ryan and Moloney, 1990) and the buried macro-litter sampling in 2008 and 2010] show limited inter-year variation in litter loads at this beach at least in the last two decades. Data on micro-plastics are more limited, but also suggest relatively little temporal variation (de Villiers, 2018). Ultimately, we consider the biases potentially introduced through combining data collected in two different years to be no greater than those resulting from the extrapolation required to integrate data across sampling scales ranging over 4–5 orders of magnitude (see below). Our results should be seen as more qualitative than quantitative, giving only a crude indication of the relative contribution of the different litter size classes to the number and mass of litter items.
The size of items was scored based on their mass (g), using a log scale ranging across 13 orders of magnitude (from < 0.1 μg to 100 kg). Because not all macro-litter items were weighed individually, and micro-plastic masses were inferred from measurements, the estimates of abundance by size class are indicative rather than precise. Micro-plastic densities from sediment cores were extrapolated based on the average beach width, assuming that the core samples were central within each sample zone. We assumed densities recorded by the low shore cores extended another 5 m down shore and the storm strandline extended another 1 m into the dunes, giving an effective transect of 39.6 m. However, for the spring high tide line, which had an appreciably higher density of microfibers than the recent high tide line, we only applied its density 1.5 m downshore toward the recent high tide line. Given the small size of the cores (7 cm diameter), the extrapolation factors to estimate densities per meter of beach were very large (195–1096, given three replicates per shore stratum). Rather than trying to combine these error terms, we simply report the coefficients of variation (CV) for each sampling approach, to give a rough idea of the confidence in each estimate.
Superficial macro-litter density was based on the 50 m beach collections because these samples captured more large, scarce items, as reflected in the greater mass per meter of beach from these samples compared to the 1 m-transects (Table 1). The 1-m sieved transects provided data on buried macro-litter and the 0.5-m sieved transects estimated meso-litter in the surface 5 cm. Macro-litter items that would have been captured by the macro sieve (>10 mm) were discarded from the meso- and micro-samples. However, we explored the implications of extrapolating meso-litter from the micro-plastic core samples in the estimate of total litter load.
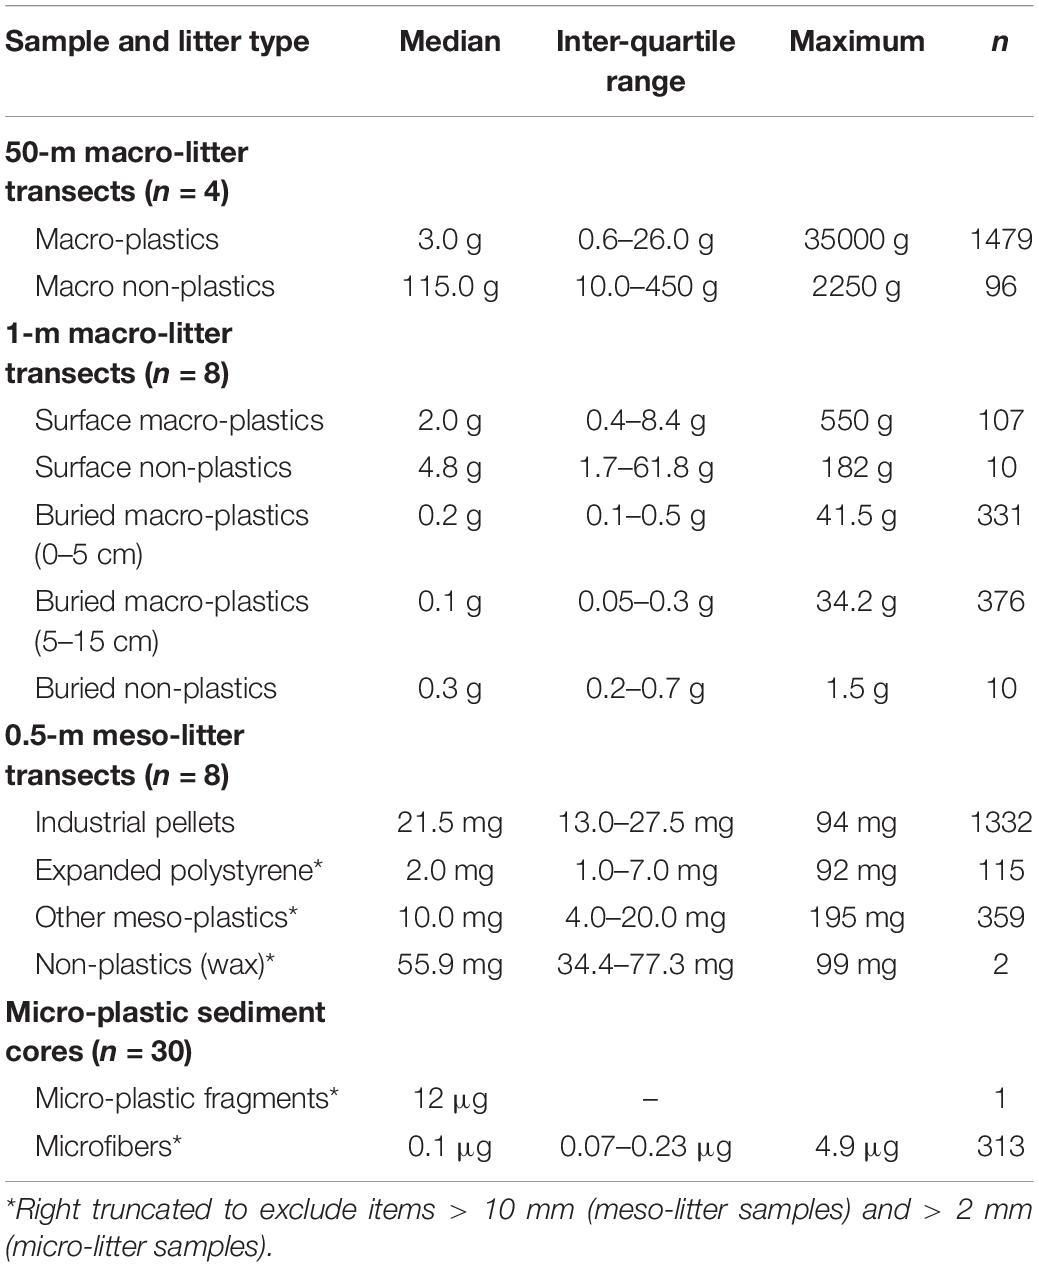
Table 1. The median and maximum masses of litter items sampled at different spatial scales on a beach in the West Coast National Park, South Africa, in 2010 (macro- and meso-litter) and 2017 (micro-litter).
All size classes of litter were strongly right skewed and so we report median and inter-quartile ranges (IQR) for masses. We used Spearman rank correlations to test for consistent patterns in the abundance and mass of surface versus buried macro-litter, and among samples of macro and meso-litter collected in 2010. Generalized linear models (GLMs; R Core Team, 2019) were used to assess which factors determine the number and length of microfibers in core samples. For the number of microfibers, we fitted the GLM with a negative binomial distribution because the data were over-dispersed; for fiber length, we used a gamma distribution because the data were strongly right-skewed and constrained to lengths > 0. Explanatory variables in both models were shore stratum, sample depth and transect (A–C).
Results
Macro-litter
The patterns detected in the 10 1-m macro-litter transects sampled in 2008 and the eight transects in 2010 were broadly similar in terms of both the number (Supplementary Table S1) and mass (Supplementary Table S2) of items collected, and so data from the 2 years were pooled. Variance among replicates was moderate; coefficients of variation (CV) were 43% for numbers of items, and 75% for mass of items, with little difference in CVs among depth strata. Surface items comprised only 10.6% of macro-litter items; 41.0% were in the top 5 cm, and 48.4% from 5 to 15 cm deep. Given the greater volume of sand sampled in the deeper stratum (2x surface stratum), the density of buried macro-litter almost halved from the surface 5 to 5–15 cm. Despite the numerical dominance of buried macro-litter, superficial items accounted for 66.1% of the mass of macro-litter, because the mass of surface items was much greater than buried items (Table 1). This was reflected in the greater abundance of small litter items among buried litter (e.g., straws, rigid plastic fragments, and cigarette butts), whereas large items such as bottles and pieces of wood were mostly recorded on the surface (Table 2 and Supplementary Table S1).
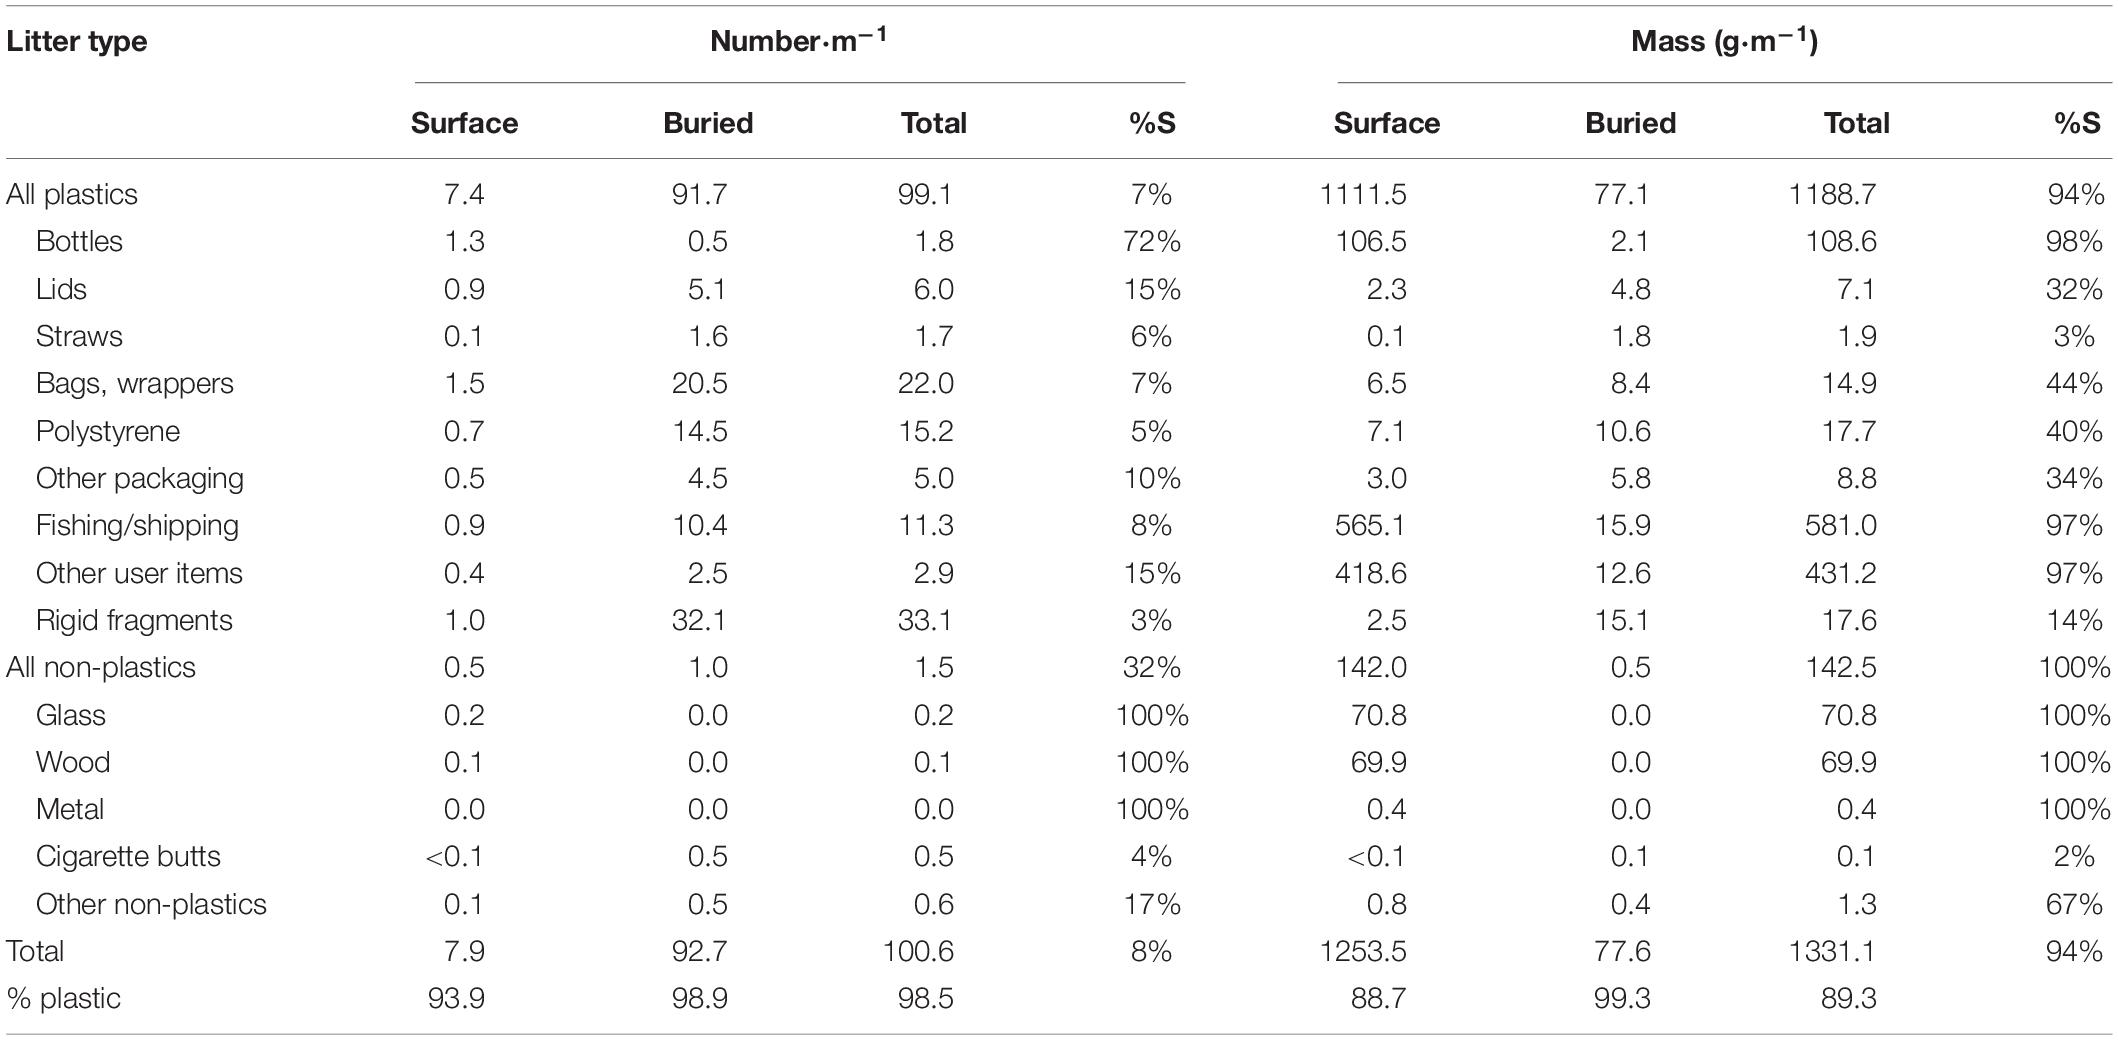
Table 2. The abundance and mass of macro-litter per meter of beach in the West Coast National Park, South Africa, in 2010 sampled by four 50 m-transects for surface litter each with two paired 1-m transects for buried litter, and the percentage of surface litter of the total (%S).
Most macro-litter items were plastic (97.0%). There was a slight increase in the proportion of plastic items from the surface (93.6%) to buried litter (97.4% for 0–5 cm and 97.5% for 5–15 cm) due to the greater mass (and size) of non-plastic items than plastic items (Table 1). However, it was clear that the 1-m transects failed to adequately sample large litter items. In 2010 we therefore collected all superficial macro-litter in four 50-m transects, each paired with two 1-m buried litter transects (one at either end of the 50 m stretch). In total, 1575 macro-litter items weighing 204.6 kg were collected in these 50-m transects. CVs for the four 50-m macro-litter transects were 25% for the number of items and 61% for mass. Surface litter density (7.9 m–1) was half that recorded in paired 1-m transects (14.6 m–1, Supplementary Table S1), possibly because search intensity was greater in the smaller 1-m wide transects. However, the density of litter by mass was four times greater (1.03 kg⋅m–1 compared to 0.23 kg⋅m–1 in the 1 m-transects, Supplementary Table S2) because 50-m transects captured more large, scarce items. The largest item sampled in the 50-m transects was a 35 kg tangle of polypropylene fishing rope, substantially larger than the largest item in all 18 1-m transects (a 550 g heavy-duty polyethylene bag).
Combining the surface litter data from the 50-m transects with the buried litter data from the paired 1-m transects sampled in 2010, there were just over 100 macro-litter items per meter of beach (Table 2). Surface litter comprised less than 10% of the total number of items, but contributed almost 95% to the total mass of litter. There was little difference in the composition or size of buried litter with respect to depth stratum (Figure 2 and Supplementary Tables S1, S2) and so they were pooled in Table 2. The mean mass of buried items was relatively constant irrespective of whether they were in the shallow (0.8 g) or deep (0.9 g) stratum. However, the masses of buried items were strongly right skewed (Figure 2), and median masses were considerably smaller than the means. Plastics comprised 93.9% of surface macro-litter items and 98.9% of buried macro-litter (Table 2). Non-plastic items contributed more in terms of mass than by number of items, especially among superficial macro-litter, but they still only made up 11.3% of the mass in this category (Table 2). Buried litter was more than 99% plastic by mass (Table 2). The total mass of macro-litter averaged 1.33 kg⋅m–1 of beach, of which plastics contributed 1.19 kg⋅m–1. Fishing gear and other marine-source litter accounted for 49% of the mass of macro-plastics, and 44% of the mass of all macro-litter.
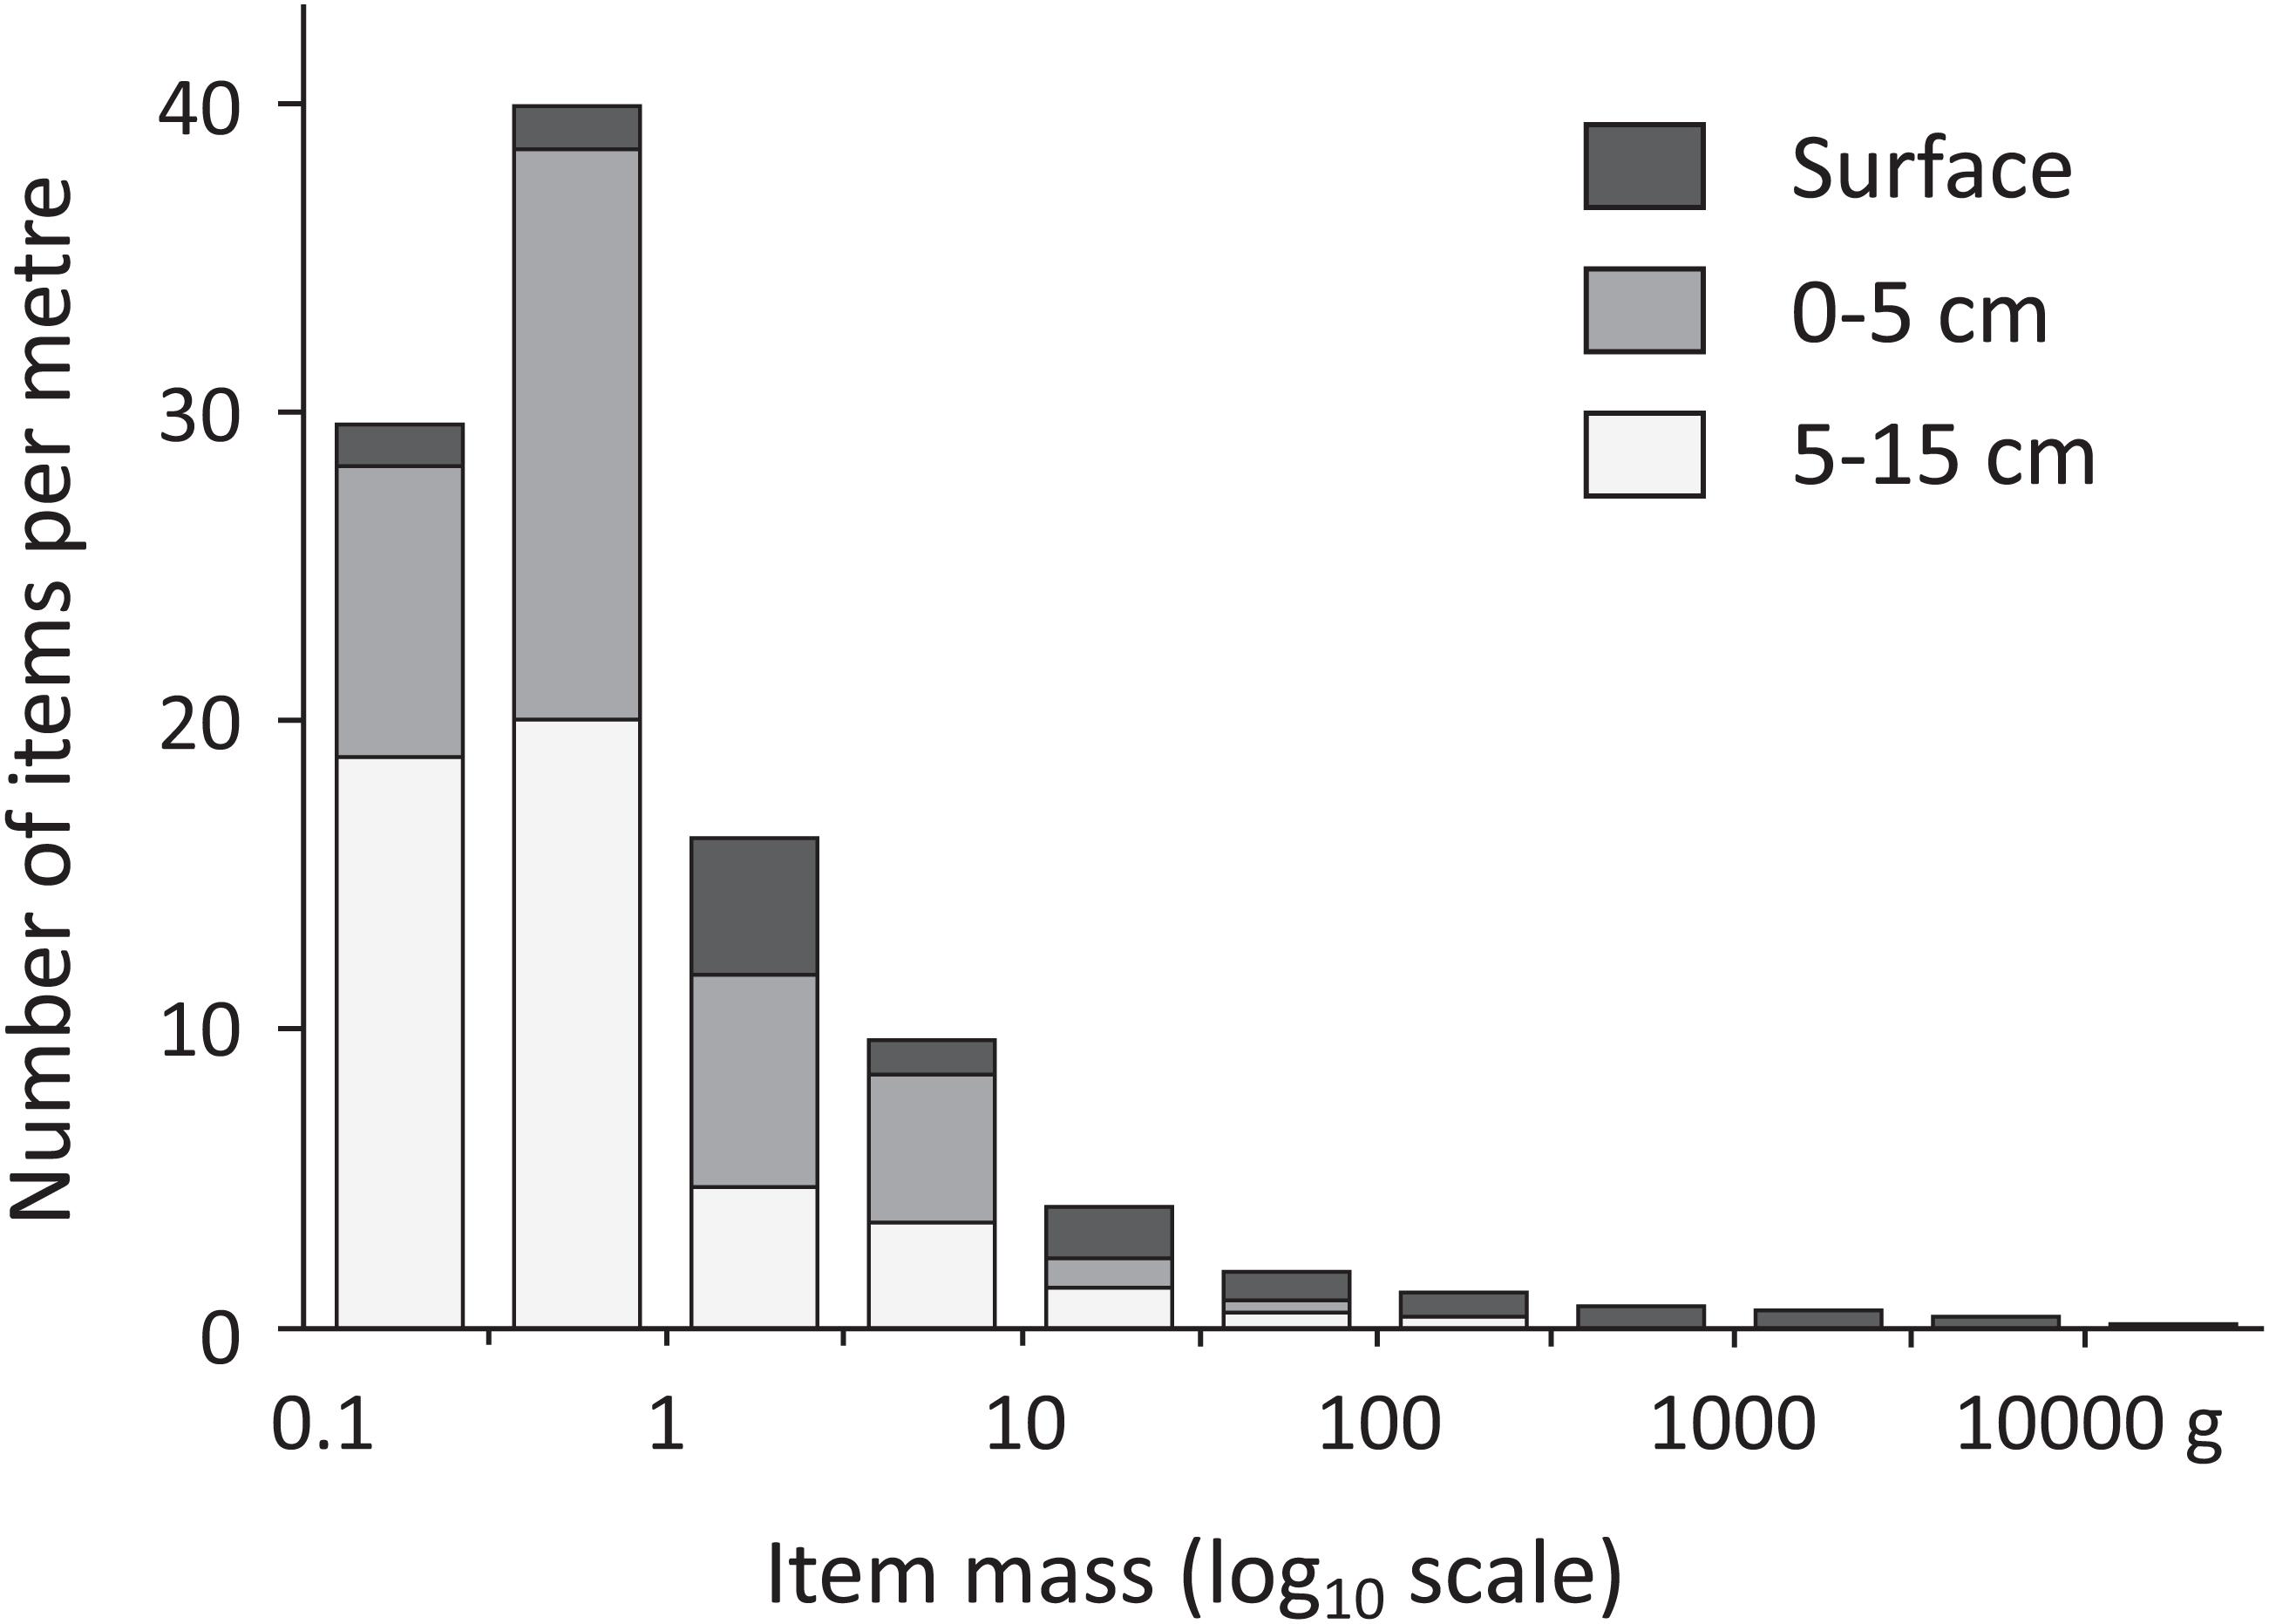
Figure 2. The frequency distribution of the masses of macro-litter items recorded at three depth strata in the beach in the West Coast National Park, South Africa in 2010 (surface litter data from four 50-m cleaned areas, buried data from eight paired 1-m wide sieved transects; items < 0.1 g pooled into the smallest size class).
Meso-litter
The 12 0.5-m transects contained 3437 meso-litter items (69.58 g), of which only two small pieces of paraffin wax (0.1%) were not plastic (Table 3). Industrial pellets accounted for 64% of the meso-litter (70% by mass), followed by rigid fragments (19% by number and 20% by mass) and expanded polystyrene (14% by number, 7% by mass). The variation among meso-litter samples was similar to that recorded among macro-litter samples, with overall CVs of 73% for the numbers and 74% for the masses of items collected (Table 3). Sampling over three different years did not greatly affect the variation among samples; CVs in 2010, when eight samples were collected ∼50 m apart, were similar: 66% for numbers of items and 69% for mass of items. The largest litter item recorded in a 0.5-m transect was a 224 g glass bottle.
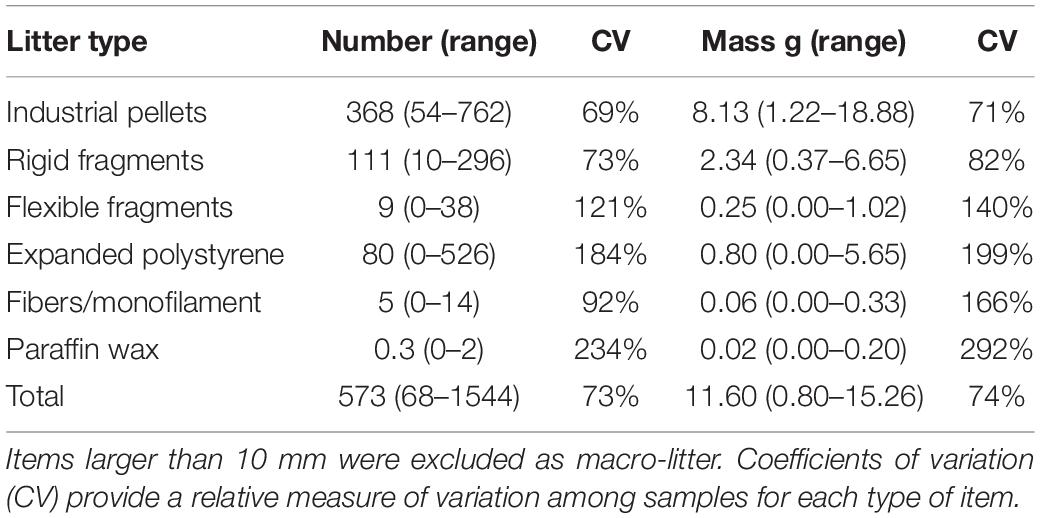
Table 3. The mean abundance and mass of meso-litter (2–10 mm) per meter of beach in the West Coast National Park, South Africa, based on 12 0.5-m transects sampling the top 5 cm of sand in 2010 (n = 8), 2015 (1) and 2017 (3).
Although we did not subdivide most transects across the beach profile, it was clear that meso-litter items (like macro-litter) were concentrated in a series of strandlines on the high shore, not all of which were evident on the surface. In the three transects sampled in 2017, meso-litter loads peaked around the spring high tide line in two transects, decreasing slightly to the storm strandline, but were much higher at the storm strandline in Transect C (Supplementary Table S3). Across all samples, the abundance of meso-litter in the top 5 cm of the beach averaged 573 m–1 of beach (444 m–1 based only on 2010 transects), roughly 10 times the density of macro-litter to this depth, and five times the abundance of macro-litter to 15 cm depth (Table 2). However, the total mass of meso-litter was only 11.6 g m–1 of beach (9.1 g m–1 based on 2010 samples), which is 0.9% of the mass of macro-litter, and 1% of the mass of macro-plastics.
Micro-litter
Microfibers were by far the most abundant anthropogenic items in the micro-litter cores. After correcting for fiber contamination, the 30 cores contained 296 microfibers and only one microfragment (<1 mm; Supplementary Table S3). Fibers were found in 26 of 30 cores, but there was considerable variation among samples and transects (count CVs among transects = 74–80%). All four cores lacking fibers were found in one transect (C), which contained only 10–15% of the number of fibers in the other two transects (Supplementary Tables S3, S4). There was a tendency for microfibers to be more abundant toward the high shore (Supplementary Table S3), but the only shore stratum that had a significantly lower density of microfibers was the mid shore (Supplementary Table S4). Microfiber density tended to increase with sample depth (Supplementary Table S3), particularly on the low-mid shore, although this was not significant given the small number of samples (Supplementary Table S4).
The extrapolated abundance of micro-plastics was 188 × 103 microfibers and 200 microfragments per meter of beach (Table 4). Given the much greater width of the low and mid shore, these two strata accounted for just over half of all microfibers, in stark contrast to larger litter items, which are predominantly found along the high-shore strandlines. Because microfibers were more abundant in the deep cores on the low shore, the extrapolated estimates suggest that there are twice as many fibers per meter of beach in the 12–24 cm depth stratum (128 × 103 m–1) than there are in the surface 12 cm (60 × 103 m–1).
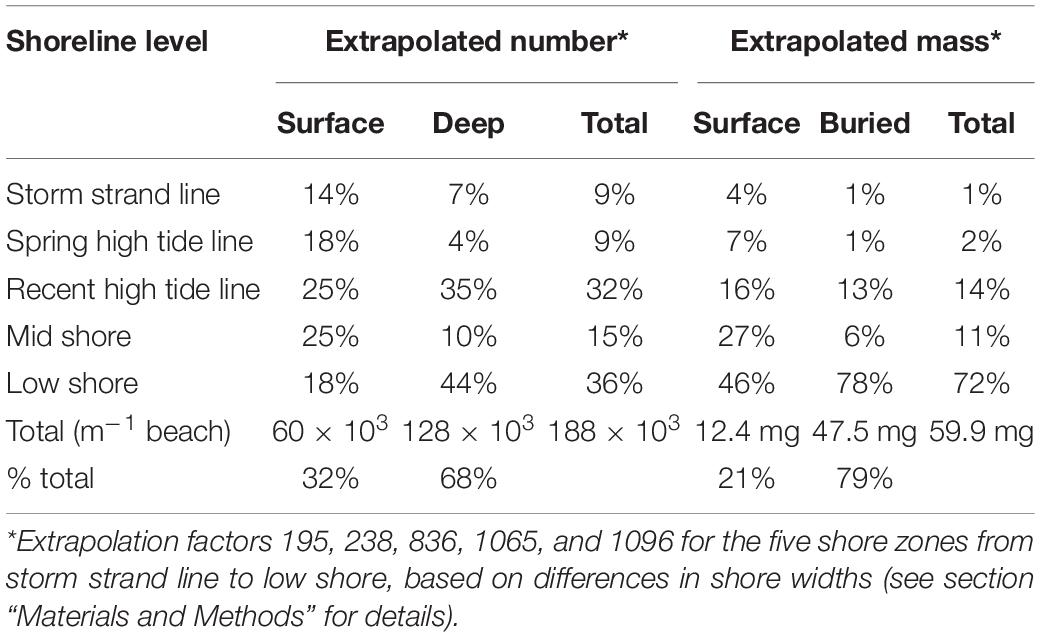
Table 4. The proportions of microfibers at different levels on the shoreline and at two depth strata in 2017, expressed in terms of the number and mass of fibers.
Median microfiber dimensions were 524 × 14.3 μm (length IQR 421–1016, diameter 13–16 μm). Microfibers tended to be longer in deeper cores at all levels on the shore (Figure 3 and Supplementary Table S5). The estimated masses of individual microfibers ranged from 0.003 to 4.9 μg (Table 1). Extrapolating from the dimensions of the fibers measured for each depth and shore stratum, the estimated mass of microfibers per meter of beach was 60 mg (Table 4). Because deep cores tended to have longer fibers, the skew in mass with depth was even greater than abundance, with deep cores accounting for 79% of the estimated mass of microfibers, and the low and mid-shore accounting for 84% of the mass (Table 4).
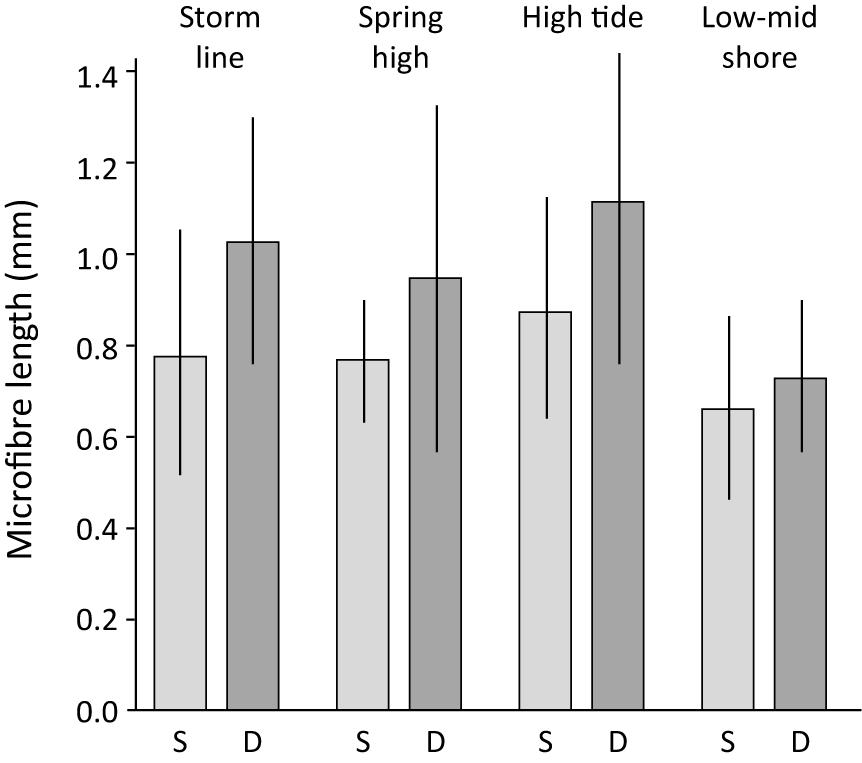
Figure 3. The mean length of microfibers from surface (S, 0–12 cm) and deep (D, 12–24 cm) cores collected at three sites on a beach in the West Coast National Park, South Africa, in 2017. Bars show 95% confidence intervals of the mean.
Meso- and macro-litter was found in five cores, all from the top two sample strata: six items in two cores from the storm strandline, and nine items from three cores from the spring high tideline. All 15 items were plastic: five macro-plastic fragments (maximum mass 1.63 g) and 10 meso-plastics (three fragments of hard plastic, three industrial pellets, three foamed polystyrene balls and one tiny length of monofilament line). Most (14 of 15) meso- and macro-litter items were found in deep cores, including nine meso-plastics. Extrapolating from these data gives a surface meso-litter density of 2.4 × 10² industrial pellets (5 g) per meter of beach in the surface 12 cm, which is similar to the amounts estimated from the meso-litter sieved transects. However, the deep core meso-litter extrapolates to 1.9 × 10³ meso-plastics per meter of beach with a total mass of 48 g, which is substantially more than that estimated from the meso-litter sieved transects.
Spatial Pattern
There were significant correlations between both the number (rs = 0.869, P < 0.02) and mass (rs = 0.885, P < 0.01) of macro- and meso-litter when we compared the data from the eight paired 1- and 0.5-m transects conducted ∼50 m apart in 2010. Similarly, there were significant correlations between the number and mass of macro-litter items on the surface and buried in the 1-m transects in both 2008 (rs = 0.908, P < 0.001 and 0.893, P < 0.005, respectively) and 2010 (rs = 0.927 and 0.929, respectively, both P < 0.005). These results suggest that there is consistent spatial variation in the density of litter items at a scale of 10s to 100s of meters along the beach. However, the patterns across years were less well-defined. Among all 18 1-m macro-litter transects there were significant relationships between the two depth strata (0–5 and 5–15 cm) in terms of the number (rs = 0.609, P < 0.01) and mass of litter items (rs = 0.512, P < 0.05), but only a weak correlation between the number of litter items on the surface and buried items (rs = 0.423, one-tailed P < 0.05); this relationship was not significant for the mass of litter items (rs = 0.333). There was no evidence of a link between microfiber densities and the paired meso-litter samples; Transect C had significantly fewer fibers than Transects A and B, yet was collected immediately adjacent to the 0.5-m transect with the highest meso-litter load (Supplementary Table S3).
The Litter Size-Mass Spectrum
Combining the macro and meso-litter data from 2010 with the micro-litter samples from 2017, the total density is ∼1.9 × 10⁵ anthropogenic particulate pollutants per meter of beach with a total mass of at least 1.45 kg (Table 5). All estimates are minima given the sampling limitations listed in Table 5. The number of items increases exponentially with decreasing particle size down to a mass of around 10 mg, then there is a large deficit in the numbers of micro-plastics down to around 1 μg, where the numbers of microfibers again fit an exponential model of increasing abundance with decreasing particle size (i.e., a linear trend on the log scale shown in Figure 4). The mass-frequency distribution highlights the importance of the small number of megalitter items in determining the total mass of litter (Figure 4). Only four items > 10 kg were sampled, yet they contributed the greatest amount of mass of any size class (Figure 4).
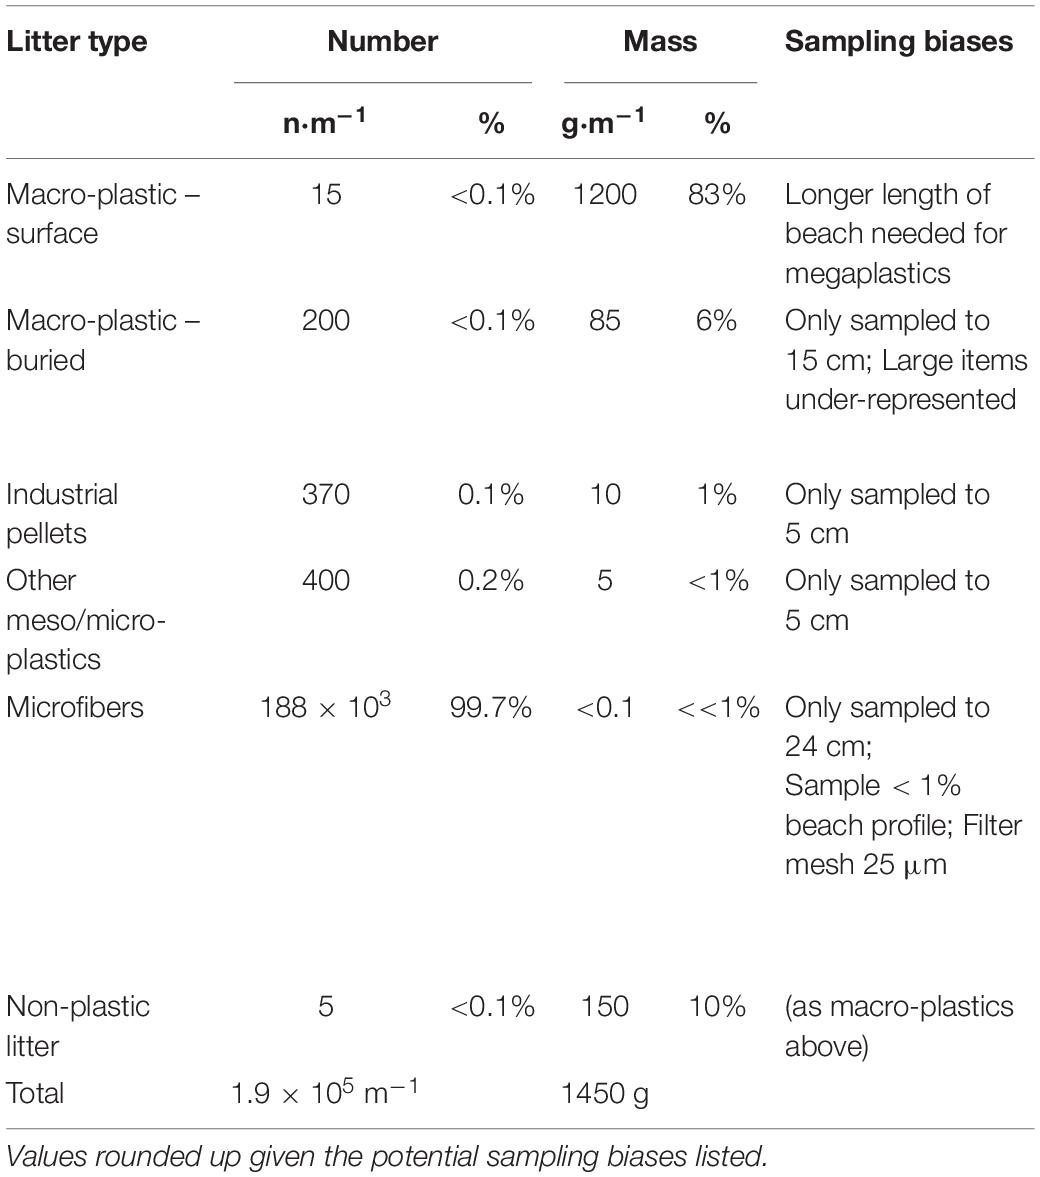
Table 5. Estimated numbers and masses of macro-, meso-, and micro-litter per meter of beach in the West Coast National Park, South Africa, combining data from 2010 (macro-litter), 2017 (micro-litter) and both years combined (meso-litter).
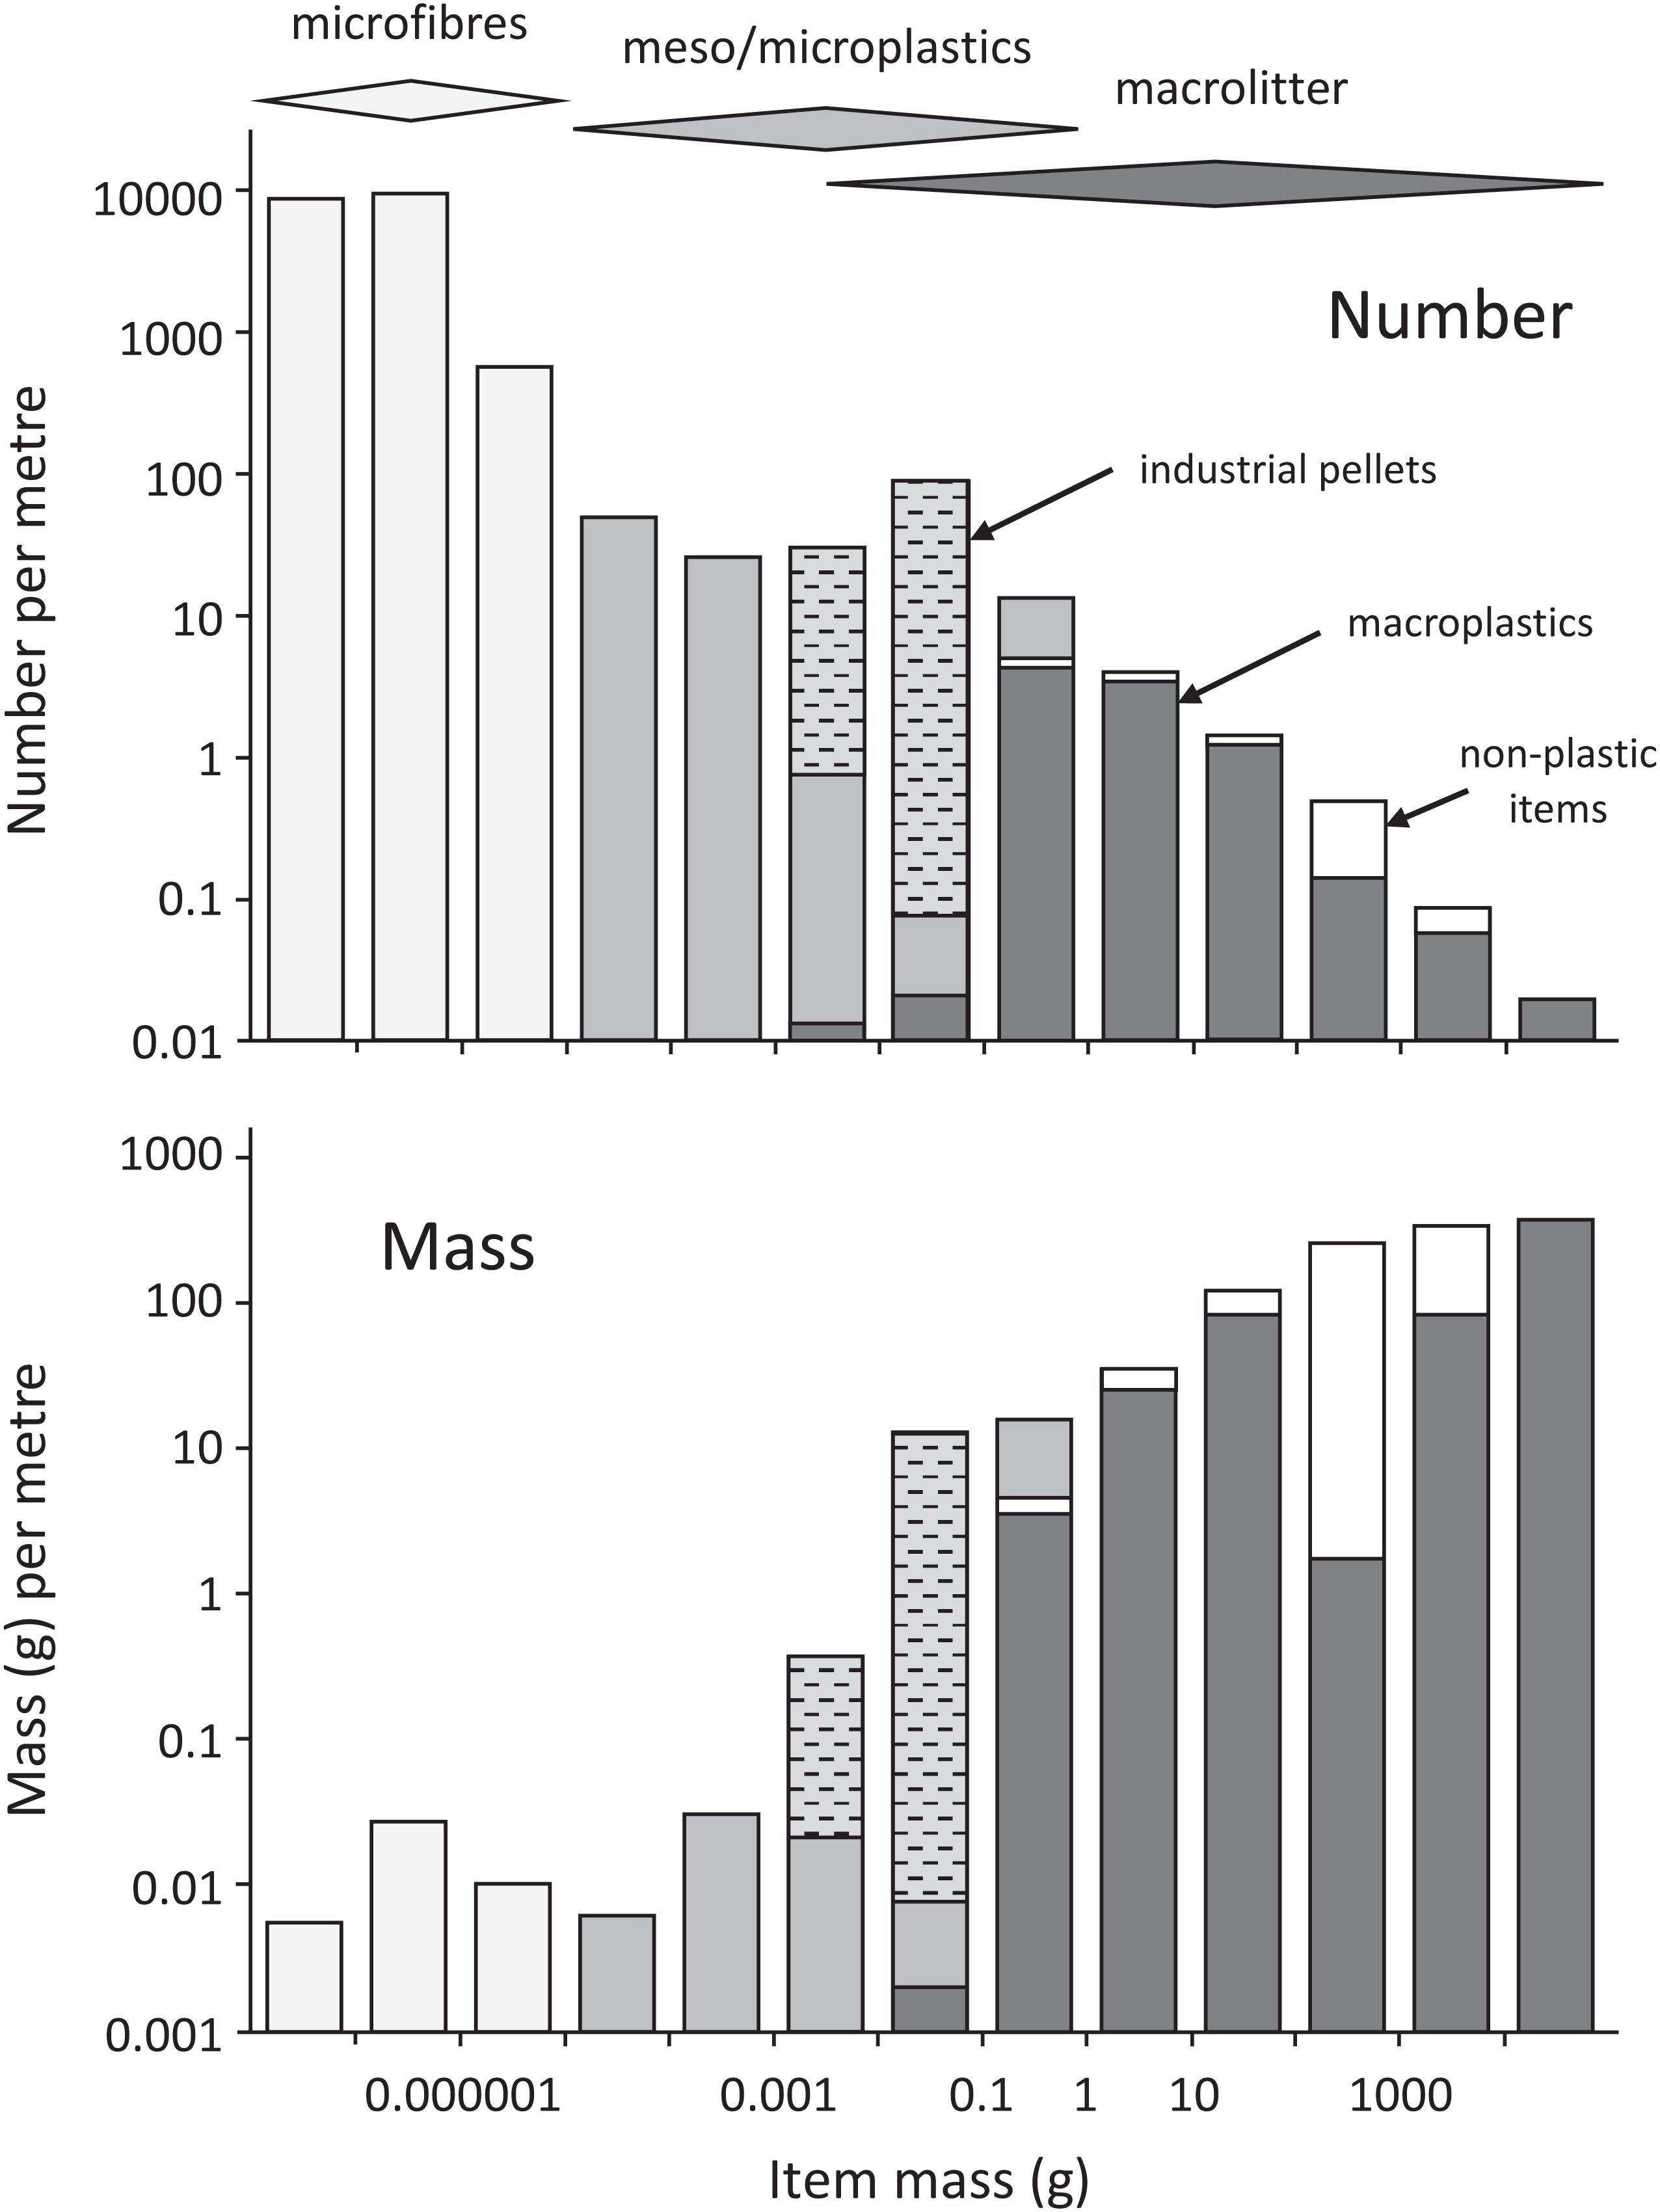
Figure 4. The contributions of macro-, meso, and micro-litter samples to the abundance and mass of plastic litter per meter of beach in the West Coast National Park, South Africa, pooling data from 2010 and 2017. Note log scales on both axes in both panels, but shading within each size class shows the proportional contribution of each litter class. Horizontal dashed lines = industrial pellets; white = non-plastic litter.
Discussion
Estimating the relative importance of different litter classes across the full size spectrum required sampling at a range of spatial scales appropriate to capture items ranging from micro (<1 mm) to mega (>1 m), spanning 13 orders of magnitude in mass from < 0.1 μg to 10s of kg (Figure 4). The effective length of beach surveyed ranged over five orders of magnitude from 200 m for surface macro-litter to only 0.002 m for micro-plastics (although three core transects represent 0.21 m of beach length, the five cores per transect represent only 0.9% of the beach profile). As expected, the maximum item size captured by each method was directly related to sampling scale (Figure 5). With hindsight we should have increased the spatial scale of our sampling; had we sampled 10 km of beach for megalitter, the total mass of litter per meter of beach would likely have been appreciably higher. Indeed, when we conducted the 50-m transects for surface macro-litter there was a massive marine floating buffer stranded about 1 km beyond our sampling area that weighed > 100 kg.
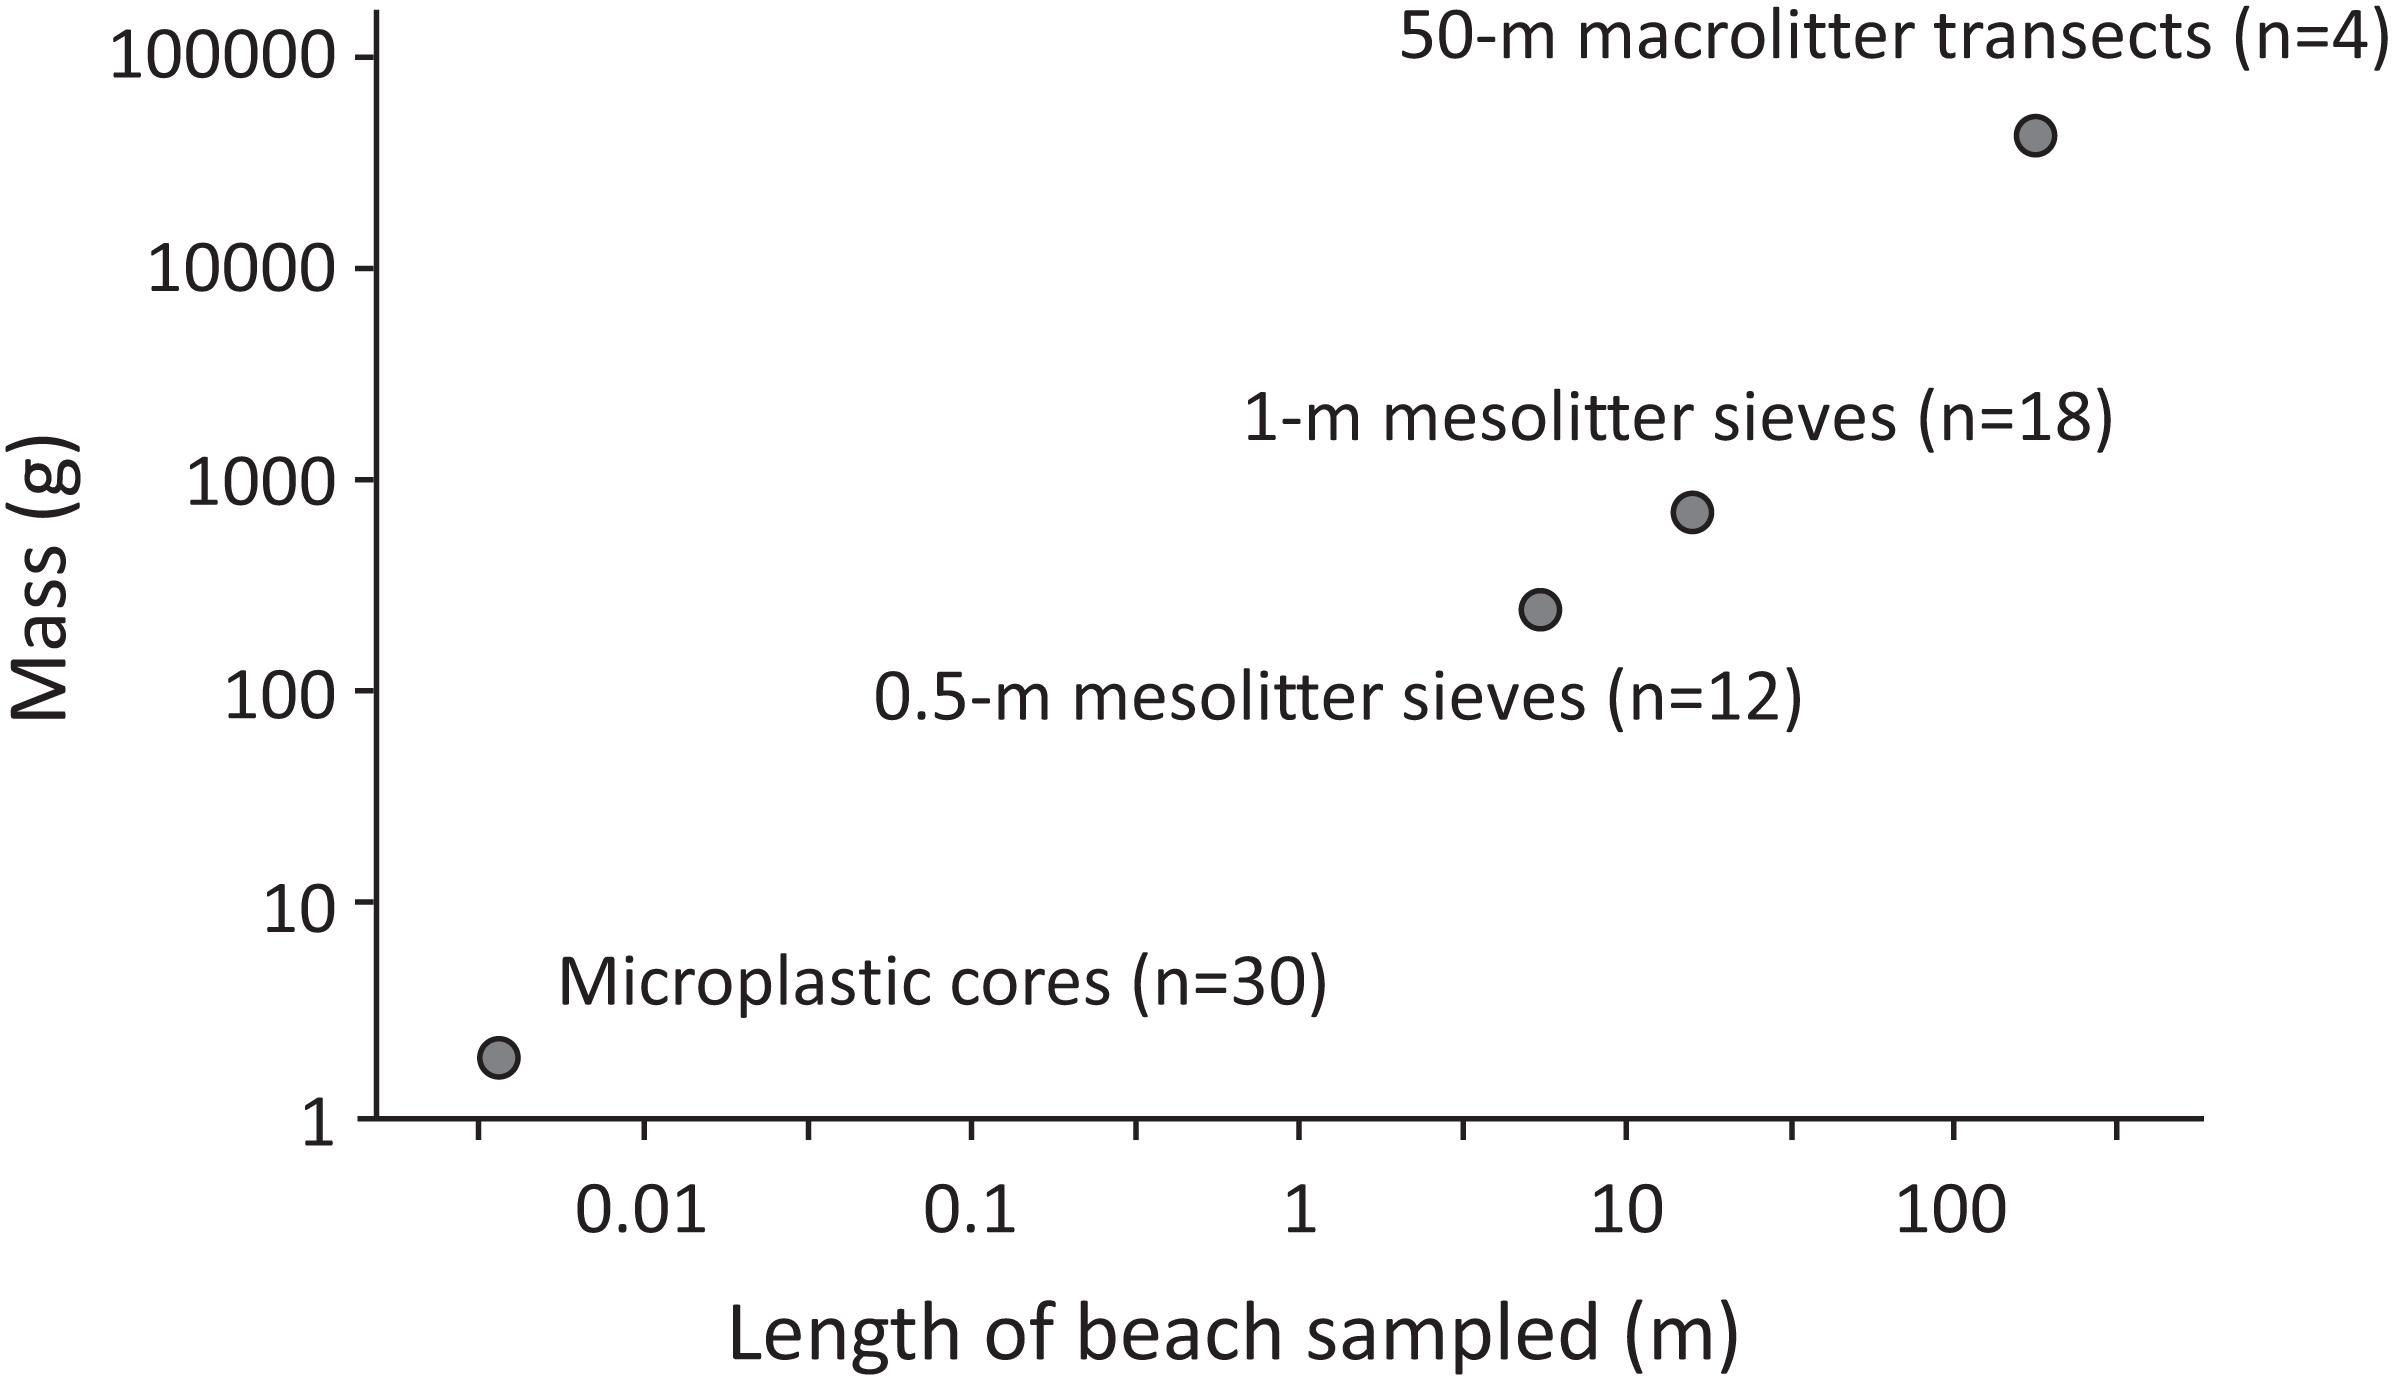
Figure 5. The maximum litter item size (mass) recorded using four different sampling methods to characterize the full size spectrum of litter on a beach in the West Coast National Park, South Africa. Note the log10 scale on both axes.
Integrating data collected at such a wide range of spatial scales inevitably leads to some gross extrapolation, particularly from the very small micro-plastic cores. There are also numerous methodological challenges to using sieves to characterize the distribution of particle sizes (Filella, 2015). Our replicate samples indicate varying levels of spatial variation in litter loads, with CVs mostly ranging from 25 to 80%. At least some of this variation was the result of consistent, local-scale variation in the abundance of different litter classes, but with little correlation between microfibers that were distributed throughout the shoreline and the larger, more buoyant litter items that were concentrated along high-shore strandlines. We were also obliged to pool data from two different years to obtain a picture of the full size spectrum distribution of litter. Fortunately, the comparisons of macro- and meso-litter densities showed that variation among years was similar to that among spatial replicates collected on the same day. However, when taken together, these factors mean that our estimate of the total amount of anthropogenic beach litter is perforce crude, although it appears to be the first attempt to sample across the full size spectrum of particulate pollutants across the beach profile. The results should be taken as largely indicative given the numerous sampling limitations listed in Table 5, but they give some insight into the relative abundance and mass of plastic and other pollutants stranding on a beach with little interference from land-based activities (either littering or cleaning).
Aggregating the data across all sampling scales gave a total density of ∼1.9 × 10⁵ anthropogenic particulate pollutants with a total mass of around 1.45 kg per meter of beach (Table 5). These are minimum estimates, because we only sampled the upper 15–20 cm of the beach. Micro-plastics can be mixed down to at least 2 m in beaches (Turra et al., 2014; Chubarenko et al., 2018). To fully explore the abundance of litter items would therefore require appreciably deeper sampling than we performed. The density of macro-litter almost halved (per unit volume) from the top 5 cm of the beach to the deeper stratum sampled in both 2008 and 2010 (5–15 cm, Supplementary Tables S1, S2). Extrapolating this rate of decrease suggests that deeper sampling to 1–2 m might increase the total number of items by 30–50%. The impact on mass is less marked, because buried litter is much smaller than surface litter. However, this conclusion might be biased by our relatively shallow sampling. Elsewhere, we have seen bottles, crates and other large litter items buried 2–3 m in old beach sediments exposed by coastal erosion.
We not only failed to dig deep enough, but we also only sampled 18 m of beach for buried macro-litter; had we sampled a few 100 m, we might have found some larger buried litter items as we did when we expanded the search area for surface macro-litter. However, our mismatch between surface and buried litter sampling effort was much less than in the seminal study of buried litter by Kusui and Noda (2003), who sampled roughly 1000 times more area for surface litter (∼500 m2 per beach) than buried litter (0.48 m2 per beach). Additional sampling both in terms of depth and spatial extent is needed to adequately characterize buried macro-litter, but the marked difference in item sizes between surface and buried items even within 1-m transects (Table 1) indicates that buried litter items are a non-random subset of litter items due to the faster burial of smaller items. We therefore suspect that comprehensive sampling of buried litter is unlikely to more than double the number or mass of macro-litter items.
Microfibers accounted for 99.7% of all particulate pollutants in the study beach. The dominance of microfibers among micro-plastic samples from beaches along the west coast of South Africa is well-known (Nel et al., 2017; de Villiers, 2018). The densities we recorded are slightly lower than those reported by de Villiers (2018) at Yzerfontein, 15 km south of our study site. She counted 47, 52, and 120 fibers⋅dm–3 in sand collected from the top 5 cm at the ‘high-level water mark’ on three occasions in 2016–2017 (S. de Villiers, pers. comm.). If we double our counts to match the larger sample volume, our three surface counts for the spring high tide line were 6, 40, and 42 fibers⋅dm–3, despite using a finer mesh filter (25 μm) to extract fibers than the 40 μm mesh used by de Villiers (2018). It is thus unlikely that our estimates of microfibers are inflated. However, when we extrapolate across the entire beach profile, the numbers of fibers completely dwarf other particulate litter items. This is partly because of their higher densities than larger litter items, but also because they occur throughout the beach profile, with little evidence of concentration at high shore strandlines. This presumably reflects their small size relative to the pore size in sandy beaches, allowing them to infiltrate into beaches (Chubarenko et al., 2020b) and provides another example of how microfibers behave differently in the environment from larger micro-plastic fragments (Suaria et al., 2020).
Previous studies have tended to assume that most, if not all, microfibers found in beaches are synthetic (e.g., Nel et al., 2017; de Villiers, 2018). However, Suaria et al. (2020) found that only 8% of microfibers collected in surface waters at sea are synthetic, and they are probably best treated as a separate class of pollutant to micro-plastics. The fibers in our study (median length 0.52 mm, IQR 0.42–1.02) were roughly half the length of fibers sampled at sea in the Atlantic Ocean (median 1.11 mm, IQR 0.71–1.85, Suaria et al., 2020), which might reflect mechanical degradation in the high-energy beach environment (Chubarenko et al., 2020a). However, the tendency for fibers to be longer in deeper sediments (Figure 3) is counter-intuitive and this pattern needs to be confirmed. We clearly need a better understanding of the dynamics of microfibers in natural systems (Suaria et al., 2020), including how fibers are distributed within beaches and their impacts on beach biota. Yet despite their overwhelming numerical dominance, microfibers contribute a vanishingly small amount to the mass of plastic. To put the mass of microfibers in perspective, the total mass of microfibers per meter of beach was roughly the same as 2–3 industrial pellets.
Excluding microfibers, plastics accounted for 99.5% of the number and ∼90% of the mass of particulate pollutants (Table 5). Non-plastic litter was largely confined to macro-litter, yet plastics also dominated this size class (Table 5). Some glass and metal might have been overlooked in the smaller size categories, because sieving was restricted to the upper shore, whereas fragments of dense pollutants tend to accumulate lower on the shoreline. However, this bias is likely to be minor, because such non-plastics typically arrive at remote beaches as sealed items (e.g., glass bottles, lightbulbs, aerosol cans), and these items were minor constituents of the larger macro-litter (Table 2). No glass or metal fragments were recorded in the visual survey of the low shore, or in the low shore micro-litter cores. Despite representing only 2% of litter items, surface macro-litter accounted for ∼90% of the mass of litter, with much of the remainder contributed by buried macro-litter. The dominance of macro-plastics in terms of the total mass of environmental plastics is thus similar to that recorded for Portuguese beaches (Martins and Sobral, 2011) and for litter floating at sea (Eriksen et al., 2014; Lebreton et al., 2017). This finding suggests that in terms of beaches as potential sinks that might balance the global plastic mass budget, we can largely ignore micro-plastics.
Global inventories of floating plastics have highlighted the paucity of micro-plastic particles (<1 mm) floating at sea, based on the expectation of an exponential increase in abundance with decreasing particle size due to fragmentation of larger plastic items (Cózar et al., 2014; Eriksen et al., 2014). Chubarenko et al. (2018) reported a similar pattern among beach litter, although they found a paucity of larger items, possibly due to mechanical beach cleaning at their study site. Superficial examination of Figure 4 suggests a similar pattern among beach litter at our study site. The increase in the abundance of litter items is strikingly linear (on a log-log scale) from megalitter down to around 10 mg (roughly 1–2 mm, depending on item shape and thickness), with a paucity of smaller fragments from 10 mg to 1 μg. However, the composition of litter varies considerably across these size ranges. Industrial pellets, which are primary micro-plastics (i.e., manufactured, not the product of fragmentation) account for most of the items in the 10–100 mg size class (Figure 4), and flexible packaging is more prevalent among macro-litter (Table 2) than meso-litter (Table 3). We believe that, at least on our study beach, the exponential increase in abundance with decreasing particle size is largely coincidental. Chubarenko et al. (2020a) show how rates of mechanical degradation on beaches differ among polymer types and with item thickness. The paucity of flexible packaging in the 1–5 mm size range probably reflects its faster degradation than the thicker, rigid plastic items that predominate meso-litter samples (together with industrial pellets). Movement within the beach/sea interface probably also influences the size-frequency distribution (Chubarenko et al., 2020b), with more buoyant rigid and foamed plastics more likely to remain on the upper shore than flexible sheet plastics (Hinata et al., 2017; van Sebille et al., 2020). The paucity of very small micro-plastics (<1 mm) other than microfibers might also reflect a combination of faster degradation and infiltration rates among small particles.
How does the mass of plastic on our study beach compare with the prediction of leakage from land-based sources? Jambeck et al. (2015) estimated that South Africa was the 11th worst country globally in terms of plastic pollution from land-based sources, losing some 90–250 × 103 tons of plastic into the sea in 2010. At least 25% of this is thought to come from Cape Town (Collins and Hermes, 2019; Weideman et al., 2020), and the study beach lies in the main downstream stranding plume for litter emanating from Cape Town’s Table Bay (Collins and Hermes, 2019). Oceanographic models suggest that ∼20% of litter in Table Bay strands along the 140 km of coast between Cape Town and Cape Columbine (Collins and Hermes, 2019). This is a minimum estimate, because the models were seeded with litter 8–10 km offshore, whereas much litter entering coastal waters from rivers and storm drains strands close to their source without dispersing offshore (Rech et al., 2014; Willis et al., 2017). If the global model estimate is correct, we’d expect to see an annual stranding rate of 30–90 kg⋅m–1, 20–60 times more than the total standing stock of plastic on the study beach. However, almost half of the mass of litter at the study beach comes from fishing and other marine activities, and some of the general rubbish is also dumped illegally from ships (Ryan et al., 2019). Even at heavily polluted urban beaches in Cape Town, extrapolated daily litter accumulation rates are only 0.4–16 kg⋅m–1⋅year–1 (Chitaka and von Blottnitz, 2019). Perhaps the most likely explanation for the large discrepancy between the standing stock of beach litter and the global estimate of land-based leakage is that the latter is grossly inflated (Ryan, 2020b). Both direct measures of marine inputs (Weideman et al., 2020) and refined estimates of solid waste budgets (Verster and Bouwman, 2020) indicate that Jambeck et al. (2015) overestimate solid waste leakage from South Africa by roughly an order of magnitude. This concurs with recent direct measures of river inputs (Castro-Jiménez et al., 2019; Schöneich-Argent et al., 2020; Vriend et al., 2020) being several orders of magnitude less than those predicted by global models (Lebreton et al., 2017; Schmidt et al., 2017). Rather than seeking to explain the ‘missing’ plastic in the global plastic budget (Koelmans et al., 2017; Lebreton et al., 2019) perhaps we should be refining the models that predict plastic leakage.
Of course, the mass of macro-plastic litter on beaches is highly sensitive to beach cleaning efforts (Ryan et al., 2009). Regular municipal cleaning of an urban beach in Cape Town reduced the mass of surface macro-plastic litter by 99% and buried litter by 85% (Ryan, 2020b). This was one of the main motivations for selecting a remote, uncleaned beach to characterize the number and mass distribution of stranded litter. The combination of the high UV levels and mechanical abrasion makes beaches hotspots for micro-plastic formation (Andrady, 2017; Chubarenko et al., 2020a), and once macro-plastics break down into micro-plastics they are much harder to manage. The collection of large litter items from beaches is therefore a useful stop-gap measure while we formulate effective steps to prevent plastic leakage into the environment.
Data Availability Statement
The raw data supporting the conclusions of this article will be made available by the authors, without undue reservation.
Author Contributions
PR: conceptualization, field sampling, data analysis, and writing of first draft. EW and VP: field sampling, lab work, and commenting on draft. CM: conceptualization, field sampling, and commenting on draft. All authors contributed to the article and approved the submitted version.
Funding
Funding from the University of Cape Town contributed to this project.
Conflict of Interest
The authors declare that the research was conducted in the absence of any commercial or financial relationships that could be construed as a potential conflict of interest.
Acknowledgments
We thank the many students and colleagues who assisted with field sampling, especially Cecile Reed, Deena Pillay, and Mike Lucas, who supervised some sampling teams.
Supplementary Material
The Supplementary Material for this article can be found online at: https://www.frontiersin.org/articles/10.3389/fmars.2020.575395/full#supplementary-material
Footnotes
References
Andrady, A. L. (2017). The plastic in microplastics: a review. Mar. Pollut. Bull. 119, 12–22. doi: 10.1016/j.marpolbul.2017.01.082
Barnes, D. K. A., Galgani, F., Thompson, R. C., and Barlaz, M. (2009). Accumulation and fragmentation of plastic debris in global environments. Philos. Trans. R. Soc. B 364, 1985–1998. doi: 10.1098/rstb.2008.0205
Browne, M. A., Chapman, M. G., Thompson, R. C., Amaral Zettler, M. A., Jambeck, J., and Mallos, N. J. (2015). Spatial and temporal patterns of stranded intertidal marine debris: is there a picture of global change? Environ. Sci. Technol. 49, 7082–7094. doi: 10.1021/es5060572
Castro-Jiménez, J., Gonzaìlez-Fernaìndez, D., Schmidt, N., and Sempeìreì, R. (2019). Macro-litter in surface waters from the Rhone River: plastic pollution and loading to the NW Mediterranean Sea. Mar. Pollut. Bull. 146, 60–66. doi: 10.1016/j.marpolbul.2019.05.067
Chitaka, T. Y., and von Blottnitz, H. (2019). Accumulation and characteristics of plastic debris along five beaches in Cape Town. Mar. Pollut. Bull. 138, 451–457. doi: 10.1016/j.marpolbul.2018.11.065
Chubarenko, I., Efimova, I., Bagaeva, M., Bagaev, A., and Isachenko, I. (2020a). On mechanical fragmentation of single-use plastics in the sea swash zone with different types of bottom sediments: insights from laboratory experiments. Mar. Pollut. Bull. 150:110726. doi: 10.1016/j.marpolbul.2019.110726
Chubarenko, I., Esiukova, E., Khatmullina, L., Lobchuk, O., Grave, A., Kileso, A., et al. (2020b). From macro to micro, from patchy to uniform: analyzing plastic contamination along and across a sandy tide-less coast. Mar. Pollut. Bull. 156:111198. doi: 10.1016/j.marpolbul.2020.111198
Chubarenko, I. P., Esiukova, E. E., Bagaev, A. V., Bagaeva, M. A., and Grave, A. N. (2018). Three-dimensional distribution of anthropogenic microparticles in the body of sandy beaches. Sci. Total Environ. 628–629, 1340–1351. doi: 10.1016/j.scitotenv.2018.02.167
Collins, C., and Hermes, J. C. (2019). Modelling the accumulation and transport of floating marine micro-plastics around South Africa. Mar. Pollut. Bull. 139, 46–58. doi: 10.1016/j.marpolbul.2018.12.028
Cózar, A., Echevarriìa, F., Gonzaìlez-Gordillo, J. I., Irigoien, X., Ubeda, B., Hernaìndez-Leoìn, S., et al. (2014). Plastic debris in the open ocean. Proc. Natl. Acad. Sci. U.S.A. 111, 10239–10244.
de Villiers, S. (2018). Quantification of microfibre levels in South Africa’s beach sediments, and evaluation of spatial and temporal variability from 2016 to 2017. Mar. Pollut. Bull. 135, 481–489. doi: 10.1016/j.marpolbul.2018.07.058
Dixon, T. J., and Dixon, T. R. (1983). Marine litter distribution and composition in the North Sea. Mar. Pollut. Bull. 14, 145–148. doi: 10.1016/0025-326x(83)90068-1
Eriksen, M., Lebreton, L. C. M., Carson, H. S., Thiel, M., Moore, C. J., Borerro, J. C., et al. (2014). Plastic pollution in the world’s oceans: more than 5 trillion plastic pieces weighing over 250,000 tons afloat at sea. PLoS One 9:e111913. doi: 10.1371/journal.pone.0111913
Fazey, F. M. C., and Ryan, P. G. (2016). Debris size and buoyancy influence the dispersal distance of stranded litter. Mar. Pollut. Bull. 110, 371–377. doi: 10.1016/j.marpolbul.2016.06.039
Filella, M. (2015). Questions of size and numbers in environmental research on microplastics: methodological and conceptual aspects. Environ. Chem. 12, 527–538. doi: 10.1071/en15012
GESAMP (2019). “Guidelines for the monitoring and assessment of plastic litter and microplastics in the ocean,” in IMO/FAO/UNESCO-IOC/UNIDO/WMO/IAEA/UN/UNEP/UNDP/ISA Joint Group of Experts on the Scientific Aspects of Marine Environmental Protection, eds P. J. Kershaw, A. Turra, and F. Galgani (London: GESAMP), 1–130.
Gregory, M. R. (1978). Accumulation and distribution of virgin plastic granules on New Zealand beaches. N. Z. J. Mar. Freshw. Res. 12, 399–414. doi: 10.1080/00288330.1978.9515768
Hartmann, N. B., Hüffer, T., Thompson, R. C., Hassellöv, M., Verschoor, A., Daugaard, A. E., et al. (2019). Are we speaking the same language? Recommendations for a definition and categorization framework for plastic debris. Environ. Sci. Technol. 53, 1039–1047. doi: 10.1021/acs.est.8b05297
Hidalgo-Ruz, V., Gutow, L., Thompson, R. C., and Thiel, M. (2012). Microplastics in the marine environment: a review of the methods used for identification and quantification. Environ. Sci. Technol. 46, 3060–3075. doi: 10.1021/es2031505
Hinata, H., Mori, K., Ohno, K., Miyao, Y., and Kataoka, T. (2017). An estimation of the average residence times and onshore-offshore diffusivities of beached microplastics based on the population decay of tagged meso- and macrolitter. Mar. Pollut. Bull. 122, 17–26. doi: 10.1016/j.marpolbul.2017.05.012
Horton, A. A., Svendsen, C., Williams, R. J., Spurgeon, D. J., and Lahive, E. (2017). Large microplastic particles in sediments of tributaries of the River Thames, UK – Abundance, sources and methods for effective quantification. Mar. Pollut. Bull. 114, 218–226. doi: 10.1016/j.marpolbul.2016.09.004
Jambeck, J. R., Geyer, R., Wilcox, C., Siegler, T. R., Perryman, M., Andrady, A. L., et al. (2015). Plastic waste inputs from land into the ocean. Science 347, 768–771. doi: 10.1126/science.1260352
Koelmans, A. A., Kooi, M., Law, K. L., and van Sebille, E. (2017). All is not lost: deriving a top- down mass budget of plastic at sea. Environ Res Lett. 12:114028. doi: 10.1088/1748-9326/aa9500
Kusui, T., and Noda, M. (2003). International survey on the distribution of stranded and buried litter on beaches along the Sea of Japan. Mar. Pollut. Bull. 47, 175–179. doi: 10.1016/s0025-326x(02)00478-2
Lavers, J. L., and Bond, A. L. (2017). Exceptional and rapid accumulation of anthropogenic debris on one of the world’s most remote and pristine islands. Proc. Natl. Acad. Sci. U.S.A. 114, 6052–6055. doi: 10.1073/pnas.1619818114
Lebreton, L., Egger, M., and Slat, B. (2019). A global mass budget for positively buoyant macroplastic debris in the ocean. Sci. Rep. 9:12922.
Lebreton, L., Slat, B., Ferrari, F., Sainte-Rose, B., Aitken, J., Marthouse, R., et al. (2018). Evidence that the Great Pacific Garbage Patch is rapidly expanding. Sci. Rep. 8:4666.
Lebreton, L. C. M., Zwet, J., van der Damsteeg, J.-W., Slat, B., Andrady, A., and Reisser, J. (2017). River plastic emissions to the world’s oceans. Nat. Commun. 8:ncomms15611.
Lee, J., Hong, S., Song, Y. K., Hong, S. H., Jang, Y. C., Jang, M., et al. (2013). Relationships among the abundances of plastic debris in different size classes on beaches in South Korea. Mar. Pollut. Bull. 77, 349–354. doi: 10.1016/j.marpolbul.2013.08.013
Martins, J., and Sobral, P. (2011). Plastic marine debris on the Portuguese coastline: a matter of size? Mar. Pollut. Bull. 62, 2649–2653. doi: 10.1016/j.marpolbul.2011.09.028
Mathalon, A., and Hill, P. (2014). Microplastic fibers in the intertidal ecosystem surrounding Halifax Harbor, Nova Scotia. Mar. Pollut. Bull. 81, 69–79. doi: 10.1016/j.marpolbul.2014.02.018
Merrell, T. R. Jr. (1984). A decade of change in nets and plastic litter from fisheries off Alaska. Mar. Pollut. Bull. 15, 378–384. doi: 10.1016/0025-326x(84)90172-3
Nel, H. A., and Froneman, P. W. (2015). A quantitative analysis of microplastic pollution along the south-eastern coastline of South Africa. Mar. Pollut. Bull. 101, 274–279. doi: 10.1016/j.marpolbul.2015.09.043
Nel, H. A., Hean, J. W., Noundou, X. S., and Froneman, P. W. (2017). Do microplastic loads reflect the population demographics along the southern African coastline? Mar. Pollut. Bull. 115, 115–119. doi: 10.1016/j.marpolbul.2016.11.056
Olivelli, A., Hardesty, B. D., and Wilcox, C. (2020). Coastal margins and backshores represent a major sink for marine debris: insights from a continental-scale analysis. Environ. Res. Lett. 15:074037. doi: 10.1088/1748-9326/ab7836
OSPAR (2010). Guideline for Monitoring Marine Litter on the Beaches in the OSPAR Maritime Area. London: OSPAR Commission.
R Core Team (2019). R: A Language and Environment for Statistical Computing. Vienna: R Foundation for Statistical Computing.
Rech, S., Macaya-Caquilpán, V., Pantoja, J. F., Rivadeneira, M. M., Madariaga, D. J., and Thiel, M. (2014). Rivers as a source of marine litter – A study from the SE Pacific. Mar. Pollut. Bull. 82, 66–75. doi: 10.1016/j.marpolbul.2014.03.019
Ryan, P. G. (2016). “Ingestion of plastics by marine organisms,” in Hazardous Chemicals Associated with Plastics in the Environment, eds H. Takada and H. K. Karapanagioti (Cham: Springer), 235–266. doi: 10.1007/698_2016_21
Ryan, P. G. (2020a). Land or sea? What bottles tell us about the origins of beach litter in Kenya. Waste Manage. 116, 49–57. doi: 10.1016/j.wasman.2020.07.044
Ryan, P. G. (2020b). The transport and fate of marine plastics in South Africa and adjacent oceans. S. Afr. J. Sci. 116:7677.
Ryan, P. G., Dilley, B. J., Ronconi, R. A., and Connan, M. (2019). Rapid increase in Asian bottles in the South Atlantic Ocean indicates major debris inputs from ships. Proc. Natl Acad. Sci. U.S.A. 116, 20892–20897. doi: 10.1073/pnas.1909816116
Ryan, P. G., and Moloney, C. L. (1990). Plastic and other artefacts on South African beaches: temporal trends in abundance and composition. S. Afr. J. Sci. 86, 450–452.
Ryan, P. G., Moore, C. J., van Franeker, J. A., and Moloney, C. L. (2009). Monitoring the abundance of plastic debris in the marine environment. Philos. Trans. R. Soc. B 364, 1999–2012.
Ryan, P. G., Perold, V., Osborne, A., and Moloney, C. L. (2018). Consistent patterns of debris on South African beaches indicate that industrial pellets and other mesoplastic items mostly derive from local sources. Environ. Pollut. 238, 1008–1016. doi: 10.1016/j.envpol.2018.02.017
Ryan, P. G., Pichegru, L., Perold, V., and Moloney, C. L. (2020). Monitoring marine plastics – will we know if we’re making a difference? S. Afr. J. Sci. 116:7678.
Schmidt, C., Krauth, T., and Wagner, S. (2017). Export of plastic debris by rivers into the Sea. Environ. Sci. Technol. 51, 12246–12253. doi: 10.1021/acs.est.7b02368
Schöneich-Argent, R. I., Dau, K., and Freund, H. (2020). Wasting the North Sea? – A field-based assessment of anthropogenic macrolitter loads and emission rates of three German tributaries. Environ. Pollut. 263:114367. doi: 10.1016/j.envpol.2020.114367
Suaria, G., Achtypi, A., Perold, V., Lee, J. R., Pierucci, A., Bornman, T. G., et al. (2020). A global characterization of microfibers in oceanic surface waters. Sci. Adv. 6:eaay8493. doi: 10.1126/sciadv.aay8493
Takada, H., and Karapanagioti, H. K. (eds) (2018). “Hazardous chemicals associated with plastics in the environment,” in Handbook of Environmental Chemistry, (Cham: Springer).
Thompson, R. C., Olsen, Y., Mitchell, R. P., Davis, A., Rowland, S. J., John, A. W. G., et al. (2004). Lost at sea: where is all the plastic? Science 304:838. doi: 10.1126/science.1094559
Turra, A., Manzano, A. B., Dias, R. J. S., Mahiques, M. M., Barbosa, L., Balthazar-Silva, D., et al. (2014). Three dimensional distribution of plastic pellets in sandy beaches: shifting paradigms. Sci. Rep. 4:4435.
van Sebille, E., Aliani, S., Law, K. L., Maximenko, N., Alsina, J., Bagaev, A., et al. (2020). The physical oceanography of the transport of floating marine debris. Environ. Res. Lett. 15:023003.
van Sebille, E., Wilcox, C., Lebreton, L., Maximenko, N., Hardesty, B. D., van Franeker, J. A., et al. (2015). A global inventory of small floating plastic debris. Environ. Res. Lett. 10:124006. doi: 10.1088/1748-9326/10/12/124006
Verster, C., and Bouwman, H. (2020). Land-based sources and pathways of marine plastics in a South African context. S. Afr. J. Sci. 116:7700.
Vriend, P., van Calcar, C., Kooi, M., Landman, H., Pikaar, R., and van Emmerik, T. (2020). Rapid assessment of floating macroplastic transport in the Rhine. Front. Mar. Sci. 7:10. doi: 10.3389/fmars.2020.00010
Weideman, E. A., Perold, V., Arnold, G., and Ryan, P. G. (2020). Quantifying changes in litter loads in urban stormwater run-off from Cape Town, South Africa, over the last two decades. Sci. Tot. Environ. 724:138310. doi: 10.1016/j.scitotenv.2020.138310
Keywords: micro-plastics, macro-plastics, litter density, plastic budget, sampling scale, buried litter, beach cleaning, plastic mitigation
Citation: Ryan PG, Weideman EA, Perold V and Moloney CL (2020) Toward Balancing the Budget: Surface Macro-Plastics Dominate the Mass of Particulate Pollution Stranded on Beaches. Front. Mar. Sci. 7:575395. doi: 10.3389/fmars.2020.575395
Received: 23 June 2020; Accepted: 12 October 2020;
Published: 05 November 2020.
Edited by:
Hans Peter Heinrich Arp, Norwegian Geotechnical Institute, NorwayReviewed by:
Tim van Emmerik, Wageningen University & Research, NetherlandsAlicia Herrera, University of Las Palmas de Gran Canaria, Spain
Copyright © 2020 Ryan, Weideman, Perold and Moloney. This is an open-access article distributed under the terms of the Creative Commons Attribution License (CC BY). The use, distribution or reproduction in other forums is permitted, provided the original author(s) and the copyright owner(s) are credited and that the original publication in this journal is cited, in accordance with accepted academic practice. No use, distribution or reproduction is permitted which does not comply with these terms.
*Correspondence: Peter G. Ryan, pryan31@gmail.com