 Marc O. Lammers1*
 Beth Goodwin2
 Anke Kügler3†
 Eden J. Zang1
 Matt Harvey4
 Tetyana Margolina5
 Jonathan A. Martinez6†
 Karlina Merkens7
 Leila T. Hatch8
- 1Hawaiian Islands Humpback Whale National Marine Sanctuary, NOAA, Kihei, HI, United States
- 2Jupiter Research Foundation, Puako, HI, United States
- 3Marine Biology Graduate Program, University of Hawaii at Mānoa, Honolulu, HI, United States
- 4Google Research, Mountain View, CA, United States
- 5Department of Oceanography, Naval Postgraduate School, Monterrey, CA, United States
- 6Papahānaumokuākea Marine National Monument, NOAA, Honolulu, HI, United States
- 7Saltwater, Inc., Portland, OR in support of NOAA Pacific Islands Fisheries Science Center, Honolulu, HI, United States
- 8Office of National Marine Sanctuaries, NOAA, Washington, DC, United States
The occurrence of humpback whales (Megaptera novaeangliae) across the 2600 km of Hawaiian archipelago, which include the remote atolls, banks, and seamounts of Papahānaumokuākea Marine National Monument (PMNM), remains poorly understood. Previous surveys for humpback whales beyond the main Hawaiian Islands have been scarce due to limited access and the challenging winter conditions typically found in PMNM when whales are present. To overcome these limitations, a combination of moored acoustic recorders and a Wave Glider autonomous surface vehicle were used to acoustically monitor eight locations and survey approximately 1500 km of the Hawaiian archipelago for the occurrence of humpback whale song during the 2019-2020 breeding season. Relative song prevalence was established using a machine learning tool and by quantifying the level of song chorusing. A generalized additive model framework was applied to understand the associations between habitat variables and humpback whale song occurrence, and sound propagation modeling was performed to examine whether acoustic propagation influenced observed patterns. Whale song was recorded at all monitored and surveyed locations across the archipelago, albeit in varying amounts. Among the locations monitored with moored recorders, the highest and most sustained seasonal chorusing levels were measured off Maui followed by French Frigate Shoals (Kānemilohai), Hawaii Island, Middle Bank, Oahu, Kauai, Gardner Pinnacles (Pūhāhonu) and Pearl and Hermes Reef (Holoikauaua), respectively. The Wave Glider mission to PMNM revealed that song prevalence was highest at Middle Bank and gradually decreased further to the northwest, reaching a minimum at Gardner Pinnacles (Pūhāhonu). However, song occurrence increased again at Raita Bank, remaining high between Raita Bank and the Northampton Seamounts. The results reveal that nearly the entire Hawaiian archipelago is exploited by humpback whales during the winter and early spring months. Moreover, song occurrence patterns suggest that there may be more structure in the distribution of whales in PMNM than previously known and raises questions about whether multiple subpopulations occur across the archipelago.
1 Introduction
Humpback whales (Megaptera novaeangliae) are a migratory baleen whale species that generally forage at high latitudes during summer months and breed at lower latitudes during winter months (Dawbin, 1966; Baker et al., 1986; Clapham and Mead, 1999). The Hawaiian archipelago is the primary breeding habitat for humpback whales in the north Pacific (Herman and Antinoja, 1977; Calambokidis et al., 2008). It is estimated that approximately half of all the whales in the north Pacific migrate to the Hawaiian Islands annually during winter to mate, give birth, nurse their young and socialize (Herman and Antinoja, 1977; Calambokidis et al., 2008). This population has been on a recovery trend for the past several decades after being decimated by commercial whaling during the twentieth century (Rice, 1978; Johnson and Wolman, 1984; Mobley et al., 2001). In 2016, the portion of the population that breeds in Hawaiian waters, known as the Hawaii distinct population segment (DPS), was deemed recovered and removed from the U.S. Endangered Species List (NOAA, 2016). However, in the years following, the Hawaii DPS experienced fluctuations in the number of whales breeding in Hawaiian waters (Cartwright et al., 2019; Kügler et al., 2020, Frankel et al., 2022). These fluctuations were driven by oceanographic events in the northeast Pacific that affected the abundance of prey on the feeding grounds off Alaska (NOAA, 2019, Frankel et al., 2022). It is not known whether a proportion of Hawaii DPS whales opted to forego the annual breeding migration during these years, or whether they simply used other parts of the archipelago that are still poorly documented and unmonitored. This latter possibility elevated the importance of better understanding the occurrence and distribution of humpback whales across the entire Hawaiian archipelago, beyond the well-documented breeding aggregation areas in the main Hawaiian Islands (MHI).
Wintering humpback whales aggregate along shallow coastlines and on banks less than 183 m (100 fathoms) deep while in Hawaii and other breeding areas (Herman and Antinoja, 1977; Herman et al., 1980; Baker and Herman, 1981; Whitehead and Moore, 1982; Ersts and Rosenbaum, 2003). It has been estimated that within the Hawaiian archipelago, approximately one third of the whales’ preferred shallow water habitat is found in the MHI, while two thirds occur in the uninhabited Northwestern Hawaiian Islands (NWHI), which extend approximately 1800 km beyond the MHI and encompass the Papahānaumokuākea Marine National Monument (PMNM) (Johnston et al., 2007). However, the presence of humpback whales in PMNM remains poorly understood. Ship-based and aerial surveys conducted in the 1970s led Herman (1979) to conclude that “there is no evidence of current habitation by the [humpback] whales in the northwest Hawaiian Islands, though a few ‘strays’ may be encountered there.” In addition, Herman et al. (1980) found no evidence of any significant migration through the NWHI. More recently, however, passive acoustic mooring recordings and visual sightings have confirmed that humpback whales do in fact use PMNM (Johnston et al., 2007; Lammers et al., 2011), but it remains unclear in what abundance they are present there and how they are distributed. Surveys for humpback whales in PMNM have been limited due to the challenges of conducting vessel-based research during harsh winter month conditions when whales are present. As a result, there is still uncertainty about how important the atolls, banks, and seamounts of PMNM are to the north Pacific humpback whale population and whether they serve as an extension of the main Hawaiian island breeding grounds, represent a separate breeding habitat, or possibly both.
To overcome the limitations of traditional vessel-based visual surveys in PMNM during winter months, a study was designed to assess humpback whale presence in these remote waters through a combination of fixed and mobile acoustic monitoring. Acoustic monitoring was used because during the winter breeding season, male humpback whales engage in an acoustic display of song, which forms a chorus and becomes the dominant source of acoustic energy in Hawaiian waters between the months of December and April (Au et al., 2000; Au and Green, 2000). Song is believed to play an important function in the mating system of humpback whales by signaling to females and mediating male-male interactions (Darling et al., 2006; Cholewiak et al., 2018; see Herman, 2017 for a comprehensive review on the function of song). Acoustic monitoring of song has been successfully used to document trends in humpback whale presence in Hawaii and elsewhere, both temporally and spatially (Clapham and Mattila, 1990; Au et al., 2000; Lammers et al., 2011; Seger et al., 2016; Noad et al., 2017; Kügler et al., 2020). In addition, a Wave Glider autonomous vehicle was successfully used to acoustically survey offshore waters between Hawaii and Mexico (Darling et al., 2019) and west of Hawai’i (Darling et al., 2020), revealing a previously undocumented presence of humpback whales in low-latitude pelagic waters during the breeding season. Thus, acoustic-based surveys are an effective way to learn about humpback whale occurrence in locations where traditional surveys are logistically or practically challenging.
The study presented here used data obtained from moored recorders deployed at various locations across the Hawaiian archipelago and a Wave Glider that acoustically surveyed the atolls, banks and seamounts of PMNM. The objectives of this work were used to determine where humpback whales occur in PMNM, to establish whether certain parts of PMNM are more heavily occupied than others, and to compare, where feasible, relative humpback whale presence in PMNM with established breeding habitats in the MHI.
2 Materials and methods
2.1 Moored acoustic recorders
Passive acoustic monitoring was conducted at eight locations across the Hawaiian archipelago during the 2019-2020 breeding season using moored acoustic recorders (Figure 1). These recorders were deployed as part of a joint U.S. Navy/National Oceanic and Atmospheric Administration (NOAA) effort to characterize the soundscape of seven national marine sanctuaries and PMNM known as the SanctSound Project (https://sanctsound.ioos.us/) and as part of long-term acoustic monitoring conducted by NOAA’s Pacific Islands Fisheries Science Center. Seven of the moorings were composed of an Ocean Instruments SoundTrap 500 recorder, an EdgeTech PORT LF acoustic release, a 25.4 cm diameter syntactic foam float, and a sacrificial anchor made of a 34 kg concrete block and three 16 kg sandbags (Figure 2A). Three SoundTrap moorings were deployed in PMNM at Middle Bank, French Frigate Shoals (FFS, Kānemilohai) and Gardner Pinnacles (Pūhāhonu) in August 2019 and recovered in September 2020. Four SoundTrap moorings were deployed in the MHI off Hawaii Island, Maui, Oahu, and Kauai in November 2019 and were recovered in either May, July or August 2020. The SoundTrap recorders in PMNM were programmed to sample at a rate of 48 kHz for 15 minutes every 30 minutes (50% duty cycle) beginning on 1 October 2019. The MHI SoundTrap recorders were programmed to sample at 48 kHz continuously beginning on 1 December 2019. The eighth mooring was a High-frequency Acoustic Recording Package (HARP) (Wiggins and Hildebrand, 2007) deployed at Pearl and Hermes Reef (PHR, Holoikauaua) in August 2019 and recovered in October 2020. The HARP sampled continuously at a rate of 200 kHz beginning on 1 December 2019. The recorders on Hawaii Island and Maui were recovered, downloaded, refurbished with new batteries and redeployed in January 2020. The other recorders could not be refurbished due to logistical constraints. Table 1 gives the details of all mooring deployments.
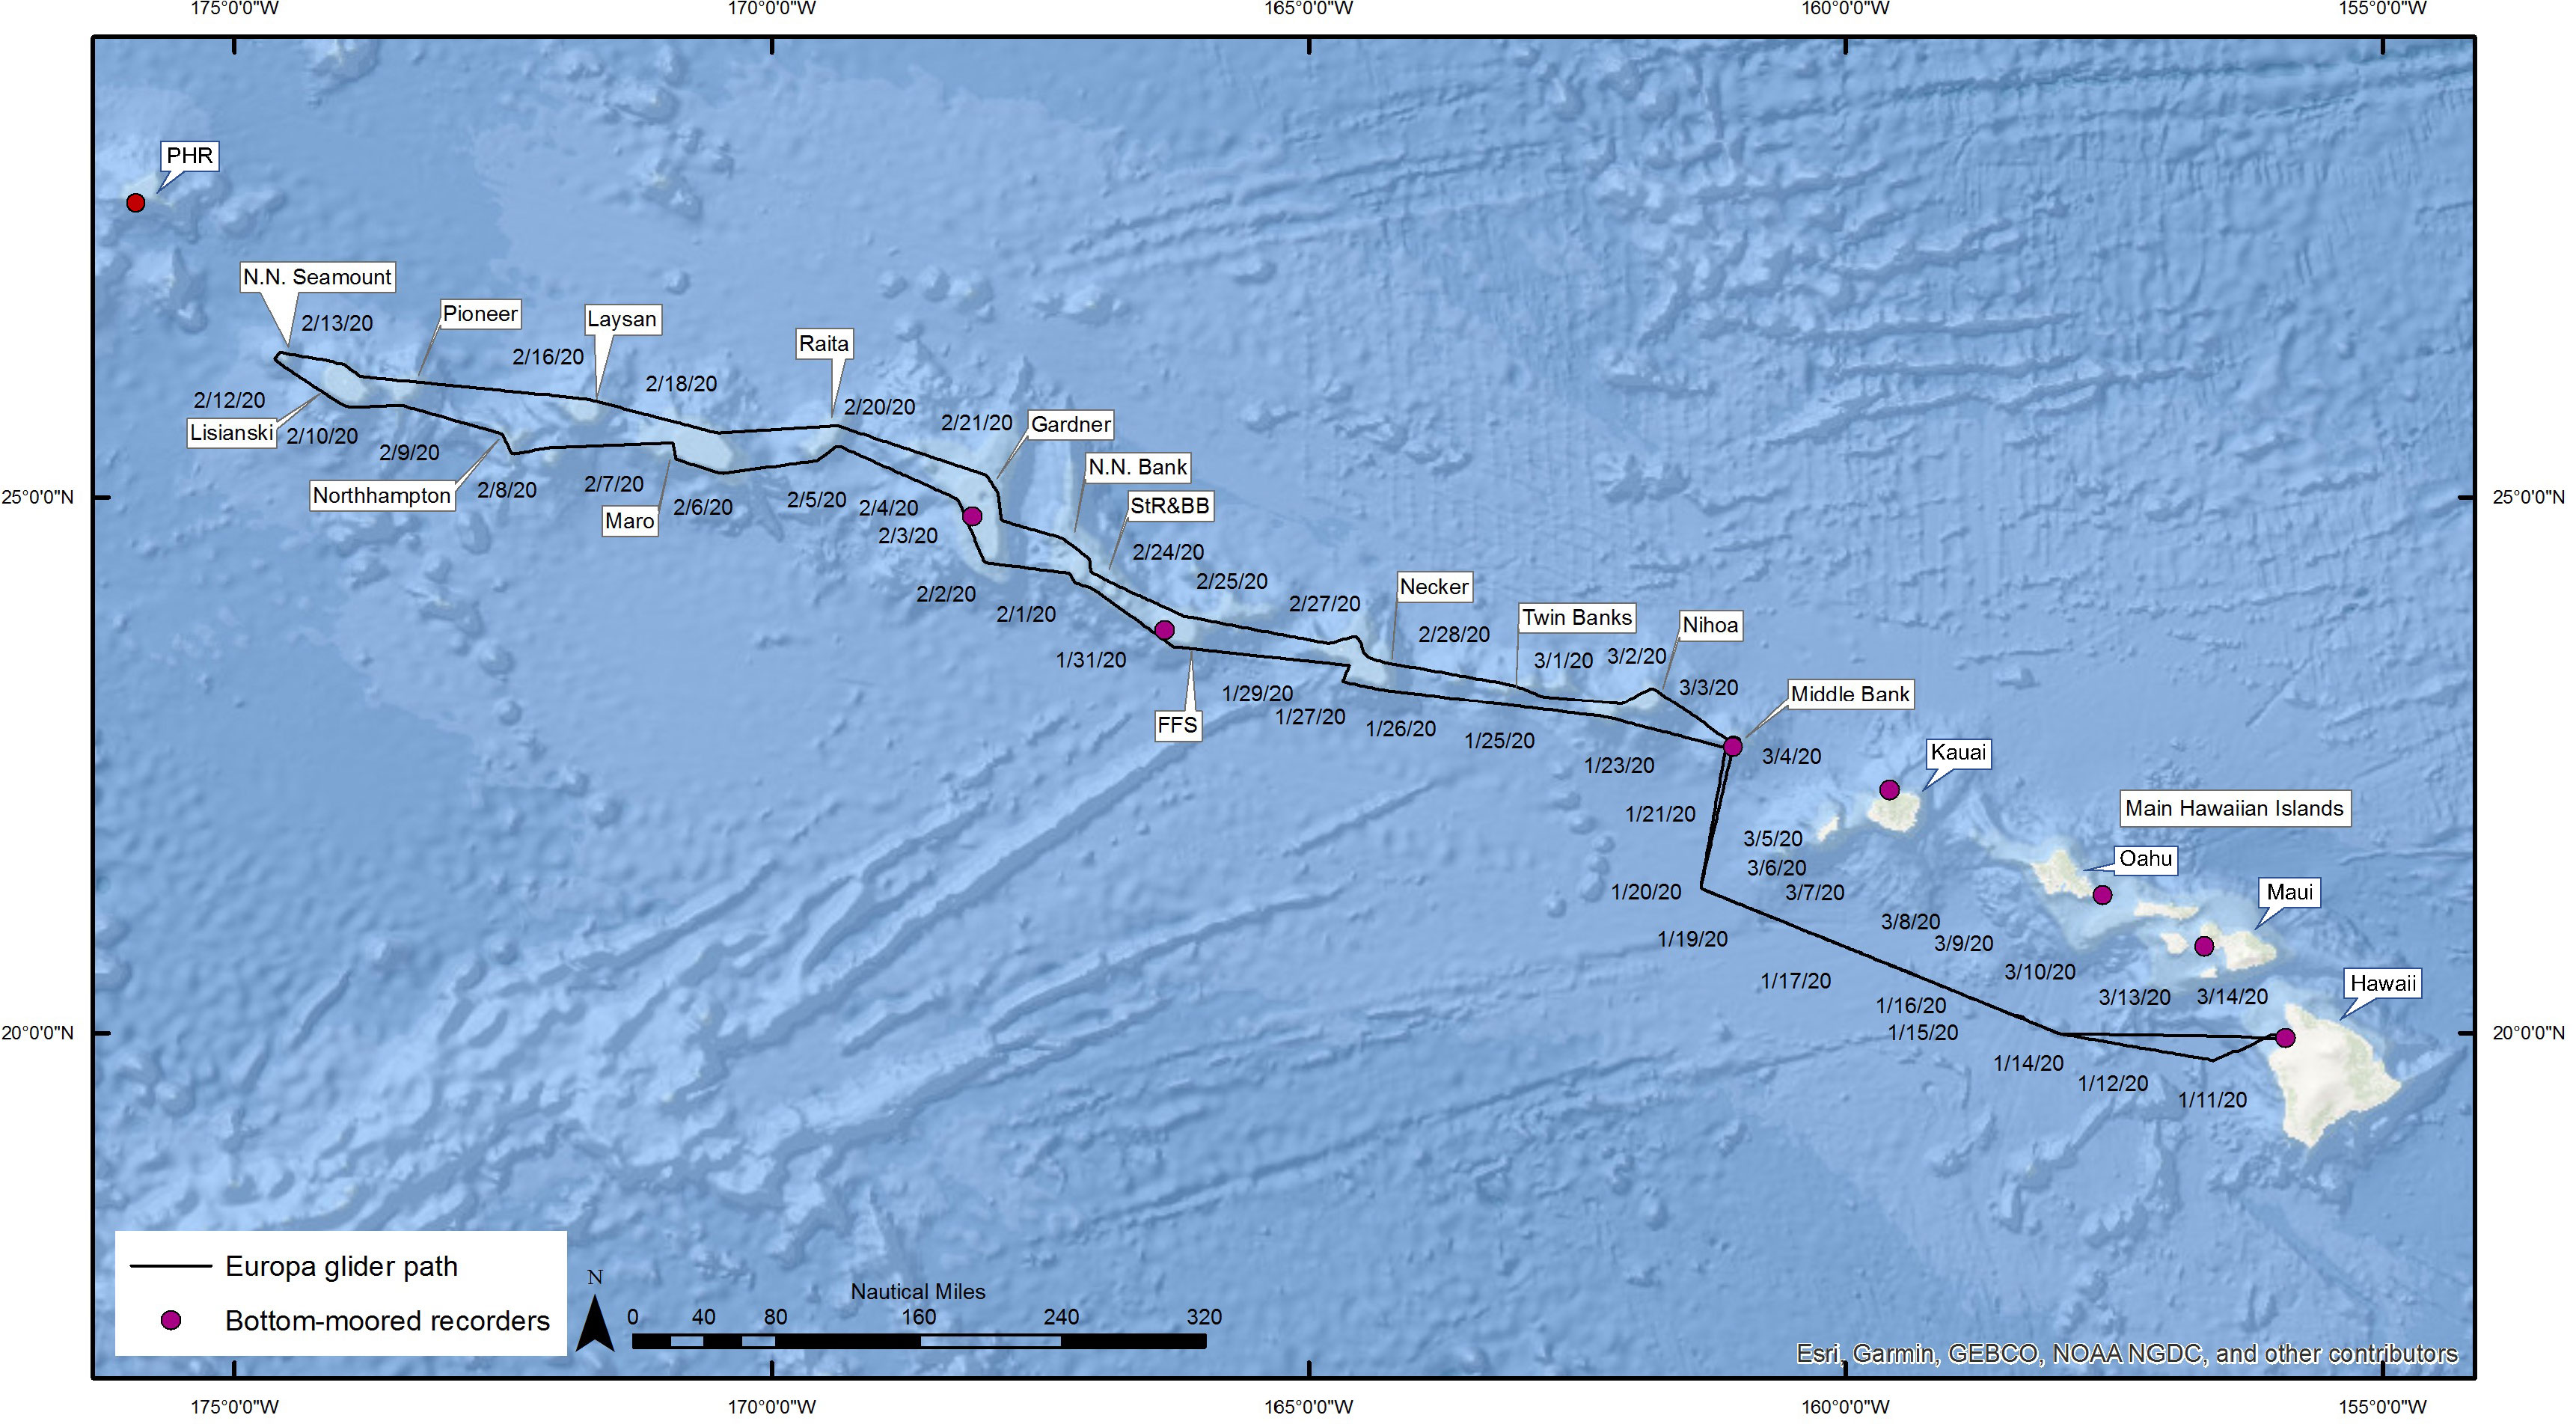
Figure 1 Map of the Hawaiian archipelago showing the location of the fixed acoustic moorings (red circles) and the path of the wave glider (black line).
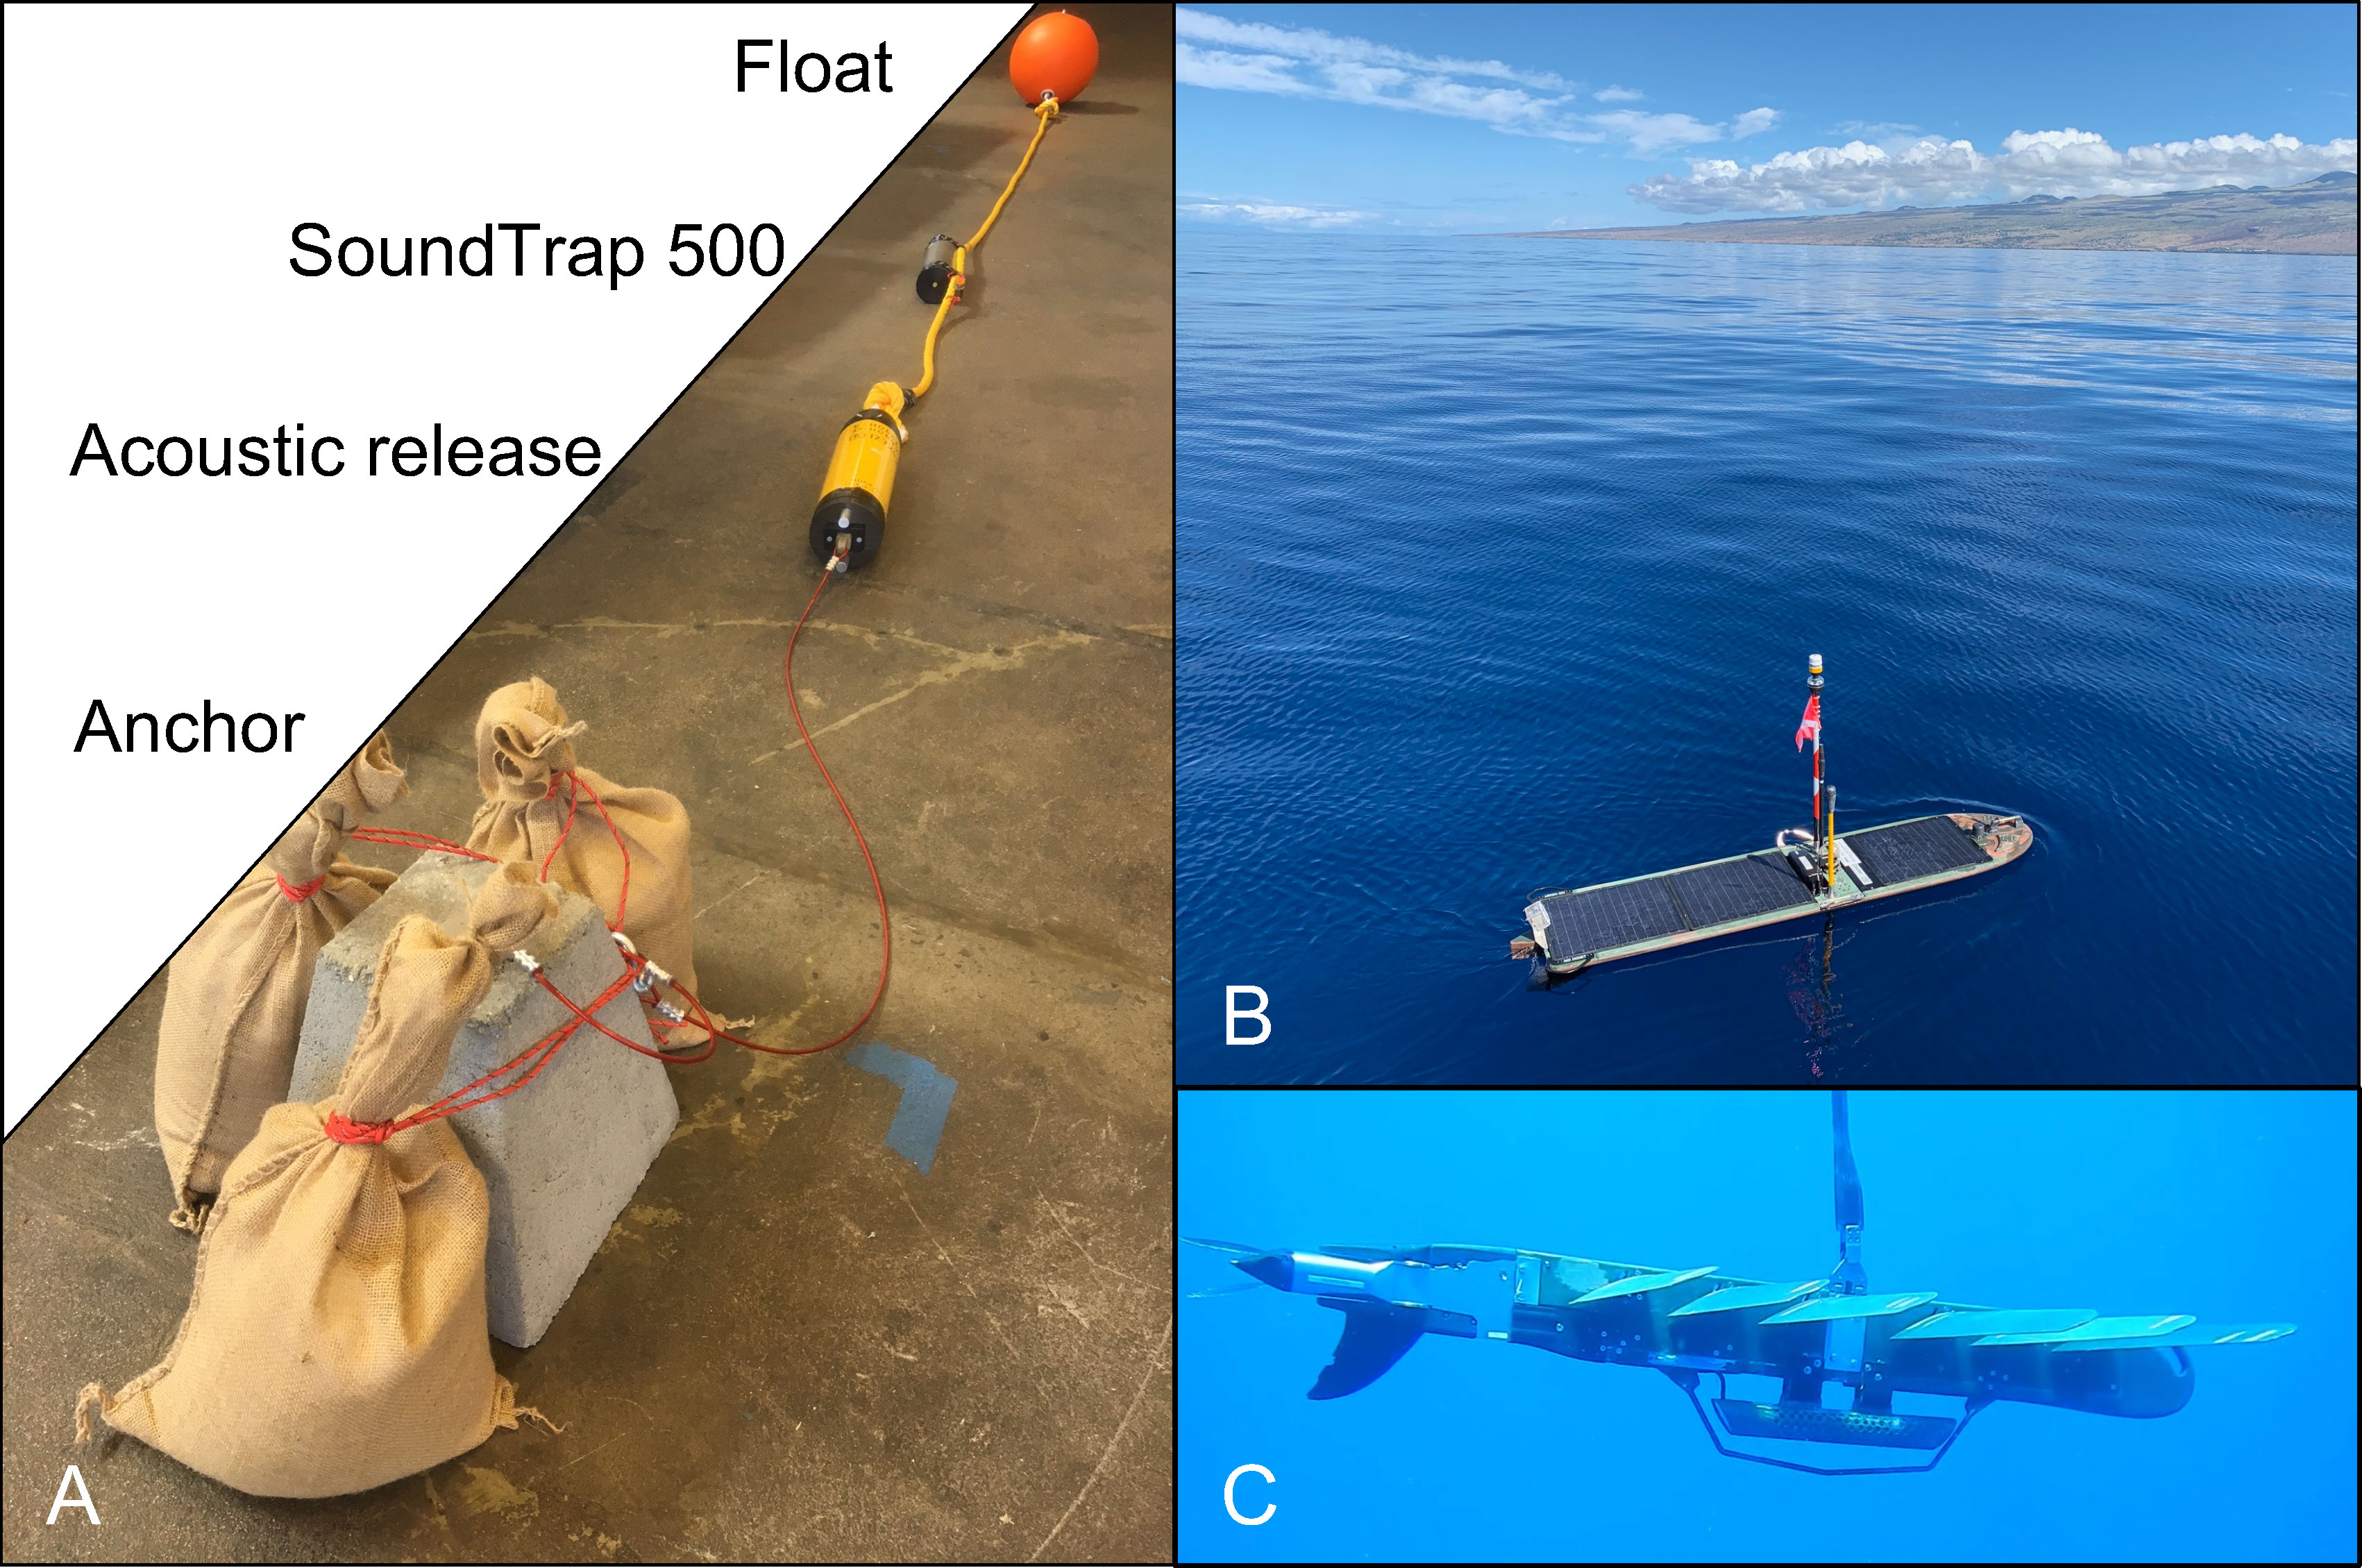
Figure 2 Images of the fixed acoustic mooring (A) showing the syntactic foam float, ST500 recorder, EdgeTech Port LF acoustic release, and sacrificial anchor; the wave glider’s surface float (B); the wave glider’s ‘sub’ with the hydrophone mounted below the fuselage (C).
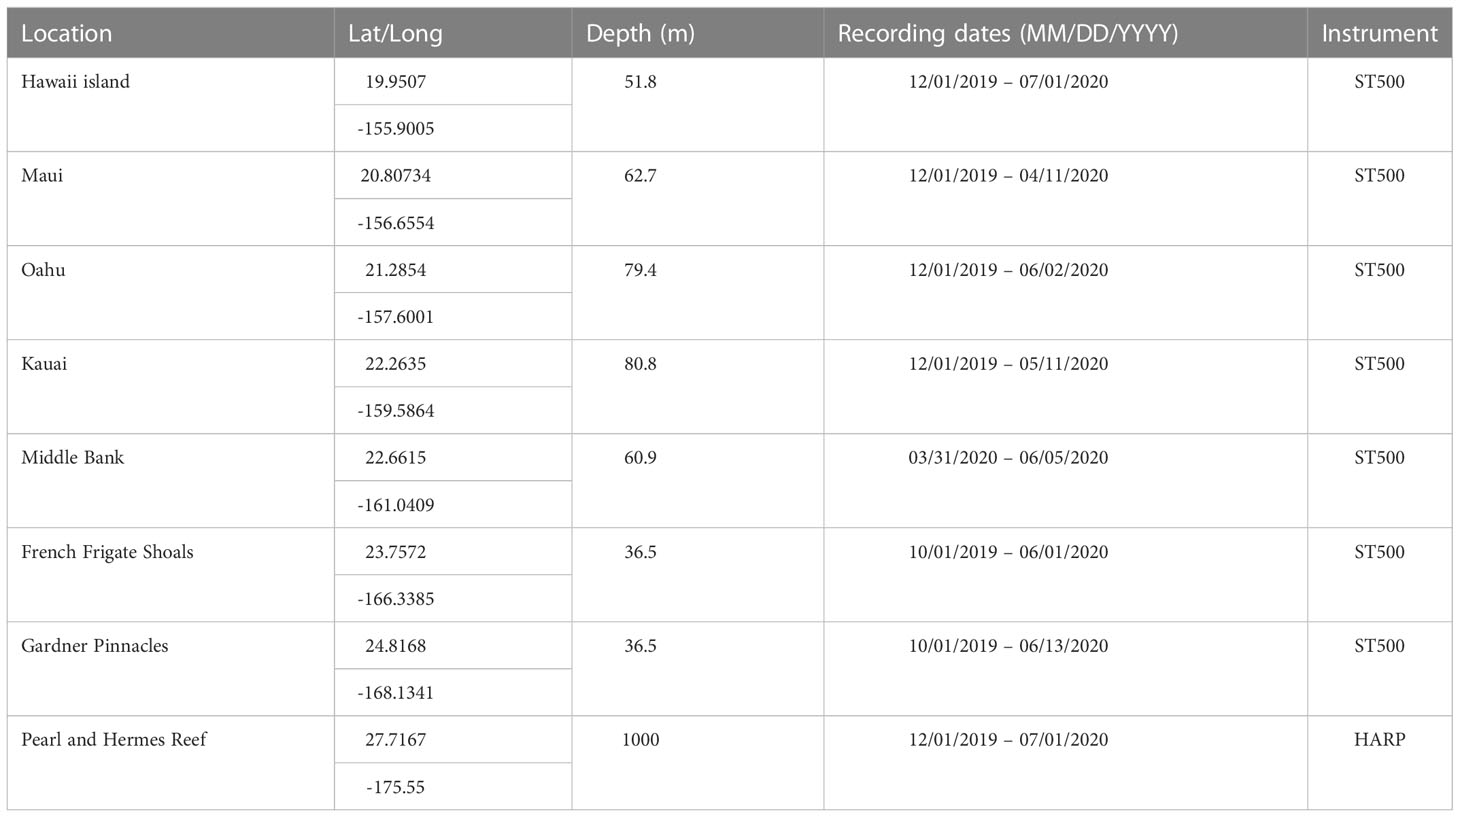
Table 1 Deployment and recording parameters for the 8 fixed mooring sites.
2.2 Wave glider
The Wave Glider (WG) is an autonomous surface vehicle powered by the energy from waves and the sun, and is controlled remotely via satellite. It is composed of a 3.05-meter surface float (Figure 2B) that is connected by an 8-meter umbilical cable to a 2.2-meter sub-surface glider (sub) with six wings (Figure 2C). The vertical motion of waves on the ocean’s surface raises and lowers the wings to create forward thrust, which propels both the sub and the tethered float. The float has a rudder, three solar panels, communication antennas and navigation lights and it contains a payload with the WG’s command and control electronics, scientific instrumentation, data storage drives and batteries. A more complete description of the WG can be found in Goodoni et al. (2018).
The WG Europa used in this study is a third generation (SV3) model operated by Jupiter Research Foundation, based in Puako, Hawaii. Acoustic data were collected using an Ocean Sonics Ltd. icListen SB-Ethernet digital hydrophone (frequency response 10 Hz to 100 kHz ±3 dB, sensitivity -171 dBV re: 1 μPa) suspended below the sub’s fuselage. Recordings were made continuously at a sampling rate of 32 kHz (24 bit depth) and stored in 1-minute.wav files on two 4 TB solid-state drives located in the payload.
Europa is the same WG that was used in a similar mission to acoustically survey offshore waters between Hawaii and Mexico for the presence of humpback whales both eastward between Hawaii and Baja California Seamount, (Darling et al., 2019) and westward of Hawai’i (Darling et al., 2020). Following these previous missions, significant modifications were made to reduce WG self-noise (surface noise, wing springs and bars, rudder noise, fuselage echoing, etc.), which affected those missions by introducing continuous narrowband tonal noise at several frequencies. A copper housing containing the hydrophone was mounted 7.6 cm from the sub fuselage using ethylene propylene diene monomer (EPDM) fiberglass reinforced rubber as the mounting material (Figure 2C). A 1.27 cm stainless steel bar was added below the hydrophone housing to deflect any potential entanglement in the space created. Additionally, extreme vibration attenuation (EVA) pads were added into the hollow areas of the fuselage and teflon washers were used as spacers in the wing-bar receptacles within the fuselage and wings. Combined, these measures dramatically reduced self-noise so that only sporadic flow noise and an occasional sound from rudder adjustments remained.
Europa was launched from Hawaii Island on 8 January 2020 to begin a 67-day mission to PMNM (Figure 1). The WG was initially piloted west-northwest and then north in offshore waters to minimize the risk of interaction with vessel traffic around the main Hawaiian Islands. It entered PMNM on 22 January after circling Middle Bank, which lies just outside of PMNM’s boundaries. Europa then transited to the northwest 1550 km while passing mostly along the southern and western slopes of the banks it encountered. Other than at Middle Bank, Europa was piloted to remain at least 1.852 km (1 nm) offshore of the 100 m isobath at all locations it visited to avoid potentially becoming grounded in poorly charted waters. Upon reaching Lisianski Island (Papa’āpoho), it rounded a small bank 37 km northwest of Neva Shoal and traveled 1509 km to the southeast back to Middle Bank, passing along the northern and eastern slopes of most banks it had previously visited. After crossing and circling Middle Bank again on 3 March, Europa returned to Hawaii Island on the same path it used during the outbound trip and was recovered on 14 March 2020. In total, Europa traveled 6865 km.
2.3 Data analysis
The volume of acoustic data obtained by the moored recorders and during the Wave Glider mission was too great for manual analysis. Therefore, recordings were analyzed for the presence of humpback whale song using a deep convolutional neural network (CNN) developed by Google, Inc. and described in Allen et al. (2021). In brief, the model transforms audio files to spectrograms that are normalized using per-channel energy normalization (Wang et al., 2017) and then fed into a ResNet-50 CNN originally developed for image classification. The CNN was trained for the binary classification problem of humpback presence using a dataset built from manual analysis of HARP data from other locations and then refined by a few active learning iterations.
Continuous data from the moored recorders were processed by the model as either 30-second (SoundTrap data) or 75-second (HARP data) files. SoundTrap data were divided into 30-second segments because this was the protocol used in the broader SanctSound project under which this effort occurred, while HARP recordings were analyzed in 75-second segments because that is the duration of individual recordings made by the instrument. Data from the WG mission were processed as the original 1-minute recordings. Each recording file was evaluated for the presence or absence of humpback whale song. The model was evaluated on 3.84-second context windows sliding over the files with a 1.07-second hop. This assigned each window a score between 0 and 1, representing the model’s relative certainty of whale song being present in that window. This resulted in 27 scores per file for SoundTraps, 56 scores per file for WG recordings, and 70 scores per file for HARP data. Previous efforts to validate the model using acoustic data from 13 moored recorders (both HARP and SoundTrap) in Hawaiian waters and other parts of the Pacific established that the CNN’s precision (a measure of specificity) was on average 0.95 (S.D. = 0.05) and recall (a measure of thoroughness) was on average 0.85 (S.D. = 0.1) (Allen et al., 2021; Lammers, unpublished data). For moored acoustic data, it was determined that average scores per file equal to or greater than 0.2685 are accurately indicative of humpback whale song presence.
For the WG data, which contained flow and mechanical noise not present in moored recorder data, the optimal threshold had to be determined separately. A manual validation of 600 recording files randomly selected during the month of February was used to evaluate a range of threshold values by calculating their performance in terms of precision and recall as follows:
Model output thresholds between 0.2 and 0.3 were evaluated in 0.01 increments by first manually scoring the randomly selected test files as having humpback whale song either present or absent. These were then used with the model’s output scores to determine true/false positives and negatives in order to calculate precision and recall for different thresholds. Manual analyses were conducted in Adobe Audition™ by visualizing spectrograms using a 1024-point Fast Fourier Transform and a Hamming window with no overlap. An experienced analyst (A. Kügler) evaluated each recording for the presence of whale song while blind to the model’s corresponding score. The result of this exercise determined that the threshold value with optimal performance was 0.24. This threshold corresponded to precision and recall values of 0.93 and 0.41, respectively. The high precision but low recall values indicate that the model is a conservative detector of whale song in WG data, meaning that there is high confidence in the accuracy of positive detections, but that a high proportion of whale song is also missed. Further manual examination of false negative classifications revealed that these consistently represented faint song produced by distant animals. Thus, the model’s low recall is indicative of a more limited effective detection range than would otherwise be achieved through manual analysis of the data.
The WG and moored acoustic data were binned differently to account for the fact that the WG was moving at varying speeds during the mission. The percentage of 1-minute recording files with detected humpback whale song was calculated for each ~3 km traveled by the WG, which is the median distance traveled per hour for the entire mission and accounts for varying WG speeds. These results were visualized relative to the WG’s position per traveled segment using ArcMap Desktop 10.8.1 (Environmental Systems Research Institute, Redlands, CA). The data for each segment were then grouped according to the WG’s location. Data obtained within 3.7 km (2 nautical miles) of the 200-meter isobath of a given atoll or bank were grouped together (e.g. Middle Bank), while data recorded when the WG was in transit between banks were grouped as ‘open water.’
Moored acoustic data from each location analyzed using the CNN were used to calculate the percentage of positive whale song detections in 30-second (75-second for the HARP) recordings for each day, providing a relative measure of song presence/absence throughout the deployment period. Moored acoustic data were also used to calculate mean daily sound pressure levels (SPLs) in the 200-1000 Hz frequency band at each monitored location using instrument-specific calibrations. This band contains most of the acoustic energy contributed by the chorusing of humpback whales during the breeding season and can therefore be used as a reliable proxy for the relative abundance of singing whales over time (Au et al., 2000; Kügler et al., 2021). Hourly SPL in dB re 1 µPa was calculated using a custom ‘remora’ add-on in the Matlab™ (The MathWorks, Inc., Natick, Massachusetts, USA) program Triton (Wiggins et al., 2010); https://github.com/MarineBioAcousticsRC/Triton/tree/master/Remoras/Soundscape-Metrics) and then averaged daily.
Acoustic energy in the 200-1000 Hz band was also calculated in recordings obtained by the WG. However, because the WG transited adjacent to preferred whale shallow water habitats, not through them, chorusing by multiple whales was minimal and did not raise energy levels in this band appreciably. As a result, these SPLs were used to characterize the variation in environmental and self-noise received at the hydrophone resulting from water flow and splashing at the surface float, which varied with sea state and could affect the detection of song by the CNN. For WG recordings, SPL in dB re 1 µPa in the 200-1000 Hz frequency band were calculated in the Matlab™ program Pamguide (Merchant et al., 2015) at 30-second intervals and then averaged for each ~ 3 km distance traveled by the WG. A linear regression was performed to explore the relationship between the proportion of 1-minute recordings with whale song detections and the SPL measured within 3.7 km of the 200 m isobath of each location.
To statistically investigate whether daily song chorusing SPLs varied among moored monitored sites without violating assumptions about independence of samples, 33% of the daily SPLs were randomly subsampled for each of the months of December, January, February, March, and April, totaling 48 daily samples for each monitored location. These were further subdivided into early season (December), peak season (January to March) and late season (April) data. Depending on the normality of the resulting data subsets, either a parametric one-way ANOVA or a nonparametric Kruskall-Wallis was used to test the null hypothesis of no significant difference among monitored sites and post-hoc comparisons were performed to further explore significant differences. Data from May were not included in these analyses because they were not uniformly obtained for the entire month at all sites.
2.4 Modeling of WG data
To understand the associations between habitat variables and humpback whale song occurrence in the Northwestern Hawaiian archipelago, WG data were analyzed within a generalized additive model (GAM) framework. A description of how the GAM was parameterized follows. All analyses were conducted in R (R Core Team, 2022) version 4.0.2.
Due to the continuous sampling of the WG, the nature of humpback whale singing behavior, and the slow travel rate of the WG at approximately 1.85-2.78 km/h (1-1.5 knots), the acoustic data is highly autocorrelated. To avoid pseudoreplication and violating the assumption of independence of samples, the percentage of positive humpback whale detections was calculated per the median distance traveled by the WG over 6 hours (dmedian,6h=17860 m), representing a data bin. The latitude and longitude coordinates at the midpoint were determined for each data bin. Bathymetry for the NWHI from the Multibeam Synthesis Project (http://pacioos.org/metadata/hurl_bathy_60m_nwhi.html) was downloaded as a 60 m grid and converted into contours in 20 m intervals in ArcMap Desktop 10.8.1. The WG’s distance to the nearest 200 m isobath in kilometers was determined for each 1-minute recording using the distance tool in ArcMap and the median was calculated for each 6-hour data bin. The distance was set to zero when the WG was inside the 200 m isobath. For all atolls and banks, the area (in km2) between 20 m and 200 m in depth, corresponding to preferred humpback whale habitat (Herman and Antinoja, 1977; Mobley et al., 1999), was calculated in ArcMap. Site area was set to zero for all locations outside the 200 m isobath. The maximum area was used for each data bin. The distance to the 200 m isobath of Niihau as a proxy for distance to the MHI was calculated for each 6-hour data bin’s midpoint using the marmap package (Pante and Simon-Bouhet, 2013) and all WG locations southeast of Niihau (cf. Figure 1) were set to zero. All dates were converted to Julian day. Additionally, median SPL in dB re 1 µPa in the 200-1000 Hz frequency band (computed in Pamguide every 30 s of the continuous data as described above) was calculated for each 6-hour data bin. The binned data were subset to only include data to the northwest of Niihau and all bins to the southeast of Niihau were excluded from further analysis.
The GAM was fit using the mgcv package in R (Wood, 2006) with the following equation:
%HW = ß0 + f1(Lat, Long) + f2(julian) + f3(d.200isobath) + f4(SPL)+ f5(d.Niihau) + site.area + direction + ϵ
where %HW is the percentage of positive humpback whale detections per ~18 km traveled, ß0 is the intercept, f1 to f5 are the respective smoothing functions, Lat, Long is a 2D-smother used to reduce spatial autocorrelation, julian is Julian day used to examine the potential influence of seasonality in singing activity, d.200isobath is distance to the 200 m isobath, d.Niihau is the distance to the 200 m isobath of Niihau, SPL is the median SPL in the 200-1000 Hz band, site.area is the area of atolls/banks between 20 m and 200 m depth as an ordered factor, direction is a factor of the travel direction of the WG with levels ‘westbound’ and ‘eastbound’, and ϵ is the error term. Likelihood ratios were determined with the anova() function from the mgcv package and a = 0.05. Model residuals were checked for autocorrelation using the acf() function.
2.5 Sound propagation modeling
To examine whether acoustic propagation influenced patterns of whale song occurrence either on fixed moorings or on the WG, sound propagation models were created for each mooring location and at selected locations along the WG’s path. Although humpback whale song frequency content and source level can vary considerably (Au et al., 2006), a signal with a nominal frequency of 300 Hz and a source level of 170 dB re 1 µPa at 1 m was used for sound propagation modeling. At each location, the signal-to-noise ratio (SNR) was calculated as the difference between predicted received level (RL) at the hydrophone and the wind-induced noise level (WN). The RL field was calculated for a sound source as the difference between the source level and transmission loss (TL), which was modeled using a U.S. Navy version of the range-dependent parabolic equations acoustic propagation model (Collins, 1993) and U.S. Navy and NOAA environmental databases: High-Resolution ¼ degree Global Sea Surface Wind Speed and Climatology (NOAA); Bottom Sediment Type database (Navy) and Global Ocean Sediment Thickness Dataset (NOAA). Geoacoustic parameters were extracted from published sources (Colosi, 2016). Range-dependent sound speed profiles along an acoustic propagation path were calculated from temperature and salinity climatological monthly means of the U.S. Navy Generalized Digital Environmental Model. The ocean bathymetry was based on the NAVOCEANO Digital Bathymetric Database and data from PacIOOS (www.pacioos.org). The model ran along 360 radials to generate a pseudo-2D TL field within a predefined range from a sound source fixed in space at 8 m depth. Following the reciprocity principle, the TL field was interpreted as the transmission loss from moving sound sources within a 92.6 km (50 nm) range from the fixed-position hydrophone (Margolina et al., 2018). To estimate WN, the wind-induced noise spectrum level (NSL) at the sound source frequency was calculated from the 10 m wind speed monthly climatology using a U.S. Navy version of the Wenz curve. NSL was then converted to WN as a 1/3-octave band level centered at the sound source frequency (267-337 Hz). The model output was used to calculate a “listening range” in meters, which was the mean distance over which predicted RLs exceeded WN for the 360 calculated radials. Listening ranges were calculated for each mooring location and at 30 locations along the WG’s path to provide a sense of how sound propagation varied along the glider’s path at 1-5 locations near the shoals, banks and seamounts surveyed.
3 Results
3.1 Moored acoustic recorders
All moorings successfully recorded through all or most of the breeding season, except the recorder at Middle Bank, which experienced a memory card failure that rendered the data between 1 October 2019 and 30 March 2020 unretrievable. The recorder at Maui stopped recording prematurely on 16 April 2020 due to a malfunction. Table 1 summarizes the time periods recorded by all eight moored acoustic recorders.
The daily variation in the detection of humpback whale song by the CNN, as well as the chorusing levels measured in SPL at each of the monitored sites is shown in Figure 3. Whale song was recorded at all locations, with rising occurrence in December and falling occurrence in April. The percentage of positive daily detections per 30-second (75 seconds for PHR) recording period by the CNN was between 80% and 100% during January, February and March at all sites except at Middle Bank, where no data were obtained during that time, and at PHR where singing activity was considerably lower overall. SPL values reveal that Maui had the highest chorusing levels overall, followed by Hawaii Island, FFS, Middle Bank, Oahu, Kauai, Gardner Pinnacles and PHR, respectively. Of note is that the maximum SPL values for Middle Bank only reflect chorusing levels beginning in late March, suggesting that higher levels may have occurred there earlier in the season.
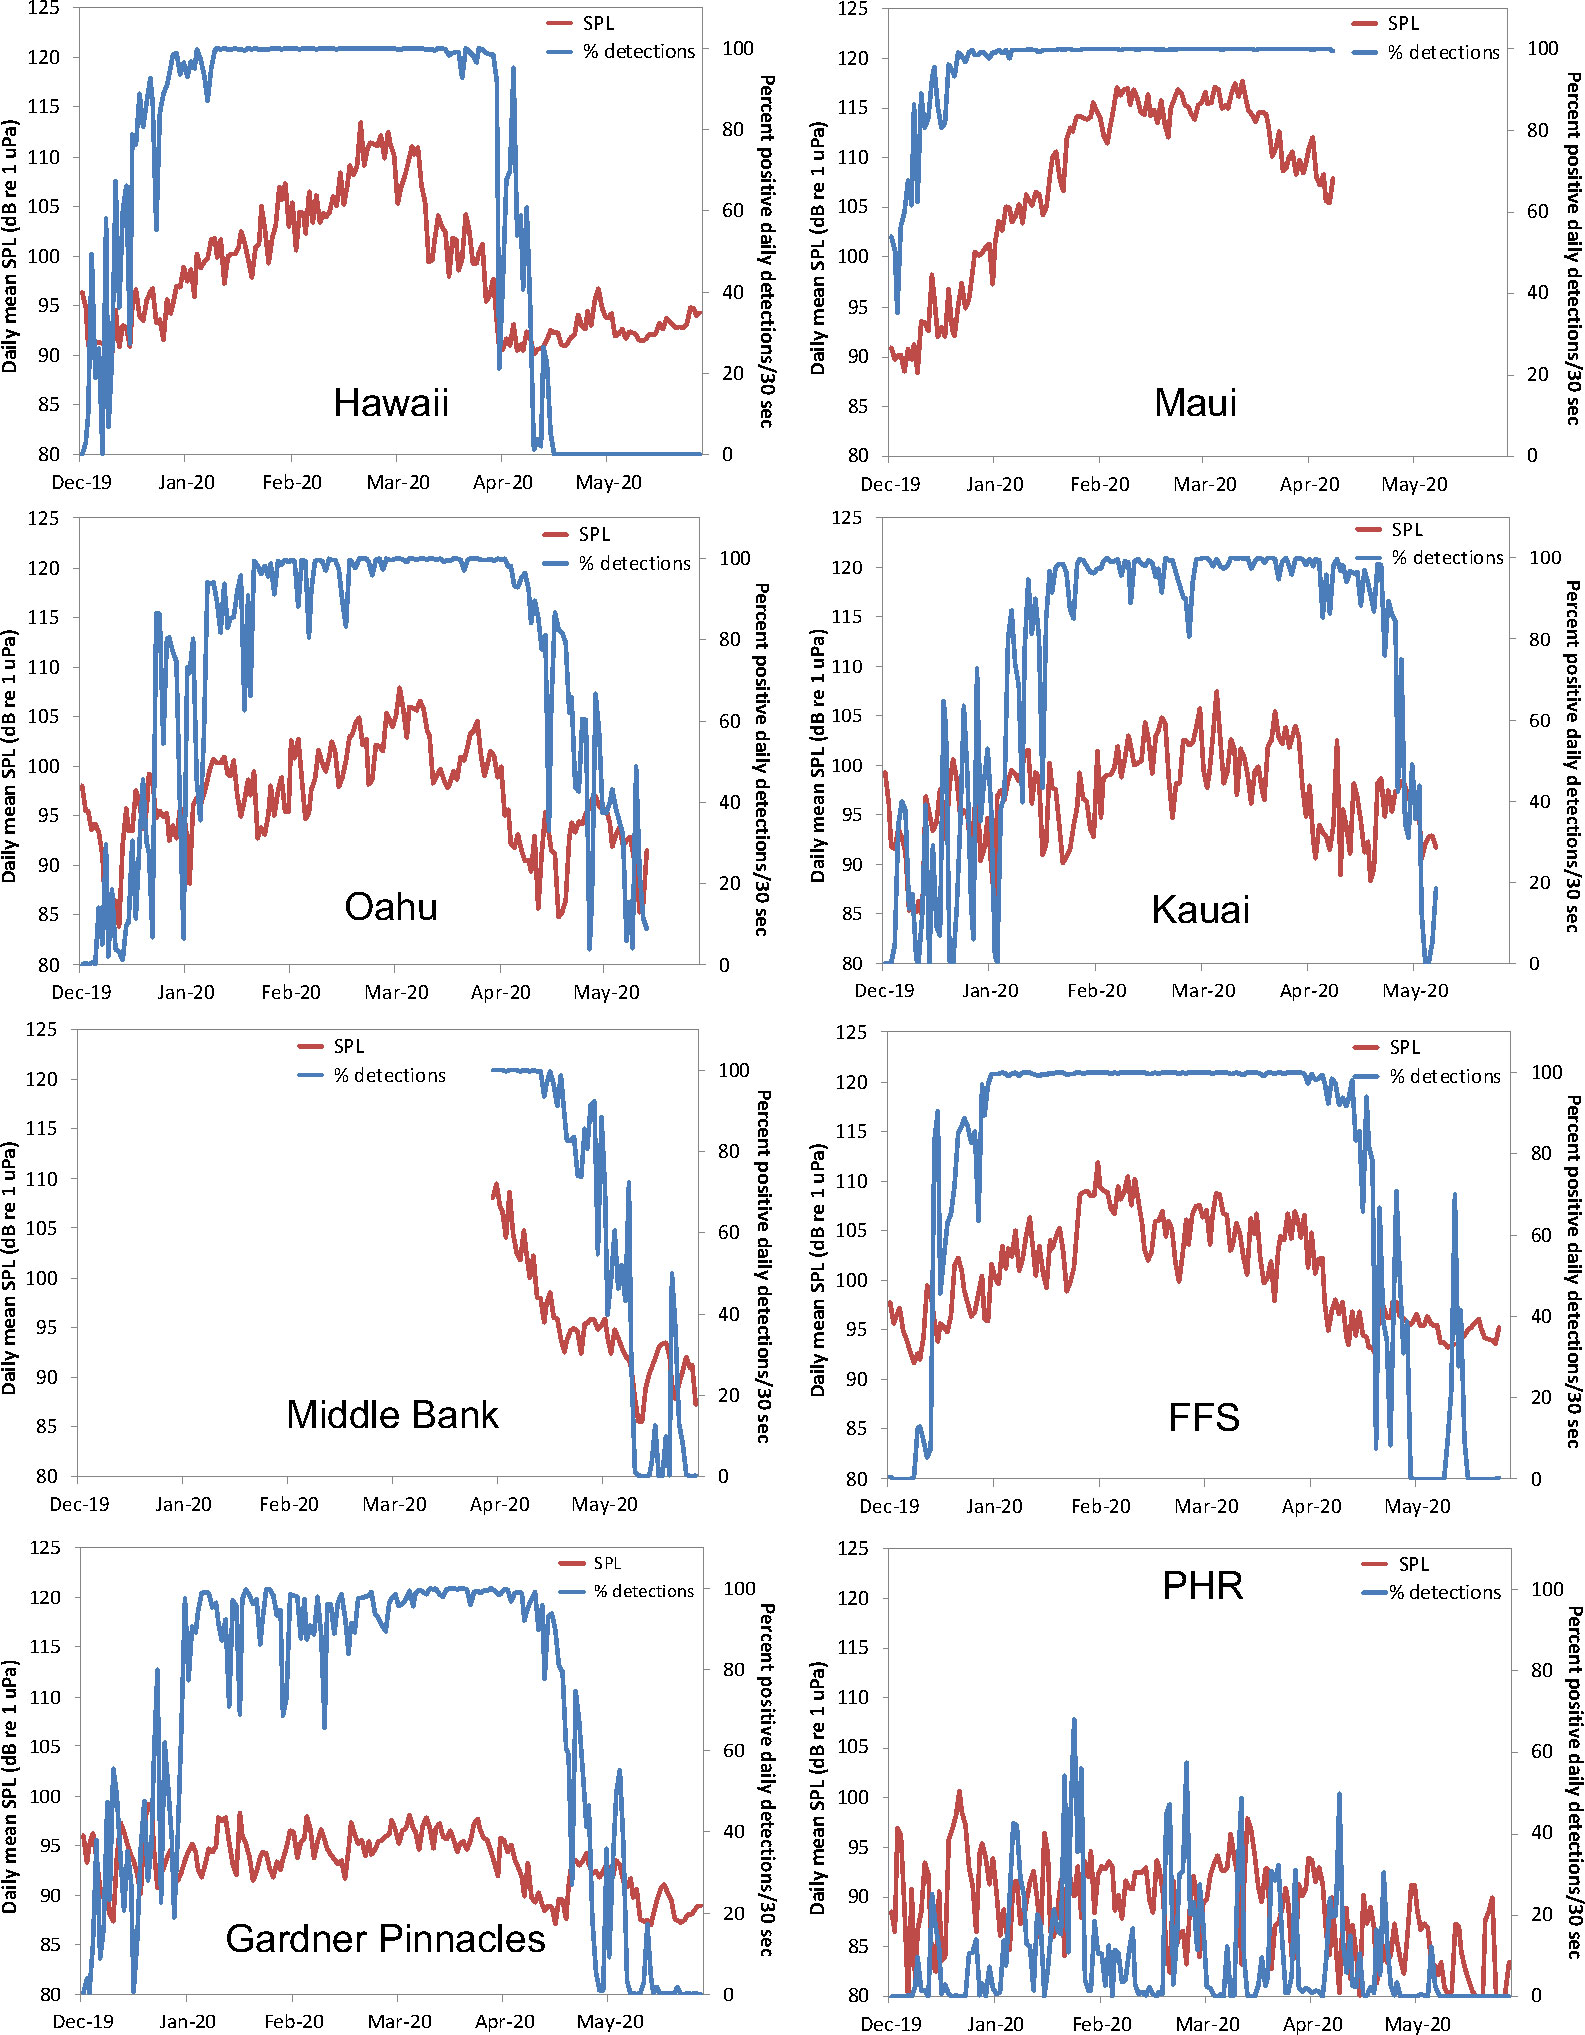
Figure 3 The variation in humpback whale song occurrence at each monitored location measured as the daily percentage of song presence/absence determined by the CNN (blue line) and the daily SPL recorded in the 200-1000 Hz band (red line).
The variation in chorusing SPLs during early (December), peak (January-March) and late (April) season across sites is shown in Figure 4. No significant differences were observed among sites in the early season (One-way ANOVA, F=2.13, df=6, p=0.063), but were present during the peak of the season (Kruskall-Wallis, df=6, p<0.001) and late in the season (One-way ANOVA, F=8.90, df=6, p<0.001). During the peak of the season, significant differences among sites were driven by high chorusing levels at Maui and FFS and low chorusing levels at Gardner and PHR. Late in the season, levels were significantly higher at Middle Bank and FFS than at Hawaii Island, Oahu, Gardner and PHR (Tukey HSD post-hoc test). No statistical comparison was performed with Maui in April due to incomplete data obtained for that month.
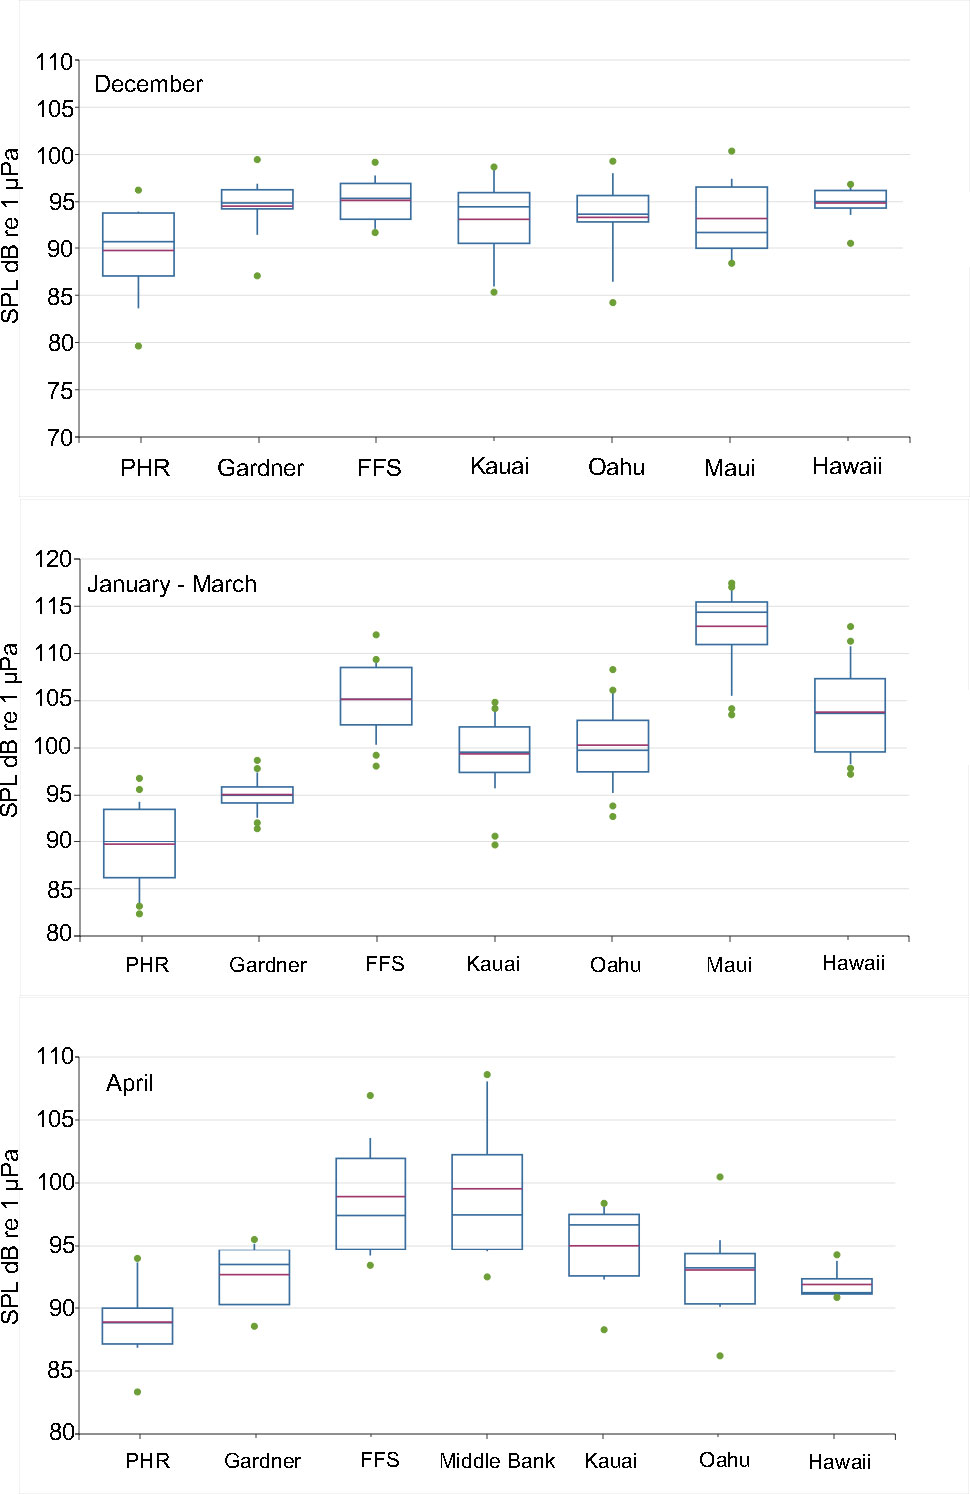
Figure 4 Chorusing SPLs in dB re 1 μPa across fixed monitoring sites during early (December), peak (January-March) and late (April) season. Boxplots show the interquartile range, the median (blue line), mean (red line), 5th and 95th percentile whiskers and outliers (green dot).
3.2 Wave glider mission
Europa recorded nearly uninterrupted between 10 January and 14 March 2020, except for a period of 18.5 hours between 29 and 30 January when a temporary interruption occurred and no recordings were made while in waters between Necker Island (Mokumanamana) and FFS. In total, 92,408 1-minute recordings were made over the course of the mission. Visual inspection of the files revealed that the quality of the recordings was high, albeit interspersed with occasional low-frequency flow noise mostly below 200 Hz and a sporadic tonal sound from rudder adjustments at approximately 800 Hz, driven primarily by conditions at the surface resulting in variations in the WG’s speed and need to course-correct. However, manual validation of the CNN’s output revealed that these sources of noise were not misclassified as humpback whale song.
The locations along Europa’s path where humpback whale song was detected, as well as the percentage of 1-minute recordings with positive detections made by the CNN per ~3 km traveled, are shown in Figure 5. Song was recorded throughout PMNM near shallow banks and seamounts, but not uniformly at each location. Sites with high prevalence of whale song included: Middle Bank, the western bank of Nihoa, Necker Island, Raita Bank and Northampton Seamounts. Lower or no song occurrence was observed in open waters between seamounts and banks, as well as at Twin Banks, St. Rogatien and Brooks Banks (SRBB), Gardner Pinnacles, Lisianski Island, and Pioneer Bank.
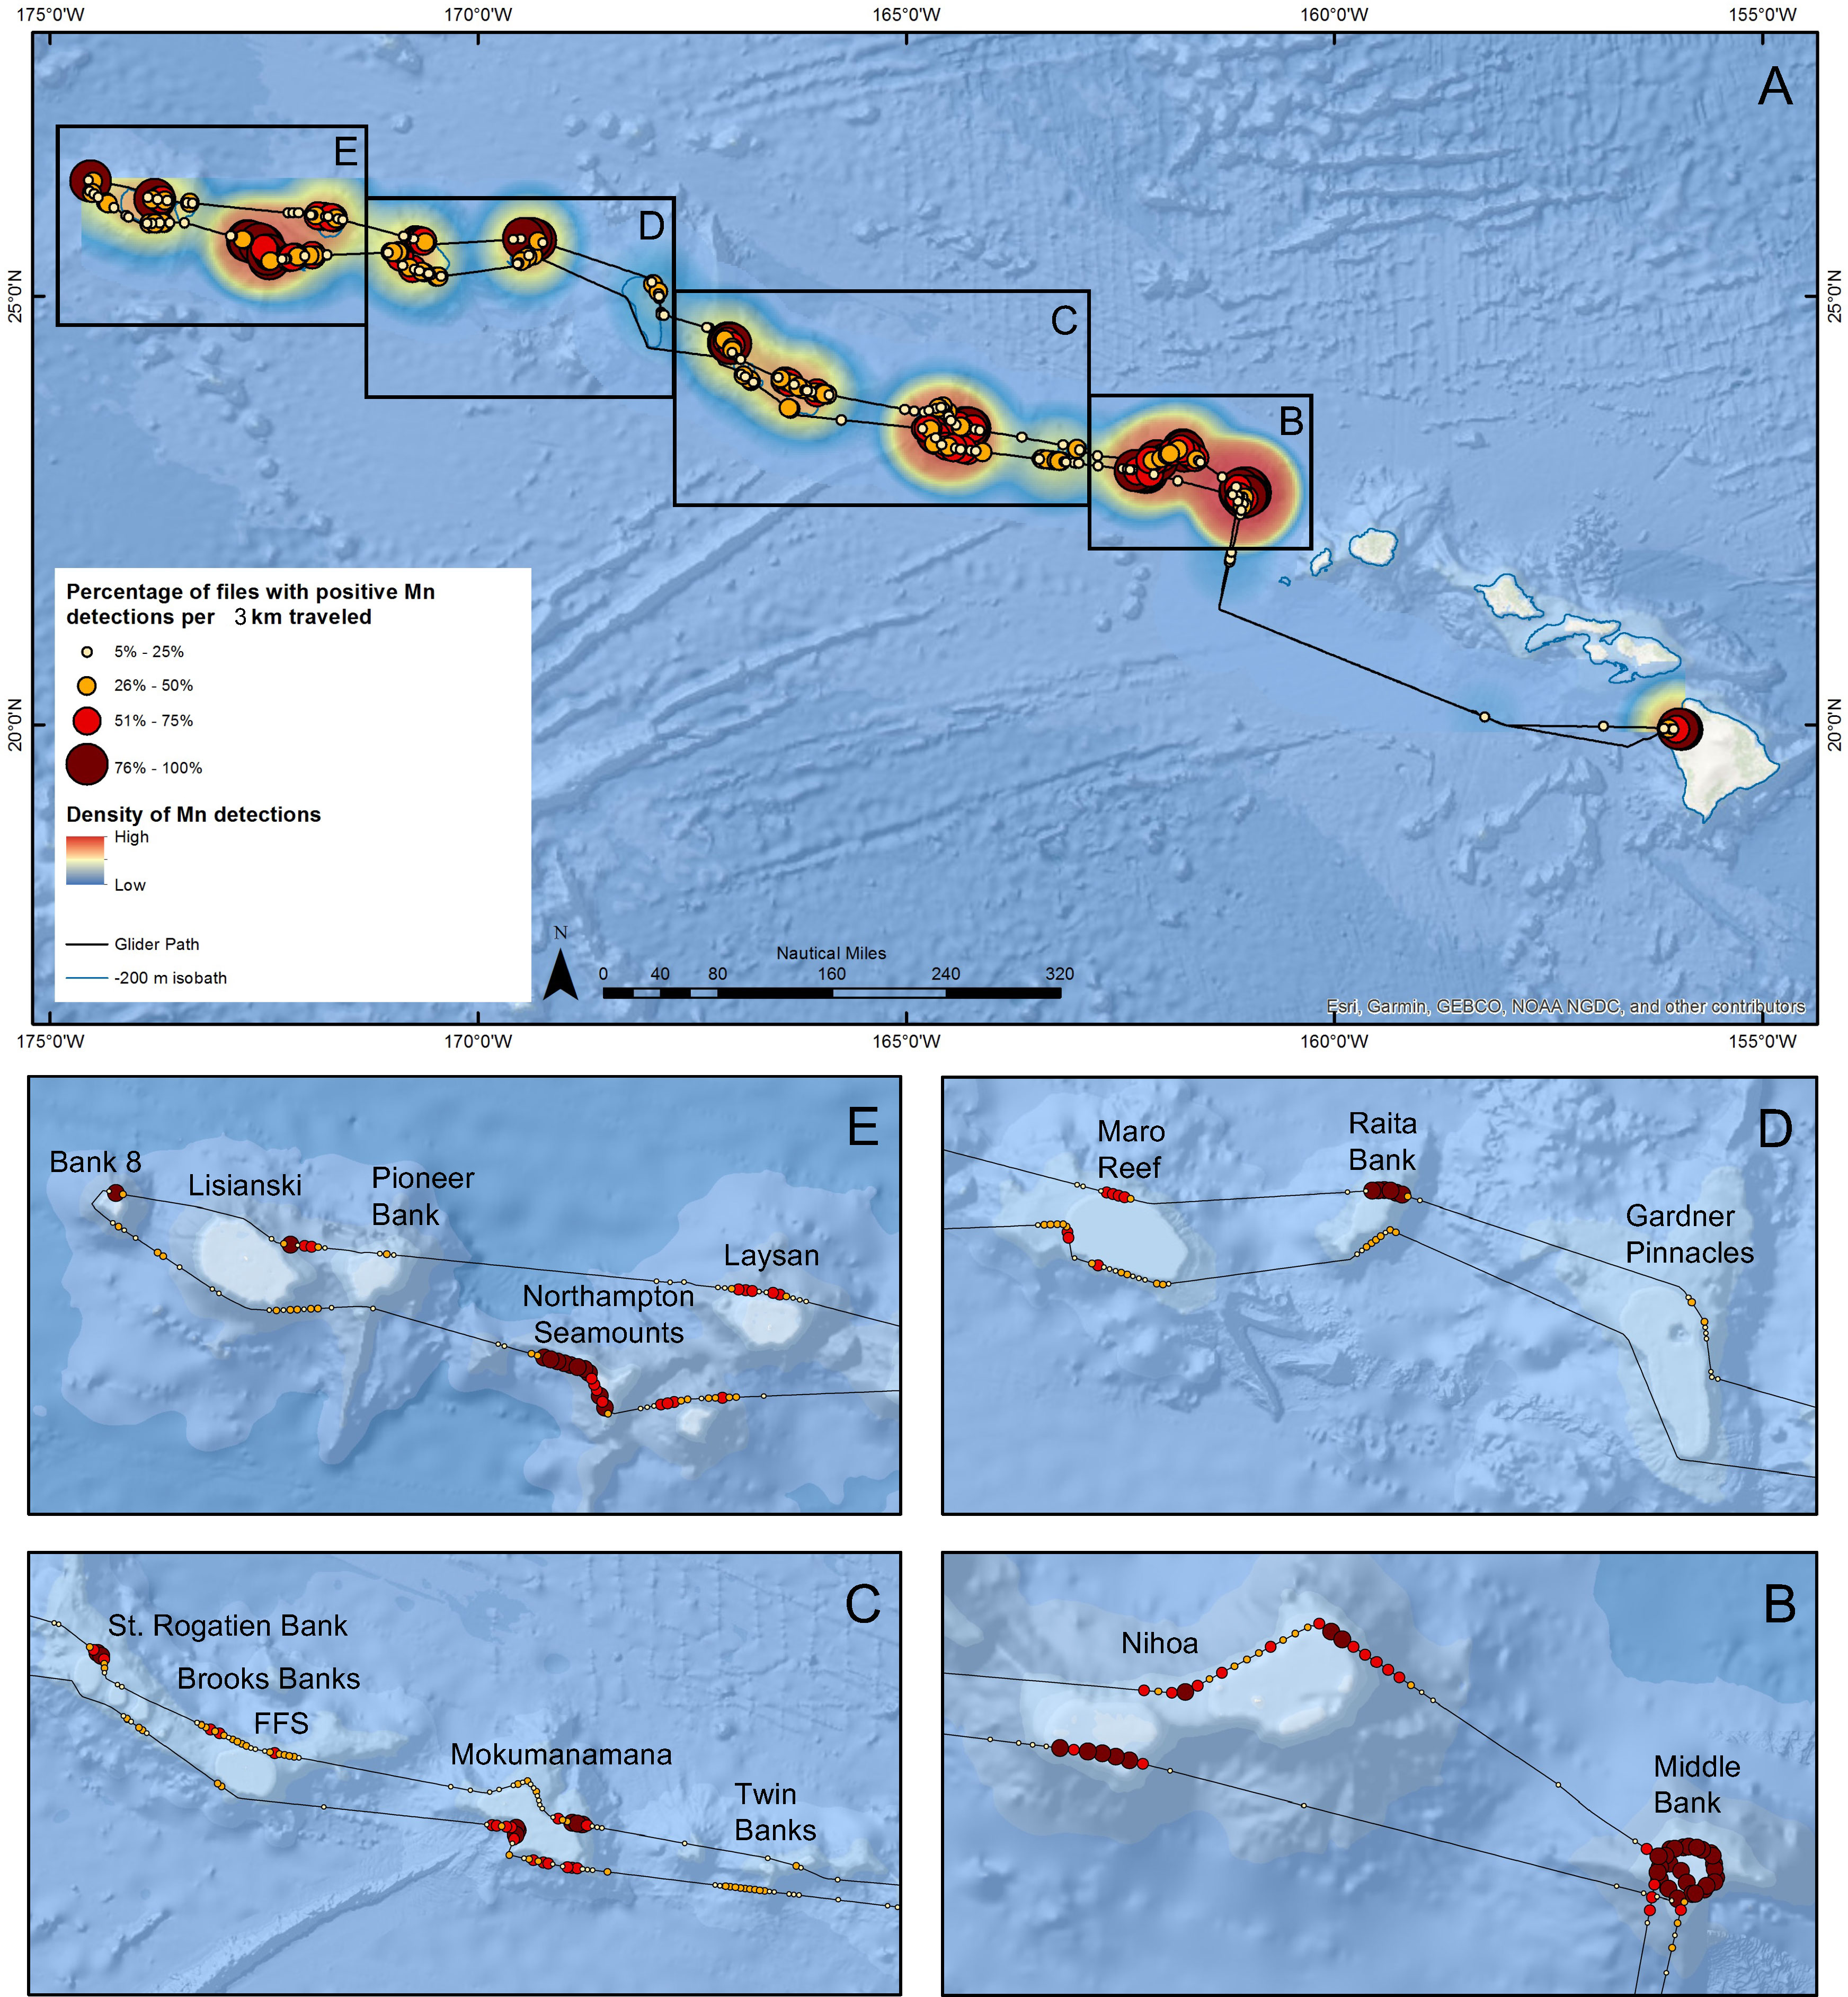
Figure 5 Map of the Hawaiian archipelago with inserts showing where along the WG’s path humpback whale song was detected, presented as the percentage of 1-minute recordings with positive detections per ~3 km traveled. The size and color of individual dots indicates the percentage range of positive detections. The relative density of detections is shown as a heatmap.
A quantitative comparison of song presence reported as the proportion of 1-minute recordings with whale song detections within 3.7 km of the 200 m isobath of each location is shown in Figure 6. Also shown in Figure 6 is the mean SPL in the 200-1000 Hz band recorded at each location. There was a decreasing trend in song occurrence as the glider transited from Middle Bank toward the northwest of the archipelago, reaching a minimum at Gardner Pinnacles. However, once beyond Gardner Pinnacles, song occurrence increased again at Raita Bank and reached another maximum at Northampton Seamounts, before dropping off again at Pioneer Bank. The mean SPLs recorded varied by approximately 15 dB among locations, with the lowest levels observed at Lisianski Island and the highest at Twin Banks. A linear regression of the mean proportion of detections against the mean SPL for each location was not significant (R2 = 0.05221, ANOVA, df= 1, F=0.66108, p=0.432), indicating that variation in ambient noise, although influencing song detectability (see GAM results below), was not predictive of the amount of whale song observed among locations. In other words, there were other more relevant factors (e.g. the number of whales singing) influencing how much singing was detected.
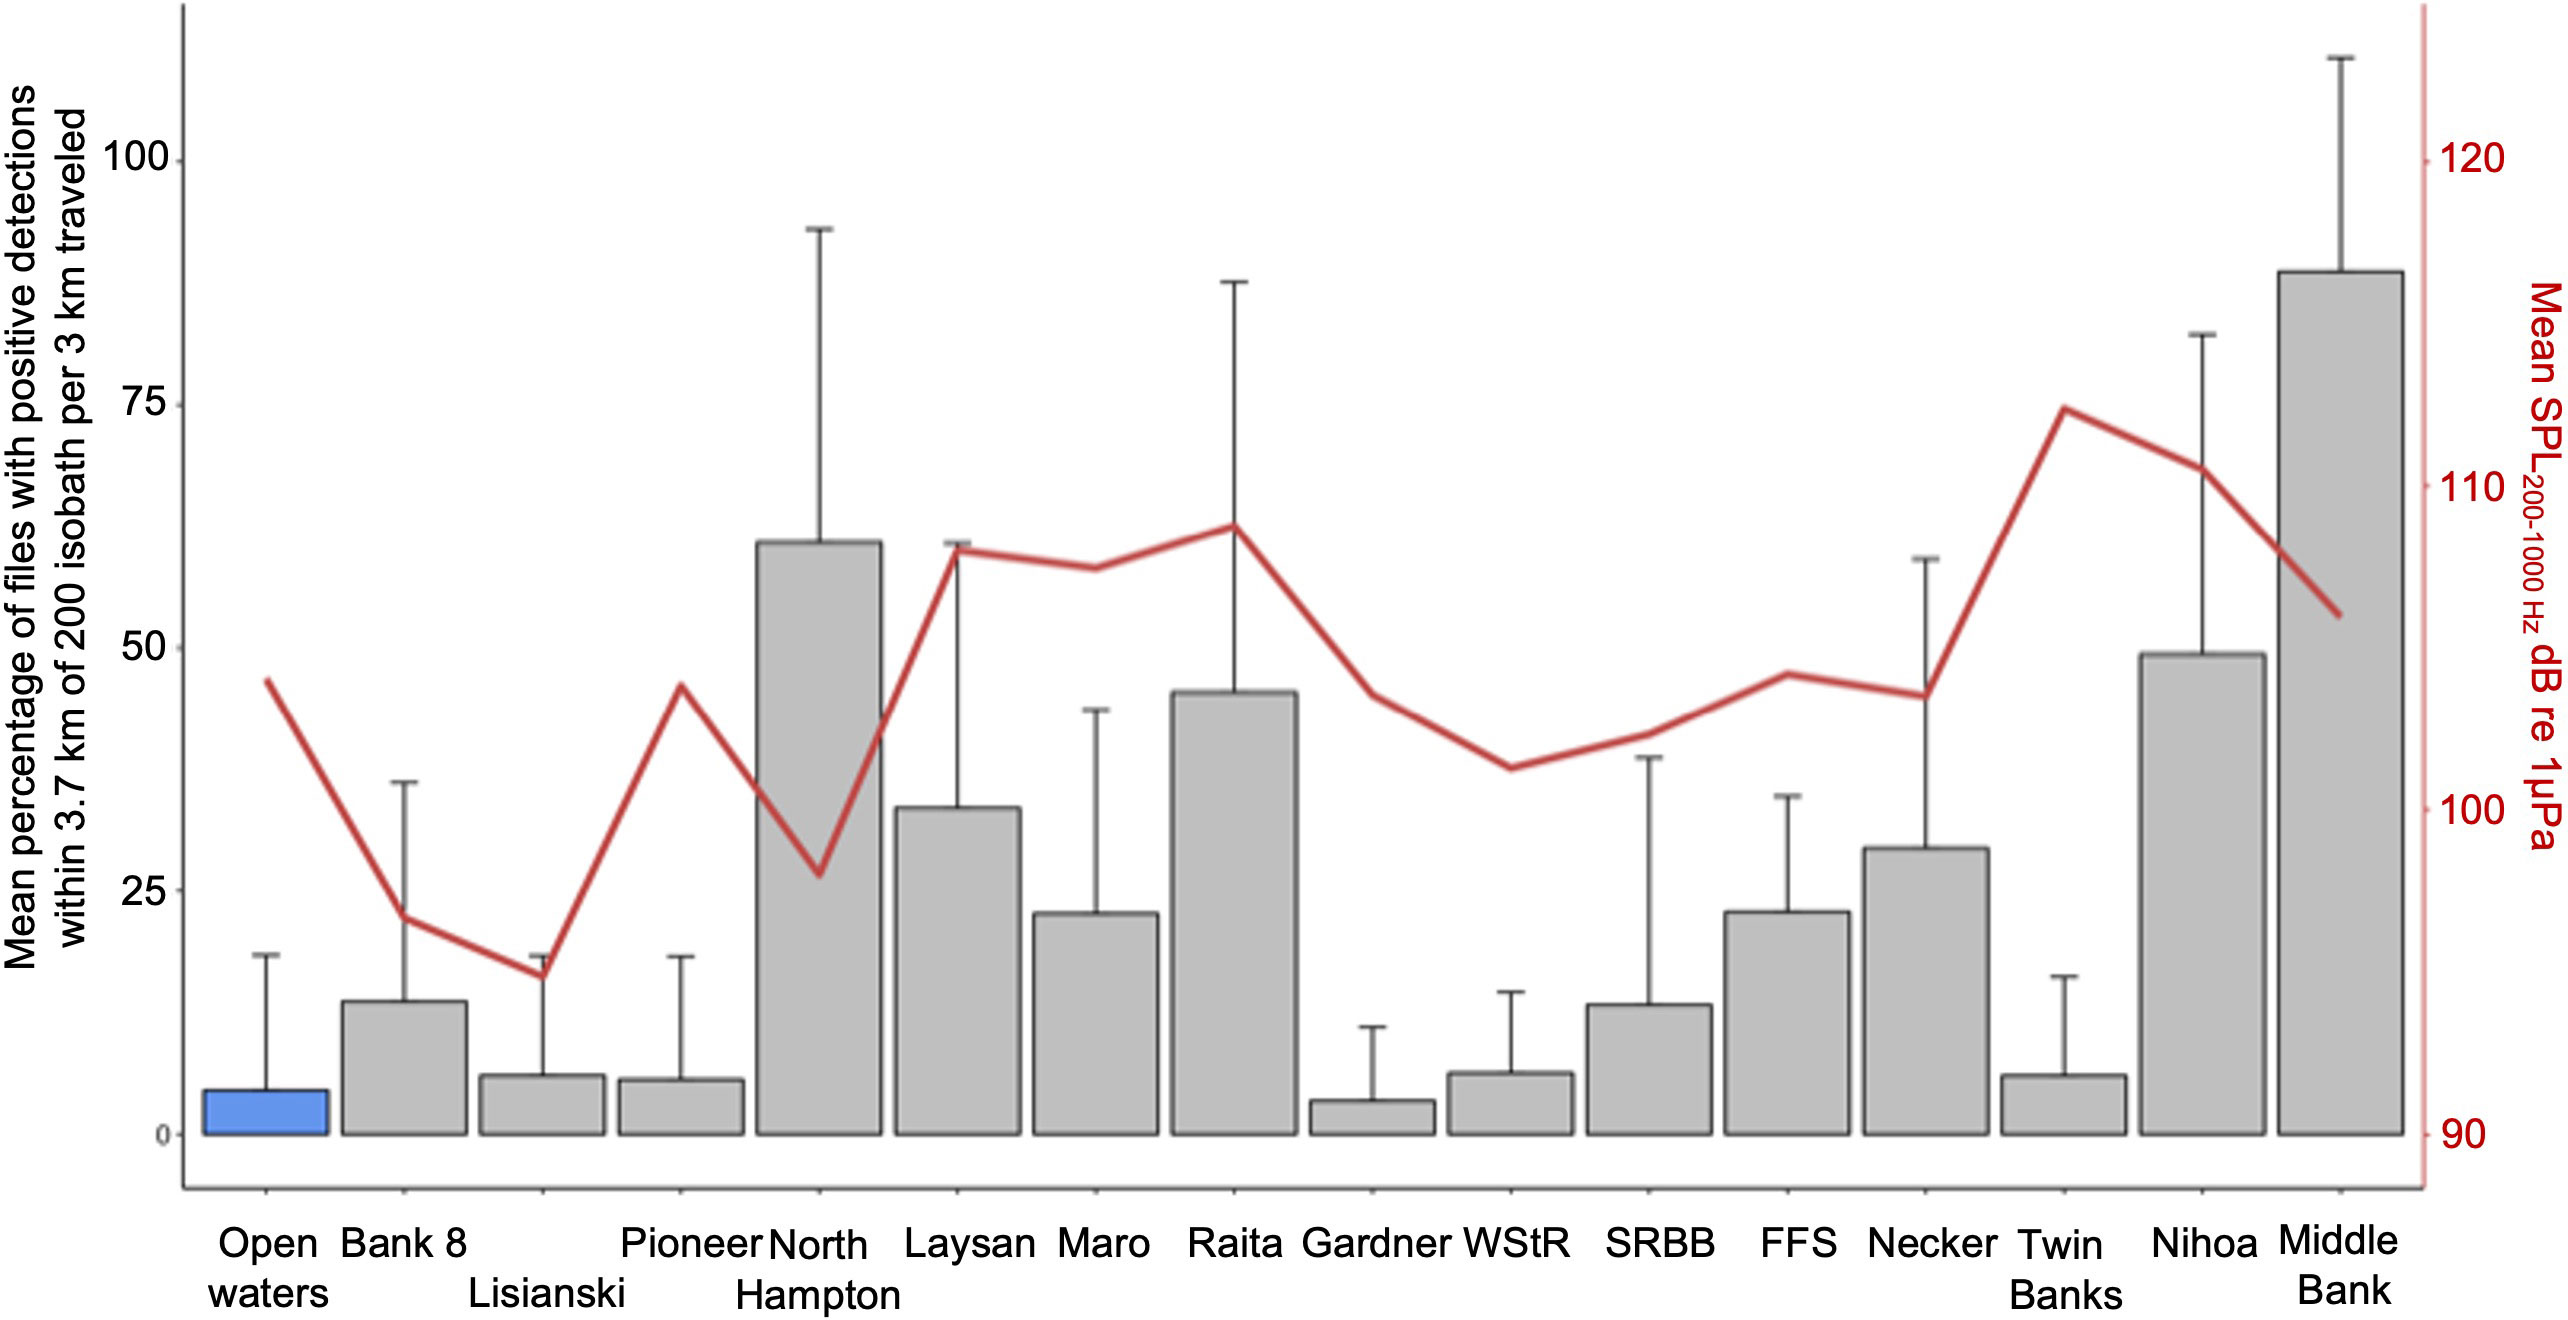
Figure 6 Comparison of song presence along the WGs path reported as the mean percentage and standard deviation of 1-minute recordings with whale song detections within 3.7 km of the 200 m isobath of each location visited. Also shown is the mean SPL in dB re 1 μPa in the 200-1000 Hz band recorded at each location (red line).
3.3 Generalized additive model
The GAM indicated that humpback whale song prevalence decreased with distance to the 200 m isobath (d.200isobath: F=5.10, edf=2.690, p<0.0001; Figure 7) and varied with available favorable habitat (site.area: F=10.89, df=13, p<0.0001), although there was no clear relationship between area and detection rate. Humpback whale song was also less likely to be detected with increasing noise (SPL: F=0.63, edf=1.48, p=0.013; Figure 7) and decreased with increasing distance to the 200 m isobath of Niihau, at the northwest edge of the MHI (d.Niihau: F=0.24, edf=0.682, p=0.007; Figure 7). These effects were not consistent throughout the archipelago, and there appeared to be significant stratification of humpback whale occurrence remaining after accounting for the observed variation explained by the other covariates (Lat, Long: F=0.83, edf=7.802, p=0.0003; cf heatmap in Figure 7). Julian day was not significant (F=0, edf<0.0001, p=0.83), indicating that the observed variation in humpback whale song occurrence was not the artifact of seasonality, likely because the WG mission took place during the peak of the breeding season when there was relatively little variation in the abundance of whales (Au et al., 2000; Lammers et al., 2011; Kügler et al., 2020). The travel direction of the glider, covering both leeward and windward sides of atolls and banks, also was not significantly different between the outbound and return legs (direction: F=0.46, df=1, p=0.498). Overall variation explained by the model is 70.06%. Visualizations of the significant partial effects are summarized in Figure 7.
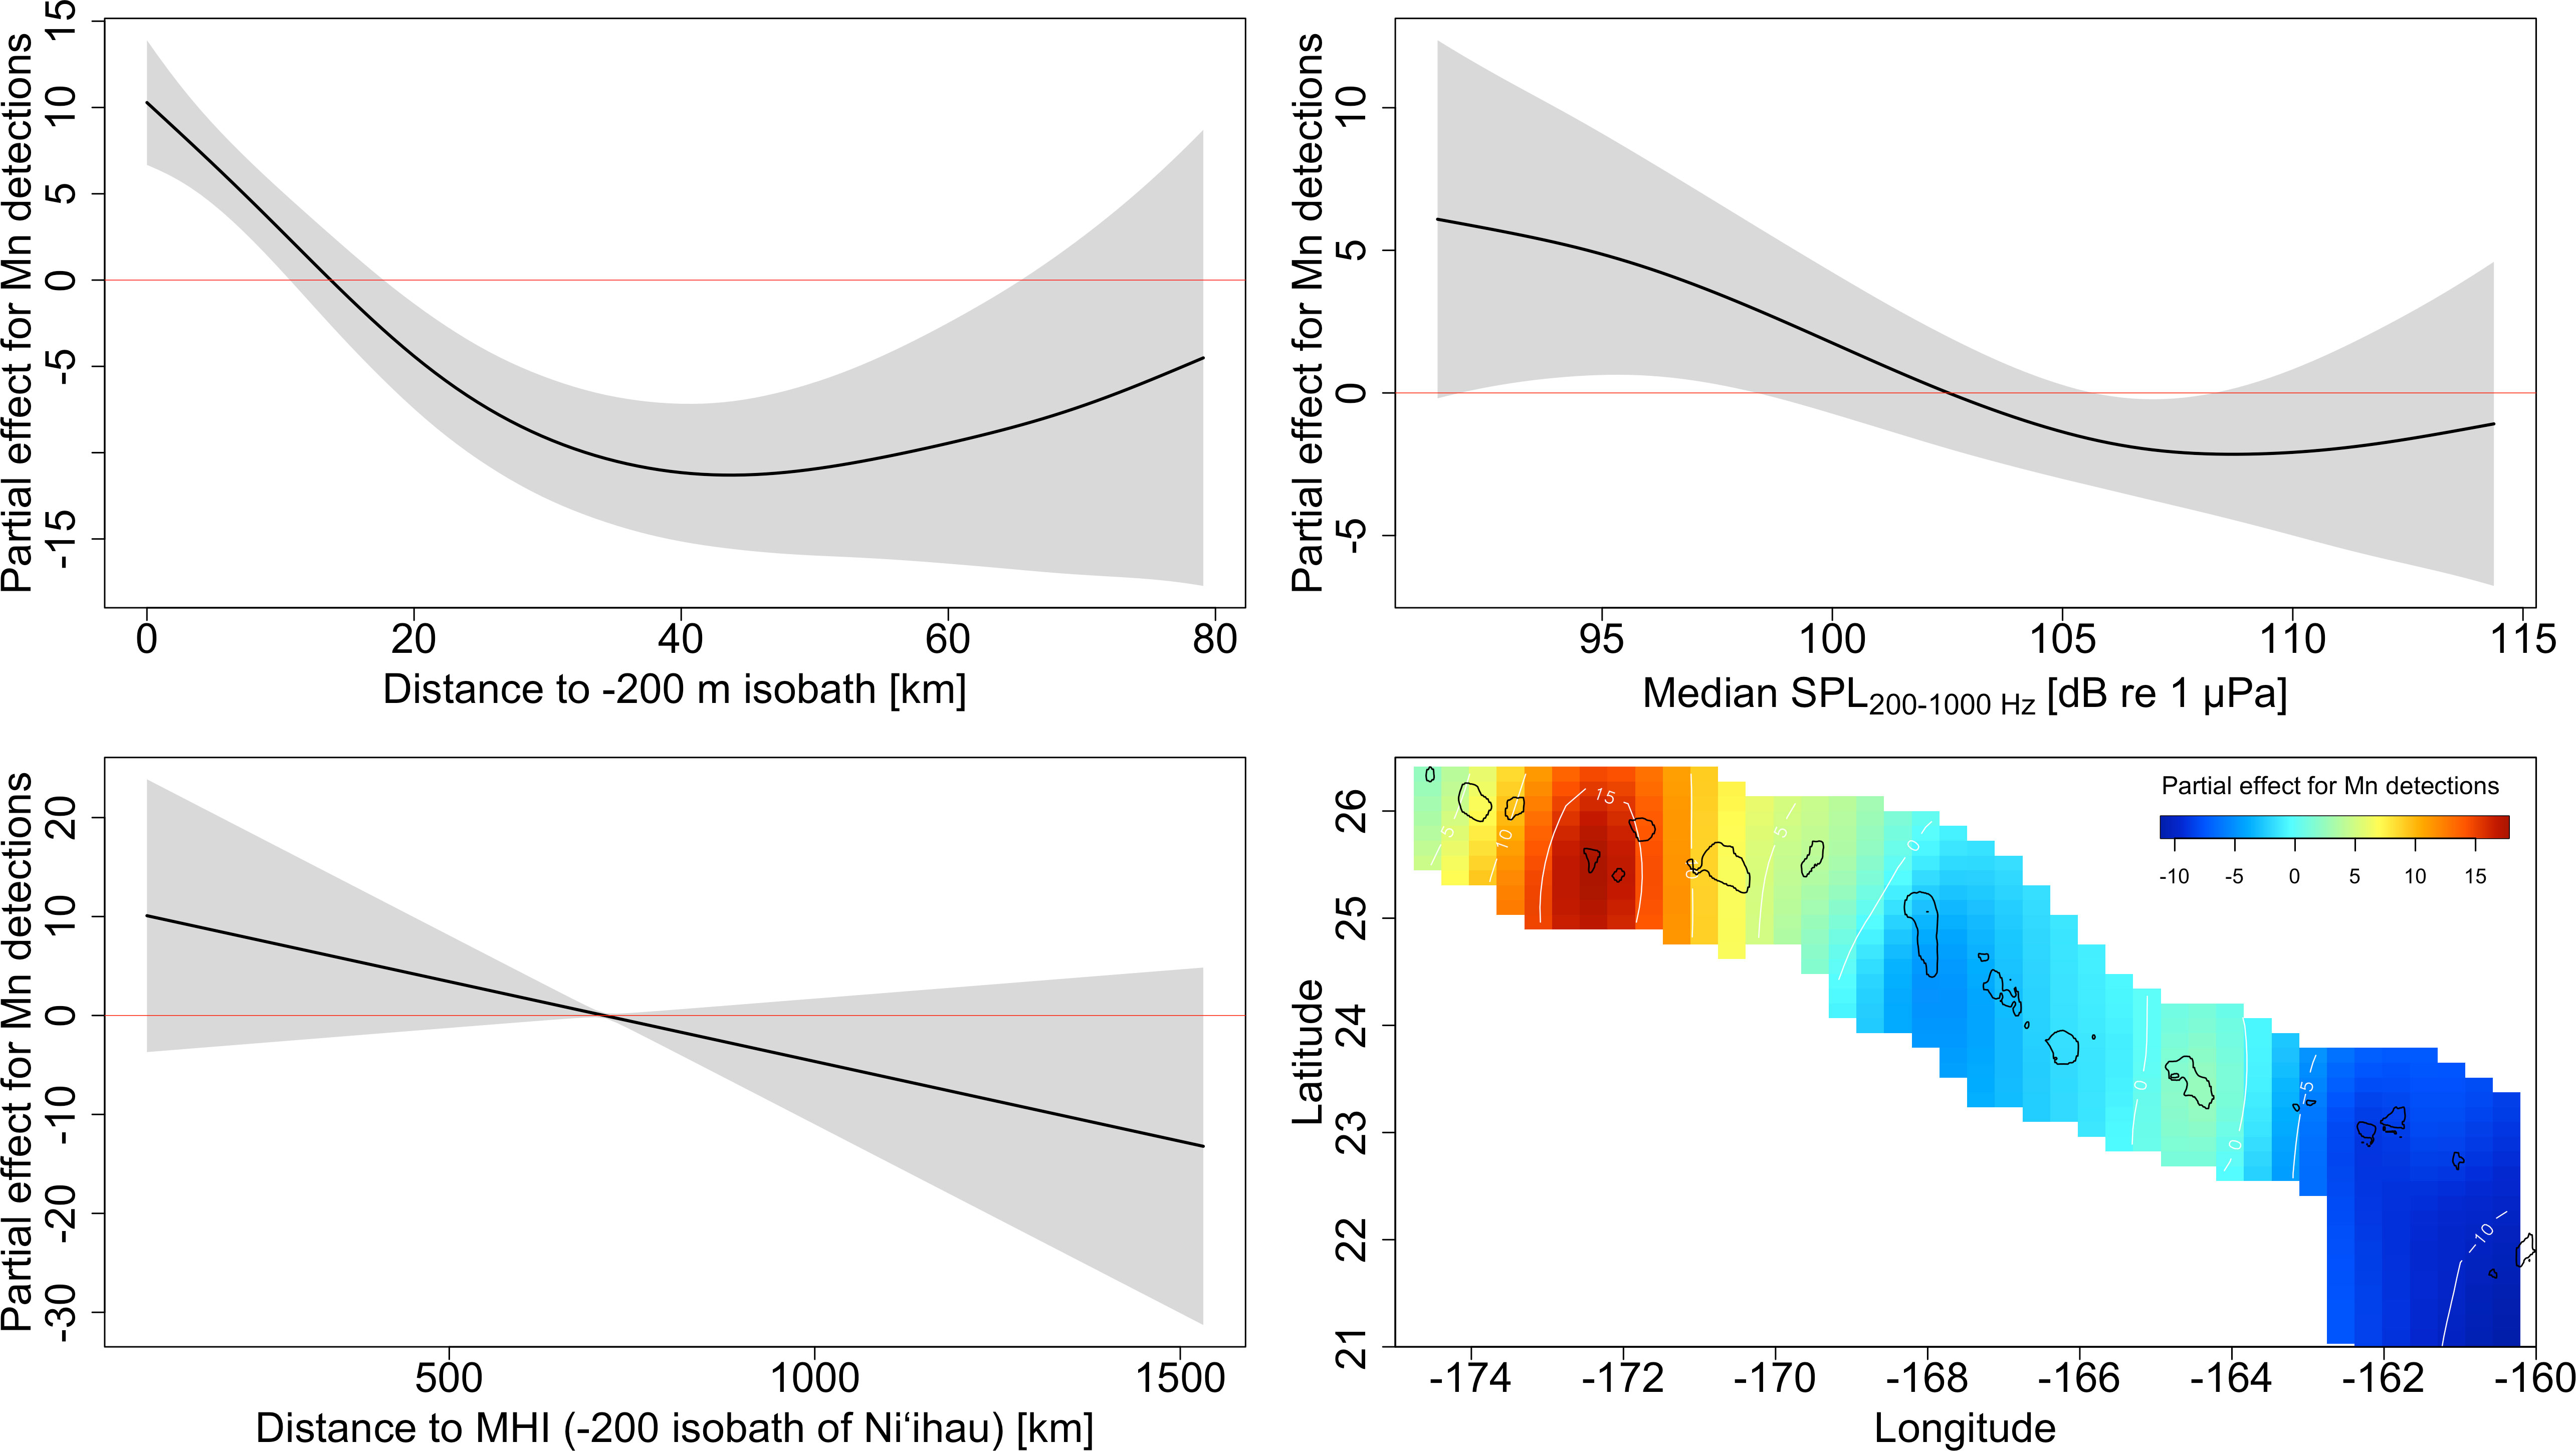
Figure 7 Visualization of the GAM’s partial effects for song detection for the variables ‘distance to the 200 m isobath’, ‘median SPL in the 200-1000 Hz band’, ‘distance to the MHI’, and the 2D-effect of ‘latitude’ and ‘longitude’ (heatmap). Orange and red colors in the heatmap represent higher than expected song detection based on latitude/longitude, blue colors correspond to lower than expected song detection, and cyan indicates no effect of latitude/longitude after accounting for the other variables.
3.4 Sound propagation
Sound propagation modeling results for the eight fixed mooring sites and at 30 locations along the WG’s path are presented in Figure 8 and Figures S1–3 in Supplementary Materials, respectively. Each map represents the modeled difference between the received level of the transmitted signal and wind induced sound level (signal-to-noise ratio) as a function of distance and bearing to the recording site. Sound propagation varied considerably among mooring sites, with the most favorable propagation conditions occurring off Hawaii Island, Maui, and Oahu, and the least favorable off FFS and Gardner Pinnacles. Table 2 presents the calculated listening ranges for each fixed mooring site, as well as for the locations visited by the WG. Multiple models were generated for most visited locations to capture different points along the glider’s path, and these were averaged by location. Here too sound propagation was found to vary considerably among locations, with the most favorable propagation conditions occurring off Laysan, Raita, and Necker, and the least favorable off Maro, SRBB and Gardner Pinnacles. However, a linear regression of the mean proportion of detections against the mean listening range for each location visited by the WG was not significant (R2 = 0.00343, ANOVA, df=1, F=0.0413, p=0.842), indicating that variation in sound propagation was not predictive of the amount of whale song observed among locations.
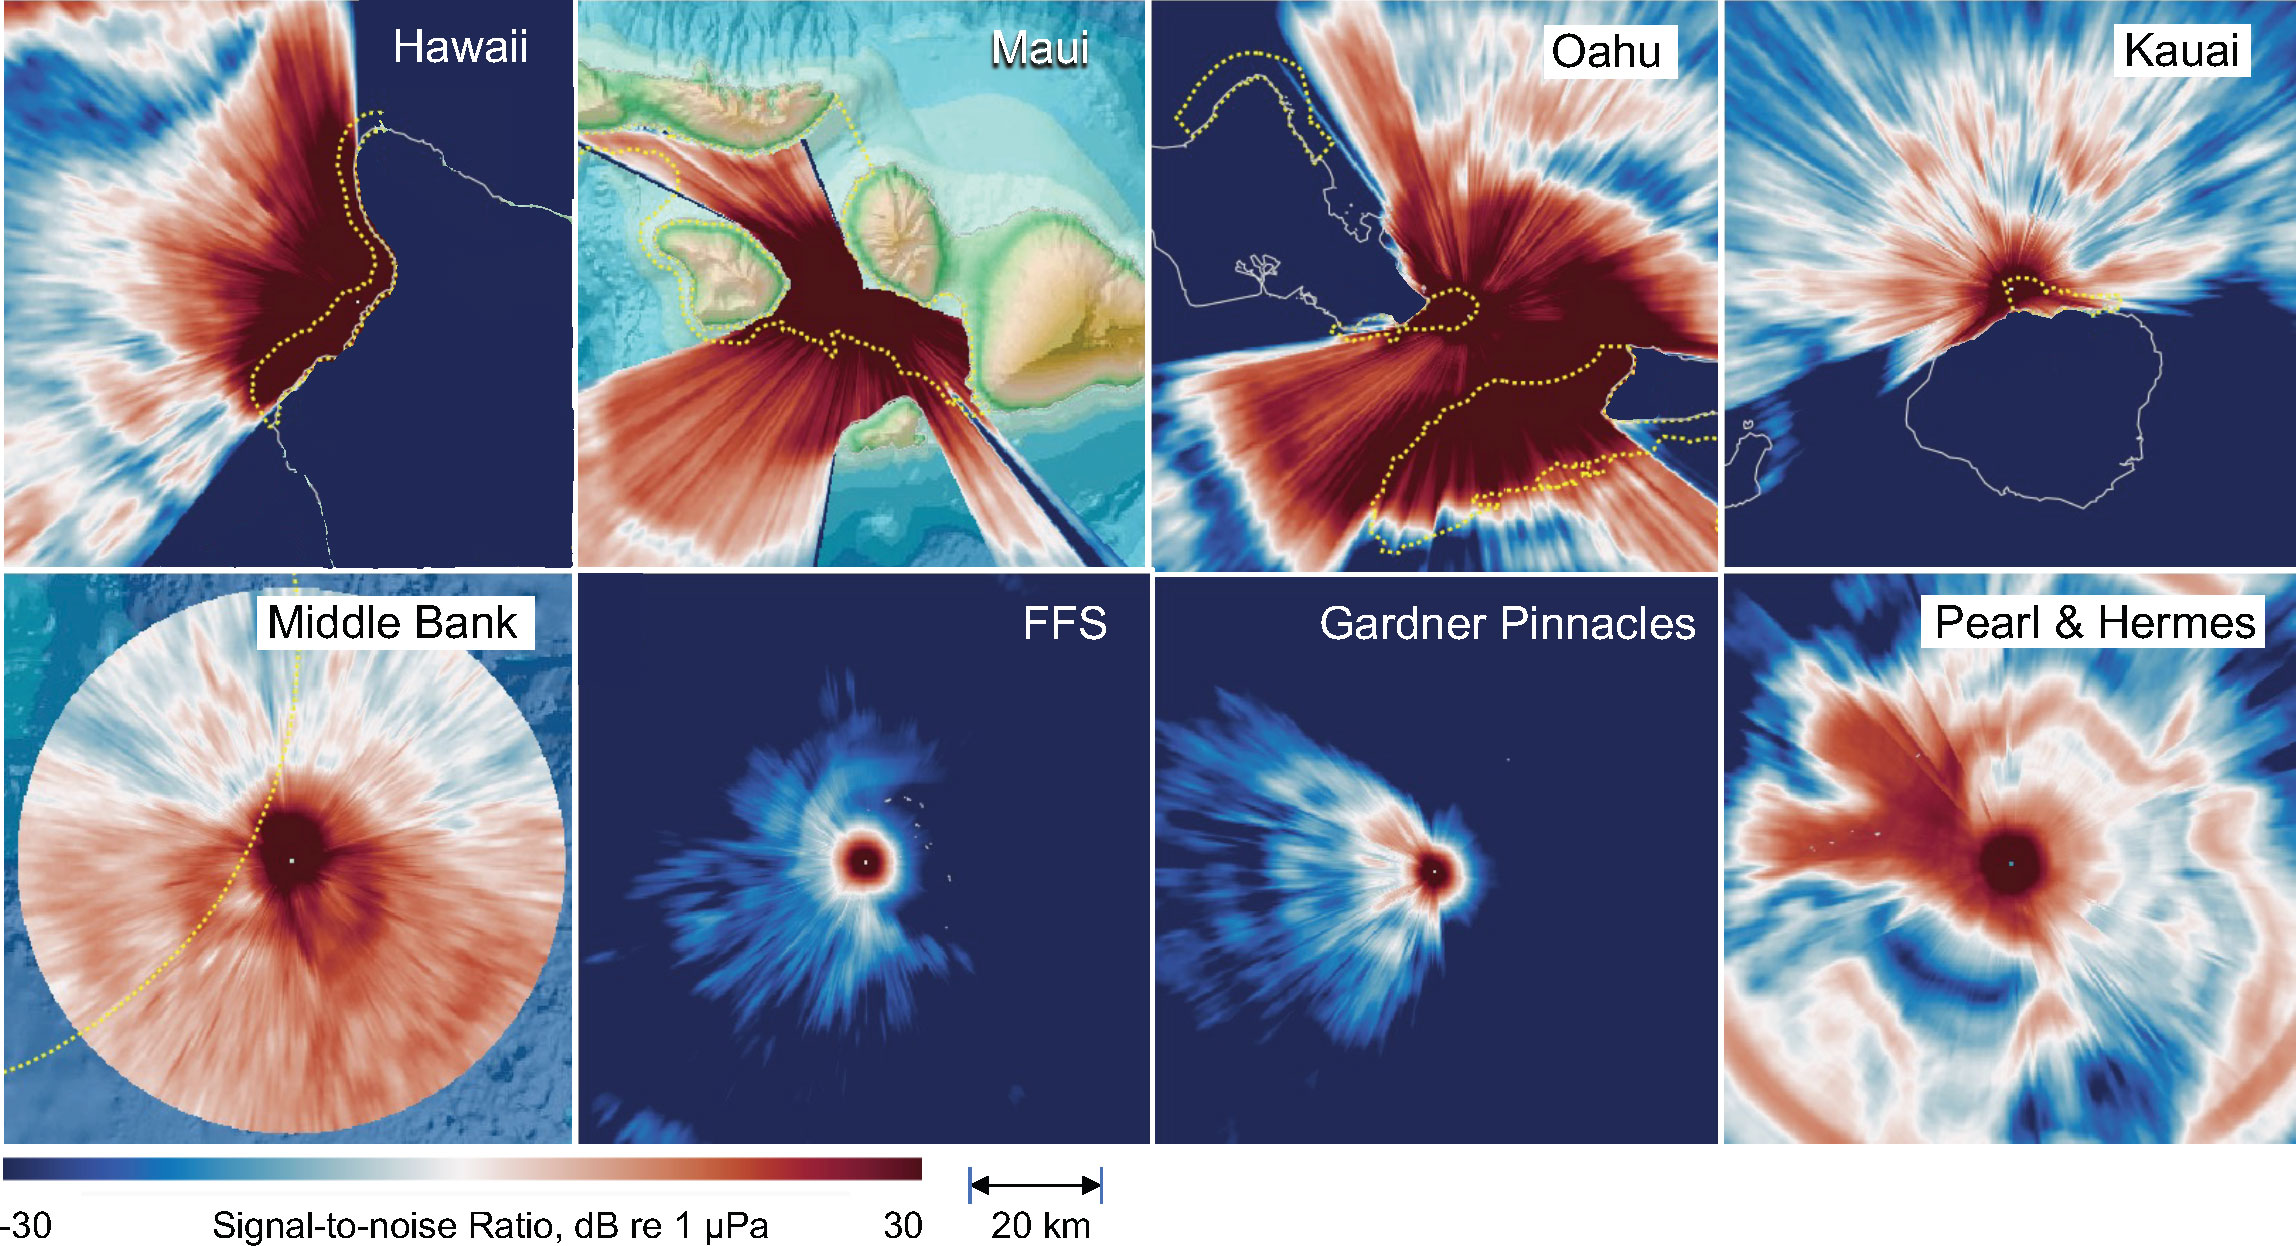
Figure 8 Sound propagation modeling results for the eight fixed mooring sites shown as the ratio of transmitted signal relative to wind induced sound level (signal-to-noise ratio), as a function of distance and bearing to the recording site. The yellow dashed lines indicate boundaries of National Marine Sanctuaries.
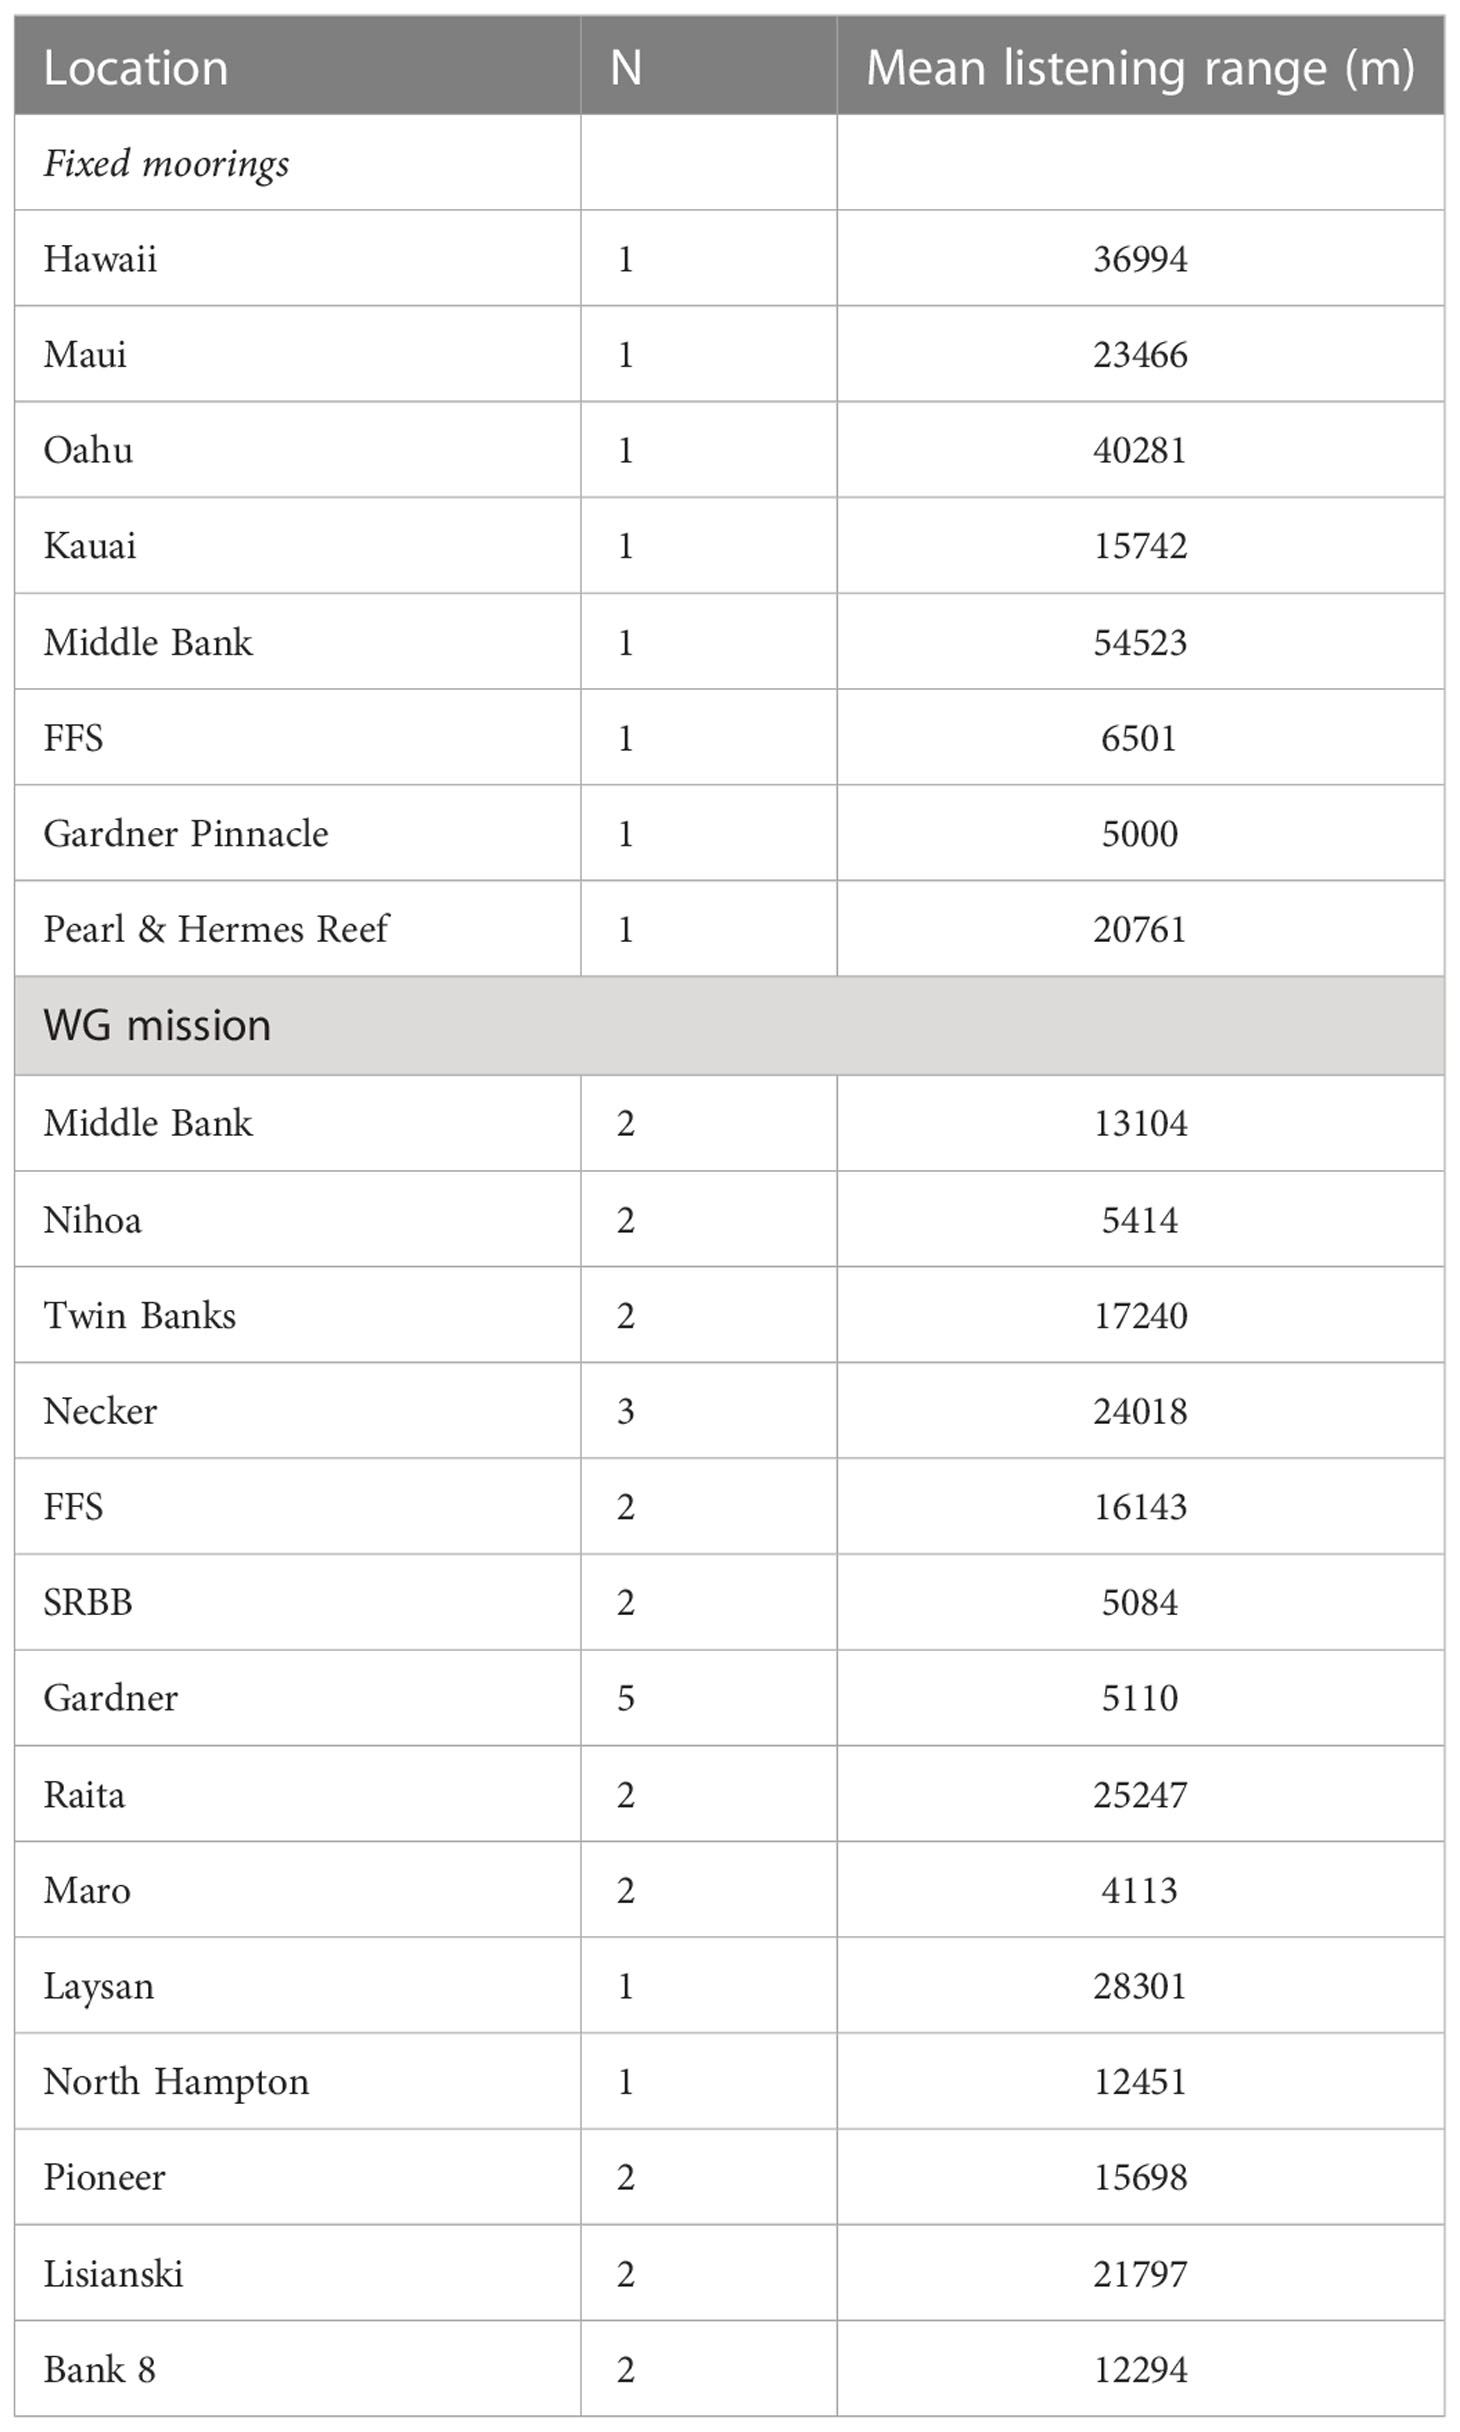
Table 2 Calculated listening ranges from propagation modeling results for the 8 fixed mooring locations and for 30 positions along the WG’s path grouped and averaged by location.
4 Discussion
The results presented provide an archipelagic-wide perspective on humpback whale presence in Hawaii, at least to the extent that this is reflected by the occurrence of song. Of course, although an absence of song does not necessarily constitute a true absence at the individual whale level, this effort was concerned with whale aggregations, which during the fall, winter and spring months are characterized by the presence of singing, regardless of location (Clapham and Mattila, 1990; Au et al., 2000; Lammers et al., 2011; Magnúsdóttir et al., 2014). The results of this work affirm earlier observations that the banks, shoals, and seamounts of PMNM are occupied by humpback whales during the winter breeding season (Johnston et al., 2007; Lammers et al., 2011) and likely represent an important portion of their Hawaiian breeding grounds. In addition, these data provide new insights on the extent to which this remote part of the Hawaiian archipelago is being exploited by humpback whales. The abundance of whale song chorusing, measured by the SPL in the 200-1000 Hz band, has been demonstrated to reliably track overall whale abundance in other parts of the archipelago (Kügler et al., 2021). Although comparisons of absolute chorusing levels among locations must be made cautiously due to variations in sound propagation, certain trends can be inferred.
The highest and most sustained seasonal chorusing levels were measured off Maui, suggesting that the Maui Nui region (Maui, Molokai, Lānai and Kaho’olawe) continues to represent the central core of the whale population visiting at least the MHI, if not the entire archipelago. This is consistent with earlier results from aerial surveys (Mobley et al., 1999; Mobley et al., 2001). In PMNM, humpback chorusing levels were greater at FFS than at both Kauai and Oahu during peak season months, despite more favorable acoustic propagation conditions at the latter locations, which suggests a comparatively higher presence of whales at FFS. In addition, late season chorusing levels were higher at Middle Bank and FFS than at any of the MHI locations (no data were available for Maui), indicating that the timing of departure of whales from PMNM to their high latitude feeding grounds may be different than in the MHI. Alternatively, it may indicate a general late-season shift towards the northwest by whales, which has been proposed previously (Baker and Herman, 1981; Mate et al., 1998). Finally, the comparatively low detections of song and low chorusing levels observed at PHR, despite favorable sound propagation conditions there, suggest that whale presence is relatively low at the far northwestern end of the archipelago. The sporadic pattern of whale song detections throughout the breeding season at PHR may represent whales passing by the western-most atolls (Kure, Midway, PHR) on their migration to and from locations further to the southeast. This is consistent with findings from Johnston et al. (2007) who modeled the preferred humpback whale habitat available in the NWHI and concluded that water temperatures at these western-most atolls were likely too cool for wintering humpback whales.
The data obtained from the WG mission provide further insights into how widespread humpback whale occurrence is in PMNM. Humpback whale song was detected at nearly every bank, shoal or seamount visited by the WG, albeit in varying amounts. Middle Bank had the highest incidence of whale song detected on the mission but was also the location that received the greatest survey effort due to the well-charted bathymetry there. As the WG progressed further to the northwest, song prevalence persisted, but gradually decreased. Although a minimum was observed at Twin Banks, that is partly because the WG transited too far away for many of the detections made near those banks to be included under the maximum distance criteria applied (<3.7 km from the 200 m isobath). Progressively fewer detections occurred as the WG traveled west of Mokumanamana, reaching a global minimum in detections at Gardner Pinnacles. The relative absence of whale song at Gardner Pinnacles is noteworthy, considering the large amount of preferred shallow water habitat present there. Adding to the mystery is the substantial increase in song prevalence further to the northwest between Raita Bank and Northampton Seamounts. The comparatively small listening range modeled for Gardner Pinnacles may have affected the detectability of whale song there. However, given that neither noise SPL in the 200-1000 Hz band nor variation in sound propagation were found to be predictive of the abundance of whale song observed among locations, and that Gardner Pinnacles’ modeled listening range was equivalent to those of Nihoa, Maro, and SRBB, which all had higher prevalence of whale song, it is unlikely that song was abundant but not detected at Gardner Pinnacles.
Modeling results confirmed the preference of humpback whales for waters less than 200 m deep previously documented in the MHI (Herman and Antinoja, 1977; Herman et al., 1980; Baker & Herman, 1981), but interestingly also revealed that the area of available shallow water habitat was not predictive of whale song prevalence. In other words, more shallow water habitat did not necessarily correspond with increased whale presence. In addition, there was a trend towards decreasing whale song occurrence with increasing distance from the MHI. However, this was not uniform throughout PMNM, and the model revealed significant variation of humpback whale song occurrence, with lower than anticipated occurrence near Gardner Pinnacles and greater than anticipated occurrence near Northampton Seamounts and Laysan Island.
The song occurrence patterns revealed by the WG mission suggest that there may be more structure in the distribution of whales in PMNM than previously known and hints at a bimodal distribution across the archipelago. Assuming that song prevalence is reliable as a proxy of whale abundance, a portion of the PMNM population appears to be skewed towards the MHI to the southeast while another portion is centered further to the northwest on the banks and seamounts between Raita Bank and Lisianski Island. The conspicuously low occurrence of whale song at Gardner Pinnacles, despite the availability of shallow water habitat there, is puzzling and could either represent a breakpoint between two subpopulations or perhaps indicate that conditions at Gardner Pinnacles are simply not ideal for wintering whales and so the area is largely avoided. Alternatively, the low song prevalence could simply be an artifact of inter-annual variability in whale distribution patterns.
Both the breadth and pattern of humpback whale occurrence across the 2600 km of the Hawaiian archipelago raise an important question: Are all the whales part of the same breeding population or do two or more subpopulations utilize the archipelago? After all, this distance is roughly equivalent to the separation between the breeding grounds of the Mexican and Central American DPSs (NOAA, 2016). Moreover, recent findings by Martínez-Loustalot et al. (2022) have revealed that whales from southern Mexico in fact belong to the Central American DPS, bringing these two breeding populations in even closer proximity than previously known. Although the data obtained here cannot determine whether multiple subpopulations utilize the Hawaiian archipelago, they do provide an impetus for examining this question in more detail through follow-on efforts to determine the identity of whales occurring across PMNM. If multiple subpopulations do occur in the archipelago, their correspondence to one or more of the four recognized north Pacific DPSs (NOAA, 2016) should be established for management purposes.
Part of the original motivation for more closely examining humpback whale occurrence in PMNM was to determine whether past fluctuations in whale abundance observed in the MHI could be explained through a temporary redistribution of whales further to the northwest of the archipelago. The data presented here cannot determine whether this in fact occurred, but the evidence suggests that it is certainly possible. This has implications for the years and decades to come, which will likely see whales responding to the pressures brought on by climate change (Learmonth et al., 2006, Frankel et al., 2022, von Hammerstein et al., 2022), including a potential pole-ward shift in distribution (Hastings et al., 2020). If such a shift takes place, the vast amount of available wintering habitat found in PMNM (Johnston et al., 2007) could lead to a northwestward drift in the core concentration of the Hawaii DPS.
In conclusion, nearly the entire Hawaiian archipelago is utilized by humpback whales during the winter and early spring months. This is a dramatic change from the late 1970s when Herman (1979) concluded that humpback whales did not use the NWHI. Clearly, the situation is very different today than it was 40+ years ago when the north Pacific humpback whale population was much smaller. It appears that today the NWHI provide highly suitable habitat for humpback whales, as well as protections from anthropogenic stressors (e.g. vessel noise, collisions, etc.) resulting from PMNM’s remoteness and restricted access. This is important when considering that the designation and management of the Hawaii DPS has to date occurred without any significant effort to count or sample whales beyond the MHI as part of abundance estimates or investigations of population structure. Based on the results presented here, continuing to do so moving forward is likely to provide an incomplete assessment for managing humpback whales in the region. Thus, continued work to better understand the changing patterns of humpback whale distribution across the Hawaiian archipelago is recommended.
Data availability statement
The datasets presented in this study can be found in online repositories. The names of the repository/repositories and accession number(s) can be found below: NOAA’s National Centers for Environmental Information at https://www.ncei.noaa.gov/maps/passive_acoustic_data/ and the SanctSound data portal at https://sanctsound.portal.axds.co/.
Ethics statement
Ethical review and approval were not required for the animal study because no experimental studies or direct interactions with any vertebrate species were conducted. All data are purely observational.
Author contributions
ML, JM, and LH created the concept and design of the reported work. EZ, AK, and KM processed acoustic data and/or participated in data collection. BG organized and led the WG mission to PMNM and drafted text about the WG. MH developed and adapted the machine learning model to the data obtained. AK applied the machine learning model and developed the GAM. ML analyzed data and conducted statistical tests. TM performed the sound propagation modeling. ML and AK wrote the manuscript and all authors provided critical feedback, and helped shape the research, analysis, and/or manuscript. All authors contributed to the article and approved the submitted version.
Funding
This work was part of the SanctSound project, which was a collaboration between NOAA and the U.S. Navy to better understand underwater sound within the National Marine Sanctuary System. The WG mission was funded through a contract (N3943019C2169) awarded to Jupiter Research Foundation. AK’s analytical efforts were funded through a memorandum of agreement (MOA-2018-109/11674) between NOAA and the University of Hawaii.
Acknowledgments
The authors are grateful for the support and assistance that were provided by Danielle Kitchen, Anu Kumar and Mandy Shoemaker (US Navy), Lauren Harrell (Google), Ed Lyman, Erin Oleson, Ted Guppenhoff, Randall Kosaki, Jason Leonard, Sarah Wood (NOAA), Adam Taufmann, Murray Taylor (Jupiter Research Foundation), Pepe Conley, Kimberly Jeffries and Mark Mohler. The authors are also grateful for the contributions of Jonathan Littenberg and the crew of the Searcher. The scientific results and conclusions, as well as any views or opinions expressed herein, are those of the author(s) and do not necessarily reflect the views of NOAA or the Department of Commerce. This publication does not constitute an endorsement of any commercial product or intend to be an opinion beyond scientific or other results obtained by NOAA.
Conflict of interest
The authors declare that the research was conducted in the absence of any commercial or financial relationships that could be construed as a potential conflict of interest.
Publisher’s note
All claims expressed in this article are solely those of the authors and do not necessarily represent those of their affiliated organizations, or those of the publisher, the editors and the reviewers. Any product that may be evaluated in this article, or claim that may be made by its manufacturer, is not guaranteed or endorsed by the publisher.
Supplementary material
The Supplementary Material for this article can be found online at: https://www.frontiersin.org/articles/10.3389/fmars.2023.1083583/full#supplementary-material
Supplementary Figure 1–3 | Sound propagation modeling results for 30 locations along the WG’s path shown as the ratio of transmitted signal relative to wind induced sound level (signal-to-noise ratio), as a function of distance and bearing to the WG’s position. The map shows the WG’s path with the approximate locations where transmission loss (TL) models were calculated represented as red dots. The numbers near each location correspond to the 30 TL models shown below the map.
References
Allen A. N., Harvey M., Harrell L., Jansen A., Merkens K. P., Wall C. C., et al. (2021). A convolutional neural network for automated detection of humpback whale song in a diverse, long-term passive acoustic dataset. Front. Mar. Sci. 8, 607321. doi: 10.3389/fmars.2021.607321
Au W. W. L., Green M. (2000). Acoustic interaction of humpback whales and whale-watching boats. Mar. Environ. Res. 49, 469–481. doi: 10.1016/S0141-1136(99)00086-0
Au W. W. L., Mobley J. R., Burgess W. C., Lammers M. O. (2000). Seasonal and diurnal trends of chorusing humpback whales wintering in waters off Western Maui. Mar. Mammal Sci. 16, 530–544. doi: 10.1111/j.1748-7692.2000.tb00949.x
Au W. W. L., Pack A. A., Lammers M. O., Herman L. M., Deakos M., Andrews K. (2006). Acoustic properties of humpback whale song. J. Acoustical Soc. America 120, 1103–1110. doi: 10.1121/1.2211547
Baker C. S., Herman L. M. (1981). Migration and local movement of humpback whales (Megaptera novaeangliae) through Hawaiian waters. Can. J. Zool 59, 460–469. doi: 10.1139/z81-067
Baker C. S., Herman L. M., Perry A., Lawton W. S., Straley J. M., Wolman A. A., et al. (1986). Migratory movement and population structure of humpback whales Megaptera novaeangliae in the central and eastern north pacific. Mar. Ecol. Prog. Ser. 31, 105–119. doi: 10.3354/meps031105
Calambokidis J., Falcone E. A., Quinn Ii T. J., Burdin A. M., Clapham P. J., Ford J. K. B., et al. (2008). SPLASH: Structure of populations, levels of abundance and status of humpback whales in the north pacific. final report for contract AB133F-03-RP-00078, to U.S (Seattle, WA: Department of Commerce Western Administrative Center).
Cartwright R., Venema A., Hernandez V., Wyels C., Cesere J., Cesere D. (2019). Fluctuating reproductive rates in Hawaii's humpback whales, Megaptera novaeangliae, reflect recent climate anomalies in the North Pacific. Royal Society Open Science 6(3), 181463. doi: 10.1098/rsos.181463
Cholewiak D. M., Cerchio S., Jacobsen J. K., Urban-R. J., Clark C. W. (2018). Songbird dynamics under the sea: acoustic interactions between humpback whales suggest song mediates male interactions. R. Soc. Open Sci. 5, 171298. doi: 10.1098/rsos.171298
Clapham P. J., Mattila D. K. (1990). Humpback whale songs as indicators of migration routes. Mar. Mammal Sci. 6, 155–160. doi: 10.1111/j.1748-7692.1990.tb00238.x
Clapham P. J., Mead J. G. (1999). Megaptera novaeangliae. Mammal Species 604, 1–9. doi: 10.2307/3504352
Collins M. D. (1993). A split-step padé solution for the parabolic equation method. J. Acoustical Soc. America 93, 1736. doi: 10.1121/1.406739
Colosi J. A. (2016). Sound propagation through the stochastic ocean (NY: Cambridge University Press).
Darling J. D., Goodwin B., Goodoni M. K., Taufmann A. J., Taylor M. G. (2019). Humpback whale calls detected in tropical ocean basin between known Mexico and Hawaii breeding assemblies. J. Acoustical Soc. America 145, EL534–EL540. doi: 10.1121/1.5111970
Darling J. D., Goodwin B., Taufmann A. J., Taylor M. G. (2020). Humpback whales (Megaptera novaeangliae) detected by autonomous wave glider in tropical deep seas between Hawaii and Western pacific winter assemblies. Mar. Mammal Sci. 2020, 1–8.
Darling J. D., Jones M. E., Nicklin C. P. (2006). Humpback whale songs: Do they organize males during the breeding season? Behaviour 143, 1051–1101. doi: 10.1163/156853906778607381
Dawbin W. H. (1966). “The seasonal migratory cycle of humpback whales,” in Whales, dolphins and porpoises. Ed. Norris K. R. (Berkeley, CA: University of California Press), 145–170.
Ersts P. J., Rosenbaum H. C. (2003). Habitat preference reflects social organization of humpback whales (Megaptera novaeangliae) on a wintering ground. J. Zool 260, 337–345. doi: 10.1017/S0952836903003807
Frankel A. S., Gabriele C. M., Yin S., Rickards S. H. (2022). Humpback whale abundance in Hawai‘i: Temporal trends and response to climatic drivers. Marine Mammal Science 38(1), 118–138. doi: 10.1111/mms.12856
Goodoni M., Goodwin B., Kiesow K. (2018). “New era of humpback whale research using wave glider SV3 to search for whale song,” Sea Technology 2018, 16–19. Available at: https://lscpagepro.mydigitalpublication.com/publication/?m=60787&i=603289&p=16&ver=html5
Hastings R. A., Rutterford L. A., Freer J. J., Collins R. A., Simpson S. D., Genner M. J. (2020). Climate change drives poleward increases and equatorward declines in marine species. Curr. Biol. 30, 1572–1577. doi: 10.1016/j.cub.2020.02.043
Herman L. M. (1979). Humpback whales in Hawaiian waters: a study in historical ecology. Pacific Sci. 33, 1–15.
Herman L. M. (2017). The multiple functions of male song within the humpback whale (Megaptera novaeangliae) mating system: review, evaluation, and synthesis. Biol. Rev. Cambridge Philos. Soc. 92, 1795–1818. doi: 10.1111/brv.12309
Herman L. M., Antinoja R. C. (1977). Humpback whales in the Hawaiian breeding waters: population and pod characteristics. Sci. Rep. Whales Res. Institute 29, 59–85.
Herman L. M., Hancock J. M., Forestell P. H., Antinoja R. C. (1980). “The 1976/77 migration of humpback whales into Hawaiian waters: composite description,” in Marine mammal commission report MMC-77/19 (Washington, DC: Marine Mammal Commission).
Johnson J. H., Wolman A. A. (1984). The humpback whale, Megaptera novaeangliae. Mar. Fisheries Rev. 46, 30–37.
Johnston D. W., Chapla M. E., Williams L. E., Mattila D. K. (2007). Identification of humpback whale megaptera novaeangliae wintering habitat in the northwestern Hawaiian islands using spatial habitat modeling. Endangered Species Res. 3, 249–257. doi: 10.3354/esr00049
Kügler A., Lammers M. O., Zang E. J., Kaplan M. B., Mooney T. A. (2020). Fluctuations in hawaii’s humpback whale Megaptera novaeangliae population inferred from male song chorusing off Maui. Endangered Species Res. 43, 421–434. doi: 10.3354/esr01080
Kügler A., Lammers M. O., Zang E. J., Pack A. (2021). Male Humpback whale chorusing in Hawaii and its relationship with whale abundance and density. Front. Mar. Sci. 8, 735664. doi: 10.3389/fmars.2021.735664
Lammers M. O., Fisher-Pool P. I., Au W. W. L., Meyer C. G., Wong K. B., Brainard R. E. (2011). Humpback whale Megaptera novaeangliae song reveals wintering activity in the northwestern Hawaiian islands. Mar. Ecol. Prog. Ser. 423, 261–268. doi: 10.3354/meps08959
Learmonth J. A., MacLeod C. D., Santos M. B., Pierce G. J., Crick H. Q. P., Robinson R. A. (2006). Potential effects of climate change on marine mammals. Oceanogr Mar. Biol. 44, 431. doi: 10.1201/9781420006391.ch8
Magnúsdóttir E. E., Rasmussen M. H., Lammers M. O., Svavarsson J. (2014). Humpback whale songs during winter in subarctic waters. Polar Biol. 37, 427–433. doi: 10.1007/s00300-014-1448-3
Margolina T., Joseph J. E., Southall B. L. (2018). “BRS sound exposure modeling tool: A system for planning, visualization and analysis,” in OCEANS 2018 MTS/IEEE Charleston, Charleston, SC, USA. 1–4. doi: 10.1109/OCEANS.2018.8604911
Martínez-Loustalot P., Audley K., Cheeseman T., De Weerdt J., Frisch-Jordán A., Guzón O., et al. (2022). Towards the definition of the humpback whale population units along the Mexican and central American coasts in the pacific ocean. Mar. Mammal Sci. 1, 16. doi: 10.1111/mms.12980
Mate B. R., Gisiner R., Mobley J. (1998). Local and migratory movements of Hawaiian humpback whales tracked by satellite telemetry. Can. J. Zool 76, 863–868. doi: 10.1139/z98-008
Merchant N. D., Fristrup K. M., Johnson M. P., Tyack P. L., Witt M. J., Blondel P., et al. (2015). Measuring acoustic habitats. Methods Ecol. Evol. 6 (3), 257–265. doi: 10.1111/2041-210X.12330
Mobley J. R. Jr., Bauer G. B., Herman L. M. (1999). Changes over a ten-year interval in the distribution and relative abundance of humpback whales (Megaptera novaeangliae) wintering in Hawaiian waters. Aquat. Mammals 25, 63–72.
Mobley J. R., Spitz S., Grotefendt R., Forestell P., Frankel A., Bauer G. (2001). “Abundance of humpback whales in Hawaiian waters: results of 1993–2000 aerial surveys,” in Report to the Hawaiian islands humpback whale national marine sanctuary (Honolulu, HI: Marine Mammal Research Consultants).
NOAA (2016). “Endangered and threatened species; identification of 14 distinct population segments of the humpback whale (Megaptera novaeangliae) and revision of species-wide listing,” in Federal register, 81, 62259–62320.
NOAA (2019). Trends in humpback whale (Megaptera novaeangliae) abundance, distribution, and health in Hawaii and Alaska: Report from a meeting held on November 27-28, 2019. NOAA National Ocean Service, Office of National Marine Sanctuaries, Hawaiian Islands Humpback Whale National Marine Sanctuary and NOAA National Marine Fisheries Service, Pacific Islands Regional Office, Protected Resources Division.
Noad M. J., Dunlop R. A., Mack A. K. (2017). Changes in humpback whale singing behavior with abundance: implications for the development of acoustic surveys of cetaceans. J. Acoustical Soc. America 142, 1611. doi: 10.1121/1.5001502
Pante E., Simon-Bouhet B. (2013). Marmap: A package for importing, plotting and analyzing bathymetric and topographic data in r. PloS One 8, e73051. doi: 10.1371/journal.pone.0073051
R Core Team (2016). R: A language and environment for statistical computing [Online] (Vienna, Austria: R Foundation for Statistical Computing). Available at: https://www.R-project.org/.
Rice D. W. (1978). “The humpback whale in the north pacific: distribution, exploitation, and numbers, appendix 4,” in Report on a workshop on problems related to humpback whales (Megaptera novaeangliae) in Hawaii. Eds. Norris K. S., Reeves R. R. (Springfield, VA: US Department of Commerce), 29–44.
Seger K. D., Thode A. M., Urban R. J., Martinez-Loustalot P., Jimenez-Lopez M. E., Lopez-Arzate D. (2016). Humpback whale-generated ambient noise levels provide insight into singers’ spatial densities. J. Acoustical Soc. America 140 (3), 1581. doi: 10.1121/1.4962217
von Hammerstein H., Setter R. O., van Aswegen M., Currie J. J., Stack S. H. (2022). High-resolution projections of global sea surface temperatures reveal critical warming in humpback whale breeding grounds. Frontiers in Marine Science, 9. doi: 10.3389/fmars.2022.837772
Wang Y., Getreuer P., Hughes T., Lyon R. F., Saurous R. A. (2017). “Trainable frontend for robust and far-field keyword spotting,” in Proceedings of the 2016 IEEE International Conference on Acoustics, Speech and Signal Processing (ICASSP), New Orleans, LA. 5670–5674.
Whitehead H., Moore M. J. (1982). Distribution and movements of West Indian humpback whales in winter. Can. J. Zool 60, 2203–2211. doi: 10.1139/z82-282
Wiggins S. M., Hildebrand J. A. (2007). “High-frequency acoustic recording package (HARP) for broad-band, long-term marine mammal monitoring,” in Proceedings of the 2007 Symposium on Underwater Technology and Workshop on Scientific Use of Submarine Cables and Related Technologies, Tokyo: IEEE. 551–557.
Wiggins S. M., Roch M. A., Hildebrand J. A. (2010). TRITON software package: analyzing large passive acoustic monitoring data sets using MATLAB. J. Acoustical Soc. Americ 128, 2299. doi: 10.1121/1.3508074
Keywords: humpback whale, acoustic monitoring, wave glider, Hawaiian archipelago, NWHI
Citation: Lammers MO, Goodwin B, Kügler A, Zang EJ, Harvey M, Margolina T, Martinez JA, Merkens K and Hatch LT (2023) The occurrence of humpback whales across the Hawaiian archipelago revealed by fixed and mobile acoustic monitoring. Front. Mar. Sci. 10:1083583. doi: 10.3389/fmars.2023.1083583
Received: 29 October 2022; Accepted: 06 January 2023;
Published: 26 January 2023.
Edited by:
Rebecca Dunlop, The University of Queensland, AustraliaReviewed by:
Ana Sofia Aniceto, Norwegian University of Science and Technology, NorwayDaniela Silvia Pace, Sapienza University of Rome, Italy
Lisa Munger, University of Oregon, United States
Copyright © 2023 Lammers, Goodwin, Kügler, Zang, Harvey, Margolina, Martinez, Merkens and Hatch. This is an open-access article distributed under the terms of the Creative Commons Attribution License (CC BY). The use, distribution or reproduction in other forums is permitted, provided the original author(s) and the copyright owner(s) are credited and that the original publication in this journal is cited, in accordance with accepted academic practice. No use, distribution or reproduction is permitted which does not comply with these terms.
*Correspondence: Marc O. Lammers, marc.lammers@noaa.gov
†Present address: Anke Kügler, Bioacoustics and Behavioral Ecology Lab, Syracuse University, Syracuse, NY, United States
Jonathan A. Martinez, USFWS, Fish and Aquatic Conservation, Albuquerque, NM, United States