 Brian L. Robinette

- Integrated Systems Toxicology Division, National Health and Environmental Effects Research Laboratory, Office of Research and Development, US Environmental Protection Agency, Research Triangle Park, NC, USA
Because the Developmental Neurotoxicity Testing Guidelines require large numbers of animals and is expensive, development of in vitro approaches to screen chemicals for potential developmental neurotoxicity is a high priority. Many proposed approaches for screening are biochemical or morphological, and do not assess function of neuronal networks. In this study, microelectrode arrays (MEAs) were used to determine if chemical-induced changes in function could be detected by assessing the development of spontaneous network activity. MEAs record individual action potential spikes as well as groups of spikes (bursts) in neuronal networks, and activity can be assessed repeatedly over days in vitro (DIV). Primary cultures of rat cortical neurons were prepared on MEAs and spontaneous activity was assessed on DIV 2, 6, 9, 13, and 20 to determine the in vitro developmental profile of spontaneous spiking and bursting in cortical networks. In addition, 5 μM of the protein kinase C inhibitor bisindolylmaleamide-1 (Bis-1) was added to MEAs (n = 9–18) on DIV 5 to determine if changes in spontaneous activity could be detected in response to inhibition of neurite outgrowth. A clear profile of in vitro activity development occurred in control MEAs, with the number of active channels increasing from 0/MEA on DIV 2 to 37 ± 5/MEA by DIV 13; the rate of increase was most rapid between DIV 6 and 9, and activity declined by DIV 20. A similar pattern was observed for the number of bursting channels, as well as the total number of bursts. Bis-1 decreased the number of active channels/MEA and the number of bursting channels/MEA. Burst characteristics, such as burst duration and the number of spikes in a burst, were unchanged by Bis-1. These results demonstrate that MEAs can be used to assess the development of functional neuronal networks in vitro, as well as chemical-induced dysfunction.
Introduction
The potential for chemicals to harm the developing nervous system is a significant public concern (US EPA, 1998a; Grandjean and Landrigan, 2006) and a challenging problem for hazard characterization. While guidelines for determining the potential for chemicals to cause developmental neurotoxicity do exist (US EPA, 1998b; OECD, 2007), these in vivo studies are costly to conduct, require large numbers of animals, and take up to 2 years to complete. These limitations have prevented testing of large numbers of chemicals to determine their potential to cause developmental neurotoxicity. As such, efforts have begun to develop high-throughput and/or high-content screening (HTS/HCS) approaches to assess the potential developmental neurotoxicity hazard associated with large numbers of chemicals and prioritize them for additional testing (Coecke et al., 2007; Lein et al., 2007). These efforts include screening assays for important developmental processes such as gene expression (Hill et al., 2008; Hogberg et al., 2009) proliferation (Breier et al., 2008), differentiation, neurite outgrowth (Radio and Mundy, 2008; Radio et al., 2008), and synaptogenesis (Harrill et al., 2011). Perturbation of these processes by environmental chemicals might result in developmental neurotoxicity. Compounds testing positive in such a battery would then be tested in additional “second tier” approaches. Although the proposed list of endpoints does include evaluation of a number of critical neurodevelopmental processes, these assays are based on biochemical and morphological endpoints as opposed to functional endpoints. Thus, important functional aspects of nervous system development are not addressed including synaptic function, action potential generation and propagation, plasticity, and network formation and function.
Microelectrode array (MEA) recording techniques provide spatial and temporal recordings of electrical activity from excitable tissues in vivo or in vitro. In vitro, MEA recordings do not disrupt cellular integrity, and this makes possible repeated recordings from the same cell network over long periods of time (Potter and DeMarse, 2001). When spontaneous electrical activity of primary cultures of cortical neurons is measured repeatedly over days in vitro (DIV), a clear ontogeny of activity is observed (van Pelt et al., 2005; Wagenaar et al., 2006). Neurons grown on MEAs faithfully recapitulate many functions of neurons in vivo, including spontaneous activity (spiking and bursting), plasticity, and responsiveness to a wide variety of neurotransmitters and pharmacological agonists and antagonists (Gross et al., 1997; Potter, 2001; Marom and Shahaf, 2002; van Pelt et al., 2005; Pasquale et al., 2008). MEAs have also been widely utilized to characterize the actions of drugs and chemicals on network activity in vitro, and the throughput of this technology is rapidly increasing (for review, see Johnstone et al., 2010). Thus, in vitro cultures of neurons grown on MEAs could provide a functional endpoint to assess the potential for chemicals to cause developmental neurotoxicity. As proof-of-principle, the ability of the protein kinase C (PKC) inhibitor bisindolylmaleimide (Bis-1) to affect the development of spontaneous activity in cortical networks from rat neonates was assessed using MEAs. Because Bis-1 has been demonstrated to decrease neurite outgrowth in primary neurons and neuronal cell lines in vitro (Nakanishi et al., 2006; Radio et al., 2008) we hypothesized that there would be a corresponding decrease in functional connectivity following Bis-1 exposure. The results demonstrate that MEAs can detect functional changes following exposure to chemicals over critical periods of in vitro development and may be useful as part of a battery of tests for developmental neurotoxicity.
Materials and Methods
Materials
Mouse anti-βIII-tubulin antibody was purchased from Thermo Fisher Scientific, Inc. (Waltham, MA, USA) as part of a Cellomics® Neurite Outgrowth HitKit. Bisbenzamide H 33258 fluorochrome (Hoechst stain) was purchased from Calbiochem, Inc. (San Deigo, CA, USA). DyLight® 488-conjugated goat anti-mouse IgG secondary antibody was purchased from Millipore, Inc. (Billerica, MA, USA). Bisindolylmaleamide-1 (Bis-1) was obtained from Calbiochem, had a purity of 95%, and was dissolved in DMSO as described below.
Neurite Outgrowth Assay
All animal protocols were reviewed and approved by the NHEERL Institutional Animal Care and Use Committee and complied with all required animal use guidelines. Cortical cells were cultured at a concentration of 20,000 cells/well (6.7 × 10⁴ cells/cm2) in CoStar® 96-well polystyrene cell culture plates (Corning Inc., Corning, NY, USA) coated with poly-L-lysine. Cultures were exposed to varying concentrations of Bis-1 (0.1, 0.3, 1, 3, 10 μM) at 2 h after plating as described in Harrill et al. (2010). The final concentration of DMSO in control and Bis-1 treated wells was 0.1%, which had no significant effects on measurements of neurite outgrowth (data not shown).
At 24 h after plating cells were fixed and immunolabeled for βIII-tubulin as described in Harrill et al. (2010), with modifications. Briefly, cultures were fixed in situ and immunolabeled with mouse anti-βIII-tubulin primary and DyLight® 488-conjugated goat anti-mouse IgG secondary antibodies at dilutions of 1:800 and 1:500, respectively, in immunocytochemical staining buffer. Immunolabeled cultures were sealed and stored at 4°C prior to image acquisition.
For automated measurements of neurite outgrowth plates were loaded into a Cellomics® ArrayScan® VTI HCS reader high-content imaging system. Neurite outgrowth was measured using an optimized Neuronal Profiling BioApplication protocol. Components of the ArrayScan® instrument and descriptions of optimization procedures and neurite outgrowth algorithm workflow are as described previously in Harrill et al. (2010). Briefly, the ArrayScan® Neuronal Profiling BioApplication protocol sampled multiple unique fields of view within each cell culture well and acquired matched fluorescent images of Hoechst labeled neuronal nuclei and βIII-tubulin/DyLight® 488 labeled neuronal cytoplasm for each field. Using an image analysis protocol optimized to untreated control wells a priori the BioApplication then identifies, gates and measures the morphological characteristics of fluorescently labeled neurons on a cell-by-cell basis. A sufficient number of fields were imaged to analyze data from at least 350 cells/well. Measurements from each cell were then averaged within each well to obtain population means for the morphological features of interest. In the present study, well level values for the average number of neurites per neuron and total neurite length per neuron were reported. In addition, the average number of neurons per field (i.e., neuron density) was reported as an indicator of cell health. Parameters for the optimized Neuronal Profiling protocol used in the present study are available from the authors upon request.
Cell Culture on MEAs
Briefly, cells were prepared from 0 to 1 day old Long-Evans rats. Rat pups were decapitated and the neocortex was carefully extracted from the brain and collected in Cortical buffer (127 mM NaCl, 5 mM KCl, 170 μM Na2HP04, 205 μM KH2PO4, 5 mM Glucose, 59 mM Sucrose, 100 U/mL Penicillin/Streptomycin, pH 7.4). Cells were dissociated using 25 mg/ml trypsin. After collection in growth medium (Dulbecco’s Modified Eagle’s Medium w/GlutaMax (Invitrogen) containing 1 M HEPES, 10% heat inactivated Horse Serum (Invitrogen), and 100 U/mL Penicillin/Streptomycin, pH 7.4) cells were filtered through a 100-μm nitex screen. Prior to plating of cells, MEAs (200/30ir-Ti with internal ground, Multichannel Systems, Reutlingen, Germany) were precoated with poly-l-lysine, and then on the day of culture, with laminin. MEAs were seeded with 2 × 10⁵ cells in a 50-μL “drop” directly over the electrode field. After placing cells on the MEA, 10–15 min was allowed for cell adhesion prior to the addition of 1 mL culture medium. On DIV 3 cytosine arabinoside (5 mM) was added, with a full media exchange. On DIV 5 cytosine arabinoside containing media was removed and replaced with media containing 0.1% DMSO (control MEAs) or 5 μM Bis-1. This media remained on the MEAs for the duration of the experiment without any further replacement.
MEA Recordings
Spontaneous network activity in cortical neurons grown on glass MEAs were recorded using equipment and software from Multi Channel Systems (Reutlingen, Germany). During recordings, MEAs were placed on a temperature controlled (37°C) MCS 1060BC preamplifier, and covered with a fluorinated ethylene–propylene membrane (ALA Scientific, Westbury, NY, USA) to stabilize osmolarity, maintain sterility and allow for repeated recordings from the same chip (Potter and DeMarse, 2001). The system hardware consisted of four MCS 1060BC preamplifiers that were interfaced to a PC via a MC_Card PCI board. MC_Rack (Version 3.6.8) software was used to collect spontaneous network activity data. Signals from the amplifier were digitized at a rate of 20 kHz and high-pass filtered (cutoff frequency of 200 Hz). A software-supplied spike detector was used to detect spontaneous events that exceeded a threshold of ±15 μV. All MEA recordings were conducted in culture medium without perfusion. Following experiments, MEA chips were re-used by rinsing thoroughly with deionized water, 1 min water sonication, treatment with 5% porcine pancreatin enzymes in 1× PBS buffer (Sigma) for 18 h, then rinsing again in deionized water and swabbing with a lint-free tissue to remove all cellular debris. MEAs were then sterilized by autoclave and 5–10 min UV light exposure.
Analysis of MEA Activity
On DIV 6, 9, 13, and 20, MEAs were placed into the preamplifiers and allowed to equilibrate for 10 min, after which activity was recorded from all (59) channels for a period of 10 min. From each recording, the number of “Active Channels” was determined by counting the number of channels on that day where 5 or more spikes/min were observed. Burst analysis was conducted using Neuroexplorer (Version 3.2, NEX Technologies, Littleton, MA, USA). A burst was defined as a minimum of 4 spikes lasting 0.02 s with 0.1 s between bursts having a maximum of 0.01 s interval to start burst and 0.075 s to end burst (recorded in 0.02 s bins).
Cytotoxicity Assessment
Cytotoxicity in control and Bis-1 treated MEAs was assessed on DIV 6 or 13 by propidium iodide staining of dead cells. On the day of the assay, media was removed and replaced with 1 ml of Lockes buffer containing (mM): NaCl (154), KCl (5.6), NaHCO3 (3.6), CaCl2 (2.0) D-glucose (10) HEPES (5.0), and 2 μM propidium iodide (stains DNA with a bright red fluorescence in cells with compromised plasma membranes). After a 20-min incubation period at room temperature, the center of each MEA was photographed with a digital camera attached to a Nikon TE 200 inverted epifluorescent microscope using a 20× objective. The number of propidium iodide-positive (red fluorescent) cells in each image was counted by an observer blind to the treatment. For each treatment, four images were scored from each of two different cultures, for a total of eight images per treatment at each timepoint.
Statistics
Neurite outgrowth data were collected across six plates derived from two independent cultures. All data were normalized within plate to the median value of 0.1% DMSO control wells and pooled across plates (n = 6 well/treatment group). For the control group, the median value from 0.1% DMSO treated wells within each plate was normalized the overall mean of the median values across plates to provide error estimates for the control and equivalent group sizes (n = 6 wells) for statistical analyses. Normalized neurite outgrowth data were analyzed using a One-way analysis of variance (ANOVA, p < 0.05) followed by a Dunnett’s many-to-one mean contrast test (p < 0.01, Dunnett, 1950). MEA data are presented as mean ± SE and each MEA is considered an independent observation. Data for the fraction of MEAs that had active or bursting channels were analyzed using a Fisher’s exact mean test, while MEA spiking and bursting data were analyzed using a two-way ANOVA with DIV and treatment (with or without Bis-1) as the two factors. Results were considered significant if p < 0.05. All analyses were performed using GraphPad Prism v5.
Results
Bis-1 is a PKC inhibitor that has been demonstrated to interfere with neurite outgrowth in a number of neuronal cell types. Bis-1 produced significant concentration-dependent decreases in the average number of neurites per neuron and total neurite length per neuron (Figure 1; p < 0.05, ANOVA) following 22 h of exposure. Total neurite length per neuron in control cultures was 86 ± 9.6 μm. This measure was significantly decreased at 1 μM (84.6 ± 7.6% of control), 3 μM (65.9 ± 4.3% of control), and 10 μM (51.7 ± 4.4% of control). The average number of neurites per neuron in control cultures was 1.9 ± 0.15. This measure was significantly decreased at 1 μM (85.6 ± 2.3% of control), 3 μM (69.6 ± 3.5% of control), and 10 μM (60.8 ± 4.8% of control). The concentrations of Bis-1 which affected this early phase of neurite outgrowth were comparable to those which affected synapse development activity in longer term studies (Harrill et al., 2011). Based on these data, a concentration of 5 μM Bis-1 was selected for studies with MEAs.

Figure 1. Bis-1 effects on neurite outgrowth. Cortical cells were plated at a concentration of 20,000 cells/well (6.7 × 10⁴ cells/cm2) and exposed to varying concentrations of Bis-1 at 2 h post-plating. Cells were fixed and immunolabeled with βIII-tubulin at 24 h. Bis-1 significantly decreased the average number of neurites per neuron (B) and total neurite length per neuron (C) (p < 0.05, ANOVA) with no significant effects on neuron density (A). Symbols above the data points denote that the response was significantly different from control values at p < 0.01 (**) or p < 0.001 (***) using Dunnett’s test. Representative fields showing control (D) and 10 μM Bis-1 treated cells (E). The experiment was repeated twice and data combined across 6 plates for statistical analyses (n = 6 total wells/treatment).
Activity on MEAs exhibited a clear developmental time-course (Figures 2 and 3, solid lines). Activity was completely absent on DIV 2, began to manifest on DIV 6, and increased rapidly between DIV 6 and 13. The number of channels with 5 or more spikes/min (“Active Channels”) increased to its maximum by DIV 9 and remained relatively constant until DIV 20 (Figure 3A, solid lines). A similar developmental profile was observed for the number of bursting channels (Figure 3B, solid lines). The total number of spikes and bursts observed also increased with time in culture. Two-way ANOVA indicated a significant effect of DIV on the number of Active Channels/MEA (p < 0.001), the number of bursting channels/MEA (p = 0.005), the number of spikes (p = 0.017), and the number of bursts (p = 0.01). Treatment of MEAs with 5 μM Bis-1 beginning on DIV 5 decreased spontaneous network activity on MEAs. The number of Active Channels/MEA (Figure 3A, dashed lines; p = 0.007) as well as the number of Bursting Channels/MEA (Figure 3B, dashed lines; p = 0.0014) were significantly decreased by Bis-1. On DIV 6 and 9, there were fewer Bis-1 treated MEAs that exhibited bursting channels compared to controls (Table 1) despite the fact that the fraction of MEAs with active channels was similar. However, the number of bursting channels was still significantly reduced by Bis-1 treatment (p = 0.036) even if those MEAs without bursting channels were removed from the analysis (Figure 2C). ANOVA also indicated a significant effect of Bis-1 treatment on the number of Active and Bursting Channels/MEA (Figures 3A, B, dashed lines), as well as the number of bursting channels when “non-bursting” MEAs were removed from the analysis (Figure 3C, dashed lines). There were no interactions observed between DIV and Bis-1 treatment for any measure. Further, the decreases in the number of bursts (Figure 3D, dashed lines) and number of spikes (Figure 3E, dashed lines) on DIV 6 and 9 in the presence of Bis-1 were not statistically different from control values. An example of the spontaneous activity in cortical cultures, in the form of a burst of action potentials, is shown in Figure 4. In addition, other burst characteristics were not disrupted by exposure to Bis-1, including the percent of spikes that occurred in bursts, the burst duration, the mean number of spikes in a burst and the interspike interval (ISI) in bursts (Table 1).
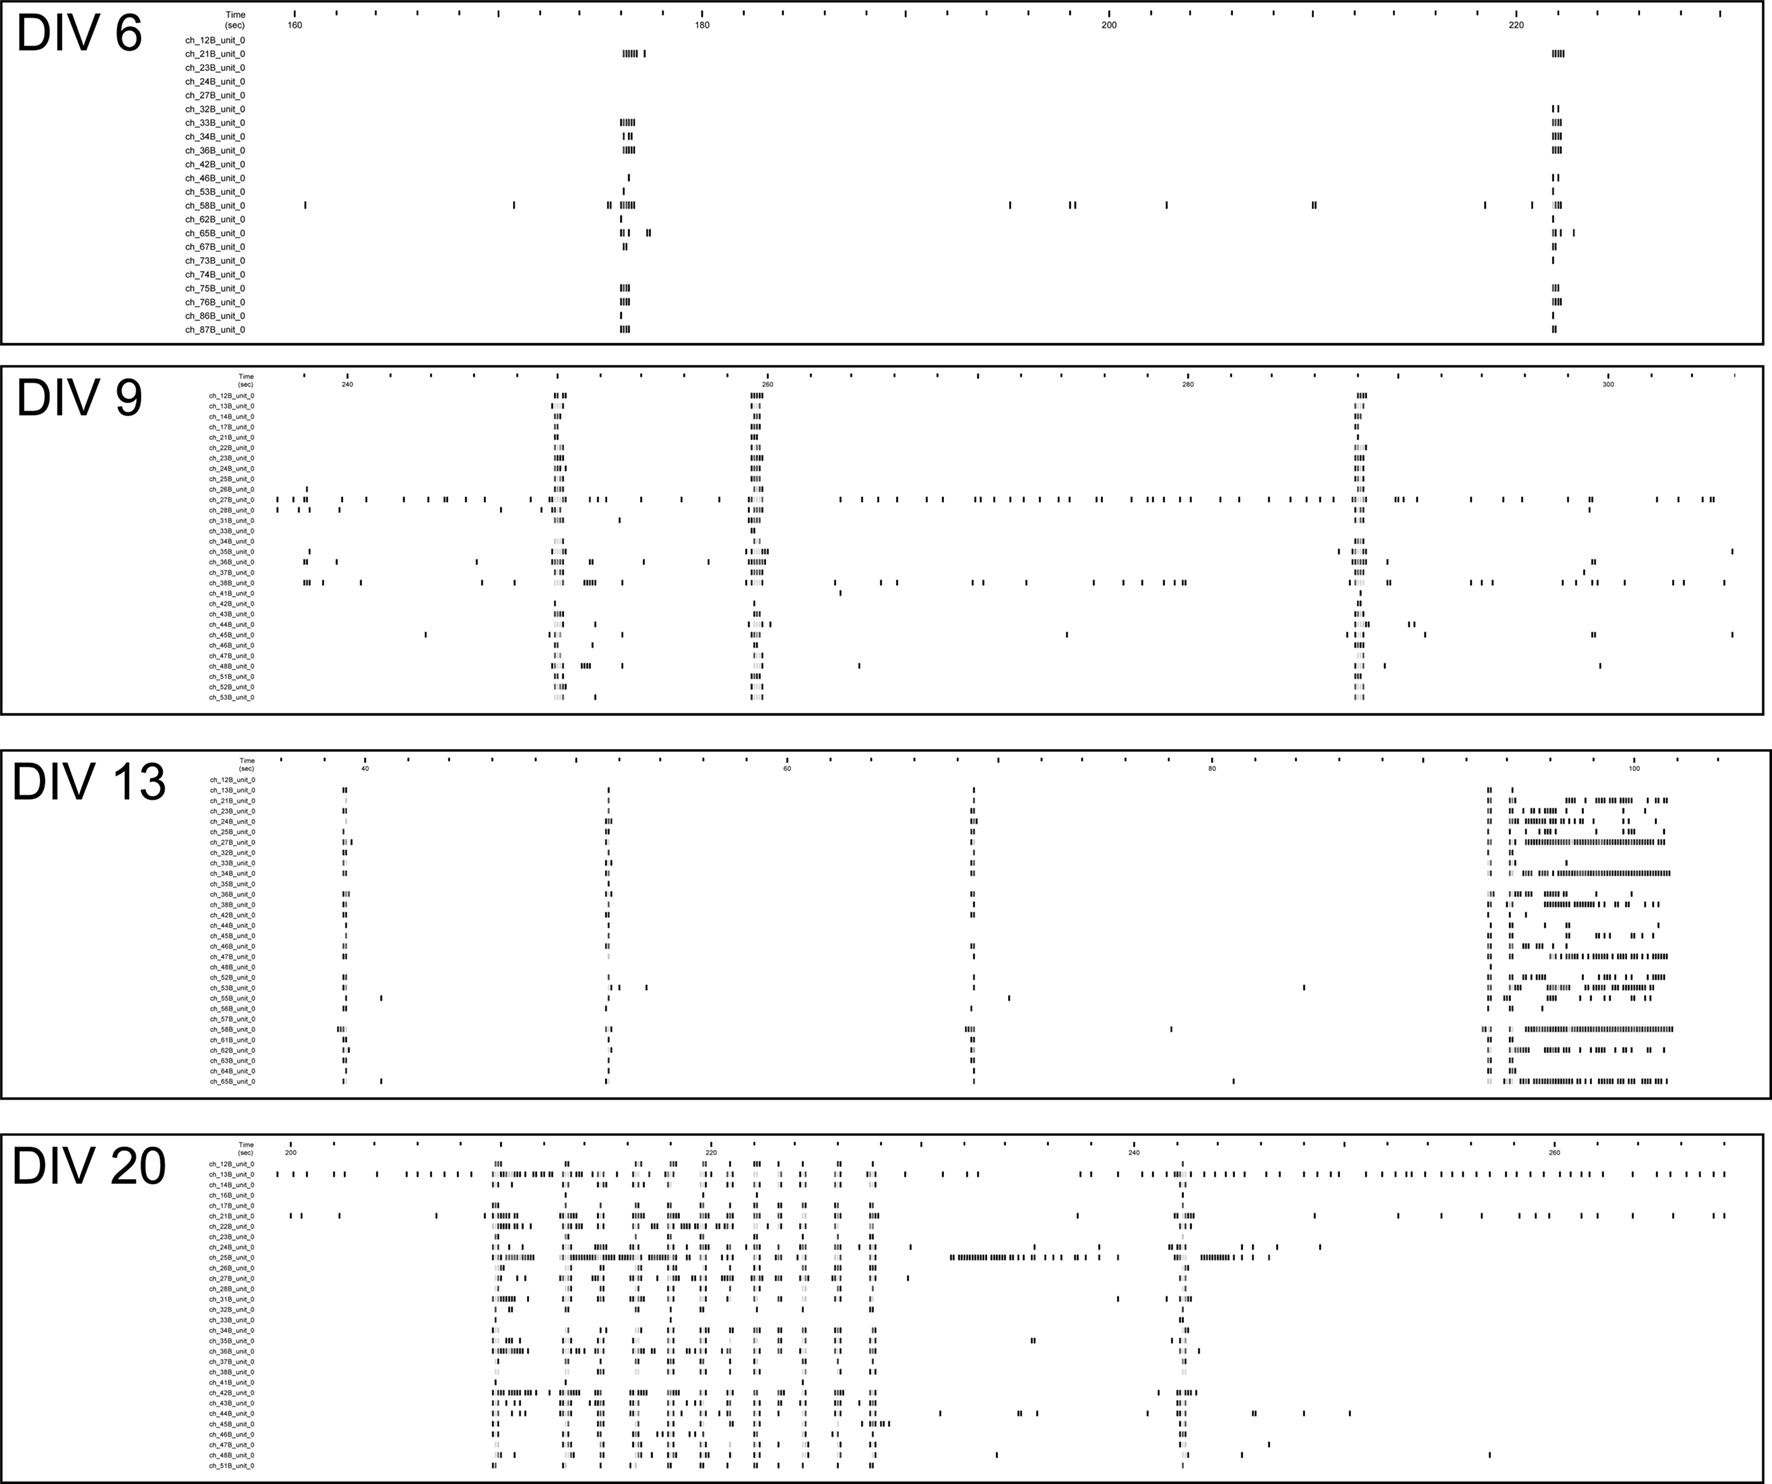
Figure 2. Raster plots of spontaneous activity in cortical cultures on different days in vitro (DIV). Raster plots from the same cortical network on DIV 6, 9, 13, and 20. Each row of the raster plot represents a different electrode on the MEA, and 70 s of activity is illustrated.
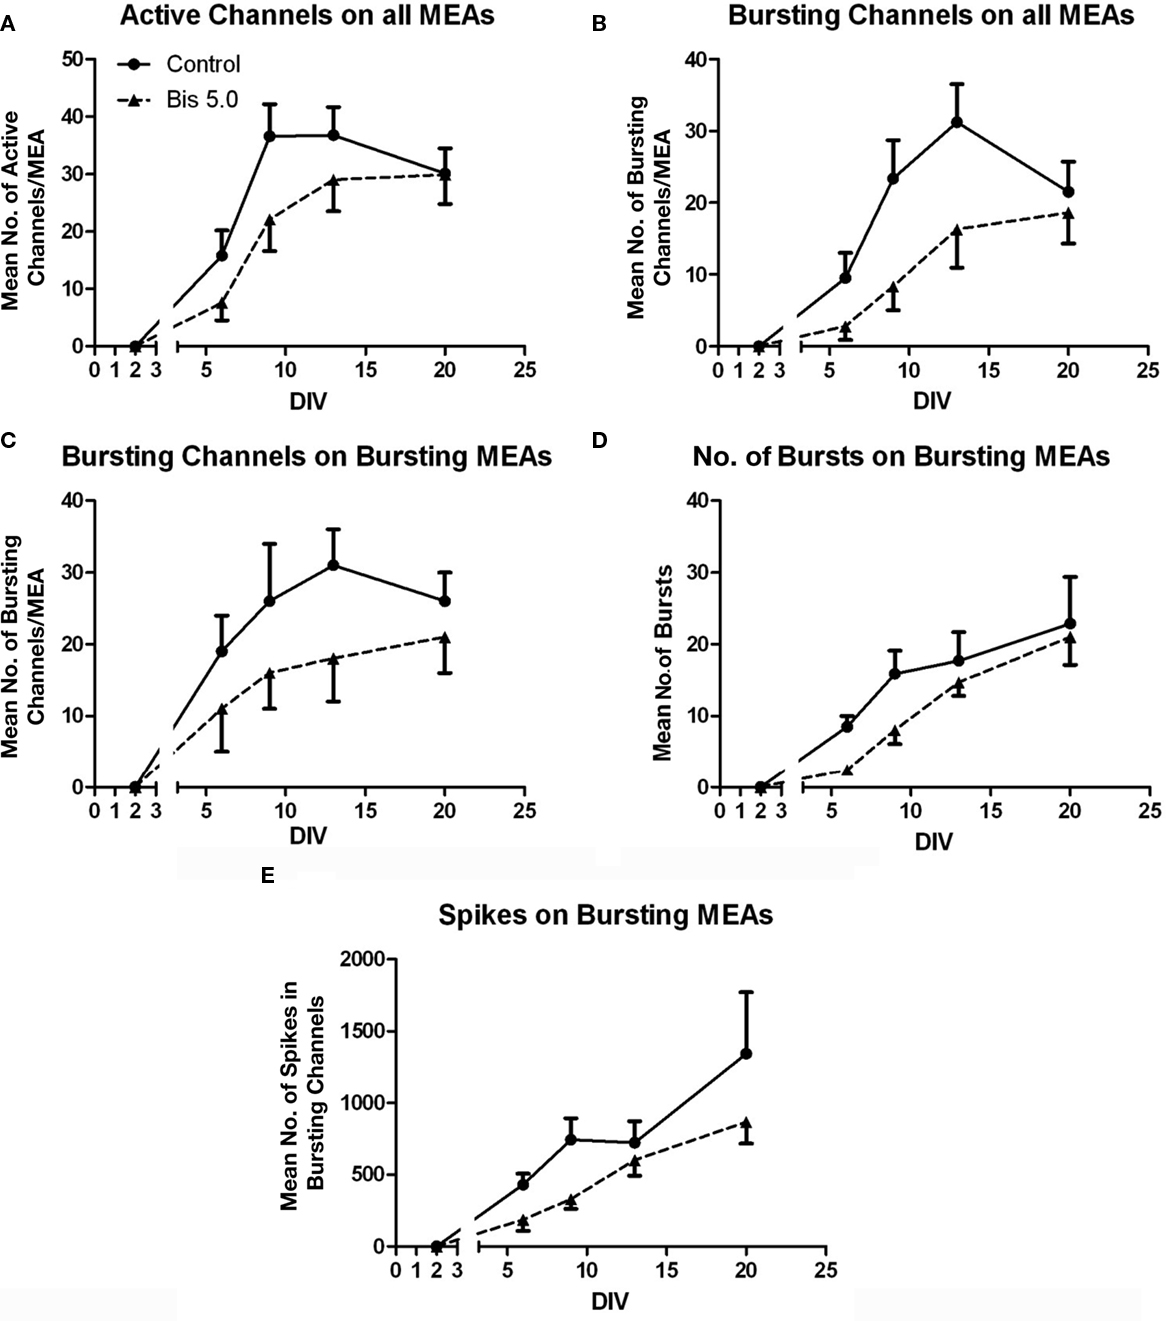
Figure 3. Effects of Bis-1 exposure on the ontogeny of network activity. MEAs were prepared and treated as described in the Section “Materials and Methods,” and activity was measured for 10 min. Data illustrate the number of “Active Channels/MEA” (A), the number of Bursting Channels/MEA (B), the number of bursting channels on MEAs where bursting was observed (C), the number of bursts on bursting channels (D), and the number of spikes on bursting channels (E) in the absence (solid line) or presence of 5 μM Bis-1, beginning on DIV 5. Data are the mean ± SE of the mean (SEM) for 13–18 chips from five separate cultures, assessed on DIV 6, 9, 13, and 20. A subset of MEAs (n = 4) were assessed at DIV 2 and no activity was observed, consistent with previous observations. Thus, not all MEAs were tested on DIV 2 and this is indicated by the break in the x-axis on each graph. DIV 2 data was not included in the statistical analysis. Two-way analysis of variance indicated significant effects of DIV on the number of Active Channels/MEA (A; p < 0.001) and bursting channels on all MEAs (B; p = 0.005), and a significant effect of Bis-1 treatment on Active Channels/MEA (p = 0.007), Bursting channels on all MEAs (p = 0.0014) and Bursting channels on bursting MEAs (p = 0.036). There were no interactions between DIV and Bis-1 treatment.
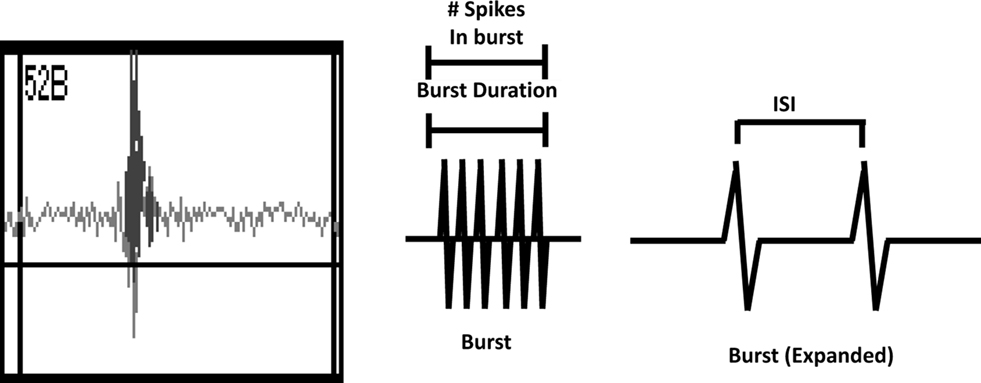
Figure 4. Left Panel. Screenshot of a typical burst of action potentials recorded from primary cortical cultures. Middle Panel. Schematic of a burst indicating the measurement of burst duration and the number of spikes in a burst. Right Panel. Schematic of a burst that has been expanded to indicate the interspike interval (ISI).
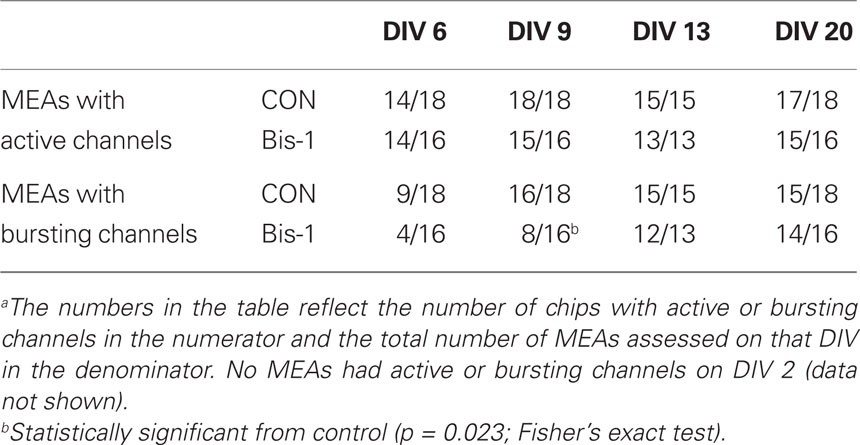
Table 1. Fractions of MEeAs with active and bursting channels as a function of days in vitroa.
To confirm that exposure to Bis-1 did not decrease the number of active or bursting channels via cytotoxicity following the longer exposures used for the MEA experiments, propidium iodide was used to stain dead cells on control and Bis-1 treated MEAs. Bis-1, at a concentration of 5 μM did not increase the number of propidium iodide-positive cells after 1 or 8 days of exposure (Figure 5). While this method does not assess all mechanisms of cell death (e.g., apoptosis), it does provide a demonstration that amount of cell death in control and Bis-1 treated cultures is similar.
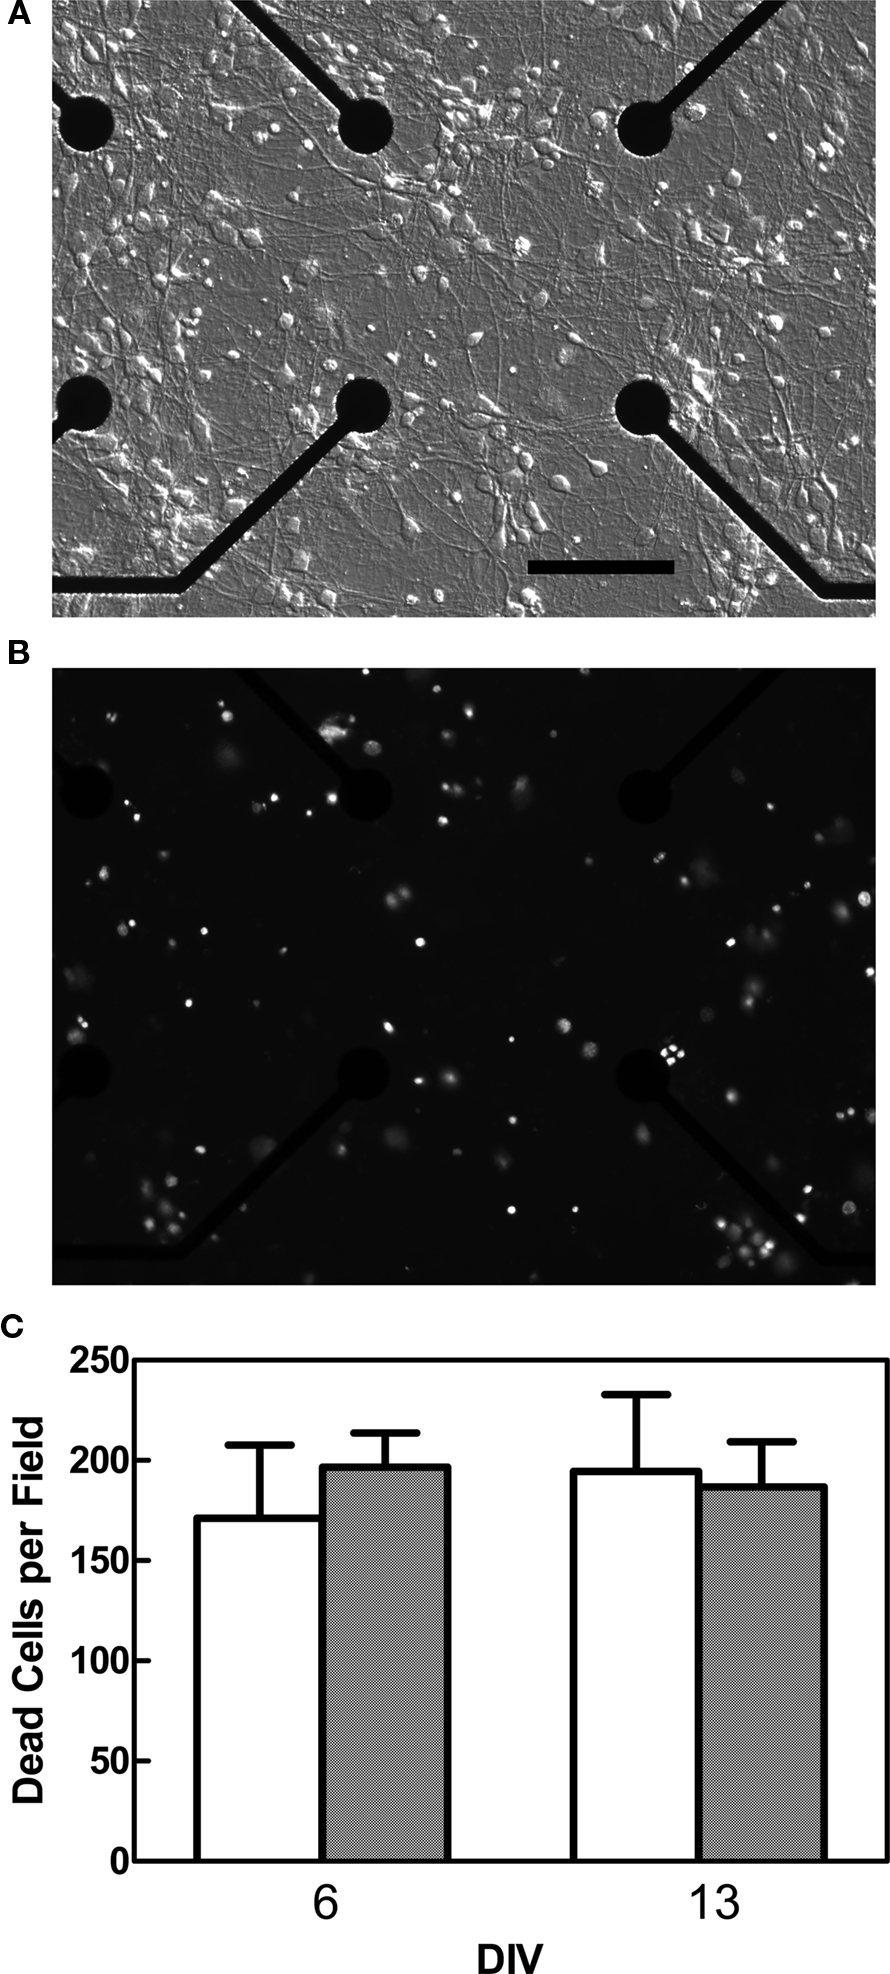
Figure 5. Effect of Bis-1 exposure on cell viability. MEAs were exposed to 5 μM Bis-1 on DIV 5, and the number of dead cells determined by staining with propidium iodide on DIV 6 or 13. (A) Modulation contrast photomicrographs of vehicle-treated neocortical cells growing on the center of the MEA on DIV 6 (scale bar = 100 μm). (B) Epifluorescent photomicrograph of propidium iodide-stained cells from the same field shown in (A). (C) Quantification of the number of propidium iodide-positive cells 1 day (DIV 6) or 8 days (DIV 13) after exposure to Bis-1 (data are mean ± SE for a total of 8 MEAs from two separate cultures).
Discussion
These experiments demonstrate that MEAs can be utilized as a functional determinant of the potential developmental neurotoxicity of chemicals. By following the developmental profile of activity of neocortical neurons cultured on MEAs in the presence or absence of Bis-1, these experiments clearly demonstrated that spontaneous network activity is decreased by a chemical that affects the morphological development of cortical neurons. The present results demonstrate that such changes can be detected during the period of network development, and that assessment need not wait until networks have reached a stable or “mature” status. These data support that MEAs could be incorporated into screening approaches to detect chemicals that may cause developmental neurotoxicity and prioritize them for additional testing.
In the present experiments, the PKC inhibitor Bis-1 caused a reduction in the number of neurites/cell and the total neurite length in primary cultures of neocortical neurons. This is consistent with previously demonstrated actions of Bis-1 in both neuronal cell lines (Das et al., 2004) and primary neocortical cultures (Nakanishi et al., 2006). In fact, this compound has been used as a positive “assay control” for development of high-throughput assays for neurite outgrowth due to the importance of PKC in this neurodevelopmental process (Radio et al., 2008). Bis-1 was used in the present experiments as a positive assay control compound that would alter neuronal network structure. Thus, the hypothesis that a chemical which affects the morphological development of neurons would also affect network function was tested.
In the present experiments, a clear ontogeny of network activity was observed. On DIV 2, there is no activity in the form of spikes or bursts. Activity begins to appear between DIV 2 and 6, and increases rapidly between DIV 6 and 13. This pattern of response is consistent with other reports of network ontogeny using MEAs (van Pelt et al., 2005; Wagenaar et al., 2006). This pattern was consistent over the five independent cultures that comprised this data set, as well as across numerous other cultures (data not shown). It also appears to be relatively consistent across laboratories as similar ontogenic patterns have been identified in the published literature (van Pelt et al., 2005; Wagenaar et al., 2006). The consistency in the developmental profile of network activity, both across cultures and across laboratories, supports the utility of MEAs as a reliable and reproducible developmental neurotoxicity screening tool. Interestingly, burst characteristics including the burst duration, percent of spikes occurring in a burst, number of spikes/burst and ISI showed a less pronounced developmental profile after DIV 6 (Table 2). These results may indicate that the most rapid period of burst development occurs between DIV 2 and 6, and that once bursting is established, it is relatively stable over the first 3 weeks in culture.
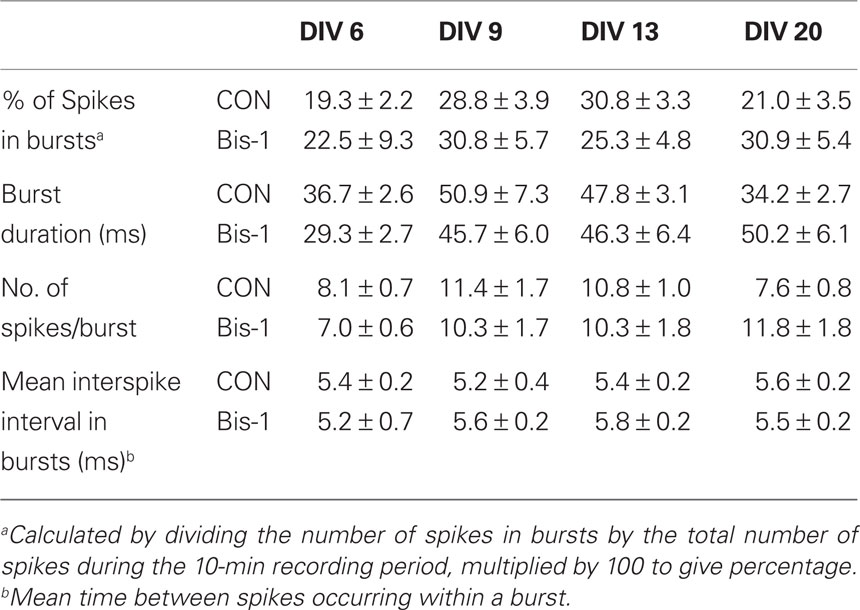
Table 2. Burst characteristics are not altered by exposure to Bis-1.
Treatment with the PKC inhibitor Bis-1, which decreased neurite outgrowth after 24 h, decreased several different measures of spontaneous network activity. First, the development of activity in treated cultures lagged behind the control MEAs, as a smaller fraction of MEAs exhibited bursting activity on DIV 6 and 9 following Bis-1 exposure. Bis-1 also caused a significant decrease in the number of active channels as well as the number of channels on which bursting activity was observed. Although there were no statistically significant interactions between treatment and time, by DIV 20, most of these parameters were similar to the control values. It is not clear whether there was a “developmental lag” induced by Bis-1 that eventually reached the same steady-state as control MEAs, or whether the values were closer due to the decline of the control values on DIV 20 (culture media was not renewed after DIV 5). Burst characteristics, such as burst duration, ISI and the percent of spikes that occur in bursts were not significantly affected by Bis-1 treatment. Cytotoxicity is unlikely to be responsible for these changes in spontaneous activity. Over DIV 6–20, a similar fraction of the MEAs had active channels in both the treated and control exposures. Also, after 24 h or 8 days exposure to Bis-1, no significant difference in the number of propidium iodide-positive cells were observed on MEAs. Together, these data indicate that Bis-1 exposure may decrease the number of synapses formed, but that the synapses that do form function normally. Recently, it was demonstrated that exposure to concentrations of Bis-1 that do not significantly affect neuronal density, from DIV 9–15, decreased the total number of synapses in primary neocortical cultures on DIV 15 (Harrill et al., 2011). It should be noted that the density of cells on the MEAs is higher than the density used to determine effects on neurite outgrowth or synaptogenesis, and that determination of either one of these anatomical endpoints is difficult at the cell density used for the MEAs. However, both the electrophysiological and anatomical data are consistent in that they indicate that the resulting networks have fewer functional connections.
The present results provide a proof-of-concept that MEAs can be utilized to detect chemicals that may alter important neurodevelopmental processes, and may therefore be useful for screening chemicals for the potential to cause developmental neurotoxicity (Bal-Price et al., 2010; Johnstone et al., 2010). The present study examined a relatively short exposure time during ontogeny of network activity and demonstrated a decrease in activity during this exposure. The results demonstrate changes in function can be detected during the period of network development; this may facilitate compound screening as it will not be necessary to wait 2–4 weeks for networks to reach maturity to assess potential developmental neurotoxicity. While longer-lasting effects were not characterized in the present study, there is evidence that MEAs can be utilized to detect effects following exposure as long as 4 weeks. Hogberg et al. (2010) demonstrated that a 4-week exposure to domoic acid increased basal spike and burst rates in primary cultures from rat cortex, as well as decreased the response to block of GABAA receptors by bicuculline. While the present studies did not attempt to evoke activity using electrical stimulation, or “challenge” spontaneous network activity with specific pharmacological agents, the results of Hogberg and co-workers demonstrate that such approaches also could be incorporated into screening approaches with MEAs. The unique capabilities of MEAs to provide functional measurements of network activity, including spontaneous activity, evoked activity, and responses to pharmacological challenges, therefore offers an advantage over other potential screening approaches that rely on biochemical or structural endpoints.
Primary cultures of rat cortical neurons were selected as a model system for the present study. Primary cultures of rodent neurons have been well characterized and shown to recapitulate many aspects of nervous system function, including spontaneous activity plasticity and pharmacological responsiveness (Gross et al., 1997; Potter, 2001; Marom and Shahaf, 2002; van Pelt et al., 2005; Pasquale et al., 2008; for review, see Johnstone et al., 2010). While they may lack three dimensional structure of slices, from a screening standpoint, the amount of MEAs made from the same tissue increases throughput significantly over slices. In addition, primary cultures also allow for chemicals to quickly reach equilibrium with the tissue, whereas this may require more time in slices.
In contrast to other recent studies that have utilized neurons derived from human stem cells as model systems (Heikkilä et al., 2009; Jurga et al., 2009; Ylä-Outinen et al., 2010), the present study utilized rodent neurons. Each model system has advantages and limitations. Although the human-derived neurons provide a model system wherein there is no concern for extrapolation of data from animals to humans, these neurons also require greater than 3 weeks in culture on MEAs to differentiate. This latter characteristic may make them less amenable to screening large numbers of chemicals in an efficient and timely manner. In addition, human embryonic stem cell derived neurons also have been subjected to use restrictions due to ethical concerns and therefore may not be readily available for use in all laboratories. By contrast, as shown here, spontaneous activity develops rapidly in cortical cultures obtained from rats. Although use of animal tissues is not completely free from ethical considerations, their use is widely accepted. In addition, although data obtained from rodent tissue must then be extrapolated to humans, the vast majority of knowledge regarding toxicology, including developmental neurotoxicology, has been obtained in rodents. Thus, the use of rodent tissue will allow for comparisons between in vitro and in vivo results in the same species. While there is no reason to indicate that human-derived networks will not exhibit the same properties, use of these cells on MEAs has been very limited to date and thus they are less well characterized.
In summary, the need for new, rapid approaches to screen chemicals for the ability to disrupt neurodevelopment has been clearly articulated (Coecke et al., 2007; Lein et al., 2007). A number of potential screening approaches have been proposed that are based on developmental processes such as gene expression (Hill et al., 2008; Hogberg et al., 2009) proliferation (Breier et al., 2008), differentiation, neurite outgrowth (Radio and Mundy, 2008; Radio et al., 2008), and synaptogenesis (Harrill et al., 2011). MEAs offer the advantage of providing functional measurements of spontaneous and stimulated network activity (Johnstone et al., 2010). The present and recent (Hogberg et al., 2010) results confirm that MEAs are a sensitive method to detect functional changes in response to chemical exposure during network ontogeny, and should be incorporated into screening batteries for developmental neurotoxicity. As part of this process, additional chemicals should be tested in a manner similar to the current study, in order to demonstrate further the reproducibility and reliability of this approach.
Conflict of Interest Statement
The authors declare that the research was conducted in the absence of any commercial or financial relationships that could be construed as a potential conflict of interest.
Acknowledgments
The authors greatly appreciate the technical assistance of Ms. Theresa Freudenrich (US EPA) with tissue culture and Dr. Andrew Johnstone (US EPA) with MEA recordings and analysis. We also greatly appreciate the comments of Dr. Johnstone and Dr. Helena Hogberg (Center for Alternatives to Animal Testing, The Johns Hopkins University) on a draft version of this manuscript.
Footnote
- ^Preparation of this document has been funded by the U.S. Environmental Protection Agency. This document has been subjected to review by the National Health and Environmental Effects Research Laboratory and approved for publication. Approval does not signify that the contents reflect the views of the Agency, nor does mention of trade names or commercial products constitute endorsement or recommendation for use.
References
Bal-Price, A. K., Hogberg, H. T., Buzanska, L., Lenas, P., van Vliet, E., and Hartung, T. (2010). In vitro developmental neurotoxicity (DNT) testing: relevant models and endpoints. Neurotoxicology 31, 545–54.
Breier, J. M., Radio, N. M., Mundy, W. R., and Shafer, T. J. (2008). Development of a high throughput screening assay for chemical effects on proliferation and viability of immortalized human neural progenitor cells. Toxicol. Sci. 105, 119–133.
Coecke, S., Goldberg, A. M., Allen, S., Buzanska, L., Calamandrei, G., Crofton, K., Hareng, L., Hartung, T., Knaut, H., Honegger, P., Jacobs, M., Lein, P., Li, A., Mundy, W., Owen, D., Schneider, S., Silbergeld, E., Reum, T., Trnovec, T., Monnet-Tscudi, F., and Bal-Price, A. (2007). Workgroup Report: incorporating in vitro alternative methods for developmental neurotoxicity into international hazard and risk assessment strategies. Environ. Health Perspect. 115, 924–931.
Das, K. P., Freudenrich, T. M., and Mundy, W. R. (2004). Assessment of PC12 cell differentiation and neurite growth: a comparison of morphological and neurochemical measures. Neurotoxicol. Teratol. 26, 397–406.
Dunnett, C. W. (1950). A multiple comparison procedure for comparing several treatments with a control. J. Am. Stat. Assoc. 50, 1096–1121.
Grandjean, P., and Landrigan, P. J. (2006). Developmental neurotoxicity of industrial chemicals. Lancet 368, 2167–2178.
Gross, G. W., Harsche, A., Rhodes, B., and Göpel, W. (1997). Odor, drug, and toxin analysis with neuronal networks in vitro: extracellular array recording of network responses. Biosens. Bioelectron. 12, 373–393.
Harrill, J. A., Freudenrich, T. M., Machacek, D. W., Stice, S. L., and Mundy, W. R. (2010). Quantitative assessment of neurite outgrowth in human embryonic stem cell-derived hN2 cells using automated high-content image analysis. Neurotoxicology 31, 277–290.
Harrill, J. A., Robinette, B. L., and Mundy, W. R. (2011). Use of high content image analysis to detect chemical-induced changes in synaptogenesis in vitro. Toxicol. In Vitro 25, 369–387.
Heikkilä, J., Ylä-Outinen, L., Tanskanen, J. M., Lappalainen, R. S., Skottman, H., Suuronen, R., Mikkonen, J. E., Hyttinen, J. A., and Narkilahti, S. (2009). Human embryonic stem cell-derived neuronal cells form spontaneously active neuronal networks in vitro. Exp. Neurol. 218, 109–116.
Hill, E. J., Woehrling, E. K., Prince, M., and Coleman, M. D. (2008). Differentiating human NT2/D1 neurospheres as a versatile in vitro 3D model system for developmental neurotoxicity testing. Toxicology 249, 243–250.
Hogberg, H. T., Kinsner-Ovaskainen, A., Hartung, T., Coecke, S., and Bal-Price, A. K. (2009). Gene expression as a sensitive endpoint to evaluate cell differentiation and maturation of the developing central nervous system in primary cultures of rat cerebellar granule cells (CGCs) exposed to pesticides. Toxicol. Appl. Pharmacol. 235, 268–286.
Hogberg, H. T., Sobanski, T., Novellino, A., Whelan, M., Weiss, D. G., and Bal-Price, A. K. (2010). Application of micro electrode arrays (MEAs) as an emerging technology for developmental neurotoxicity: evaluation of domoic acid-induced effects in primary cultures of rat cortical neurons. Neurotoxicology doi: 10.1016/j.neuro.2010.10.007 [Epub ahead of print].
Johnstone, A. F. M., Gross, G. W., Weiss, D. G., Schroeder, O. H., Gramowski, A., and Shafer, T. J. (2010). Microelectrode arrays: a physiologically based neurotoxicity testing platform for the 21st century. Neurotoxicology 31, 331–350.
Jurga, M., Lipkowski, A. W., Lukomska, B., Buzanska, L., Kurzepa, K., Sobanski, T., Habich, A., Coecke, S., Gajkowska, B., and Domanska-Janik, K. (2009). Generation of functional neural artificial tissue from human umbilical cord-blood stem cells. Tissue Eng. Part C Methods 15, 365–372.
Lein, P., Locke, P., and Goldberg, A. (2007). Meeting report alternatives for developmental neurotoxicity testing. Environ. Health Perspect. 115, 764–768.
Marom, S., and Shahaf, G. (2002). Development, learning and memory in large random networks of cortical neurons: lessons beyond anatomy. Q. Rev. Biophys. 35, 63–87.
Nakanishi, K., Aono, S., Hirano, K., Kuroda, Y., Ida, M., Tokita, Y., Matsui, F., and Oohira, A. (2006). Identification of neurite outgrowth-promoting domains of neuroglycan C, a brain-specific chondroitin sulfate proteoglycan, and involvement of phosphatidylinositol 3-kinase and protein kinase C signaling pathways in neuritogenesis. J. Biol. Chem. 281, 24970–24978.
OECD. (2007). Test Guideline 426. OECD Guideline for Testing of Chemicals. Developmental Neurotoxicity Study. Paris. Organisation for Economic Co-operation and Development, 2007. Available at: http://www.oecdbookshop.org/oecd/display.asp?lang=en&sf1=DI&st1=5L4FG25MNKXS (accessed 19 Feb 2009).
Pasquale, V., Massobrio, P., Bologna, L. L., Chiappalone, M., and Martinoia, S. (2008). Self-organization and neuronal avalanches in networks of dissociated cortical neurons. Neuroscience 153, 1354–1369.
Potter, S. M. (2001). Distributed processing in cultured neuronal networks. Prog. Brain Res. 130, 49–62.
Potter, S. M., and DeMarse, T. B. (2001). A new approach to neural cell culture for long-term studies. J. Neurosci. Methods 110, 17–24.
Radio, N. M., Breier, J. M., Shafer, T. M., and Mundy, W. R. (2008). Assessment of chemical effects of neurite outgrowth in PC12 cells using high content screening. Toxicol. Sci. 105, 106–118.
Radio, N. M., and Mundy, W. R. (2008). Developmental neurotoxicology testing in vitro: models for assessing chemical effects on neurite outgrowth. Neurotoxicity 29, 361–376.
US EPA. (1998a). Chemical Hazard Data Availability Study: What Do we Really Know About the Safety of High Production Volume Chemicals? Washington, DC: Office of Pollution Prevention and Toxics.
US EPA. (1998b). Health Effects Guidelines OPPTS 870.6300 Developmental Neurotoxicity Study EPA 712-C-98-239 (1998). Available at: http://www.epa.gov/opptsfrs/publications/OPPTS_Harmonized/870_Health_Effects_Test_Guidelines/Series/870-6300.pdf
van Pelt, J., Vajda, I., Wolters, P. S., Corner, M. A., and Ramakers, G. J. A. (2005). Dynamics and plasticity in developing neuronal networks in vitro. Prog. Brain Res. 147, 173–188.
Wagenaar, D. A., Pine, J., and Potter, S. M. (2006). An extremely rich repertoire of bursting patterns during the development of cortical cultures. BMC Neurosci. 7, 11. doi: 10.1186/1471-2202-7-11
Keywords: developmental neurotoxicity, neurite outgrowth, spontaneous network activity, twenty-first century, toxicity testing
Citation: Robinette BL, Harrill JA, Mundy WR and Shafer TJ (2011) In vitro assessment of developmental neurotoxicity: use of microelectrode arrays to measure functional changes in neuronal network ontogeny. Front. Neuroeng. 4:1. doi: 10.3389/fneng.2011.00001
Received: 06 October 2010;
Paper pending published: 02 December 2010;
Accepted: 04 January 2011;
Published online: 20 January 2011.
Edited by:
Antonio Novellino, ETT s.r.l., ItalyReviewed by:
Antonio Novellino, ETT s.r.l., ItalyJohn M. Beggs, Indiana University, USA
Susanna Narkilahti, University of Tampere, Finland
Copyright: © 2011 Robinette, Harrill, Mundy and Shafer. This is an open-access article subject to an exclusive license agreement between the authors and Frontiers Media SA, which permits unrestricted use, distribution, and reproduction in any medium, provided the original authors and source are credited.
*Correspondence: Timothy J. Shafer, Integrated Systems Toxicology Division, US Environmental Protection Agency, MD105-03, Research Triangle Park, NC 27711, USA. e-mail:c2hhZmVyLnRpbUBlcGEuZ292