 Alberto Capurro1*
 Fabiano Baroni2
 Shannon B. Olsson3
 Linda S. Kuebler3 Salah Karout1 Bill S. Hansson3 Timothy C. Pearce1
- 1Department of Engineering, Centre for Bioengineering, University of Leicester, Leicester, UK
- 2Department of Electrical and Electronic Engineering, The University of Melbourne, Melbourne, VIC, Australia
- 3Department of Evolutionary Neuroethology, Max-Planck-Institute for Chemical Ecology, Jena, Germany
Neural responses to odor blends often exhibit non-linear interactions to blend components. The first olfactory processing center in insects, the antennal lobe (AL), exhibits a complex network connectivity. We attempt to determine if non-linear blend interactions can arise purely as a function of the AL network connectivity itself, without necessitating additional factors such as competitive ligand binding at the periphery or intrinsic cellular properties. To assess this, we compared blend interactions among responses from single neurons recorded intracellularly in the AL of the moth Manduca sexta with those generated using a population-based computational model constructed from the morphologically based connectivity pattern of projection neurons (PNs) and local interneurons (LNs) with randomized connection probabilities from which we excluded detailed intrinsic neuronal properties. The model accurately predicted most of the proportions of blend interaction types observed in the physiological data. Our simulations also indicate that input from LNs is important in establishing both the type of blend interaction and the nature of the neuronal response (excitation or inhibition) exhibited by AL neurons. For LNs, the only input that significantly impacted the blend interaction type was received from other LNs, while for PNs the input from olfactory sensory neurons and other PNs contributed agonistically with the LN input to shape the AL output. Our results demonstrate that non-linear blend interactions can be a natural consequence of AL connectivity, and highlight the importance of lateral inhibition as a key feature of blend coding to be addressed in future experimental and computational studies.
Introduction
Biological neural networks organize sensory inputs to produce a meaningful experience of the environment, but the way in which complex perceptual representations are produced by the olfactory system is not completely understood. For this reason, an understanding of the relation between the neural representation of a mixture and its single components constitutes an important problem in basic neuroscience. Moreover, such analyses can reveal general properties of perceptual representation in the nervous system, and derive principles that may be widely extended across species and sensory modalities (e.g., Rabinovich et al., 2008).
Natural odors are complex mixtures of different compounds. Within the olfactory system, the components of a blend often interact in a non-linear fashion within the olfactory system to affect the resultant neuronal response. This gives rise to so-called mixture interactions (Laing et al., 1989; Duchamp-Viret et al., 2003). The first interaction type is suppression, where the response to the mixture is less than at least one of the single components alone. A related category, in which the mixture evokes a response that is equivalent to the most effective single component, is known as hypoadditivity. The final interaction type is synergism, in which the mixture induces a response that is greater than the addition of the responses to the single components. A special case is linear addition, in which there is no interaction between the components, so the mixture evokes a response that is equal to the component sum.
The antennal lobe (AL) is the first synaptic relay in the olfactory pathway of insects, analogous to the mammalian olfactory bulb (for recent comparative review, see Martin et al., 2011). It consists of spheroidal bundles of neuropil known as glomeruli that contain synaptic contacts between receptors and second-order neurons. The axons of olfactory sensory neurons (OSNs) in the antennal nerve contact projection neurons (PNs) that constitute the output of the AL, and local interneurons (LNs) that communicate with other glomeruli. OSNs having the same type of receptor protein contact a specific glomerulus, giving rise to a spatial representation of chemical identity. In moths, approximately 250,000 OSNs from the antenna converge onto roughly 900 PNs and 360 LNs (Homberg et al., 1989; Figure 1). Interneurons in moths generally exhibit a broad symmetrical arborization pattern, contacting the majority of AL glomeruli (Manduca sexta: Matsumoto and Hildebrand, 1981; Kuebler et al., 2011; Reisenman et al., 2011). Although excitatory LNs have been found in Drosophila (Shang et al., 2007; Huang et al., 2010), to date only inhibitory LNs have been located in moths (e.g., Reisenman et al., 2011). However, excitatory PNs that innervate two or more neighboring glomeruli have been identified in Manduca sexta hawkmoths (Homberg et al., 1988; Kuebler et al., 2011; Figure 1), and could provide a form of potential lateral excitation within the moth AL.
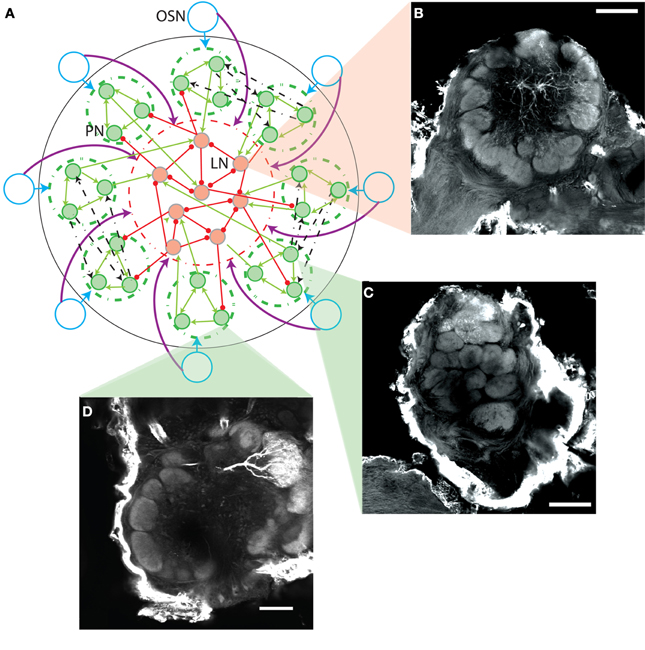
Figure 1. (A) Scheme of AL model network connectivity. Each of the eight OSN types (blue circles) contact only PNs in their corresponding glomerulus (green dashed circles) as indicated by the blue arrows. OSN types contact every LN, as indicated by the purple arrows reaching the dashed red circle containing the LNs. The PNs have reciprocal excitation within the same glomerulus (green arrows within the dashed green circles), can contact the LNs (green arrows entering the dashed red circle), and have reciprocal multiglomerular excitatory contacts with another single glomerulus (dashed black arrows show a few examples). The LNs have reciprocal inhibition and can contact the PNs (red lines ending in circles). (B–D) Neuromorphic basis for the AL model. Confocal micrographs show three female M. sexta ALs with lines indicating their representative location in the model schema of A. Each panel extracts a single optical orthogonal slice. Neurobiotin-injected cells were stained with Alexa-conjugated Streptavidin. Pictures were obtained by confocal microscopy of three separate whole mount brain preparations using a 10×, 0.45-NA objective lens (C-Apochromat, Zeiss). Optical sections (1024 × 1024 pixel) were taken at intervals of 0.8 μm. B displays a lateral interneuron, while C and D show a multiglomerular and uniglomerular PN, respectively; scale bar: 100 μm.
There exists considerable evidence indicating that the insect AL is not simply a relay station in the olfactory pathway, but constitutes the primary processing centre for blend information of the insect brain (e.g., Joerges et al., 1997; Linster and Smith, 1997; Hansson and Anton, 2000; Galizia and Menzel, 2001; Linster et al., 2005; Deisig et al., 2006, 2010; Carlsson et al., 2007; Silbering and Galizia, 2007; Krofczik et al., 2008; Lei and Vickers, 2008; Fernandez et al., 2009; Riffell et al., 2009a,b; Yamagata et al., 2009; Kuebler et al., 2011; Meyer and Galizia, 2011). Odor mixtures have been found to elicit mainly suppressive and hypoadditive responses within the insect AL, while examples of synergism are rare, as evidenced by both calcium imaging (e.g., Deisig et al., 2006, 2010; Carlsson et al., 2007; Silbering et al., 2008; Yamagata et al., 2009) and electrophysiological studies (e.g., Krofczik et al., 2008; Riffell et al., 2009a; Kuebler et al., 2011). In moths in particular, mixture interactions have been suggested to occur at the level of OSNs (e.g., Carlsson and Hansson, 2002; Hillier and Vickers, 2011) but are more commonly observed in second order neurons (e.g., Christensen et al., 1991; Lei and Vickers, 2008; Pinero et al., 2008).
In this study, we are interested in the network processing within the AL as a potential source of non-linear interactions between single components in the response to a blend. To assess this, we constructed a morphologically based computational model including populations of interconnected PNs and LNs using probabilistic rules. Parameters were calibrated to match the excitation/inhibition proportion observed in physiological recordings of AL neurons of the moth M. sexta (Kuebler et al., 2011). The model predicted most of the proportions of blend interactions found in the data, and the results are robust to changes in many parameters due to the underlying probabilistic connectivity. Finally, we used the model to investigate how different types of non-linear blend interactions could arise in terms of the synaptic input received by the PNs and LNs. We focused on the mean values of synaptic input during odor stimulus and control conditions, leaving the influence of the dynamic patterns of neural activity for a future study. Our results indicate that the array of blend interactions observed in the biological data can arise from network connectivity alone via sub-networks of inhibitory interneurons without requiring special intrinsic properties of the neurons themselves.
Methods
Neuronal Recordings and Odor Stimulation
We used intracellular recordings and morphological observations of AL neurons performed in the moth M. sexta (Lepidoptera, Sphingidae) by Kuebler et al. (2011), in addition to previous studies (see citations in “Network connectivity of the model”) to construct a computational model of AL processing. The model parameters were calibrated to reproduce the proportion excitation/inhibition found in their physiological recordings (see “Network connectivity of the model”), and subsequently the proportions of blend interactions predicted by the model were independently compared with the recordings as a way of validating the model (Figures 3 and 4), which was in turn used to assess the role of synaptic input on the emergence of blend interactions (Figures 5–8). We include here a brief description of the recording methods (for full details see Kuebler et al., 2011).
Projection and interneurons were recorded intracellularly using sharp glass electrodes and stimulated for 500 ms at 10−4 dilution (in mineral oil) with (+) linalool, (−) linalool, phenyl acetataldehyde, benzaldehyde, hexanol, nonanal, or trans-2-hexenyl acetate (used instead of nonanal in some experiments), and cis-3-hexenyl acetate. Stimulus concentrations were equilibrated according to vapor pressure using a multicomponent stimulus device (Olsson et al., 2011). Neurons were presented with each of the seven odors separately, and the odors eliciting a response were tested together at the same concentration as a “blend.” Active single components were finally tested separately at the total blend concentration. Mixture interactions were assessed as described below from response frequencies for each stimulus presentation, normalized to spontaneous activity as a ratio (Hz 1.5 s after stimulus onset/Hz 1.5 s before onset; including mechanical stimulus delay).
The complete data set consisted of 31 neurons tested each in one trial with the complete stimulus protocol. From this number, 20 neurons responded with excitation (including biphasic responses) and 11 responded with inhibition. Most of the recorded neurons (29 out of 31) could be classified as PNs or LNs by morphological analysis or by measuring the spike width, which nearly twice as large in LNs (for details see Kuebler et al., 2011). The cells that were morphologically labeled were 9 PNs and 5 LNs, while the criterion of the spike width allowed to classify 12 cells as PNs and 5 as LNs.
Computational Model
Neuronal model
Individual neuron dynamics of LNs and PNs were modeled using a first-order differential equation (Chong et al., 2012) that described the evolution of the firing-rate activation variable of a neuron over time:
where ai is the activation level of the i-th neuron, P is the subset of PN neurons, L is the subset of LN neurons, R is the subset of OSN neurons, wi,j is the strength of synaptic influence of j on the activity of i (similarly for wi,k), vi,d is the strength of synaptic influence of the d-th OSN type on the activity of cell i-th, and rd is the activity of the d-th OSN type. For PNs, vi,d is non-zero only for the connections coming from its corresponding OSN. S is a sigmoid function that limits the neuronal activity to values between 0 and 1. τ(10 ms for PNs and 20 ms for LNs) is the time constant of neuronal dynamics. We assumed that the larger dendritic ramifications of LNs can make them slower than the PNs, as has been done in previous articles that modeled the AL (e.g., Linster and Cleland, 2010; Chong et al., 2012). The neuronal activation function S(x) (Chong et al., 2012) has a sigmoidal shape that accounts for saturation in activation level at high input values. We did not include noise added to each time step, but the initial values of ai used in each realization were taken from a Gaussian random distribution with μ = 0.01 and σ = 0.0025. The pre-stimulation control period started 200 ms after the onset of the simulation, when the system had already reached its resting state, so the transients due to the initial conditions (visible at times <50 ms in Figure 2) did not influence the results shown in Figures 3–8.
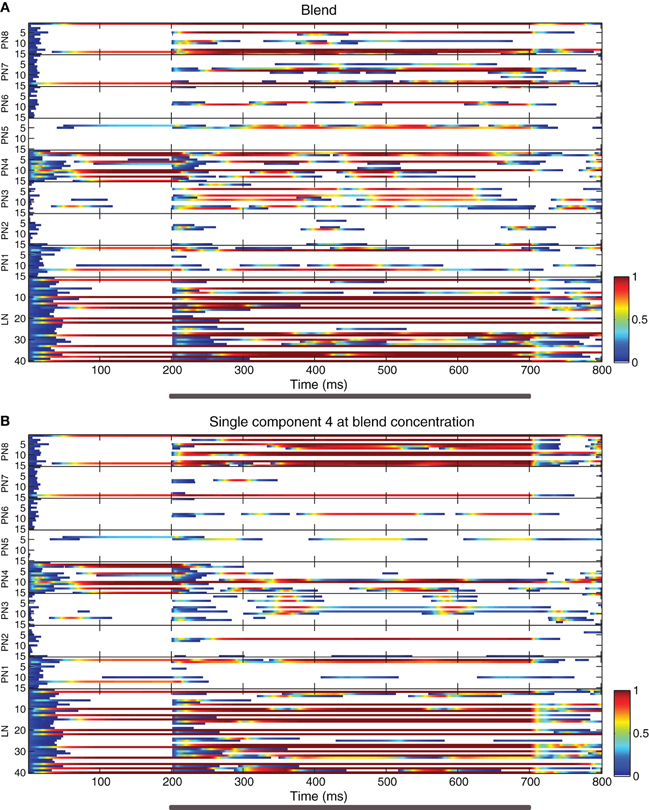
Figure 2. Raster plots showing neuron activity in an example realization of the AL model. (A) Response to the homogeneous blend. (B) Response to a single component at blend concentration. The activity variable of each neuron is represented by a color code (shown in the scale bars at the lower right side of each panel) plotted against time. The ordinate's axis indicates the index numbers of the neurons: PNs belonging to each of the eight glomeruli (labeled PN 1 to PN 8, with 15 PNs per glomerulus) and 40 multiglomerular LNs (labeled LN). Odor stimulus duration is marked with gray bars under the abscissas.
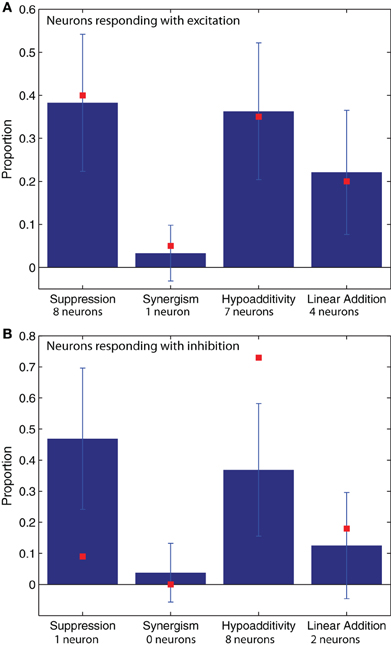
Figure 3. The proportions of blend interaction types found in 100 model realizations (μ ± SD) are shown with blue bars. The data values obtained from the experimental recordings (N = 31 neurons) are plotted with red squares. (A) Neurons that respond with excitation (N = 20). (B) Neurons that respond with inhibition (N = 11). The number of neurons used to compute the proportions represented by the red squares are provided under their corresponding abscissa labels. For the model simulations of neurons that respond with excitation (blue bars in A) the neuron numbers were 901 for suppression, 822 for synergy, 546 for hypoadditivity, and 81 for linear addition. For the neurons that respond with inhibition (blue bars in B) the neuron numbers were 622 for suppression, 520 for synergy, 179 for hypoadditivity, and 54 for linear addition.
Network connectivity of the model
Figure 1A shows a general scheme of the network connectivity pattern. For simplicity only a few neurons of each type are represented, PNs with green filled circles and LNs with red filled circles. Excitatory synaptic contacts are represented with lines ending in arrow heads, and inhibitory contacts with lines ending in circles.
The model considers eight OSN types and eight glomeruli with 15 PNs each, making a total of 120 PNs. The total number of LNs was set to 40, resulting in a ratio PN/LN of three, which is realistic for the moth AL (Homberg et al., 1989). Thus, we are making a proportional reduction (x = 8.75) of the glomeruli number in the biological system of M. sexta (which is around 70; Grosse-Wilde et al., 2011), keeping a realistic number of PNs per glomerulus and PN/LN proportions. This reduction resulted in a network scale in which the dynamic behavior of the model can be captured without an excessive increase in computational burden. We checked that the results regarding the proportions of blend interactions did not change significantly for a scaled-up version of the model having 64 glomeruli.
The connectivity between the different cell types is specified by its weight and connection probability. In each realization of the model, the values provided below for the weights were perturbed with Gaussian noise of mean zero and σ equal to 5% of the weight. OSNs of a given type are represented as a single unit (blue circles and arrows in Figure 1A) and only project to PNs of the corresponding glomerulus (dashed green circles) with a synaptic weight of 2.0. This configuration retains the generally dogmatic 1:1 principle between OSN type and glomerulus (Ressler et al., 1994; Mombaerts, 1996; Vosshall, 2000; Baker, 2008; Bruyne and Baker, 2008). Thus, the PNs of each glomerulus were activated only by their corresponding receptor type, as indicated by the blue arrows. In contrast, the eight receptor types contacted every LN with a synaptic weight of 2.0, as indicated by the purple arrows of Figure 1A. Given the high convergence ratio between OSNs and other AL neurons within each glomerulus (300:1 for OSNs:PNs, ∼1000:1 for OSNs:LNs; Homberg et al., 1989), the connection probability of OSN to PN or LN contacts was set at 1.0.
The probabilistic rules used to establish the connectivity pattern of the network shown in Figure 1A are based on morphological studies of the M. sexta moth AL (e.g., Homberg et al., 1989), and also on direct observations performed by members of our group (Figures 1B–D). The location of the cells displayed in the morphological images in the context of the network scheme is indicated with triangular zooms. Here, we show the three major types of AL neurons recorded in the physiological study (Kuebler et al., 2011). As noted previously (Kuebler et al., 2011; Reisenman et al., 2011), LNs in the AL of the moth exhibited a broad, symmetrical arborization pattern throughout the AL (Figure 1B), interconnecting a large proportion of the glomeruli, as originally described (Matsumoto and Hildebrand, 1981). PNs exhibited two types of arborization patterns (Homberg et al., 1988). The majority of recorded PNs arborized in a single AL glomerulus, thus synapsing only with other PNs and LNs within that glomerulus (Figure 1D). However, a small proportion (2:8) of the stained PNs (Kuebler et al., 2011) arborized in two or more glomeruli (Figure 1C), thus synapsing with neurons within neighboring glomeruli.
To reflect these morphological observations in our model, PNs could have excitatory connections with other PNs of the same glomerulus with probability 0.8 and weight 0.37 (green arrows within the green dashed circles). In each glomerulus, we also randomly chose two PNs that could potentially contact PNs of another randomly chosen glomerulus with probability of 0.8 and weight 1.25 (the dashed black arrows in Figure 1A show only some examples). When a given glomerulus A received this type of contact from another glomerulus B, then B also innervated A with the same rule. In this way, each glomerulus was paired with another single glomerulus through this reciprocal excitatory connectivity (e.g., multi-glomerular PNs; Figure 1C). In the morphological data, we observed that multi-glomerular PNs generally innervated 2–3 neighboring glomeruli (Kuebler et al., 2011), however, our model does not include spatial representation. LNs could contact other LNs with a synaptic weight of −8.0 and probability of 0.25 (red lines within the dashed red circle of Figure 1A). In this way, both the PNs and the LNs had multi-glomerular connectivity. LNs could contact PNs with a synaptic weight of −1.8 and a probability of 0.25, irrespectively of the glomerulus to which each PN belonged (red lines going beyond the dashed red circle in Figure 1A). PNs could feedback to LNs with a synaptic weight of 1.4 and probability of 0.15, as shown by the green arrows entering the dashed red circle in Figure 1A. This relatively sparse bidirectional connectivity between PNs and LNs ensured that not all PNs were inhibited during odor presentation, avoiding an exaggerated activation of the LN population at the same time (Chong et al., 2012). Synaptic weights of PN to PN and LN to LN connections were selected to reproduce the proportion of neurons responding with excitation/inhibition observed in the data (see below).
The values of synaptic weights and connection probabilities that we used in the model are biologically plausible. We selected them because they produced very sparse responses (involving less than 30% of the neuron population) with a proportion excitation/inhibition around 1.8:1, as observed in the physiological recordings (Kuebler et al., 2011). This ratio was particularly sensitive to the mean synaptic weight of lateral excitation and lateral inhibition. For uniglomerular PN to PN connection weight values of 0–0.3, we obtained ratios of around 2.5:1.0, while for larger weights the ratios decreased in a monotonic manner, reaching 1.0:1.0 for a weight of 0.6. In order to match the proportion observed in the recorded data we used a weight of 0.37, as indicated above. For multi-glomerular PN to PN connections, the proportion also decreased with an increase in weight, varying from 2.4:1.0 to 1.26:1.0 for weights of 1.0–1.5, so we chose the intermediate weight of 1.25 that matched the recordings. In the case of the LN to LN connections the proportion excitation/inhibition showed a U-shaped profile for a weight range from −4.0 (4.0:1.0) to −10.0 (2.2:1.0) with a minimum in −60 (1.5:1), and so we selected a weight of −8.0 that matched the ratio observed in the data (1.8:1.0). We did not optimize the parameters to match the proportions of blend interactions being the main focus of our study, which were indeed very robust to changes in the lateral excitation and to increases in the lateral inhibition. Some parameters were selected following a previous study (Chong et al., 2012), such as the probability of LN to LN contacts and uniglomerular PN to PN contacts, as well as the use of low levels of bidirectional coupling between PNs and LNs. Note that reliable estimates for these parameters are not available in the moth. Furthermore, the high dimensionality of our model prevents an exhaustive parameter search. Hence, even if our parameters are within a physiological range, we cannot rule out the existence of another physiologically plausible parameter set that also results in the 1.8:1 ratio between excited and inhibited responses.
Odor stimulus in the model
In line with the blends used in the physiological experiments, we considered odor stimuli to exist within a five-dimensional space (Q= 5), where each coordinate represents the concentration, ch, of a single chemical component, h. The network was stimulated independently with the single component odors, the homogeneous blend and the single component odors at blend concentration. Single component odorants had zero concentration for each odor dimension but one, such that the five separate stimulus vectors (q = 1,…, Q)
contain the components cqh = 0 for h ≠ j and chq = 1 for h = q. Thus, all component concentrations were normalised to one and dimensionless for simplicity. The homogeneous blend stimulus was defined as all components combined simultaneously, ch = 1 ∀ h, and the single component odors at blend concentrations were derived from the single component odors  . Thus, in total there are eleven concentration vectors, five single component odors,
  , the homogeneous blend concentration,
  , and the single component odors at blend concentration
  . The range of input concentrations used in the simulations (0–5) was selected to match the range used in the experiments.
OSN activation in response to stimulus presentation was calculated as follows. First, each OSN type odor dimension pair was assigned a binding value, a (analogous to affinity to quantify the strength of binding), drawn from a Gaussian distribution with mean 0.5 and standard deviation 0.1. These values characterise the binding strength of the different pure chemicals for each of the molecular receptor types. Then, for a given OSN type, the different input concentration vectors,  , were multiplied component by component with the binding values
  to obtain the binding vector
  . This scheme provided a plausible description of the typical binding properties found in insect olfaction systems (Hallem and Carlson, 2006), since it captures the common observation that generalist molecular receptors have variable affinity for many chemicals, and cases of very high or very low affinity are relatively rare among general odors.
For a given odor presented to the model, the eight binding vectors corresponding to each OSN type were merged into a matrix zdq of 40 numbers (five columns and eight rows), each specifying the binding of a given compound q (columns) to each of the OSN types d (rows). Each binding value zdq was then passed through a sigmoid function that represented the dose-response curve of OSN activity to a given component
to obtain a matrix rdq which specifies the activities of each OSN type due to each component. The parameters α, γ, η, and λ control the slope, horizontal shift, vertical shift, and amplitude of the sigmoid, respectively. For each element of the match in order to create a diversity of tunings, parameter values were drawn from uniform distributions in the range [0,5], [0,4], [0,0.1], and [0,1], respectively. In this way, we obtained 40 different sigmoid functions (corresponding to each element of the matrix) that were used to calculate the output activity of each receptor type d due to the binding of each chemical q. Receptor activations for each OSN type d were obtained by summing the columns of the matrix rdq. The sigmoid functions were different for different odorants across the receptor types (Hallem and Carlson, 2006).
Since we did not want to generate non-linearities in the OSN response to blends at the periphery level, we assumed a linear summation in OSN activities of the blend components. Thus, the columns of this matrix were summed linearly rd = ∑q rdq to obtain an eight-dimensional vector with the total activity of each receptor type which was the actual input from the OSNs to the PNs and LNs of the model (see Equation 1). It has been reported by Rospars et al. (2008), that certain type of competitive scheme may occur in around half of the receptors, while others show more complex allosteric interactions. However, since many details of the periphery function are still unknown in the moth, we did not want to add further hypothetical non-linear behaviors at the receptor level of our model, because they would obscure our assessment of the interaction types at the neuronal and network levels. In addition, this generalization makes the model more generally applicable for other non-moth systems.
When a stimulus was present, we added a small positive offset to OSN activations. This offset (set to 1.0) represents the recruitment of non-specific OSNs which activate at very low concentration and was assumed to be equal for each glomerulus for simplicity. For no binding at the input, the values of d were small positive numbers, simulating some degree of spontaneous discharge in the OSNs (Hallem et al., 2004). Notice that we are modeling the receptor activity at a population level and the magnitudes are dimensionless. The parameter ranges were adjusted qualitatively to obtain a family of sigmoid functions that produced similar dose-response curves in terms of dynamic range (up to 3 log units), sensitivity, and response intensity axes to those found experimentally using optical recordings (Carlsson and Hansson, 2003). This scheme resulted in very little blend interactions at the OSN level (see “High correlation in blend interaction types between physiological data and computational model”), which is in agreement with recent observations performed using optical recordings (Kuebler et al., 2012).
Procedure to Compute the Blend Interactions
The procedure used to determine the proportions of blend interactions in the response of single neurons was the same for the model simulations and the AL intracellular recordings, using only the neurons that responded to the stimulus. The stimulation was performed with the single components, the homogeneous blend, and the single components at blend concentration, using a stimulus pulse that lasted for 500 ms. Responsive neurons were then classified according to the relationship between the blend response and the responses to single components. Briefly, the maximum and the standard deviation of the responses to single components (maxS, σS) and to single components at blend concentration (maxSB, σSB) were computed. Then, classification was performed as follows: (1) suppression: blend response < maxS − σS, (2) hypoadditivity: maxS − σS < blend response < maxS + σS, (3) linear addition: maxS + σS < blend response < max(maxS + σS, maxSB + σSB), and (d) synergy: blend response > max(maxS + σS, maxSB + σSB).
The index of cell activity used to quantify the response in the recordings was the mean firing rate. In the case of the model we used the mean of the activity variable (see “Neuronal model”) which ranges from 0 to 1. In both cases, we compared the activity evoked by the stimulus with the activity of a control period before the stimulus onset. The response was taken as the difference between the activities in these two time windows. In the AL of the moth, some neurons exhibited biphasic responses, which consist of excitation followed by inhibition. Our model does not account for this response type, and we thus pooled neurons that responded with excitation with neurons that showed biphasic responses, since the latter also consist of a net increase in firing rate. Hence, we concentrated here on the mean values of the neuronal activity leaving the assessment of the dynamic patterns to be presented in a future study.
As explained above, we followed parallel procedures to calculate the proportions of blend interactions in the recordings and the simulations. In both cases, we assessed mean response intensity only, and not response duration. This is important because in the physiological data the response outlasted the stimulus, while in the model neurons are endowed with no intrinsic properties and thus the response ended with the stimulus offset. In order to account for the entire response period, the response of the model was considered to be the difference between the mean activity value in the 500 ms following and preceding the stimulus, while in the intracellular recordings the odorant response was assessed for 1400 ms following and preceding the stimulus onset. An assessment of the model with a stimulus lasting 1400 ms gave the same results as using 500 ms. In the model, a neuron was considered to be responsive when the difference in mean activity between the stimulus (with the blend or a single component at low concentration) and the control period exceeded a value of 0.1, which corresponds to 10% of the maximum activity value. This gives a response threshold that is close to one observed in the physiological data (Kuebler et al., 2011).
Results
High Correlation in Blend Interaction Types between Physiological Data and Computational Model
We performed 100 realizations of the computational model (network connectivity shown in Figure 1), each with different receptor binding matrices and sigmoidal functions for the model OSNs. Figure 2 displays raster plots of an example realization showing the activity of all cells during the stimulus with the homogeneous blend (panel A) and with a single odorant at the blend concentration (panel B).
The biological and computational comparisons of blend interactions were performed by selecting a set of synaptic weights and connection probabilities that allowed a biologically reflective sparsity in the AL neuronal response including an approximate ratio of 1.8:1.0 between neurons that responded with excitation and inhibition, as observed in the recordings (Kuebler et al., 2011). In both cases, excitation was more prevalent in LNs, while PNs exhibited similar levels of excitatory or inhibitory responses. For PNs, the proportion excitation/inhibition was 0.86:1.0 in the model and 1.3:1.0 in the recordings where 12 cells responded with excitation and nine with inhibition. For LNs, this proportion was 3.0:1.0 in the model and also 3.0:1.0 in the recordings where six LNs responded with excitation and two with inhibition.
Responses were classified into four types according to the activity of each neuron in response to the blend vs. its single components. When there is no interaction between the components, the response evoked by the blend is equal to the linear sum of the responses to the individual components. In the case of synergism, the response exceeds the linear sum. Suppression is a reduced response with respect to the single components, while in the case of hypoadditivity (often referred to as overshadowing or blocking) at least one of the components of the blend is ignored and the response resembles that of the most effective component.
The proportions of blend interaction types are shown in Figure 3 for neurons that respond with excitation (Figure 3A) and inhibition (Figure 3B). The blue columns represent the model results, while the red squares represent the values found in the experimental recordings of AL neurons. For both the recordings and the simulations, we found that most interactions between odorants were non-linear, and within the non-linear interactions hypoadditivity (blend response = single components) and suppression (blend response < single components) were more common than synergism (blend response > single components at blend concentrations). For the responses consisting of excitation (Figure 3A), the red squares are within the error bars of the blue columns, close to its mean value. This indicates a good agreement between the physiological data and the model. This is also the case for synergism and linear addition in the neurons that respond with inhibition (Figure 3B). However, in this case the model does not fit the experimental results for suppression and hypoadditivity but exhibits more of the former and less of the latter type of blend interaction than the physiology (Figure 3B). These two categories are both forms of suppression, and the sum of their relative observations (about 0.8) is equal between the recordings and the model (Figure 3B). We suspect that intrinsic neuronal properties that were not included in the model are responsible for this discrepancy, altering the response of the neurons in the vicinity of the threshold between both interaction types.
The results shown in Figure 3 did not change when we increased or decreased the weight of the lateral excitation or when we increased the weight of the lateral inhibition in the ranges specified in section “Network connectivity of the model”. For weaker lateral inhibition values, we observed an increase in linear addition accompanied with a decrease of the same magnitude (∼0.1) in suppression in the neurons that respond with excitation. Conversely, the proportion excitation/inhibition was very sensitive to variations in the values of these parameters (see “Network connectivity of the model”).
To assess whether the observed proportions of blend interaction types arose from the AL network (PNs and LNs) or from the OSN periphery of the model, we ran a separate simulation using a reduced version of the model. In this simulation, we suppressed all inhibitory and excitatory connections within the AL and the input/output function of PNs and LNs was linear [S(x) = x], so the output of an AL neuron was simply a linear function of the input received from the OSN periphery. Under these conditions, we observed that all responses consisted in excitation, resulting in linear addition for most AL neurons (for every LN and for ¾ of PNs), while the remaining cases showed hypoadditivity. This is in close agreement with experimental observations found with optical recordings of the compound input (Kuebler et al., 2012) and suggests that the periphery has little influence on AL blend interactions in the moth. The same result was found when we suppressed only the lateral inhibition (LN to LN and LN to PN connections) using S(x) = x/10 to avoid an explosion of excitation in the simulation. This means that the result depicted in the blue bars of Figure 3 arises principally from the AL network with a fundamental contribution made by the lateral inhibition. We also performed a control simulation with the full AL connectivity but using the linear input/output function S(x) = x (with negative values rectified to 0) and observed that the results of Figure 3 and the ratio excitation/inhibition were not significantly modified, implying that they are not due to the particular form of the non-linear squashing function used for AL neurons (see “Neuronal model”).
As explained in “Neuronal recordings and odor stimulation,” most of the recorded neurons (29 out of 31) could be classified as PNs or LNs (Kuebler et al., 2011). Using this classification, we compared the proportions of blend interaction types for PNs and LNs of different response types (Figure 4). Neurons that responded with excitation are depicted in panels A (PNs) and B (LNs), while neurons that responded with inhibition are depicted in panel C (PNs) and D (LNs). Despite the low cell numbers for the physiological measurements, we found that the model follows the trends observed in the recoded data for both PNs and LNs that responded with excitation (Figures 4A,B). In the case of PNs that respond with inhibition (Figure 4C) the model matched the proportions of the data only for synergism and linear addition. Comparing Figures 3 and 4 we can conclude that the differences found in the pooled data set (Figure 3) are still apparent when assessing PNs and LNs separately (Figure 4).
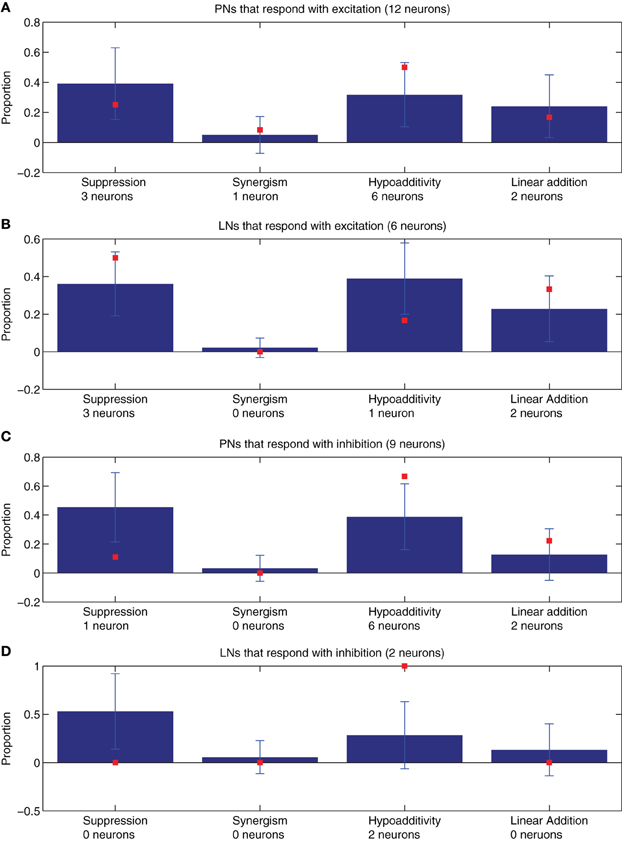
Figure 4. The proportions of blend interaction types found in 100 model realizations (μ ± SD, blue bars) are compared with the data values obtained from the experimental recordings of the neurons that could be successfully classified as PNs or LNs (N = 29 neurons, red squares). (A) PNs that respond with excitation (N = 12). (B) LNs that respond with excitation (N = 6). (C) PNs that respond with inhibition (N = 9). (D) LNs that respond with inhibition (N = 2). The number of neurons used to compute the proportions represented by the red squares are provided under their corresponding abscissa labels. For the model simulations of PNs that respond with excitation (blue bars in A) the neuron numbers were 397 for suppression, 306 for synergy, 240 for hypoadditivity, and 47 for linear addition. For the LNs that respond with excitation (blue bars in B) the neuron numbers were 504 for suppression, 516 for synergy, 306 for hypoadditivity, and 34 for linear addition. For the PNs that respond with inhibition (blue bars in C) the neuron numbers were 506 for suppression, 457 for synergy, 151 for hypoadditivity, and 42 for linear addition. For the LNs that respond with inhibition (blue bars in D) the neuron numbers were 116 for suppression, 63 for synergy, 28 for hypoadditivity, and 12 for linear addition.
In this work, as in previous experimental studies (Duchamp-Viret et al., 2003; Silbering and Galizia, 2007; Kuebler et al., 2011), blend interaction types (with the exception of synergy) were defined with respect to single component odors delivered at a concentration equal to the blend concentration divided by the number of single components tested (e.g., we used five components with blend concentration of five, resulting in a single concentration of 1). We also confirmed that the results presented in Figure 3 are similar for blends of 2–7 components, or for blend concentrations from 1.25 to 10. These alterations did, however, affect the proportion or excitation/inhibition, which could be compensated by altering the levels of lateral inhibition. Thus, although our model results in monotonous responses to changes in input concentration, more experimental data is necessary to evaluate the generalization of our simulations over a wide range of input concentrations.
In this subsection, we have shown that our computational model, with a parameter set calibrated in order to reproduce the proportion of excitation/inhibition and response sparsity found in the physiological recordings, can also reproduce the proportions of blend interactions types without any additional tuning. While the model matches the data remarkably well for neurons that respond with excitation, hypoadditivity was underestimated and suppression was overestimated in neurons that responded with inhibition, although the sum of their relative observations was matched. Under these conditions of biologically plausible synaptic interactions, we assess in the following how blend coding is shaped by the different sources of synaptic input received by individual AL neurons.
LN Input Shapes Blend Interactions and Response Types in AL
Our goal was to understand how the different types of responses and blend interactions emerged in the AL network. Hence, we analyzed the synaptic inputs to AL neurons and their changes as the stimulus was varied. In Figure 5A we plot the difference in total synaptic input between the blend stimulation period and the pre-stimulation period, multiplied by the corresponding synaptic weights for different response categories in the model. This magnitude is referred to as synaptic input. As expected, neurons that responded with excitation experienced an increase in net input with blend stimulation, while neurons that responded with inhibition showed a decrease in their net input (Figure 5A).
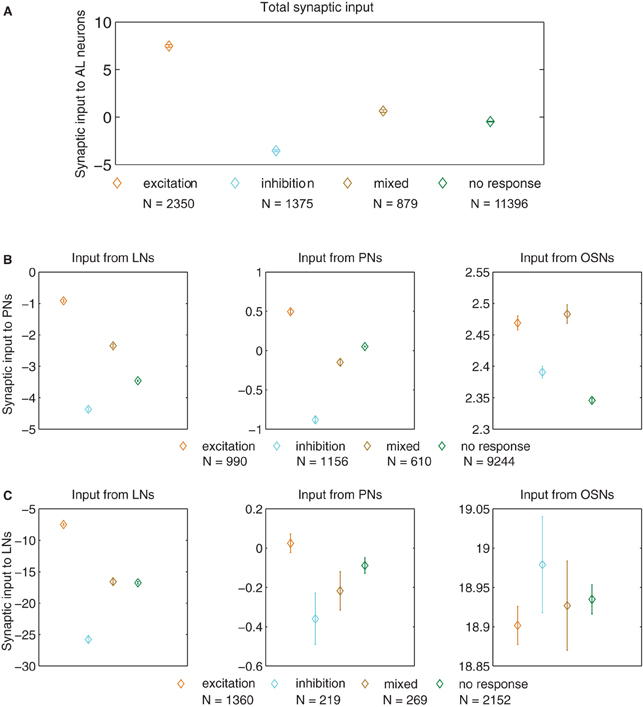
Figure 5. Synaptic input (defined as the difference in input between the blend stimulation period and the pre-stimulation control period, multiplied by the corresponding synaptic weights) for neurons of different response type (μ ± SEM for 100 model realizations). (A) Total input to AL neurons. All comparisons reached p < 1 × 10⁻⁶ in the t-test after Bonferroni correction, the most important result being responses consisting of excitation vs. inhibition (orange and cyan diamonds). In panels B and C, we show the input arriving from different types of neurons (LNs, PNs, and OSNs) to AL neurons (PNs and LNs). (B) Input to PNs arriving from LNs (left panel), PNs (middle panel), and OSNs (right panel). (C) Input to LNs arriving from LNs (left panel), PNs (middle panel), and OSNs (right panel). The p values for cases in which we found significant differences in the t-test (p ≤ 0.01, after Bonferroni correction) are listed in the following, the most important result being responses consisting of excitation vs. inhibition (orange and cyan diamonds). For the input from LNs to PNs (left panel of B) all comparisons reached p < 1 × 10⁻⁶. For the input from PNs to PNs (middle panel of B) comparisons reached p < 1 × 10⁻⁶. For the input from OSNs to PNs (right panel in B) excitation vs. inhibition p < 1 × 10⁻⁶, excitation vs. no response p < 1 × 10⁻⁶, inhibition vs. mixed response p < 1 × 10⁻⁶, inhibition vs. no response p < 2 × 10⁻⁵, and mixed vs. no response p < 1 × 10⁻⁶. For the input from LNs to LNs (left panel in C) all comparisons reached p < 1 × 10⁻⁶, with the only exception of mixed vs. no response that was not significant.
Figures 5B and C display the synaptic input arriving from the LNs (left panels), PNs (middle panels), and OSNs (right panels) to the PNs (Figure 5B), and LNs (Figure 5C). For both cell types, changes in lateral inhibition were the main determinants of response type. In the case of PNs, however, other PNs and OSNs also contributed to the response. In the case of LNs (Figure 5C) the only relevant input arrived from other LNs, with no significant contribution carried by the input arriving from PNs and OSNs (middle and right panels in Figure 5C).
As interaction types are defined by the relation between the blend response and the responses to the single components, we performed a similar analysis on the synaptic inputs to each neuron considering the difference between the input during blend stimulation and the mean input during single component presentations. This magnitude, referred as change in synaptic input, was calculated as the difference between the blend and the average single components at low concentration, multiplied by the corresponding synaptic weights (Figures 6–8). In Figure 6 we depict the total change in synaptic input for neurons that respond with excitation (Figure 6A) and inhibition (Figure 6B), irrespective of their neuronal type (PNs or LNs). The following two figures unfold this result separating PNs from LNs and specifying the different sources of input. In Figure 7 we show neurons that respond with excitation (PNs in Figure 7A and LNs in Figure 7B), while in Figure 8 we show neurons that respond with inhibition (PNs in Figure 8A and LNs in Figure 8B).
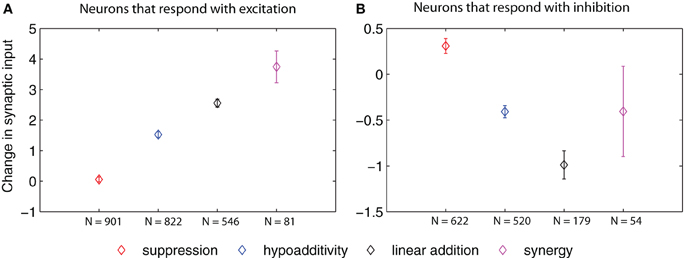
Figure 6. Change in synaptic input (defined as the difference in input between the blend response and the average response to the single components at low concentration, multiplied by the corresponding synaptic weights) for AL neurons of different blend interaction types (μ ± SEM for 100 model realizations). (A) Total change in synaptic input arriving to neurons that respond with excitation. (B) Total change in synaptic input arriving to neurons that respond with inhibition. The p values for cases in which we found significant differences in the t-test (p ≤ 0.01, after Bonferroni correction) are listed in the following. In panel A: suppression vs. hypoadditivity p < 1 × 10⁻⁶; suppression vs. linear addition p < 1 × 10⁻⁶; suppression vs. synergy p < 1 × 10⁻⁶; hypoadditivity vs. linear addition p = < 1 × 10⁻⁶, hypoadditivity vs. synergy p < 1 × 10⁻⁶. In panel B: suppression vs. hypoadditivity p < 1 × 10⁻⁶; suppression vs. linear addition p < 1 × 10⁻⁶; hypoadditivity vs. linear addition p = 3.8 × 10⁻⁴.
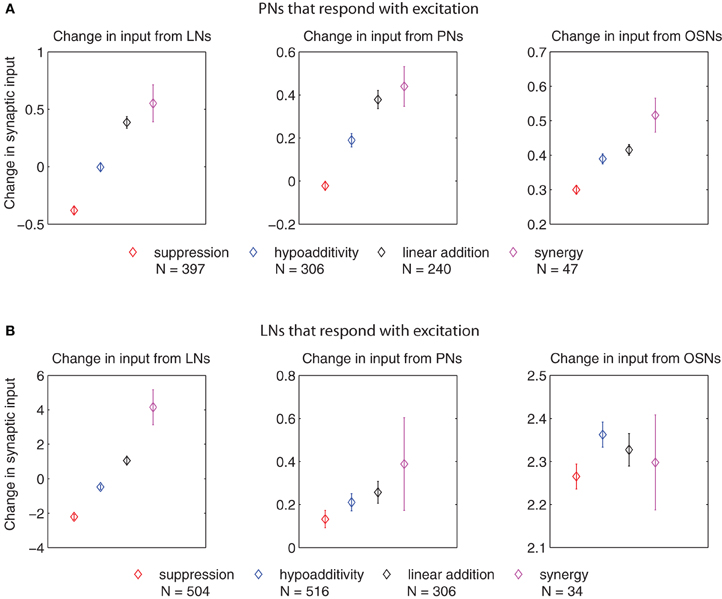
Figure 7. Change in synaptic input (defined as the difference in input between the blend response and the average response to the single components at low concentration, multiplied by the corresponding synaptic weights) for PNs and LNs that respond with excitation of different blend interaction types (μ ± SEM for 100 model realizations). (A) Change in input to PNs arriving from LNs (left panel), PNs (middle panel), and OSNs (right panel). (B) Change in input to LNs arriving from LNs (left panel), PNs (middle panel), and OSNs (right panel). The p values for cases in which we found significant differences in the t-test (p ≤ 0.01, after Bonferroni correction) are listed in the following. For the change in input arriving from LNs to PNs that respond with excitation (left panel in A): suppression vs. hypoadditivity p < 1 × 10⁻⁶; suppression vs. linear addition p < 1 × 10⁻⁶, suppression vs. synergy p < 1 × 10⁻⁶; hypoadditivity vs. linear addition p < 1 × 10⁻⁶; hypoadditivity vs. synergy p = 1 × 10⁻⁶. For the change in input arriving from PNs to PNs that respond with excitation (middle panel in A): suppression vs. hypoadditivity p < 1 × 10⁻⁶; suppression vs. linear addition p < 1 × 10⁻⁶; suppression vs. synergy p < 1 × 10⁻⁶; hypoadditivity vs. linear addition p < 1.41 × 10⁻³. For the change in input arriving from OSNs to PNs that respond with excitation (right panel in A) suppression vs. hypoadditivity p = 2.8 × 10⁻⁵; suppression vs. linear addition p < 1 × 10⁻⁶; suppression vs. synergy p = 1 × 10⁻⁶. For the change in input arriving from LNs to LNs that respond with excitation (left panel in B): suppression vs. hypoadditivity p < 1 × 10⁻⁶; suppression vs. linear addition p < 1 × 10⁻⁶; suppression vs. synergy p < 1 × 10⁻⁶; hypoadditivity vs. linear addition p = < 1 × 10⁻⁶, hypoadditivity vs. synergy p < 1 × 10⁻⁶, linear addition vs. synergy p = 7.9 × 10⁻⁵.
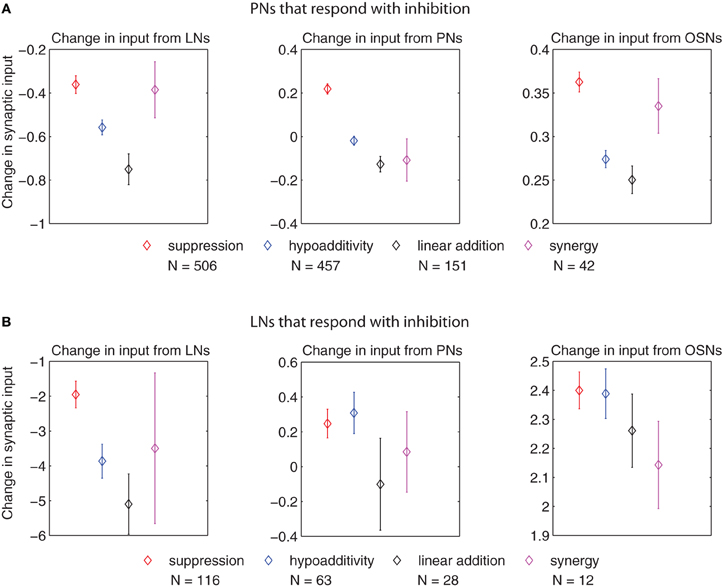
Figure 8. Change in synaptic input (defined as the difference in input between the blend response and the average response to the single components at low concentration, multiplied by the corresponding synaptic weights) for PNs and LNs that respond with inhibition of different blend interaction types (μ ± SEM for 100 model realizations). (A) Change in input to PNs arriving from LNs (left panel), PNs (middle panel), and OSNs (right panel). (B) Change in input to LNs arriving from LNs (left panel), PNs (middle panel), and OSNs (right panel). The p values for cases in which we found significant differences in the t-test (p ≤ 0.01, after Bonferroni correction) are listed in the following. For the change in input arriving from LNs to PNs that respond with inhibition (left panel in A): suppression vs. hypoadditivity p = 1.64 × 10⁻³; suppression vs. linear addition p = 2.9 × 10⁻⁵. For the change in input arriving from PNs to PNs that respond with inhibition (middle panel in A): suppression vs. hypoadditivity p < 1 × 10⁻⁶; suppression vs. linear addition p < 1 × 10⁻⁶; suppression vs. synergy p = 9.78 × 10⁻⁴. For the change in input arriving from OSNs to PNs that respond with inhibition (right panel in A): suppression vs. hypoadditivity p < 1 × 10⁻⁶; suppression vs. linear addition p = 6 × 10⁻⁶. For the change in input arriving from LNs to LNs that respond with inhibition (left panel in B): suppression vs. linear addition p = 3.3 × 10⁻³.
Figure 6 shows that the change in total input grew in the order: suppression, hypoadditivity, and linear addition in neurons that responded with excitation (Figure 6A), and it decreased following the same sequence in the case of neurons that responded with inhibition (Figure 6B).
Figure 7 shows that the input change arriving from LNs to LNs that responded with excitation (left panel in Figure 7B) grew monotonically from suppression to synergy, creating the image of an ascending ladder. A similar picture applies for the input change arriving from the LNs to the PNs that responded with excitation (left panel in Figure 7A), although in this case linear addition and synergy (the last step of the ladder) were not significantly different. This suggests that a stronger lateral inhibition in response to the blend established suppression, while small changes and decreases in lateral inhibition resulted in hypoadditivity and linear addition (or synergy), respectively. The change in input arriving from PNs to PNs that responded with excitation (middle panel in Figure 7A) again created the trend of an ascending ladder with a missing last step. This is not the case for the change in input arriving from PNs to LNs that responded with excitation (middle panel in Figure 7B) where no significant differences were found. Regarding the input change from OSNs, a decrease for PNs that responded with excitation (right panel in Figure 7A) established suppression, but there were no significant differences in input changes from OSNs to LNs that responded with excitation for any interaction type (right panel in Figure 7B).
Figure 8 shows that the change in input establishing suppression for responses consisting of inhibition likewise tended to differ from that establishing the other interactions types. For PNs that responded with inhibition (left panel in Figure 8A) the input change from LNs in establishing suppression was greater than both hypoadditivity or linear addition. This situation repeated for the input from OSNs to PNs that responded with inhibition (right panel in Figure 8A). For the input from PNs to PNs that responded with inhibition, the input change creating suppression was greater than in the other three categories (middle panel in Figure 8A). For the input from LNs to LNs that responded with inhibition the input change creating suppression was greater than linear addition (left panel in Figure 8B), but no significant differences were found in the input changes from PNs and OSNs to LNs (middle and right panels in Figure 8B). The increased change in synaptic input that created suppression for responses consisting of inhibition resulted from both a decreased inhibition coming from the LNs, and a stronger excitation coming from the OSNs and PNs.
In summary, Figures 7 and 8 indicate that blend interactions were shaped mainly by the input changes coming from LNs in all AL cells of the model, with an agonistic contribution of smaller magnitude from PNs and OSNs in the case of PNs.
Discussion
Comparison of Blend Interactions in the Model and Recordings
The proportions of non-linear blend interaction types observed in the biological data were accurately predicted by the simulation results in most cases. The matching is almost perfect for neurons that respond with excitation. For neurons that respond with inhibition, a good agreement was found for synergism and linear addition, while in the case of suppression and hypoadditivity the model could only match the sum of both categories, but not the actual proportions of each. Both hypoadditivity and suppression are forms of suppressive interactions (Kuebler et al., 2011), hence this discrepancy is quantitative rather than qualitative. Future research can elucidate whether more realistic single-cell properties, or the presence of inhibitory responses at the OSN level (e.g., Hallem and Carlson, 2006) could result in a better match. Indeed, the high correlation between the model and the physiological data is surprising considering the simplicity of the model employed, and must therefore originate in the morphologically based pattern of neuronal population interactions. As stated in section “High correlation in blend interaction types between physiological data and computational model”, the neuronal activation function S(x) (Chong et al., 2012) is not responsible for the proportions of blend interactions observed in Figure 3, which are also found to hold over a wide dynamic range of stimulus. This type of non-linearity is widely used in the field of computational neuroscience and is in agreement with most observations of the activation profile in real neurons.
Our computational model of the AL comprises many levels of biological organization, from the OSN periphery to the network architecture, including the neuronal model and synaptic interactions. We used probabilistic connectivity to create random networks that operate in a balanced regime, with strong excitation and strong inhibition that approximately compensate each other, which is a reasonable strategy considering that the details of the local synaptic efficacy that operates in the biological system are unknown. This allows to reproduce the proportion of the different interaction type even when some key parameters (such as the lateral excitation and lateral inhibition synaptic weights; see “Network connectivity of the model”) are varied in a relatively broad range. Whenever possible, morphological and physiological data were used to constrain the model, but in some cases simplifying assumptions had to be made due to the lack of sufficient experimental evidence. In such cases we adopted decisions that were plausible or based on previous literature. For the periphery, a linear combination of ingredients was used because it is the simplest assumption and no information is available about this issue in the moth. The neuronal and synaptic models were taken from a previous modeling study (Chong et al., 2012), and the probabilistic rules used to set the network structure were based on morphological studies (Kuebler et al., 2011, and references therein). The parameters are biologically plausible and allow us to reproduce the excitation/inhibition ratio and response sparsity observed in the recordings. Our results are based on the average behavior of 100 networks generated with probabilistic connectivity rules, hence the possibility that they rely on a specific value for one or more of the non-ranged, fixed parameters is extremely unlikely. The general agreement between the proportions of blend interactions in the simulations and the recordings was not calibrated into the model but arises as a purely emergent phenomenon. This predictive power strongly indicates that the model describes the mean responses of AL neurons to both pure chemicals and odor blends in a physiologically relevant manner, capturing the working principles of the AL network to a considerable extent.
In the following, we discuss the role of synaptic input within the network in determining the type of response and blend interaction displayed by individual neurons of the model. Our analysis is restricted to the mean values of neural activity during the odor stimulus and control period, leaving the influence of the dynamic patterns to be presented in a separate study.
Synaptic Input, Response Types, and Blend Interactions in the Computational Model
Neurons that respond with excitation undergo an increase in net synaptic input in response to blend stimulation, while neurons that respond with inhibition experience a decrease in their input, as expected (Figure 5A). Individual neurons are implemented as leaky integrators, hence they can only increase (decrease) their activation if their input increases (decreases). A more surprising result is that the difference in total input depicted in Figure 5A is determined mainly by the input arriving from the LNs (Figures 5B,C). The LNs that respond with inhibition do so because they received a very strong inhibition from other LNs, and not less excitation from the PNs and OSNs. The LNs that respond with excitation do so because they received weaker inhibition from the LNs and not larger excitation from the PNs and OSNs (Figure 5C). In the case of the PNs, the response consisting of inhibition was built up by a very strong inhibition from LNs combined with a weaker excitation from PNs and OSNs, while for the response consisting of excitation a weaker inhibition from LNs was combined with a stronger excitation from PNs and OSNs (Figure 5B). To summarize this first finding, we can state that the response type of all neurons depends on the change in LN input in response to olfactory stimulation, with an agonistic contribution of smaller magnitude coming from the PN and OSN input in the case of PNs.
The second finding in our assessment of the pre-synaptic activity (Figures 6, 7, and 8), is that the change in synaptic input from the LNs is key to determining the type of blend interaction shown by a neuron (PN or LN). In the particular case of LNs that respond with excitation, the change in input from other LNs is the only determinant of the blend interaction type, with suppression receiving the largest amount of inhibition (i.e., lower input value) followed by hypoadditivity, linear addition, and synergy in a sequence of decreasing inhibition. A similar situation holds for PNs that respond with excitation, where this sequence starts in suppression, continues with hypoadditivity, and ends with linear addition (without including synergy). However, the change in input arriving from other PNs also contributes to determine the blend interaction type through an excitation drive that progressively grows in the sequence suppression, hypoadditivity, linear addition, and synergy. In addition, the change in input from OSNs to PNs is smaller in suppression than in the other categories, creating an additional influence that adds agonistically with the input from the LNs and PNs. In the case of neurons that respond with inhibition we can also recognize a key role of the LNs, although in this case it is mainly to determine the difference between suppression and other categories, without the sequence mentioned above. Again, for LNs that respond with inhibition the only significant influence is the one coming from other LNs, while for PNs that respond with inhibition the change in input arriving from PNs and OSNs combines in an agonistic manner with the change in LN input to determine whether the interaction type will be suppression or not. From the three agonistic influences observed in PNs that respond with excitation and inhibition, the one coming from the LNs is stronger as it can be seen in the scales of ordinates in the Figures 7 and 8.
As a summary of our synaptic analysis, we can state that the input changes coming from LNs, PNs, and OSNs drive the membrane potential of the PN output from the AL in an agonistic manner that determines the type of blend interaction that they display. In the case of the LNs, the only significant input is the one arriving from other LNs. Suppressive interactions in neurons that respond with excitation are associated with smaller changes in synaptic input than the other types of blend interaction, while the opposite holds for neurons that respond with inhibition.
The observed proportions of blend interactions types were robust to changes in lateral excitation, but were affected by decreases in the weight of lateral inhibition. The fact that less LN to LN coupling decreased the proportion of suppression (increasing linear addition by a similar amount; see “High correlation in blend interaction types between physiological data and computational model”) in neurons that respond with excitation makes sense on the light of the analysis presented in Figure 7B (left panel), as suppressive interactions are associated with negative values of synaptic input change from LNs. Thus, lateral inhibition appears to be playing a more important role than the lateral excitation (mediated by the PN to PN connectivity) in the shaping of blend interactions types. This agrees with the results of the honey bee modeling studies of Linster and Smith (1997) for suppression and hypoadditivity (referred in Linster's study as blocking and overshadowing, respectively) and Schmuker et al. (2011) who showed that strong lateral inhibition can result in suppressive mixture coding, allowing good odor discrimination in the PNs of the lateral antenno-cerebral tract. Our results suggest that lateral inhibition is also very important for the emergence of linear addition and synergism in the case of the neurons that respond with excitation (left panels in Figures 7A,B), since these interaction types are associated with a larger input change arriving from LNs. Behavioral studies have shown that GABAA antagonists disrupt odor discrimination (Mwilaria et al., 2008) and the bursting response pattern of PNs associated with odor source location (Lei et al., 2009) in M. sexta. This indicates that pharmacological or genetic manipulation of the interneuron network of the moth would result in a severe reduction in non-linear interactions to blends, as has been observed for mixture suppression in the PNs of Drosophila after picrotoxin application (Silbering and Galizia, 2007). This type of experiments, combined with simultaneous multi-unit and optical recordings that assess a greater proportion of the AL network, would be key to elucidating the nature of AL blend processing mechanisms in the future.
Relation with Previous Experimental and Modeling Studies
The results of this computational study provide important global insights into the biological network that are difficult to uncover empirically through current physiological methods. Comparative analyses across several species suggest that odor blends are coded at the first processing stage in a spatiotemporal fashion (for review see Lei and Vickers, 2008) defined by a stereotyped spatial pattern (Galizia and Roessler, 2010), different response onsets (Krofczik et al., 2008), and synchronous ensemble firing patterns (Riffell et al., 2009a,b). However, the close agreement between our neuromorphic model and the electrophysiological data suggests that the connectivity pattern of input OSNs, interglomerular LNs, and output PNs is itself sufficient to confer the level of blend interactions exhibited by the AL. This implies that other cellular characteristics relating to the firing and spatiotemporal dynamics of AL neurons are not obligatory to establish the non-linearity of blend processing witnessed in other electro- and optophysiological analyses of insects (Carlsson et al., 2005; Deisig et al., 2006; Pinero et al., 2008; Silbering et al., 2008; Riffell et al., 2009a). This result is particularly surprising considering the highly reduced assumptions made in our model that do not consider cellular and network properties such as excitatory interneuron synapses (Shang et al., 2007), heterogeneity of interneuron branching (Fonta et al., 1993), and additional electric coupling between glomeruli (Yaksi and Wilson, 2010).
Further examination of the synaptic interactions in the model reveals that the source of the non-linear processing is due in large part to the interneurons within the network. Such a result is reasonable when one considers the broadly tuned nature of the input to the AL. A blend response results from the activity of several OSNs with different affinities and responses to odor components (Hallem et al., 2004; Hallem and Carlson, 2006). As receptor neurons expressing the same receptor innervate the same glomerulus in the AL (Ressler et al., 1994; Mombaerts, 1996; Vosshall, 2000), some form of interglomerular connectivity is imperative for accurate blend representation, and any apparent non-linearity is subsequently the result of such interconnectivity. Indeed, recent physiological studies in flies (Silbering et al., 2008) and bees (Deisig et al., 2006) have highlighted the vital role of the interneuron network in conferring blend non-linearity. Moreover, the importance of inhibitory sub-networks in shaping the activity of excitatory neurons and synchronous firing is widely recognized in the field of sensory perception [e.g., see Assisi et al., 2011; but note the recent study of Daly et al. (2011) in M. sexta], and our study suggests it is also vital for neural encoding of complex odor blends.
Interestingly, the output of the network, relayed by PNs, is ultimately influenced by synaptic input from all three types of AL neurons. This indicates that the final representation of a blend is a composite of all possible interactions within the AL. This also indicates that any blend non-linearities already present at the periphery (not included here but implied by other studies: Carlsson and Hansson, 2002; Hillier and Vickers, 2011; Su et al., 2011) may significantly impact the resultant output from the AL. Additional modulation between PNs (either within or between glomeruli) further modifies the output and creates the ultimate “blend percept” (Kuebler et al., 2011).
Our results suggest that the non-linear processing establishing the unique “blend percept” within the AL can result from network interactions, without the need of intrinsic neuronal properties in the cells within that network. Our findings highlight that such mixture interactions are a natural outcome of the architecture of the AL, and reveal its important role in shaping the perception of olfactory information in the CNS. By design, the AL is not merely a relay station for olfactory information, but filters and processes multicomponent information into a unique representation that reduces signal dimensionality for subsequent processing in the CNS.
Conflict of Interest Statement
The authors declare that the research was conducted in the absence of any commercial or financial relationships that could be construed as a potential conflict of interest.
Acknowledgments
This research was supported by EU 6th Framework Programme FET Project iCHEM and the Max Planck Society. The authors want to thank Dr. Manuel Montanes for his useful comments and suggestions.
References
Assisi, C., Stopfer, M., and Bazhenov, M. (2011). Using the structure of inhibitory networks to unravel mechanisms of spatiotemporal patterning. Neuron 69, 373–386.
Baker, T. C. (2008). Balanced olfactory antagonism as a concept for understanding evolutionary shifts in moth sex pheromone blends. J. Chem. Ecol. 34, 971–981.
Bruyne, M., and Baker, T. C. (2008). Odor detection in insects: volatile codes. J. Chem. Ecol. 34, 882–897.
Carlsson, M. A., Chong, K. Y., Daniels, W., Hansson, B. S., and Pearce, T. C. (2007). Component information is preserved in glomerular responses to binary odor mixtures in the moth Spodoptera littoralis. Chem. Senses 32, 433–443.
Carlsson, M. A., and Hansson, B. S. (2002). Responses in highly selective sensory neurons to blends of pheromone components in the moth Agrotis segetum. J. Insect Physiol. 48, 443–451.
Carlsson, M. A., and Hansson, B. S. (2003). Dose-response characteristics of glomerular activity in the moth antennal lobe. Chem. Senses 28, 269–278.
Carlsson, M. A., Knusel, P., Verschure, P. F. M. J., and Hansson, B. S. (2005). Spatio-temporal Ca2+ dynamics of moth olfactory projection neurones. Eur. J. Neurosci. 22, 647–657.
Chong, K. Y., Capurro, A., Karout, S., and Pearce, T. C. (2012). Stimulus and network dynamics can collide in a ratiometric model of the antennal lobe macroglomerular complex. PLoS One 7:e29602. doi: 10.1371/journal.pone.0029602
Christensen, T. A., Mustaparta, H., and Hildebrand, J. G. (1991). Chemical communication in heliothine moths. II. Central processing of intraspecific and interspecific olfactory messages in the male cOSN earworm moth, Helicoverpazea. J. Comp. Physiol. A 169, 259–274.
Daly, K. C., Galán, R. F., Peters, O. J., and Staudacher, E. M. (2011). Detailed characterization of local field potential oscillations and their relationship to spike timing in the antennal lobe of the moth Manduca sexta. Front. Neuroeng. 4:12. doi: 10.3389/fneng.2011.00012
Deisig, N., Giurfa, M., Lachnit, H., and Sandoz, J. C. (2006). Neural representation of olfactory mixtures in the honeybee antennal lobe. Eur. J. Neurosci. 24, 1161–1174.
Deisig, N., Giurfa, M., and Sandoz, J. C. (2010). Antennal lobe processing increases separability of odor mixture representations in the honeybee. J. Neurophysiol. 103, 2185–2194.
Duchamp-Viret, P., Duchamp, A., and Chaput, M. (2003). Single olfactory sensory neurons simultaneously integrate the components of an odour mixture. Eur. J. Neurosci. 18, 2690–2696.
Fernandez, P. C., Locatelli, F. F., Person-Rennell, N., Deleo, G., and Smith, B. H. (2009). Associative conditioning tunes transient dynamics of early olfactory processing. J. Neurosci. 29, 10191–10202.
Fonta, C., Sun, X., and Masson, C. (1993). Morphology and spatial distribution of bee antennal lobe interneurones responsive to odours. Chem. Senses 18, 101–119.
Galizia, C., and Menzel, R. (2001). The role of glomeruli in the neural representation of odours: results from optical recording studies. J. Insect Physiol. 47, 115–130.
Galizia, C. G., and Roessler, W. (2010). Parallel olfactory systems in insects: anatomy and function. Annu. Rev. Entomol. 55, 399–420.
Grosse-Wilde, E., Kuebler, L. S., Bucks, S., Vogelb, H., Wichera, D., and Hansson, B. S. (2011). Antennal transcriptome of Manduca sexta. Proc. Natl. Acad. Sci. U.S.A. 108, 7449–7454.
Hallem, E. A., and Carlson, J. R. (2006). Coding of odors by a receptor repertoire. Cell 125, 143–160.
Hallem, E. A., Ho, M. G., and Carlson, J. R. (2004). The molecular basis of odor coding in the Drosophila antenna. Cell 117, 965–979.
Hansson, B. S., and Anton, S. (2000). Function and morphology of the antennal lobe: new developments. Annu. Rev. Entomol. 45, 203–231.
Hillier, N. K., and Vickers, N. J. (2011). Mixture interactions in moth olfactory physiology: examining the effects of odorant mixture, concentration, distal stimulation, and antennal nerve transection on sensillar responses. Chem. Senses 36, 93–108.
Homberg, U., Christensen, T., and Hildebrand, J. (1989). Structure and function of the deutocerebrum in insects. Annu. Rev. Entomol. 34, 477–501.
Homberg, U., Montague, R. A., and Hildebrand, J. G. (1988). Anatomy of antenno-cerebral pathways in the brain of the sphinx moth Manduca sexta. Cell Tissue Res. 254, 255–281.
Huang, J., Zhang, W., Qiao, W., Hu, A., and Wang, Z. (2010). Functional connectivity and selective odor responses of excitatory local interneurons in Drosophila antennal lobe. Neuron 67, 1021–1033.
Joerges, J., Küttner, A., Galizia, C., and Menzel, R. (1997). Representations of odours and odour mixtures visualized in the honeybee brain. Nature 387, 285–288.
Krofczik, S., Menzel, R., and Nawrot, M. P. (2008). Rapid odor processing in the honeybee antennal lobe network. Front. Comput. Neurosci. 2:9. doi: 10.3389/neuro.10.009.2008
Kuebler, L. S., Olsson, S. B., Weniger, R., and Hansson, B. S. (2011). Neuronal processing of complex mixtures establishes a unique odor representation in the moth antennal lobe. Front. Neural Circuits 5:7. doi: 10.3389/fncir.2011.00007
Kuebler, L. S., Schubert, M., Karpati, Z., Hansson, B. S., and Olsson, S. B. (2012). Antennal lobe processing correlates to moth olfactory behavior. J. Neurosci. 32, (in press).
Laing, D. G., Panhuber, H., and Slotnik, B. M. (1989). Odour masking in the rat. Physiol. Behav. 45, 689–694.
Lei, H., Riffel, J. A., Gage, S. L., and Hildebrand, J. G. (2009) Contrast enhancement of stimulus intermittency in a primary olfactory network and its behavioral significance. J. Biol. 8, 21.1–21.16.
Lei, H., and Vickers, N. (2008). Central processing of natural odor mixtures in insects. J. Chem. Ecol. 34, 915–927.
Linster, C., and Cleland, T. A. (2010). Decorrelation of odor representations via spike timing-dependent plasticity. Front. Comput. Neurosci. 4:157. doi: 10.3389/fncom.2010.00157
Linster, C., Sachse, S., and Galizia, C. G. (2005). Computational modeling suggests that response properties rather than spatial position determine connectivity between olfactory glomeruli. J. Neurophysiol. 93, 3410–3417.
Linster, C., and Smith, B. H. (1997). A computational model of the response of honey bee antennal lobe circuitry to odor mixtures: overshadowing, blocking and unblocking can arise from lateral inhibition. Behav. Brain Res. 87, 1–14.
Martin, J. P., Beyerlein, A., Dacks, A. M., Reisenman, C. E., Riffell, J. A., Lei, H., and Hildebrand, J. G. (2011). The neurobiology of insect olfaction: sensory processing in a comparative context. Prog. Neurobiol. 95, 427–447.
Matsumoto, S., and Hildebrand, J. (1981). Olfactory mechanisms in the moth Manduca sexta: response characteristics and morphology of central neurons in the antennal lobes. Proc. R. Soc. Lond. B Biol. Sci. 213, 249–277.
Meyer, A., and Galizia, C. G. (2011) Elemental and configural olfactory-coding by antennal lobeneurons of the honey bee (Apis mellifera). J. Comp. Physiol. A 198, 159–171.
Mwilaria, E. K., Ghatak, C., and Daly, K. C. (2008). Disruption of GABAA in the insect antennal lobe generally increases odor detection and discrimination thresholds. Chem. Senses 33, 267–281.
Olsson, S., Kuebler, L., Veit, D., Steck, K., Schmidt, A., Knaden, M., and Hansson, B. (2011). A novel multicomponent stimulus device for use in olfactory experiments. J. Neurosci. Methods 195, 1–9.
Pinero, J. C., Galizia, C. G., and Dorn, S. (2008). Synergistic behavioral responses of female oriental fruit moths (Lepidoptera:Tortricidae) to synthetic host plant-derived mixtures are mirrored by odor-evoked calcium activity in their antennal lobes. J. Insect Physiol. 54, 333–343.
Rabinovich, M., Huerta, R., and Laurent, G. (2008). Transient dynamics for neural processing. Science 321, 48–50.
Reisenman, C. E., Dacks, A. M., and Hildebrand, J. G. (2011) Local interneuron diversity in the primary olfactory center of the moth Manduca sexta. J. Comp. Physiol. A 197, 653–665.
Ressler, K. J., Sullivan, S. L., and Buck, L. B. (1994). A molecular dissection of spatial patterning in the olfactory system. Curr. Opin. Neurobiol. 4, 588–596.
Riffell, J. A., Lei, H., Christensen, T. A., and Hildebrand, J. G. (2009a). Characterization and coding of behaviorally significant odor mixtures. Curr. Biol. 19, 335–340.
Riffell, J. A., Lei, H., and Hildebrand, J. G. (2009b). Neural correlates of behavior in the moth Manduca sexta in response to complex odors. Proc. Natl. Acad. Sci. U.S.A. 106, 19219–19226.
Rospars, J. P., Lansky, P., Chaput, M., and Duchamp-Viret, P. (2008). Competitive and noncompetitive odorant interactions in the early neural coding of odorant mixtures. J. Neurosci. 28, 2659–2666.
Schmuker, M., Yamagata, N., Nawrot, M., and Menzel, R. (2011). Parallel representation of stimulus identity and intensity in a dual pathway model inspired by the olfactory system of the honeybee. Front. Neuroeng. 4:17. doi: 10.3389/fneng.2011.00017
Shang, Y., Claridge-Chang, A., Sjulson, L., Pypaert, M., and Miesenböck, G. (2007). Excitatory local circuits and their implications for olfactory processing in the fly antennal lobe. Cell 128, 601–612.
Silbering, A. F., and Galizia, C. G. (2007). Processing of odor mixtures in the Drosophila antennal lobe reveals both global inhibition and glomerulus-specific interactions. J. Neurosci. 27, 11966–11977.
Silbering, A. F., Okada, R., Ito, K., and Galizia, G. (2008). Olfactory information processing in the Drosophila antennal lobe: anything goes? J. Neurosci. 28, 13075–13087.
Su, C.-Y., Martelli, C., Emonet, T., and Carlson, J. R. (2011). Temporal coding of odor mixtures in an olfactory receptor neuron. PNAS, 108, 5075–5080.
Yaksi, E., and Wilson, R. I. (2010). Electrical coupling between olfactory glomeruli. Neuron 67, 1034–1047.
Keywords: olfaction, computational modeling, neural circuits, mixture processing, synaptic input, inhibitory interneurons, Manduca sexta
Citation: Capurro A, Baroni F, Olsson SB, Kuebler LS, Karout S, Hansson BS and Pearce TC (2012) Non-linear blend coding in the moth antennal lobe emerges from random glomerular networks. Front. Neuroeng. 5:6. doi:10.3389/fneng.2012.00006
Received: 02 November 2011; Accepted: 14 March 2012;
Published online: 19 April 2012.
Edited by:
Thomas Nowotny, University of Sussex, UKCopyright: © 2012 Capurro, Baroni, Olsson, Kuebler, Karout, Hansson and Pearce. This is an open-access article distributed under the terms of the Creative Commons Attribution Non Commercial License, which permits non-commercial use, distribution, and reproduction in other forums, provided the original authors and source are credited.
*Correspondence: Alberto Capurro, Department of Engineering, University of Leicester, Leicester LE1 7RH, UK. e-mail:YWMzMzFAbGUuYWMudWs=;YWxiZXJ0by5jYXB1cnJvQGdtYWlsLmNvbQ==