 Laura M. Santiago-Fuentes1
 Sonia Charleston-Villalobos1*
 Ramón González-Camarena2Andreas Voss3
 Mayra E. Mejía-Avila4
 Ivette Buendía-Roldan4Sina Reulecke1
 Tomás Aljama-Corrales1
- 1Electrical Engineering Department, Universidad Autónoma Metropolitana, Mexico City, Mexico
- 2Health Science Department, Universidad Autónoma Metropolitana, Mexico City, Mexico
- 3Institute of Biomedical Engineering and Informatics, University of Technology Ilmenau, Ilmenau, Germany
- 4National Institute of Respiratory Diseases, Mexico City, Mexico
Idiopathic pulmonary fibrosis (IPF) is a chronic and restrictive disease characterized by fibrosis and inflammatory changes in lung tissue producing a reduction in diffusion capacity and leading to exertional chronic arterial hypoxemia and dyspnea. Furthermore, clinically, supplemental oxygen (SupplO2) has been prescribed to IPF patients to improve symptoms. However, the evidence about the benefits or disadvantages of oxygen supplementation is not conclusive. In addition, the impact of SupplO2 on the autonomic nervous system (ANS) regulation in respiratory diseases needs to be evaluated. In this study the interactions between cardiovascular and respiratory systems in IPF patients, during ambient air (AA) and SupplO2 breathing, are compared to those from a matched healthy group. Interactions were estimated by time series of successive beat-to-beat intervals (BBI), respiratory amplitude (RESP) at BBI onset, arterial systolic (SYS) and diastolic (DIA) blood pressures. The paper explores the Granger causality (GC) between systems in the frequency domain by the extended partial directed coherence (ePDC), considering instantaneous effects. Also, traditional linear and nonlinear markers as power in low (LF) and high frequency (HF) bands, symbolic dynamic indices as well as arterial baroreflex, were calculated. The results showed that for IPF during AA phase: 1) mean BBI and power of BBI-HF band, as well as mean respiratory frequency were significantly lower (p < 0.05) and higher (p < 0.001), respectively, indicating a strong sympathetic influence, and 2) the RESP
1 Introduction
Idiopathic pulmonary fibrosis (IPF) is a chronic, restrictive, and progressive disease characterized by fibrosis and inflammatory changes in lung tissue. IPF also affects lung vasculature and prevents an adequate gas exchange, thus leading to exertional chronic arterial hypoxemia and dyspnea. The disease has a bad prognosis since after diagnosis the 50% of the patients die within 3–5 years (King et al., 2019). IPF etiology, diagnosis, treatment, and influences on quality of life, among other, have been investigated, but the focus has always been lungs performance. There is evidence that IPF patients also manifest comorbidities such as cardiovascular diseases, lung cancer, or pulmonary hypertension (Caminati et al., 2019). Furthermore, arterial hypertension has been related to dysfunctional autonomic cardiovascular control (Mancia and Grassi, 2014) and considerable impact on IPF disease progression and patient mortality (Buendía-Roldán et al., 2017).
Recently, IPF has been hypothesized as a systemic disease, but its influence on the autonomic nervous system (ANS) regulation has not been assessed as in other pulmonary disorders. For example, chronic obstructive pulmonary disease (COPD) negatively affects the cardiovascular system and the ANS regulation; the autonomic dysfunction is an important factor in the underlying pathophysiological mechanisms of the disease. The former conclusion has been mainly stated based on the analysis of heart rate variability (Van Gestel and Steier, 2010; Mohammed et al., 2015). However, for IPF disease studies about ANS regulation are scarce. Furthermore, supplemental oxygen (SupplO2) has been prescribed to IPF patients to improve clinical symptoms, but its impact on ANS regulation of cardiovascular and respiratory systems has not been evaluated in these patients.
The effects of oxygen supplementation have been reviewed on healthy subjects and patients with cardiovascular diseases, but on respiratory patients just for COPD. Until now the evidence about the benefits or drawbacks of oxygen supplementation is not conclusive. On the one hand, some authors point out that this type of clinical intervention does not help to increase oxygen delivery, i.e., the rate at which oxygen is transported from lung to microcirculation depending on cardiac output and arterial oxygen contents (Smit et al., 2018a). Furthermore, it is plausible that in critically ill patients, it could be associated with increased hospital mortality (You et al., 2018). Conversely, oxygen therapy in COPD patients is clinically well-accepted and it is recommended to enhance exercise capacity (Stoller et al., 2010). However, some trials have not found enough evidence to support that long-term oxygen therapy improves COPD patients’ mortality rate (Khor et al., 2019). It is important to point out that few studies have addressed the efficiency of oxygen administration in COPD and Interstitial Lung Disease (ILD) patients (Khor et al., 2019) and that studies about the ANS regulation in COPD patients were based on classic heart rate variability (HRV) parameters (Mohammed et al., 2017). Regarding IPF disorder, the authors of the present contribution compared the hemodynamic response to SupplO2 between ill and healthy subjects, showing potential detrimental effects of SupplO2 on IPF hemodynamics, particularly on total peripheral resistance (TPR) and cardiac output (Santiago-Fuentes et al., 2021).
Different methods have been employed to assess ANS regulation by the analysis of heart rate variability. In the case of HRV, it reflects the variations in the beat-to-beat interval and the corresponding variability time series is built up by diverse oscillatory modes. To extract the information from the time series, linear and nonlinear schemes have been proposed. For instance, the short-term HRV spectral density representation has been broadly used to analyze the sympathetic and parasympathetic modulation by the power in the low frequency (LF) and high frequency (HF) bands, respectively. Another way to assess ANS regulation of cardiovascular system is the nonlinear approach that allows to incorporate the analysis of complexity of underlying physiological mechanisms. Nonlinear indices by symbolic dynamics (SD) and detrended fluctuation analysis (DFA) have enabled the exploration of the cardiovascular system adaptability, among other, for example in elderly population (Beckers et al., 2006; Voss et al., 2015). Furthermore, the analysis of physiological variability time series has advanced from the univariate to bivariate and, to multivariate type to discover the complex interactions between human body subsystems. Nowadays, an open research area is to assess the cause-effect relationship to elucidate the complex picture of the autonomic control of the cardiovascular system and the complex interplay between cardiovascular and the respiratory systems.
Recently, the use of multivariate autoregressive models and the assessment of the directional interactions among a set of physiological variables (i.e., the so-called Granger causality) has been proposed for the analysis of ANS regulation under pathological and non-pathological conditions (Faes and Nollo, 2010; Faes et al., 2010; Charleston-Villalobos et al., 2019). Particularly, the extended partial directed coherence (ePDC) has gained interest as a tool to estimate the causality in the frequency domain in presence of instantaneous interactions (Faes and Nollo, 2010), i.e., as the effect from respiration to systolic blood pressure and beat to beat interval as well as the systolic blood pressure to beat to beat interval. Consequently, this study aimed to analysis cardiovascular and respiratory times series of variability by linear and nonlinear indices as well as Granger causalities (GC), via a multivariate autoregressive model including instantaneous effects, in IPF patients in comparison with healthy subjects under the effect of short-term SupplO2.
2 Materials and Methods
2.1 Subjects, Acquisition Protocol, and Preprocessing
This study includes 19 (8 women and 11 men) healthy subjects (CON) and 20 IPF patients (9 women and 11 men) with 67.79 ± 5.00 and 65.8 ± 6.48 years old, respectively. All subjects were medically evaluated at the National Institute of Respiratory Diseases in Mexico City after they accepted the invitation to participate and signed an informed consent according to the Declaration of Helsinki. Table 1 depicts different parameters related to clinical measures and respiratory functional tests of both groups. Signals acquisition was performed via a Biopac MP150 system during morning hours including ECG, continuous noninvasive arterial blood pressure, and peripheral blood oxygen saturation. Also, a thoracic belt was used to acquire the respiratory signal and all signals were sampled at 1,000 Hz. Raw signals were acquired in supine position continuously during 10 min with the subjects breathing spontaneously ambient air (AA) and an additional 10 min breathing SupplO2 at 3 L/min to ensure an arterial oxygen saturation above 94% (Santiago-Fuentes et al., 2021). Time series of successive beat-to-beat intervals (BBI), respiratory amplitude (RESP) at BBI onset as well as systolic (SYS) and diastolic (DIA) blood pressure (BP) were extracted from recorded signals; all extracted time series were manually reviewed and corrected. For GC analysis, the variability time series were resampled at 2 Hz using spline interpolation and normalized to zero mean and unit variance. For dynamic data analysis, consecutive windows of 5 min shifted by 30 s (90% overlap) were used. Therefore, the influence of SupplO2 on IPF was studied using 31 windows including three phases labelled as ambient-air (AA), transition phase (TPH) and steady supplemental oxygen (SupplO2), as indicated in Figure 1. The transition phase (TPH) is characterized by windows sharing AA and starting SupplO2 conditions. In each window, univariate, and bivariate indices, as well as the ePDC were estimated.
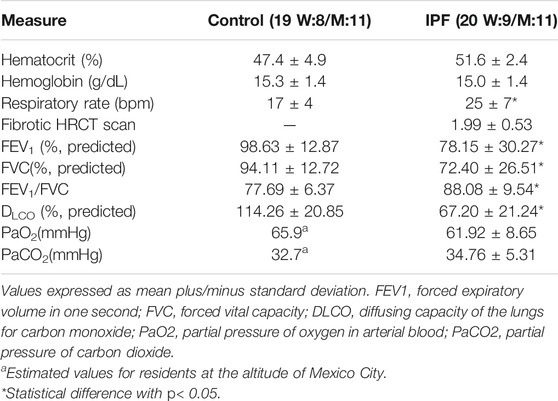
TABLE 1. Clinical and functional measures.
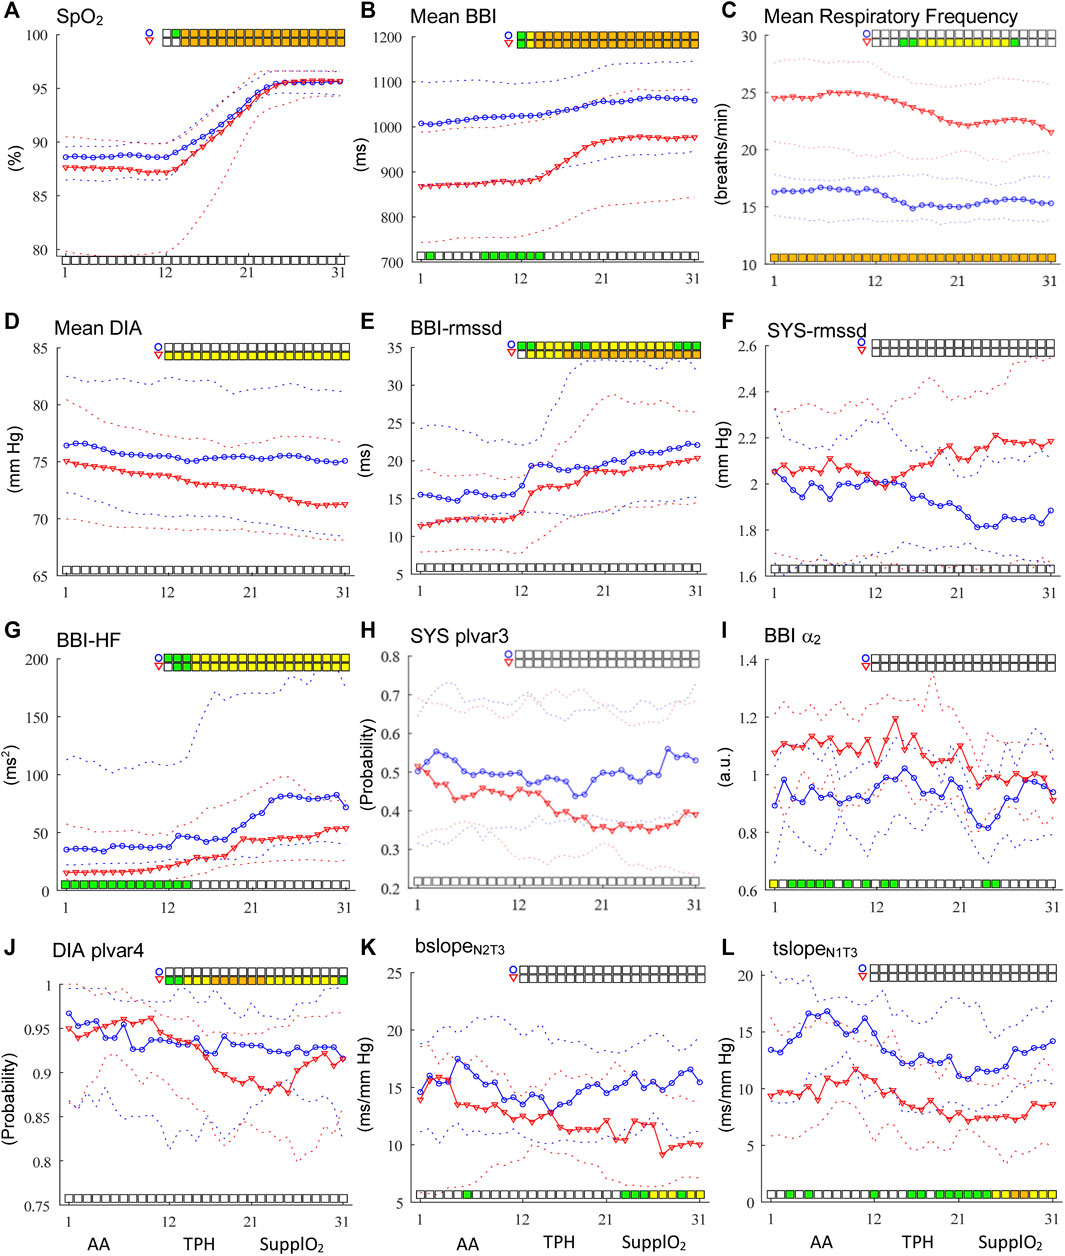
FIGURE 1. Time courses of linear and nonlinear indices for BBI, SYS and DIA time series (A–L). AA phase occurs from windows 1 to 11, transition phase (TPH) from 12 to 20 while the steady SupplO2 from windows 21 to 31. Circles in blue represent healthy subjects and red triangles represent IPF patients. The solid line indicates the median values and broken lines indicate the interquartile range from 25 to 75%. Statistically significant differences between groups are shown with bars at the bottom of each graph while differences within-groups with bars at the top (p < 0.05 in green, p < 0.01 in yellow and p < 0.001 in orange).
2.2 Univariate and Bivariate Analyses
2.2.1 Linear Analysis
Time and frequency domain linear indices were extracted as the mean value, the root mean square of successive differences (rmssd), and power in the very low-frequency range (VLF, 0.003–0.04 Hz), low (LF, 0.04–0.15 Hz), and high frequency (HF, frequencies >0.15 Hz) bands in agreement with the standardization proposed by the Task Force of the European Society of Cardiology and the North American Society of Pacing and Electrophysiology (AuthorAnonymous, 1996). The index rmssd is considered the more precise marker of chronotropic cardiac vagal influence (Minarini, 2020), for example, it provided a good differentiation between healthy subjects and vasovagal syncope patients for systolic and diastolic blood pressure variability (Reulecke et al., 2016). For estimating the power of LF and HF bands a parametric autoregressive model was used in each temporal window along of the variability time series. The model parameters and optimal order were estimated using the Burg method and the Akaike Information Criterion (AIC), respectively.
2.2.2 Nonlinear Analysis
To explore the nonlinear time series properties two techniques were applied: Detrended Fluctuation Analysis (DFA) to quantify the fractal scaling properties of a time series, and Symbolic Dynamics (SD), which is a coarse-grained method based on symbols (Reulecke et al., 2016). For DFA analysis, the short-term fractal scaling exponent (α1) was calculated over equal and non-overlapping segments with length between 4 and 16 beats while the long-term exponent (α2) for segments with length of 16–64 beats (Peng et al., 1995). Furthermore, by SD technique, nonlinear indices related to the low or high variability of the signal were determined. An alphabet, consisting only of symbols “0” or “1”, was used to create words of length six and for BBI time series, thresholds of 2, 5, 10 and 20 ms were established (Voss et al., 2015). In this sense, a low variability index associated with the word “000000” and a high variability index associated to the word “111111”, were counted (Schulz and Voss, 2017). In the case of blood pressure variability (BPV), the 6-length words were created by selecting thresholds of 1, 2, 3 and 4 mmHg (plvar 3 and 4) (Reulecke et al., 2016).
2.2.3 Bivariate Analysis
The Dual Sequence Method (DSM) is a linear technique to estimate the arterial baroreflex sensitivity (BRS) by the analysis of spontaneous fluctuations in systolic BP and BBI time series. Traditionally, a pattern of three consecutive increments or decrements in SYS and BBI are tagged as bradycardic (bslope, increase in SYS that causes an increase in BBI) or tachycardic (tslope, a decrease in SYS that causes a decrease in BBI) sequences, respectively. However, we avoided using the classical thresholds for SYS and BBI due to the criticisms about them (Gouveia et al., 2007) and in consequence, different pattern length was used including one up to three samples (N1-N3). Furthermore, the synchronous responses in the same beat interval (T0) and delayed BBI responses shifted by one up to three beats (T1-T3) were also explored, as suggested by (Malberg et al., 2002; Gouveia et al., 2007).
2.3 Multivariate Autoregressive Modeling, Extended Partial Coherence and Time-Frequency Analysis of Interactions
Establishing the cause and effect, or the driver-response relationship, between physiological systems has been of great interest in diverse biomedical applications. Fundamental to the driver-response relationship is the concept of Granger causality which states that if a signal improves the prediction of a second signal, above and beyond, its prediction in terms of its own past, then the first signal causes the second one. GC has been formalized in terms of multivariate time series analysis and its treatment in the frequency domain leading to the concept of partial directed coherence. Particularly, the extended partial directed coherence (ePDC) is based on fitting a linear time-invariant parametric model to the observed set of M time series Y(n) including instantaneous effects, i.e.,
where the model coefficients B(k), k = 0, … ,q, are related to instantaneous and strictly causal effects, q is the model order and W(n) is the innovation process formed by white and uncorrelated noises with diagonal covariance matrix Λ = diag (λi2). The identification of the extended MVAR model can be achieved from a strictly causal MVAR model with coefficient matrix
where
2.4 Statistical Analysis
To evaluate the effect of supplemental oxygen, in this study the statistical analysis was performed with two statistical test, within-groups and between-groups. The within-groups test was carried out on univariate and bivariate indices values comparing window 5 vs. windows 12 to 31 (TPH and steady SupplO2) by the Wilcoxon Sign Rank-sum. All p-values were corrected using the Benjamini and Hochberg correction (Benjamini and Hochberg, 1995). In the case of between-groups comparison, the analysis was carried out on the univariate and bivariate indices values, and ePDC magnitude at each tile, in each temporal window by the nonparametric Mann-Whitney-U-test. In both statistical analyses, the significance was set at three levels for descriptive purposes: slightly significant for p < 0.05 (green), moderately significant for p < 0.01 (yellow), and highly significant for p < 0.001 (orange).
3 Results and Discussion
The section is organized presenting first the results for the AA phase followed by the findings in the TPH and steady SupplO2 phases. The SupplO2 effect on healthy subjects and IPF patients is obtained looking for the time course of linear and nonlinear indices as well as by the dynamics of cardiovascular and respiratory interactions as compared with those in the AA phase. Statistical analysis between-groups, throughout all the phases, is displayed at the bottom of the graphs while within-group, comparing window 5 vs. windows 12 (start of TPH) to 31, is depicted at the top. For saving the space of article, selected indices are included in Figure 1, while others are only discussed. Also, the indices in Figure 1 were ordered as they are used throughout the manuscript.
3.1 Clinical and Functional Measurements
According to Table 1, the IPF group was characterized by moderate reduction in vital capacity and FEV1, mild reduction in diffusion capacity, hypoxemia, mild hypercapnia, and high respiratory rate. In contrast, the CON group had no signs of pulmonary alterations; although the PaCO2 and PaO2 were not registered at the time of the study, it is plausible to estimate them at the altitude of Mexico City (Vazquez-Garcia and Perez-Padilla, 2000). Consequently, the estimated normal values of PaCO2 and PaO2 for Mexico City residents are around 32.7 and 65.9 mmHg, respectively; there were no statistically significant differences in age, anthropometric measures, hematocrit, and hemoglobin values. As can be seen in Figure 1A, peripheral oxygen saturation (SpO2) increased importantly from TPH towards the steady SupplO2 phase for both groups until a saturation of 96% was reached, but no statistically significant differences between-groups were found during SupplO2. In contrast, within-group statistical analysis revealed highly significant differences. Furthermore, Rico et al. observed that SPO2 tends to decline during the aging process that is in line with the SpO2 in our Control group (Rico et al., 2001). On the other hand, the IPF group showed a greater dispersion of SpO2 during AA phase that may be explained by age, disease stage, and pulmonary condition. Also, it is relevant to point out that the population of this age was under medication for other comorbidities. A comprehensive discussion of this aspect for the groups under study can be found in (Santiago-Fuentes et al., 2021).
3.2 Linear and Nonlinear Univariate Analysis in AA
For mean BBI index, statistically significant differences between CON and IPF groups were found from windows 8 to 12, Figure 1B, while for the mean respiratory frequency highly significant differences were found for the whole phase, Figure 1C. Also, the mean SYS and DIA BP for CON tended to be higher than for IPF, Figure 1D. For linear indices as rmssd, there were no significant differences for BBI, SYS or DIA, Figures 1E,F, but for BBI the IPF group showed a tendency to lower values. Also, for BBI power in the LF and HF bands was significantly different (p < 0.05); particularly, the CON group showed higher BBI-HF power and consequently, higher cardiac vagal influence than IPF, Figure 1G. For SYS-nLF, IPF showed a tendency to higher values, i.e., increased sympathetic influence on the vasculature than in CON. In the case of SD nonlinear analysis, for IPF the indices BBI-phvar2 as well as SYS-plvar3 (Figure 1H) showed a tendency to lower probability values than CON, i.e., low BBI variability and higher SYS variability, respectively. Nevertheless, in the DFA analysis, BBI-α2 was statistically different (p < 0.05) between groups, where IPF patients showed higher sympathetic activity than CON, Figure 1I. Consequently, by univariate analysis, statistically significant differences between groups were found just for BBI, indicating a significant cardiac sympathetic modulation in IPF patients during AA scenario.
3.3 Linear and Nonlinear Univariate Analysis in TPH and Steady SupplO2
At the firsts windows in TPH, BBI showed statistically significant differences between-groups for mean, BBI-HF, and BBI-α2 indices, Figure 1. Specifically, the mean cardiac frequency decreased in both groups, slowly for CON and more drastically for IPF, whereas for HF and α2, the CON group showed higher and lower values than IPF, respectively. The former behavior is in line with the expected effect of SupplO2 on the cardiac frequency. The mean respiratory frequency was reduced for both groups however, the between groups differences were kept along both phases, Figure 1C. Although between-groups no statistically significant differences were found for mean SYS and DIA in TPH or steady SupplO2, the mean SYS showed a tendency to increase in CON while the mean DIA decreased in IPF.
To evaluate the influence of O2 within each group, statistical comparisons were achieved between AA and TPH or steady SupplO2 phases. The effect of O2 was significantly different for CON and IPF. Specifically, significant differences were obtained for BBI, mean respiratory frequency, and DIA. For the IPF group, the BBI-rmssd index showed highly significant differences (p < 0.001) from windows 16 to 31, i.e., the cardiac vagal influence in IPF was increased to a greater extent by O2, Figure 1E. The former time course was supported by the nonlinear BBI-phvar2 index (p < 0.001). Furthermore, BBI-LF and BBI-α1 indices provided significant within-group differences. Regarding BBI-LF index, only for the IPF group, the LF power increased from TPH and throughout steady SupplO2 phase (p < 0.001) while the BBI-α1 index decreased. It is worthy to note that for SYS, in none of the groups neither linear nor nonlinear indices provided significant differences. Although, for IPF, SYS-rmssd had a tendency to increase while SYS-plvar3 to decrease, indicating that SYS increased its variability with O2, Figures 1F,H. In the case of DIA, just for IPF, mean DIA decreased due to oxygen from TPH to the end of the steady SupplO2 phase in a moderately significant way (p < 0.01), that may be related to the lower cardiac frequency with O2, i.e., a vagal modulation effect, Figure 1D. Also, the DIA-plvar4 index showed moderately and highly significant differences along the two phases, the percentage of words of low variability was reduced, i.e., in the IPF group the DIA variability was increased by SuppO2, Figure 1J.
3.4 Bivariate Analysis in AA, TPH and Steady SupplO2
For DSM analysis, different pattern lengths and delays were tested, and the results indicated that statistical differences between groups occurred with lengths of 2–3 samples and shifts between 0 and 3 beats. The bivariate indices during AA, associated with arterial baroreflex sensitivity, did not show statistical differences between groups, only a tendency to lower values for IPF. The former behavior is in line with the literature indicating that hypoxia produces a resetting of arterial baroreflex, without changing the sensitivity, to higher heart rates and systolic blood pressures due to stimulation of peripheral chemoreceptors (Halliwill et al., 2003). In contrast, the IPF patients of the present study were characterized by significantly higher cardiac frequency and cardiac sympathetic modulation but similar systolic pressure. It is worthy to mention that the interaction between baroreflex and peripheral chemoreflexes remains controversial (Kronsbein et al., 2020). During steady SupplO2, from window 21, bslope and tslope indices provided significant differences (p < 0.05 and p < 0.01) between groups, Figures 1K, 1L. For both indices, IPF showed lower values than CON, i.e., IPF decreased their baroreflex in comparison to CON. In the case of within-groups analysis, in TPH and steady SupplO2 phases, bslope tends to increase for CON while for the IPF group tends to decrease. Systolic pressure, being a variable to control, tends to oscillate with greater amplitude when feedback mechanisms are deficient, showing an inverse relationship with variations in heart rate, as a variable to regulate (Mancia et al., 1986; Lanfranchi and Somers, 2002). In fact, it should be noted that the significant reduction in cardiac output in IPF observed during SupplO2 (Santiago-Fuentes et al., 2021) could be a consequence of alteration of the cardiovascular regulation. The former behavior may be explained, on the one hand, by statistically significant changes (attenuation) of the sensitivity of the baroreceptors reflected by bslope and tslope indices (Figures 1K,L), increase in BBI (Figure 1B), and in total peripheral resistance and, on the other hand, by statistically non-significant trends in systolic blood pressure and its variability. Furthermore, diverse research pointed out that clinicians should be aware of the prognostic implications of increased blood pressure variability, a marker of cardiovascular decompensation, which may lead for example to organ damage (Hoecht, 2013).
3.5 Interactions Between Cardiovascular and Respiratory Systems
3.5.1 TFRi Magnitude Distribution in AA
An averaged time-frequency representation of RESP
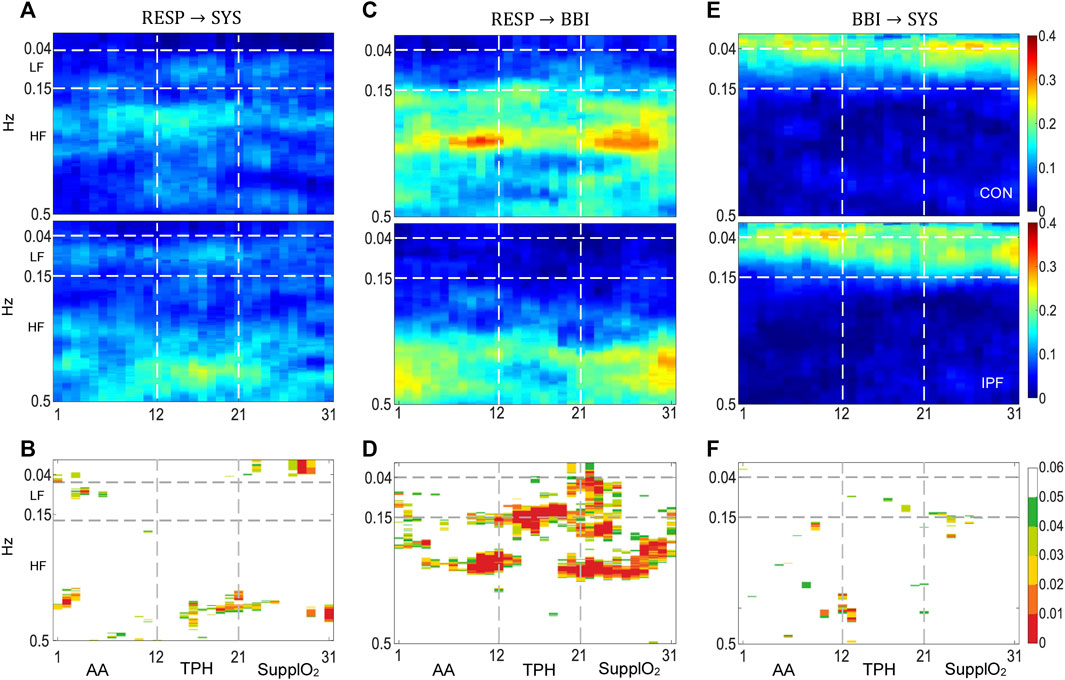
FIGURE 2. Cadiorespiratory and cardiovascular interactions by the model MVAR1. (A,C,E) TFRi of RESP
Results by MVAR2, using DIA instead of SYS are shown in Figure 3. The TFRi of the RESP
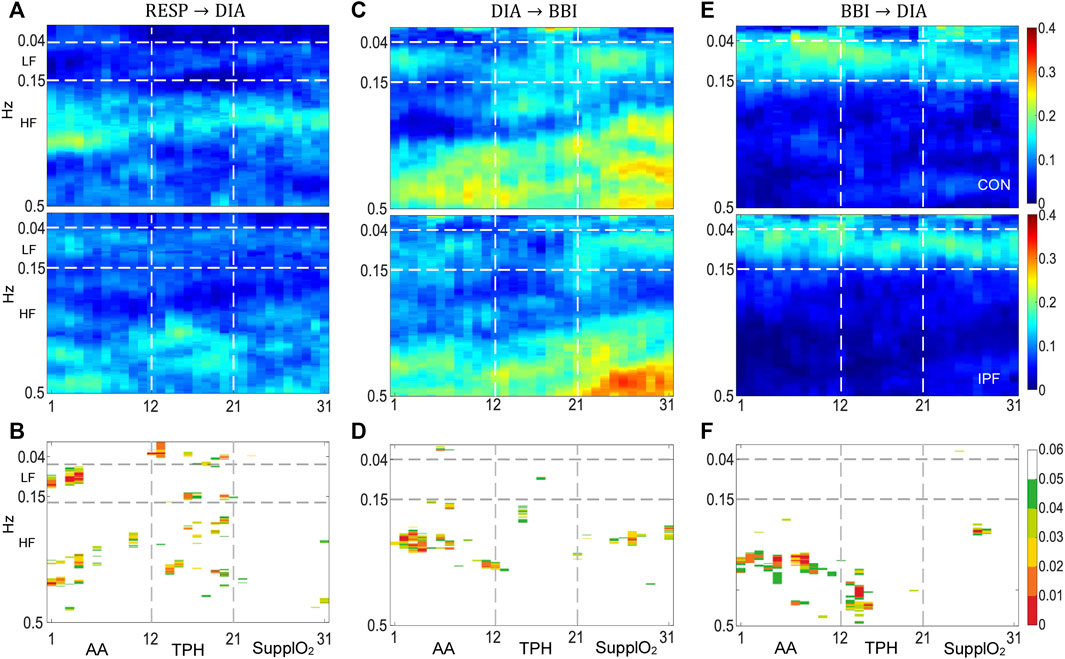
FIGURE 3. Cadiorespiratory and cardiovascular interactions by the model MVAR2. (A,C,E) TFRi of RESP
3.5.2 TFRi Magnitude Distribution in TPH and Steady SupplO2
In the case of RESP
During TPH, the RESP
By MVAR2 using DIA instead of SYS, the RESP
4 Conclusion
According to the results of the present study, the IPF group in the AA phase, as compared with a matched healthy group, was characterized by high sympathetic modulation to the heart (supported by BBI-rmssd, BBI-α2 indices, and increased mean respiratory frequency, among other indices) with a decreased influence of the parasympathetic activity. It is well-known that chemoreceptors sense the partial pressure of oxygen in blood vessels, and they are important modulators of sympathetic activation in response to hypoxemia. The activation is also known as chemoreflex-mediated sympathetic activation and one of the consequences is the hyperventilation that leads to the inhibition of the chemoreflex due to the stretch mechanoreceptors activity in the thoracic cage (Kara et al., 2003). Also, the IPF patients during SupplO2 had blunted baroreflex (confirmed by DSM results and almost inexistent SYS
The effect of oxygen has been studied mainly by its hemodynamic effects and the analysis of heart rate variability (Lund et al., 1999; Gole et al., 2011; Smit et al., 2018a; Smit et al., 2018b). To the best of our knowledge, this is the first study that tackle the effect of oxygen supplementation in IPF with a new perspective from the point of view of linear and non-linear indices as well as the dynamics of cardiovascular and respiratory systems interactions. For IPF patients the results showed that during AA phase: 1) the mean BBI value and power of BBI-HF band, as well as the mean respiratory frequency were significantly lower (p < 0.05) and higher (p < 0.001), respectively, indicating a strong sympathetic influence, and 2) the RESP
Author Contributions
Conceptualization: LS-F, SC-V, RG-C, and TA-C; Methodology: LS-F, SC-V, SR, RG-C, and TA-C; Software: LS-F, SR, and SC-V; Validation: SC-V, AV, RG-C, and TA-C; Data analysis: LS-F, SC-V, and TA-C, Data acquisition: LS-F, SR, MM-A, and IB-R; Writing—original draft preparation: LS-F, SC-V, and TA-C; writing—review and editing: LS-F, SC-V, AV, and RG-C; Final version approval: LS-F, SC-V, AV, RG-C, MM-A, IB-R, SR, and TA-C.
Conflict of Interest
The authors declare that the research was conducted in the absence of any commercial or financial relationships that could be construed as a potential conflict of interest.
The reviewer LF is currently organizing a Research Topic with one author SC-V.
Publisher’s Note
All claims expressed in this article are solely those of the authors and do not necessarily represent those of their affiliated organizations, or those of the publisher, the editors and the reviewers. Any product that may be evaluated in this article, or claim that may be made by its manufacturer, is not guaranteed or endorsed by the publisher.
Data Availability Statement
The original contributions presented in the study are included in the article/Supplementary Material, further inquiries can be directed to the corresponding author.
Ethics Statement
The studies involving human participants were reviewed and approved by National Institute of Respiratory Diseases (INER). The patients/participants provided their written informed consent to participate in this study.
References
AuthorAnonymous (1996). Heart Rate Variability: Standards of Measurement, Physiological Interpretation and Clinical Use. Task Force of the European Society of Cardiology and the North American Society of Pacing and Electrophysiology. Circulation 93 (5), 1043–1065.
Barnett, W. H., Latash, E. M., Capps, R. A., Dick, T. E., Wehrwein, E. A., and Molkov, Y. I. (2020). Traube-Hering Waves Are Formed by Interaction of Respiratory Sinus Arrhythmia and Pulse Pressure Modulation in Healthy Men. J. Appl. Physiol. 129 (5), 1193–1202. doi:10.1152/japplphysiol.00452.2020
Beckers, F., Verheyden, B., and Aubert, A. E. (2006). Aging and Nonlinear Heart Rate Control in a Healthy Population. Am. J. Physiology-Heart Circulatory Physiol. 290 (6), H2560–H2570. doi:10.1152/ajpheart.00903.2005
Benjamini, Y., and Hochberg, Y. (1995). Controlling the False Discovery Rate: A Practical and Powerful Approach to Multiple Testing. J. R. Stat. Soc. Ser. B (Methodological) 57 (1), 289–300. doi:10.1111/j.2517-6161.1995.tb02031.x
Buchner, T. (2019). A Quantitative Model of Relation between Respiratory-Related Blood Pressure Fluctuations and the Respiratory Sinus Arrhythmia. Med. Biol. Eng. Comput. 57 (5), 1069–1078. doi:10.1007/s11517-018-1939-4
Buendía-Roldán, I., Mejía, M., Navarro, C., and Selman, M. (2017). Idiopathic Pulmonary Fibrosis: Clinical Behavior and Aging Associated Comorbidities. Respir. Med. 129, 46–52. doi:10.1016/j.rmed.2017.06.001
Caminati, A., Lonati, C., Cassandro, R., Elia, D., Pelosi, G., Torre, O., et al. (2019). Comorbidities in Idiopathic Pulmonary Fibrosis: an Underestimated Issue. Eur. Respir. Rev. 28 (153), 190044. doi:10.1183/16000617.0044-2019
Charleston-Villalobos, S., Reulecke, S., Voss, A., Azimi-Sadjadi, M. R., González-Camarena, R., Gaitán-González, M. J., et al. (2019). Time-Frequency Analysis of Cardiovascular and Cardiorespiratory Interactions during Orthostatic Stress by Extended Partial Directed Coherence. Entropy 21 (5), 468–482. doi:10.3390/e21050468
Faes, L., and Nollo, G. (2010). Extended Causal Modeling to Assess Partial Directed Coherence in Multiple Time Series with Significant Instantaneous Interactions. Biol. Cybern 103 (5), 387–400. doi:10.1007/s00422-010-0406-6
Faes, L., Porta, A., and Nollo, G. (2010). Testing Frequency-Domain Causality in Multivariate Time Series. IEEE Trans. Biomed. Eng. 57, 1897–1906. doi:10.1109/TBME.2010.2042715
Ghali, M. G. Z., and Ghali, G. Z. (2020). Mechanisms Contributing to the Generation of Mayer Waves. Front. Neurosci. 14, 395. doi:10.3389/fnins.2020.00395
Gole, Y., Gargne, O., Coulange, M., Steinberg, J.-G., Bouhaddi, M., Jammes, Y., et al. (2011). Hyperoxia-induced Alterations in Cardiovascular Function and Autonomic Control during Return to Normoxic Breathing. Eur. J. Appl. Physiol. 111 (6), 937–946. doi:10.1007/s00421-010-1711-4
Gouveia, S., Rocha, A. P., Laguna, P., and Lago, P. (2007). Threshold Sensitivity in Time Domain BRS Estimation: Minimum Beat-To-Beat Changes and Minimum Correlation. Comput. Cardiol. 34, 557–560. doi:10.1109/CIC.2007.4745546
Halliwill, J. R., Morgan, B. J., and Charkoudian, N. (2003). Peripheral Chemoreflex and Baroreflex Interactions in Cardiovascular Regulation in Humans. J. Physiol. 552 (1), 295–302. doi:10.1113/jphysiol.2003.050708
Höcht, C. (2013). Blood Pressure Variability: Prognostic Value and Therapeutic Implications. ISRN Hypertens. 2013, 1–16. doi:10.5402/2013/398485
Julien, C. (2006). The enigma of Mayer Waves: Facts and Models. Cardiovasc. Res. 70 (1), 12–21. doi:10.1016/j.cardiores.2005.11.008
Kara, T., Narkiewicz, K., and Somers, V. K. (2003). Chemoreflexes - Physiology and Clinical Implications. Acta Physiol. Scand. 177 (3), 377–384. doi:10.1046/j.1365-201X.2003.01083.x
Khor, Y. H., Renzoni, E. A., Visca, D., McDonald, C. F., and Goh, N. S. L. (2019). Oxygen Therapy in COPD and Interstitial Lung Disease: Navigating the Knowns and Unknowns. ERJ Open Res. 5 (3), 00118–02019. doi:10.1183/23120541.00118-2019
King, T. E., Pardo, A., and Selman, M. (2019). Idiopathic Pulmonary Fibrosis. Lancet 378 (9807), 1949–1961. doi:10.1016/S0140-6736(11)60052-4
Kronsbein, H., Gerlach, D. A., Heusser, K., Hoff, A., Hoffmann, F., Diedrich, A., et al. (2020). Testing Individual Baroreflex Responses to Hypoxia-Induced Peripheral Chemoreflex Stimulation. Clin. Auton. Res. 30 (6), 531–540. doi:10.1007/s10286-019-00660-6
Lanfranchi, P. A., and Somers, V. K. (2002). Arterial Baroreflex Function and Cardiovascular Variability: Interactions and Implications. Am. J. Physiology-Regulatory, Integr. Comp. Physiol. 283 (4), R815–R826. doi:10.1152/ajpregu.00051.2002
Lund, V. E., Kentala, E., Scheinin, H., Klossner, J., Helenius, H., Sariola-Heinonen, K., et al. (1999). Heart Rate Variability in Healthy Volunteers during Normobaric and Hyperbaric Hyperoxia. Acta Physiol. Scand. 167 (1), 29–35. doi:10.1046/j.1365-201x.1999.00581.x
Malberg, H., Wessel, N., Hasart, A., Osterziel, K.-J., and Voss, A. (2002). Advanced Analysis of Spontaneous Baroreflex Sensitivity, Blood Pressure and Heart Rate Variability in Patients with Dilated Cardiomyopathy. Clin. Sci. 102 (4), 465–473. doi:10.1042/cs1020465
Mancia, G., and Grassi, G. (2014). The Autonomic Nervous System and Hypertension. Circ. Res. 114 (11), 1804–1814. doi:10.1161/CIRCRESAHA.114.302524
Mancia, G., Parati, G., Pomidossi, G., Casadei, R., Di Rienzo, M., and Zanchetti, A. (1986). Arterial Baroreflexes and Blood Pressure and Heart Rate Variabilities in Humans. Hypertension 8 (2), 147–153. doi:10.1161/01.hyp.8.2.147
Menuet, C., Connelly, A. A., Bassi, J. K., Melo, M. R., Le, S., Kamar, J., et al. (2020). PreBötzinger Complex Neurons Drive Respiratory Modulation of Blood Pressure and Heart Rate. Elife 9, e57288. doi:10.7554/eLife.57288
Minarini, G. (2020). “Root Mean Square of the Successive Differences as Marker of the Parasympathetic System and Difference in the Outcome after ANS Stimulation,” in Autonomous Nervous System Monitoring-Heart Rate Variability. Editor T. Aslanidis (London: IntechOpen Press), 15–28. doi:10.5772/intechopen.89827
Mohammed, J., Da Silva, H., Van Oosterwijck, J., and Calders, P. (2017). Effect of Respiratory Rehabilitation Techniques on the Autonomic Function in Patients with Chronic Obstructive Pulmonary Disease: A Systematic Review. Chron. Respir. Dis. 14 (3), 217–230. doi:10.1177/1479972316680844
Mohammed, J., Meeus, M., Derom, E., Da Silva, H., and Calders, P. (2015). Evidence for Autonomic Function and its Influencing Factors in Subjects with COPD: A Systematic Review. Respir. Care 60 (12), 1841–1851. doi:10.4187/respcare.04174
Papadopoulos, C. E., Pitsiou, G., Karamitsos, T. D., Karvounis, H. I., Kontakiotis, T., Giannakoulas, G., et al. (2008). Left Ventricular Diastolic Dysfunction in Idiopathic Pulmonary Fibrosis: a Tissue Doppler Echocardiographic Study. Eur. Respir. J. 31 (4), 701–706. doi:10.1183/09031936.00102107
Peng, C. K., Havlin, S., Stanley, H. E., and Goldberger, A. L. (1995). Quantification of Scaling Exponents and Crossover Phenomena in Nonstationary Heartbeat Time Series. Chaos 5 (1), 82–87. doi:10.1063/1.166141
Porta, A., Faes, L., Bari, V., Marchi, A., Bassani, T., Nollo, G., et al. (2014). Effect of Age on Complexity and Causality of the Cardiovascular Control: Comparison between Model-Based and Model-free Approaches. Plos One 9 (2), e89463. doi:10.1371/journal.pone.0089463
Reulecke, S., Charleston-Villalobos, S., Voss, A., González-Camarena, R., González-Hermosillo, J., Gaitán-González, M. J., et al. (2016). Orthostatic Stress Causes Immediately Increased Blood Pressure Variability in Women with Vasovagal Syncope. Comp. Methods Programs Biomed. 127, 185–196. doi:10.1016/j.cmpb.2015.12.005
Rico, M. F. G., Urias, A. P., Barquera, C. S., Ochoa, J. L. G., Padilla, N. M. A., Meneses, G. L. C., et al. (2001). Spirometric and Gasometric Values in a Healthy Geriatric Population, at Different Altitudes above Sea Level in the Mexican Republic. Multicentric Study. Rev. Inst. Nal Enf Resp Mex 14 (2), 90–98.
Santiago-Fuentes, L. M., González-Camarena, R., Charleston-Villalobos, S., Mejía-Ávila, M. E., Reulecke, S., Buendía-Roldán, I., et al. (2021). Hemodynamic Response to Low-Flow Acute Supplemental Oxygen in Idiopathic Pulmonary Fibrosis and Elderly Healthy Subjects. Heart & Lung 50 (1), 197–205. doi:10.1016/j.hrtlng.2020.03.025
Schulz, S., and Voss, A. (2017). “Symbolic Dynamics, Poincaré Plot Analysis and Compression Entropy Estimate Complexity in Biological Time Series,” in Complexity and Nonlinearity in Cardiovascular Signals. Editors R. Barbieri, E. Scilingo, and G. Valenza (Springer), 45–85. doi:10.1007/978-3-319-58709-7_2
Smit, B., Smulders, Y. M., Eringa, E. C., Oudemans - van Straaten, H. M., Girbes, A. R. J., Wever, K. E., et al. (2018a). Effects of Hyperoxia on Vascular Tone in Animal Models: Systematic Review and Meta-Analysis. Crit. Care 22 (1), 189. doi:10.1186/s13054-018-2123-9
Smit, B., Smulders, Y. M., Van der Wouden, J. C., Oudemans-Van Straaten, H. M., and Spoelstra-de Man, A. M. E. (2018b). Hemodynamic Effects of Acute Hyperoxia: Systematic Review and Meta-Analysis. Crit. Care 22 (1), 45. doi:10.1186/s13054-018-1968-2
Stickland, M. K., Fuhr, D. P., Edgell, H., Byers, B. W., Bhutani, M., Wong, E. Y. L., et al. (2016). Chemosensitivity, Cardiovascular Risk, and the Ventilatory Response to Exercise in COPD. PLoS One 11 (6), e0158341. doi:10.1371/journal.pone.0158341
Stoller, J. K., Panos, R. J., Krachman, S., Doherty, D. E., and Make, B. (2010). Oxygen Therapy for Patients with COPD. Chest 138 (1), 179–187. doi:10.1378/chest.09-2555
Van Gestel, A. J., and Steier, J. (2010). Autonomic Dysfunction in Patients with Chronic Obstructive Pulmonary Disease (COPD). J. Thorac. Dis. 2 (4), 215–222. doi:10.3978/j.issn.2072-1439.2010.02.04.5
Vazquez-Garcia, J. C., and Perez-Padilla, R. (2000). Valores gasométricos estimados para las principales poblaciones y sitios a mayor altitud en México. Rev. Inst. Nal Enf Resp Mex 13 (1), 6–13.
Voss, A., Schroeder, R., Heitmann, A., Peters, A., and Perz, S. (2015). Short-Term Heart Rate Variability-Influence of Gender and Age in Healthy Subjects. Plos One 10 (3), e0118308. doi:10.1371/journal.pone.0118308
Yasuma, F., Hirai, M., and Hayano, J.-i. (2001). Differential Effects of Hypoxia and Hypercapnia on Respiratory Sinus Arrhythmia in Conscious Dogs. Jpn. Circ. J. 65 (8), 738–742. doi:10.1253/jcj.65.738
Keywords: idiopathic pulmonary fibrosis, supplemental oxygen, systems interactions, time-frequency cardiorespiratory interactions, extended partial directed coherence
Citation: Santiago-Fuentes LM, Charleston-Villalobos S, González-Camarena R, Voss A, Mejía-Avila ME, Buendía-Roldan I, Reulecke S and Aljama-Corrales T (2022) Effects of Supplemental Oxygen on Cardiovascular and Respiratory Interactions by Extended Partial Directed Coherence in Idiopathic Pulmonary Fibrosis. Front. Netw. Physiol. 2:834056. doi: 10.3389/fnetp.2022.834056
Received: 15 December 2021; Accepted: 07 February 2022;
Published: 15 March 2022.
Edited by:
Sebastiano Stramaglia, University of Bari Aldo Moro, ItalyReviewed by:
Davide Nuzzi, University of Bari Aldo Moro, ItalyLuca Faes, University of Palermo, Italy
Ronny P Bartsch, Bar-Ilan University, Israel
Copyright © 2022 Santiago-Fuentes, Charleston-Villalobos, González-Camarena, Voss, Mejía-Avila, Buendía-Roldan, Reulecke and Aljama-Corrales. This is an open-access article distributed under the terms of the Creative Commons Attribution License (CC BY). The use, distribution or reproduction in other forums is permitted, provided the original author(s) and the copyright owner(s) are credited and that the original publication in this journal is cited, in accordance with accepted academic practice. No use, distribution or reproduction is permitted which does not comply with these terms.
*Correspondence: Sonia Charleston-Villalobos, c2NodkB4YW51bS51YW0ubXg=