 Ying Chen
 Huijing Hu3†
 Chenming Ma
 Le Li
Le Li Rong Song
- 1Key Laboratory of Sensing Technology and Biomedical Instrument of Guang Dong Province, School of Engineering, Sun Yat-sen University, Guangzhou, China
- 2Department of Rehabilitation Medicine, Guangdong Engineering Technology Research Center for Rehabilitation Medicine and Clinical Translation, The First Affiliated Hospital, Sun Yat-sen University, Guangzhou, China
- 3Guangdong Work Injury Rehabilitation Center, Guangzhou, China
- 4School of Computers, Guangdong University of Technology, Guangzhou, China
This study investigated the complexity of the electromyography (EMG) of lower limb muscles when performing obstacle crossing tasks at different heights in poststroke subjects versus healthy controls. Five poststroke subjects and eight healthy controls were recruited to perform different obstacle crossing tasks at various heights (randomly set at 10, 20, and 30% of the leg’s length). EMG signals were recorded from bilateral biceps femoris (BF), rectus femoris (RF), medial gastrocnemius, and tibialis anterior during obstacle crossing task. The fuzzy approximate entropy (fApEn) approach was used to analyze the complexity of the EMG signals. The fApEn values were significantly smaller in the RF of the trailing limb during the swing phase in poststroke subjects than healthy controls (p < 0.05), which may be an indication of smaller number and less frequent firing rates of the motor units. However, during the swing phase, there were non-significant increases in the fApEn values of BF and RF in the trailing limb of the stroke group compared with those of healthy controls, resulting in a coping strategy when facing challenging tasks. The fApEn values that increased with height were found in the BF of the leading limb during the stance phase and in the RF of the trailing limb during the swing phase (p < 0.05). The reason for this may have been a larger muscle activation associated with the increase in obstacle height. This study demonstrated a suitable and non-invasive method to evaluate muscle function after a stroke.
Introduction
Stroke, a leading cause of disability, often leads to functional limitations in the activity of daily living (ADL). Stroke survivors have a high risk of falling during all poststroke stages (1). Mackintosh et al. found that 36% of community-dwelling elderly people with chronic poststroke symptoms reported falling in the past year, which is significantly more than 24% of the healthy controls (2). Rehabilitation intervention offers beneficial effects on motor recovery after a stroke (3) and can reduce the risk of falling (4). A better understanding of motor function impairment in stroke survivors will help design effective recovery strategies during rehabilitation to reduce the incidence of falling.
Obstacle crossing is a complex walking ADL and requires sufficient foot obstacle clearance for the swinging limb, stability of the stance limb (5), and coordination of the whole body to prevent the loss of balance. Half of all stroke subjects either lose their balance or make casual foot contact with the obstacle during crossing (6), which indicates that obstacle crossing threatens the safety of patients after a stroke. Many studies based on the kinematic indices have been conducted to analyze stroke patients’ gaits. Kerrigan et al. examined the joint angles of stroke patients during level walking to quantitatively define the most commonly used strategy termed circumduction (7). Lu et al. investigated the motor performance in high-functioning poststroke patients during obstacle crossing and found that stroke survivors appeared to adopt a specific symmetric kinematic strategy with an increased pelvic posterior tilt and swing hip abduction (8). Said et al. quantified the modifications of kinematic characteristics in stroke survivors during obstacle crossing and found that stroke survivors had reduced toe-obstacle clearance and closer horizontal distance after clearance with increased crossing time compared to healthy controls (9).
Previous studies based on the kinematic analysis identified a significant number of stroke-related features for obstacle crossing. Further information about muscle function requires electromyography (EMG) signals, which can be recorded from the muscle surface (10). EMG analysis based on time and frequency domains was widely used in previous studies. Zhai et al. proposed a self-recalibrating classifier of hand movements based on the convolutional neural network using short latency dimension-reduced sEMG as an input (11). Chen and Yang successfully reconstructed drawings of trace reconstructions using a novel three-step hybrid model based on the root mean square (RMS) of seven-channel EMG signals and a gene expression program (12). Kisielsajewicz et al. found that the coherence between synergist muscles in the affected upper limb of stroke patients was lower than that of healthy subjects during reaching tasks (13). Our previous results showed greater muscle activation levels, increased muscle co-contraction, and lower mean power frequencies in persons after a stroke compared to controls during obstacle crossing. These findings indicated that abnormal muscle activation patterns might contribute to difficulties in maintaining balance during obstacle crossing (14). Since the generation of EMG signals is non-linear (15), simple linear modeled features, such as the RMS, integrated EMG, and mean power frequency, reported recently are limited in characterizing muscle dynamics (16). Some non-linear methods have been introduced to analyze the EMG signals, including fractal dimension, average maximum finite-time Lyapunov exponents, and recurrence quantification analysis (15, 17, 18). However, these non-linear dynamic methods usually require very large data sets to achieve reliable results. This may lead to spurious results when applied to small data sets from experiments (19). To solve this problem, entropy-based methods, such as approximate entropy (ApEn), sample entropy (SampEn), and fuzzy approximate entropy (fApEn), have been introduced to analyze EMG signals (19–21). For example, Zhang et al. used SampEn to detect the onset of muscle activity and found that it was more robust than the RMS method (21, 22). It was further used to examine the EMG-torque relation in the complexity domain. This demonstrated that complexity analysis is a novel tool to examine neuromuscular changes after stroke (23).
Entropy was first introduced by Shannon and later termed information entropy (24). Kolmogorov then developed K-S entropy based on the information entropy, which was applicable for examining the complexity of systems (25). However, K-S entropy is not useful for the analysis of measured signals because these signals are noise, and K-S entropy is unable to analyze noisy signal (26). Pincus subsequently introduced ApEn, which is applicable to noisy and small data sets (26). Although ApEn has many advantages compared with linear analysis methods, it is biased. To solve this problem, SampEn was then developed based on ApEn (27). SampEn is less dependent on the size of data sets and shows better relative consistency, but SampEn(m, r, N) is not defined in the case of small N and r (27). Chen et al. later developed fApEn as another complexity analysis method. It combines Zadeh’s fuzzy sets with entropy-based methods (19). Due to its excellent robustness and consistency (28), fApEn can analyze muscle function in patients with neuromuscular disorders. Ao et al. found that the fApEn values in the elbow muscles were lower compared to healthy controls (29). Sun et al. found that fApEn values increased with force-generating capacity in stroke survivors during robot-aided rehabilitation training sessions (30). To date, there are limited studies on the dynamics of muscle function during complex tasks, such as obstacle crossing following stroke. This is critical to daily living.
In this study, fApEn was used to analyze the EMG signals recorded from eight muscles of the lower limb of poststroke subjects and compared those with healthy subjects when performing obstacle crossings tasks at different heights. This study aimed to investigate the alterations in the complexity of the EMG signals between the two groups and between different heights during the task. It also aimed to identify dynamic muscle function changes after stroke. Our hypothesis was that the complexity of the generated EMG signals would decrease due to muscle damage after stroke. The complexity would increase along with the obstacle height due to the underlying mechanisms of muscle activation. The correlation between the fApEn values of the EMG signals and the clinical scales could provide further details regarding muscle function after stroke.
Materials and Methods
Participants
Five poststroke subjects with at least 3 months onset prior to data collection and were capable of stepping across a 30% leg length height obstacle were recruited. In addition, eight healthy subjects of similar heights and gender participated in the experiment as controls. The Fugl-Meyer Assessment (FMA) and Berg Balance Scale for lower extremities were used to evaluate the motor function of the poststroke subjects. The clinical scales assessments were conducted by an experienced physiotherapist. The basic information for the poststroke patients is shown in Table 1. This study was approved by the Ethics Committee of the First Affiliated Hospital of Sun Yat-sen University. This study was conducted in accordance to the Declaration of Helsinki. All subjects provided written informed consent prior to enrollment.

Table 1. Background data of the stroke survivors.
Apparatus
The kinematic data were recorded by a 6-camera 3D motion analysis system (Vicon Motion Systems, Oxford, UK). Two force plates (AMTI, Watertown, MA, USA) situated in the middle of the path were used to record the force signals. The height-adjustable obstacle was placed between them. A diagram of the two force paths and obstacles is presented in Figure 1A. EMG data were recorded from the rectus femoris (RF), biceps femoris (BF), tibialis anterior (TA), and medial gastrocnemius of both sides for all subjects using preamplified wireless transmission modules. Figure 1B shows the flow diagram of the procedure for data collection. The apparatuses used in this study were the same as our previous experiment. A detailed description was provided in our previous study (14). The sample frequency for Vicon cameras was 100 Hz and 1 kHz for the force plates and EMG modules.
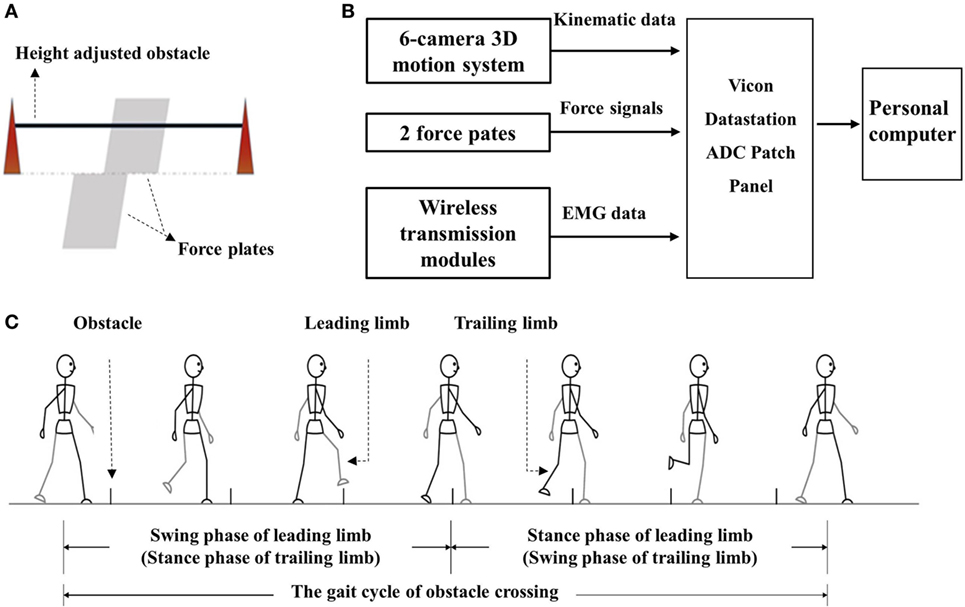
Figure 1. (A) The diagram of obstacle and force plate; (B) flow diagram of the procedure of data collection and storage; and (C) diagram of the gait cycle of obstacle cycle.
Procedure
The subjects’ heights, body weights, and leg lengths were first measured and recorded before kinematic data collection. The distance from the anterior superior iliac spine to the lateral malleolus was measured as leg length. This was then used to calibrate the height of the obstacle of each individual. Thirty-five 15-mm light-reflective markers and silver-silver chloride (Ag-AgCl) electrodes were attached to corresponding positions on each of the subjects. The target skin area was shaved and cleaned with alcohol to obtain better signals before the attachment of the electrodes (14).
The gait trials began after the preparation. The subjects were asked to walk along a volunteered walkway (8 m) at a volunteered speed with bare feet with an obstacle placed at a midway distance. Details of the trials were described previously (14). Figure 1C presents the gait cycle during obstacle crossing. Trials in which the subjects touched the obstacles or asked for assistance were ignored, and three successful trials for each height were recorded.
All subjects completed the maximum voluntary contraction tasks and three different height obstacle crossing tasks. No incident of fall was observed during all trials. The trials where help was received from therapist or the obstacle was touched were discarded. Discomfort or feelings of fatigue were not reported by any subjects during the tasks.
Data Processing
A 20-Hz low-pass fourth-order Butterworth filter was employed to filter the kinematic and kinetic data. When the toe marker was 2 mm off the ground, this was regarded as the toe-off time. The heel strike time could be recognized according to the change of force signal received by the force platforms. The gait cycle was then divided into two phases or a single lower limb: swing phase and stance phase. The raw EMG signals were collected at a frequency of 1 kHz and then were filtered through a fourth-order Butterworth filter with a frequency band from 10 to 350 Hz. As the frequency of mains of power supply was 50 Hz, a digital notch filter was used to subtract the disturbance of strong electromagnetic fields of 50 Hz that were present in the experiment conducted area.
The fApEn of an N sample series is computed as follows:
First, for a given m, we formed m-dimensional vector sequences:
For every , the distance between the two vectors and is:
The definition of similarity degree between two vectors and is as follows:
where r and n in Eq. 2 determine the width and gradient of the boundary.
The function φm averages the similarity and is defined as follows:
The fApEn is then calculated as follows:
Here, m = 2 and r = 0.15 * SD(signal) were set according to the previous study (30).
Signal Processing and Statistical Analysis
The fApEn values for all the muscles were averaged over three replicates for each subject during each height obstacle crossing. The SD values were also calculated. A two-way (group: control and poststroke × obstacle height: 10, 20, and 30% of leg length) repeated measure of variance (ANOVA) was performed on the fApEn values. A Bonferroni post hoc test was used to analyze the fApEn values. Kolmogorov–Smirnov test was applied to the variables. Pearson’s correlation coefficient was used to examine the relationship between the clinical scales and fApEn values when the variables were normally distributed. Spearman’s correlation coefficient was used when the variables were non-normally distributed. The significance level was set at 0.05. All the data were analyzed in SPSS 19.0 statistical software (SPSS Inc., USA).
Results
Figure 2 shows that the fApEn values of the four lower limb muscles of the trailing limb during the stance phase. Figure 3 presents the fApEn values of these four muscles during the swing phase. As presented, during this gait cycle, the fApEn values of poststroke subjects were lower than those of healthy controls. In addition, significantly lower fApEn values were found in the RF of poststroke subjects during the swing phase when compared with healthy controls (p < 0.05). As shown in Figures 2 and 3, most fApEn values of the four lower limb muscles of the trailing limb increased with the height of the obstacle. Furthermore, a significant increase was observed in the BF during the swing phase when the height of the obstacle increased from 10 to 30% of leg length (p < 0.05).
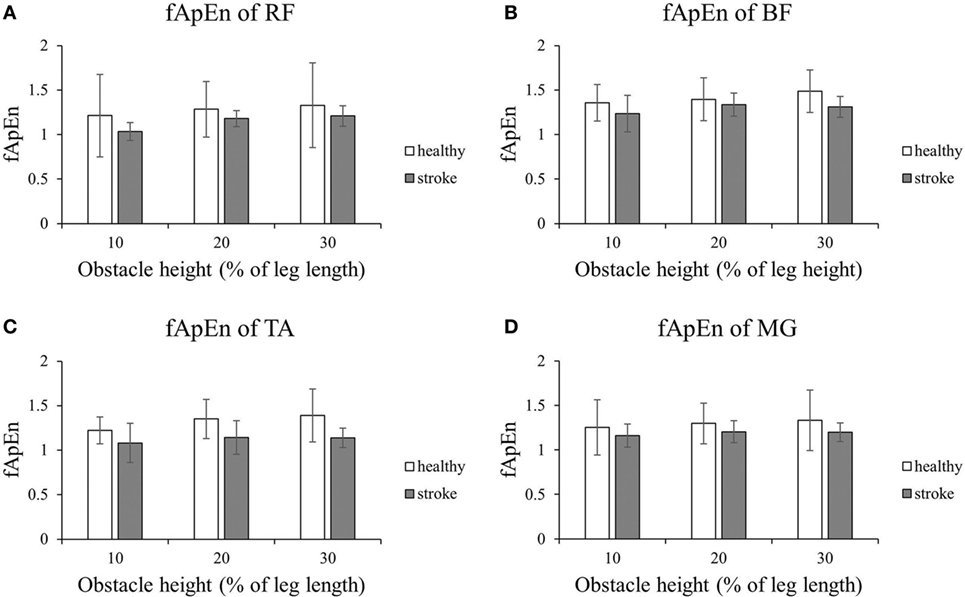
Figure 2. The details of fuzzy approximate entropy (fApEn) values of each height for trailing limb during stance phases. (A) The fApEn values of rectus femoris (RF); (B) the fApEn values of biceps femoris (BF). (C) The fApEn values of tibialis anterior (TA); (D) the fApEn values of medial gastrocnemius (MG).
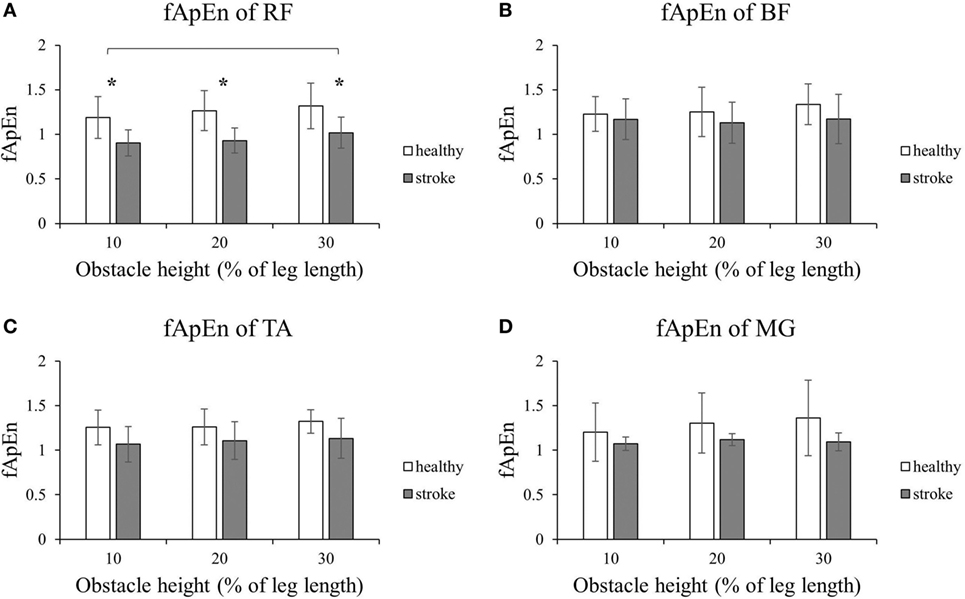
Figure 3. The details of fuzzy approximate entropy (fApEn) values of each height for trailing limb during swing phases. (A) The fApEn values of rectus femoris (RF); (B) the fApEn values of biceps femoris (BF). (C) The fApEn values of tibialis anterior (TA); (D) the fApEn values of medial gastrocnemius (MG). *Significant effect between groups. The bar (-) indicates significant effect between heights.
Figures 4 and 5 present the results of the four lower limb muscles of the leading limb during the swing phase and stance phase. As shown in Figure 4, during the swing phase, the fApEn values of the BF and RF in poststroke subjects were higher than in the healthy controls, and this result was similar for the TA during the swing phase when the obstacle height was 20 and 30% of leg length. Meanwhile, during the swing phase, fApEn values for all four muscles were lower in poststroke subjects compared with healthy controls. However, these differences between groups were non-significant (p > 0.05). Similar to the results of the trailing limb, the increase in the fApEn of the muscles with the obstacle height was also found in the leading limb. In addition, as presented in Figure 5, the fApEn value of the BF during the stance phase was statistically significantly greater when the obstacle height was 30% of leg length compared with 10 and 20% (p < 0.05). The correlations between fApEn and the two clinical scales were not statistically significant.
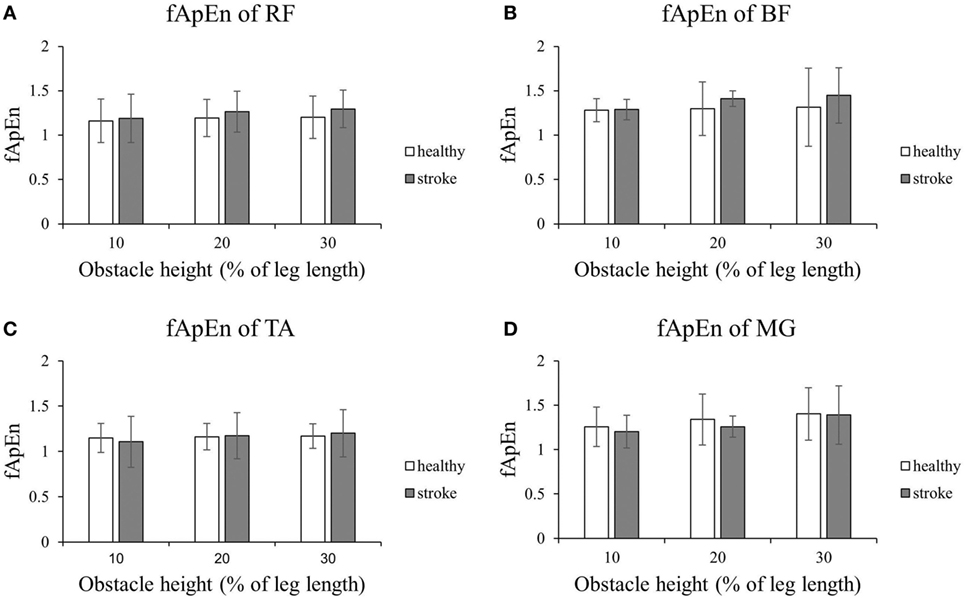
Figure 4. The details of fuzzy approximate entropy (fApEn) values of each height for leading limb during swing phases. (A) The fApEn values of rectus femoris (RF); (B) the fApEn values of biceps femoris (BF). (C) The fApEn values of tibialis anterior (TA); (D) the fApEn values of medial gastrocnemius (MG).
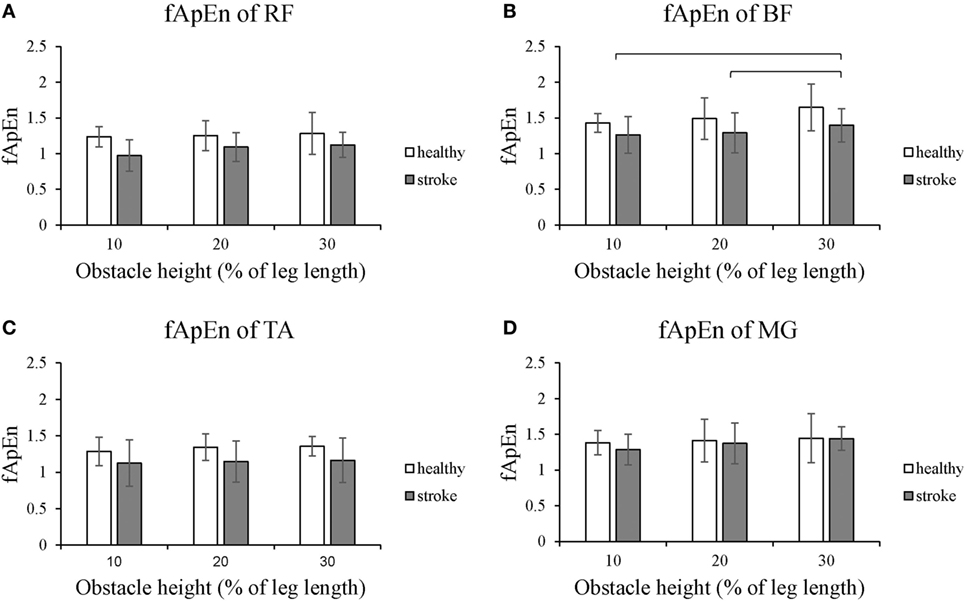
Figure 5. The details of fuzzy approximate entropy (fApEn) values of each height for leading limb during stance phases. (A) The fApEn values of rectus femoris (RF); (B) the fApEn values of biceps femoris (BF). (C) The fApEn values of tibialis anterior (TA); (D) the fApEn values of medial gastrocnemius (MG). The bar (-) indicates significant effect between heights.
Discussion
We recorded EMG signals and calculated the fApEn values of four lower limb muscles of poststroke subjects during different phases of obstacle crossing at different heights. Complexity change in muscle activations were then compared between poststroke subjects and healthy controls when they conducted this challenging task.
fApEn Values Change after a Stroke
The decreased fApEn values of EMG signals in poststroke subjects could be explained by that muscles were damaged, and they became disused after stroke. This might lead to their degenerated internal structure (31). The motor unit properties changed because of the reduced corticofugal output from the paretic hemisphere (32). In addition, the number of functioning motor units and the firing rate decreased with reduced discharge variability after a stroke (33, 34). These changes directly affect the electrical activity and might lead to reduced muscle force and disability in subtle responses to the perturbations during functional tasks. Here, the reduction in fApEn values was reflected in the decreased complexity of the EMG signals of poststroke subjects, which might be related to the alternations in the properties of motor units. Our findings were consistent with those reported by Ao et al., who found lower fApEn values in elbow muscles of poststroke subjects compared to healthy controls during trajectory-tracking tasks. This could be attributed to a reduced number and firing rate of active motor units (29). Similarly, the decreased complexity of EMG signals was also reported in other patients with neuromuscular disorders, such as Parkinson’s disease (35) and cerebral palsy (36), which could be explained by the disease-induced muscle fiber degeneration (37).
During swing phase, the fApEn values for the BF, RF, and TA (20 and 30% leg length) in the leading limb were higher in poststroke subjects than in healthy controls. This might be as a result of abnormal gait during obstacle crossing after a stroke. The swing phase of the leading limb during obstacle crossing caused the subjects to elevate their lower limb to secure sufficient toe-obstacle clearance, and this could be a challenge for poststroke subjects, leading to abnormal muscle activation patterns. Indeed, our previous study found that to avoid falling, toe-obstacle clearance of stroke survivors was greater than in healthy controls (38). The increased activation of thigh muscles in the BF and RF was found in stroke survivors (14). This might also contribute to the increased complexity of the EMG signals (36).
fApEn Values Change with Task Difficulties
When sustaining different levels of maximal voluntary contraction force in the upper limb, the complexity of EMG signals had been demonstrated to increase with increasing muscle contraction forces (23, 37, 39). In line with these findings, our results demonstrated that increasing obstacle heights demanded an increase in muscle contraction forces that in turn led to the recruitment of more motor units and increased firing rates in active motor units (14). Our results suggested that the complexity of the EMG signals increased with greater task demands, and this could also be applied to poststroke subjects. Therefore, safely crossing higher height obstacles requires increased muscle contraction forces and more activated motor units, leading to higher entropy values for the EMG signals (37).
However, there are still discrepancies about the complexity changes with task difficulties. To investigate the effect of task demands on motor entropy, Hong and Newell found that the entropy values of muscle forces decreased as the task demands increased (40). They explained the decreased entropy with increased task demands, but reduced environmental information, revealing a compensatory interaction between tasks and the environment on the force dynamics. Moreover, Murillo et al. found that fuzzy entropy of postural sway in healthy young adults decreased from the stable condition to the mid-level instability condition. This increased again at the highest instability condition at the anterior–posterior axis, which reflects the adaptations of postural control system to the platform instability (41). Therefore, the compensatory and adaptive nature of the motor control system to the task complexity warrants further investigation, especially in stroke survivors. Entropy analysis could be used to evaluate the effects of rehabilitation interventions targeting the motor recovery to restore complex motor tasks in persons after a stroke.
Limitations
There were several limitations in this study. First, considering the insufficient strength of the paretic leg during the stance phase, we did not instruct the poststroke subjects to first step over the obstacle with their unaffected side due to safety issue. Thus, we could not compare the paretic side with the unaffected side during the same task. In the future, we should introduce stroke subjects to first step over the obstacle with both affected and unaffected limbs. Second, moderate to high functional level of persons after stroke were recruited in this study. A large-scale study of different types of stroke subjects should be recruited in future study to investigate the influences of group and obstacle height, which may help explore the mechanisms and guide rehabilitation after stroke.
Conclusion
In this study, the stoke-related changes in complexity of lower muscles during obstacle crossing were investigated using fApEn. Results show that the complexity of RF in trailing limb during stance phase decreased in stroke group, which might be associated with the reduced number and firing rate of MU. However, during the swing phase, there were non-significant increases in the fApEn values of BF and RF in the trailing limb of the stroke group, resulting in a coping strategy when facing challenging tasks. During the gait, the complexity of muscle activation increases with obstacle height. That might be because higher obstacles demand greater muscle forces, which causes more motor units to be recruited and triggers higher firing rates of motor units. These findings based on the fApEn values of the EMG signals indicate that the complexity analysis using fApEn could be a suitable and non-invasive method to evaluate muscle function changes after stroke.
Ethics Statement
The study was approved by the Ethics Committee of the First Affiliated Hospital of Sun Yat-sen University. The study was conducted in accordance to the Declaration of Helsinki. All subjects provided written informed consent prior to enrollment.
Author Contributions
YC, CM, and NC conceived and designed the study and performed the experiments. YC and HH wrote the paper. RS and YZ contributed to experiments. RS and LL reviewed and edited the manuscript. All authors had read and approved the manuscript.
Conflict of Interest Statement
All financial, commercial, or other relationships that might be perceived by the academic community as representing a potential conflict of interest must be disclosed. If no such relationship exists, authors will be asked to confirm the following statement.
Acknowledgments
The authors would like to thank all the participants of this study.
Funding
This work was supported in part by the National Natural Science Foundation of China (No. 31771016, 81702227), the Guangdong Science and Technology Department (No. 2014B090901056, 2015B020214003, 2017B020210011), and the Project of Science and Technology Program of Guangzhou (No. 201604016034, 201604020108).
References
1. Batchelor FA, Mackintosh SF, Said CM, Hill KD. Falls after stroke. Int J Stroke (2012) 7(6):482. doi:10.1111/j.1747-4949.2012.00796.x
2. Mackintosh SF, Goldie P, Hill K. Falls incidence and factors associated with falling in older, community-dwelling, chronic stroke survivors (> 1 year after stroke) and matched controls. Aging Clin Exp Res (2005) 17(2):74–81. doi:10.1007/BF03324577
3. Pinter MM, Brainin M. Rehabilitation after stroke in older people. Maturitas (2012) 71(2):104–8. doi:10.1016/j.maturitas.2011.11.011
4. Weerdesteyn V, De NM, van Duijnhoven HJ, Geurts AC. Falls in individuals with stroke. J Rehabil Res Dev (2008) 45(8):1195. doi:10.1682/JRRD.2007.09.0145
5. Chen HL, Lu TW. Comparisons of the joint moments between leading and trailing limb in young adults when stepping over obstacles. Gait Posture (2006) 23(1):69. doi:10.1016/j.gaitpost.2004.12.001
6. Said CM, Goldie PA, Patla AE, Sparrow WA, Martin KE. Obstacle crossing in subjects with stroke. Arch Phys Med Rehabil (1999) 80(9):1054–9. doi:10.1016/S0003-9993(99)90060-6
7. Kerrigan DC, Frates EP, Rogan S, Riley PO. Hip hiking and circumduction: quantitative definitions. Am J Phys Med Rehabil (2000) 79(3):247–52. doi:10.1097/00002060-200005000-00006
8. Lu TW, Yen HC, Chen HL, Hsu WC, Chen SC, Hong SW, et al. Symmetrical kinematic changes in highly functioning older patients post-stroke during obstacle-crossing. Gait Posture (2010) 31(4):511–6. doi:10.1016/j.gaitpost.2010.02.012
9. Said CM, Goldie PA, Culham E, Sparrow WA, Patla AE, Morris ME. Control of lead and trail limbs during obstacle crossing following stroke. Phys Ther (2005) 85(5):413–27. doi:10.1093/ptj/85.5.413
10. Kleissen RF, Buurke JH, Harlaar J, Zilvold G. Electromyography in the biomechanical analysis of human movement and its clinical application. Gait Posture (1998) 8(2):143. doi:10.1016/S0966-6362(98)00025-3
11. Zhai X, Jelfs B, Chan R, Tin C. Self-recalibrating surface EMG pattern recognition for neuroprosthesis control based on convolutional neural network. Front Neurosci (2017) 11:379. doi:10.3389/fnins.2017.00379
12. Chen Y, Yang Z. A novel hybrid model for drawing trace reconstruction from multichannel surface electromyographic activity. Front Neurosci (2017) 11:61. doi:10.3389/fnins.2017.00061
13. Kisielsajewicz K, Fang Y, Hrovat K, Yue GH, Siemionow V, Sun CK, et al. Weakening of synergist muscle coupling during reaching movement in stroke patients. Neurorehabil Neural Repair (2011) 25(4):359. doi:10.1177/1545968310388665
14. Ma C, Chen N, Mao Y, Huang D, Song R, Li L. Alterations of muscle activation pattern in stroke survivors during obstacle crossing. Front Neurol (2017) 8:70. doi:10.3389/fneur.2017.00070
15. Farina D, Fattorini L, Felici F, Filligoi G. Nonlinear surface EMG analysis to detect changes of motor unit conduction velocity and synchronization. J Appl Physiol (2002) 93(5):1753–63. doi:10.1152/japplphysiol.00314.2002
16. Arjunan SP, Kumar DK editors. Fractal theory based Non-linear analysis of sEMG. Int Conf Intel Sens Networks Inf (2007):545–8. doi:10.1109/ISSNIP.2007.4496901
17. Gitter JA, Czerniecki MJ. Fractal analysis of the electromyographic interference pattern. J Neurosci Methods (1995) 58(1–2):103. doi:10.1016/0165-0270(94)00164-C
18. Dingwell JB, Cusumano JP. Nonlinear time series analysis of normal and pathological human walking. Chaos (2000) 10(4):848. doi:10.1063/1.1324008
19. Chen W, Wang Z, Xie H, Yu W. Characterization of surface EMG signal based on fuzzy entropy. IEEE Trans Neural Sys Rehabil Eng (2007) 15(2):266–72. doi:10.1109/TNSRE.2007.897025
20. Pincus SM. Approximate entropy as a measure of system complexity. Proc Natl Acad Sci U S A (1991) 88(6):2297–301. doi:10.1073/pnas.88.6.2297
21. Zhang X, Zhou P. Sample entropy analysis of surface EMG for improved muscle activity onset detection against spurious background spikes. J Electromyogr Kinesiol (2012) 22(6):901–7. doi:10.1016/j.jelekin.2012.06.005
22. Estrada L, Torres A, Sarlabous L, Jané R. Improvement in neural respiratory drive estimation from diaphragm electromyographic signals using fixed sample entropy. IEEE J Biomed Health Inform (2016) 20(2):476. doi:10.1109/JBHI.2015.2398934
23. Xu Z, Wang D, Yu Z, Xiang C, Sheng L, Ping Z. EMG-torque relation in chronic stroke: a novel EMG complexity representation with a linear electrode array. IEEE J Biomed Health Inform (2016) 21(6):1562–72. doi:10.1109/JBHI.2016.2626399
24. Shannon CE. IEEE Xplore abstract – a mathematical theory of communication. Bell Sys Tech J (1948) 27(4):379–423. doi:10.1002/j.1538-7305.1948.tb00917.x
25. Kolmogorov AN. A new metric invariant of transient dynamical systems and automorphisms in Lebesgue spaces. Dokl Akad Nauk SSSR NS (1958) 951(5):861–4.
26. Pincus S. Approximate entropy (ApEn) as a complexity measure. Chaos (1995) 5(1):110. doi:10.1063/1.166092
27. Richman JS, Moorman JR. Physiological time-series analysis using approximate entropy and sample entropy. Am J Physiol Heart Circ Physiol (2000) 278(6):H2039–49. doi:10.1152/ajpheart.2000.278.6.H2039
28. Xie HB, Chen WT, He WX, Liu H. Complexity analysis of the biomedical signal using fuzzy entropy measurement. Appl Soft Computing (2011) 11(2):2871–9. doi:10.1016/j.asoc.2010.11.020
29. Ao D, Sun R, Tong KY, Song R. Characterization of stroke- and aging-related changes in the complexity of EMG signals during tracking tasks. Ann Biomed Eng (2015) 43(4):990–1002. doi:10.1007/s10439-014-1150-1
30. Sun R, Song R, Tong KY. Complexity analysis of EMG signals for patients after stroke during robot-aided rehabilitation training using fuzzy approximate entropy. IEEE Trans Neural Syst Rehabil Eng (2014) 22(5):1013–9. doi:10.1109/TNSRE.2013.2290017
31. Ramsay JW, Barrance PJ, Buchanan TS, Higginson JS. Paretic muscle atrophy and non-contractile tissue content in individual muscles of the post-stroke lower extremity. J Biomech (2011) 44(16):2741–6. doi:10.1016/j.jbiomech.2011.09.001
32. Cicinelli P, Traversa R, Rossini PM. Post-stroke reorganization of brain motor output to the hand: a 2-4 month follow-up with focal magnetic transcranial stimulation. Electroencephalogr Clin Neurophysiol (1997) 105(6):438–50. doi:10.1016/S0924-980X(97)00052-0
33. Li X, Wang YC, Suresh NL, Rymer WZ, Zhou P. Motor unit number reductions in paretic muscles of stroke survivors. IEEE Trans Inf Technol Biomed (2011) 15(4):505–12. doi:10.1109/TITB.2011.2140379
34. Mcnulty PA, Lin G, Doust CG. Single motor unit firing rate after stroke is higher on the less-affected side during stable low-level voluntary contractions. Front Hum Neurosci (2014) 8(8):518. doi:10.3389/fnhum.2014.00518
35. Meigal AY, Rissanen SM, Tarvainen MP, Airaksinen O, Kankaanpää M, Karjalainen PA. Non-linear EMG parameters for differential and early diagnostics of Parkinson’s disease. Front Neurol (2013) 4:135. doi:10.3389/fneur.2013.00135
36. Wen T, Xu Z, Xiang C, Wu D, Ping Z. Multi-scale complexity analysis of muscle coactivation during gait in children with cerebral palsy. Front Hum Neurosci (2015) 9:367. doi:10.3389/fnhum.2015.00367
37. Istenič R, Kaplanis PA, Pattichis CS, Zazula D. Multiscale entropy-based approach to automated surface EMG classification of neuromuscular disorders. Med Biol Eng Comput (2010) 48(8):773–81. doi:10.1007/s11517-010-0629-7
38. Chen N, Mao Y, Huang D. Kinematic analysis of crossing obstacle with different height following stroke. Chin J Rehab Med (2015) 30(4):334–8. doi:10.3969/j.issn.1001-1242.2015.04.005
39. Li X, Suresh A, Zhou P, Rymer WZ. Alterations in the peak amplitude distribution of the surface electromyogram poststroke. IEEE Trans Biomed Eng (2013) 60(3):845–52. doi:10.1109/TBME.2012.2205249
40. Hong SL, Newell KM. Motor entropy in response to task demands and environmental information. Chaos (2008) 18(3):033131. doi:10.1063/1.2979695
Keywords: fuzzy approximate entropy, obstacle crossing, stroke, gait, electromyography
Citation: Chen Y, Hu H, Ma C, Zhan Y, Chen N, Li L and Song R (2018) Stroke-Related Changes in the Complexity of Muscle Activation during Obstacle Crossing Using Fuzzy Approximate Entropy Analysis. Front. Neurol. 9:131. doi: 10.3389/fneur.2018.00131
Received: 16 December 2017; Accepted: 22 February 2018;
Published: 12 March 2018
Edited by:
Xu Zhang, University of Science and Technology of China, ChinaReviewed by:
Bo Yao, Chinese Academy of Medical Sciences and Peking Union Medical College, ChinaWens Hou, Chongqing University, China
Copyright: © 2018 Chen, Hu, Ma, Zhan, Chen, Li and Song. This is an open-access article distributed under the terms of the Creative Commons Attribution License (CC BY). The use, distribution or reproduction in other forums is permitted, provided the original author(s) and the copyright owner are credited and that the original publication in this journal is cited, in accordance with accepted academic practice. No use, distribution or reproduction is permitted which does not comply with these terms.
*Correspondence: Le Li, lile5@mail.sysu.edu.cn;
Rong Song, songrong@mail.sysu.edu.cn
†These authors have contributed equally to this work.