- 1Department of Medical Imaging, The Affiliated Huai'an No. 1 People's Hospital of Nanjing Medical University, Huai'an, China
- 2Department of Radiology, The Affiliated Xi'an Central Hospital of Xi'an Jiaotong University, Xi'an, China
- 3Department of Hematology, The Affiliated Huai'an No. 1 People's Hospital of Nanjing Medical University, Huai'an, China
- 4Department of Interventional Radiology, The Affiliated Huai'an No. 1 People's Hospital of Nanjing Medical University, Huai'an, China
Objective: To investigate the brain functional organization induced by sleep deprivation (SD) using functional connectivity density (FCD) analysis.
Methods: Twenty healthy subjects (12 female, 8 male; mean age, 20.6 ± 1.9 years) participated a 24 h sleep deprivation (SD) design. All subjects underwent the MRI scan and attention network test twice, once during rested wakefulness (RW) status, and the other was after 24 h acute SD. FCD was divided into the shortFCD and longFCD. Receiver operating characteristic (ROC) curve was used to evaluate the discriminating ability of those FCD differences in brain areas during the SD status from the RW status, while Pearson correlations was used to evaluate the relationships between those differences and behavioral performances.
Results: Subjects at SD status exhibited lower accuracy rate and longer reaction time relative to RW status. Compared with RW, SD had a significant decreased shortFCD in the left cerebellum posterior lobe, right cerebellum anterior lobe, and right orbitofrontal cortex, and increased shortFCD in the left occipital gyrus, bilateral thalamus, right paracentral lobule, bilateral precentral gyrus, and bilateral postcentral gyrus. Compared with RW, SD had a significant increased longFCD in the right precentral gyrus, bilateral postcentral gyrus, and right visuospatial network, and decreased longFCD in the default mode network. The area under the curve values of those specific FCD differences in brain areas were (mean ± std, 0.933 ± 0.035; 0.863~0.977). Further ROC curve analysis demonstrated that the FCD differences in those brain areas alone discriminated the SD status from the RW status with high degree of sensitivities (89.19 ± 6%; 81.3~100%) and specificities (89.15 ± 6.87%; 75~100%). Reaction time showed a negative correlation with the right orbitofrontal cortex (r = −0.48, p = 0.032), and accuracy rate demonstrated a positive correlation with the right default mode network (r = 0.573, p = 0.008).
Conclusions: The longFCD and shortFCD analysis might be potential indicator biomarkers to locate the underlying altered intrinsic brain functional organization disturbed by SD. SD sustains the cognitive performance by the decreased high-order cognition related areas and the arousal and sensorimotor related areas.
Introduction
Sleep deprivation, widespread in current society, can be caused by environmental factors or personal reasons. It generally has a deleterious effect on emotional regulation, memory, attention, and executive control function (1–5), and even metabolic, physiological, psychological, and/or behavioral reactivity with a greater risk of being multiorgan and multisystem dysfunction (6–9). Recently, several studies have demonstrated structural and functional changes in the frontal cortex, parietal cortex, and temporal cortex in individuals after acute SD (1, 6, 10–21); however, the neurologic mechanism of acute SD has not been fully studied.
Resting-state functional MRI (rfMRI) can combine the functional images and structural images without exposure to radioactive tracers, which makes the rfMRI suitable for mechanism and pathophysiology exploration in several diseases (1). The advance of rfMRI can help us non-invasively explore the functional organization in the human brain thus better characterize the changes of regional neuronal spontaneous brain activity and intrinsic connectivity patterns to understand the underlying neural basis of neuropsychiatric disorders.
Seed-based functional connectivity studies have revealed abnormal connectivity patterns in individuals with insufficient sleep in brain regions related to emotion and cognition (13, 18, 21–26); however, the seed-based functional connectivity analysis provides limited information about the relationships between the time series of a given seed point area and the time series of other areas in a whole brain network (27, 28). Voxel-based functional connectivity density (FCD) was used to identify the distribution of hubs in the human brain (29). In contrast to the seed-based functional connectivity analysis, the FCD analysis, similar to the degree centrality analysis, provides an opportunity for unbiased searches abnormalities within the whole brain without the need for a prior definition of regions of interest (27). The FCD can be divided into the short-range FCD and long-range FCD on the basis of the neighboring relationships between brain voxels (30). Recently, the FCD analysis has been widely applied to the exploration of the neurophysiological basis of several diseases (31–34), and reveals extra information which cannot be provided by the seed-based functional connectivity analysis. In this framework, in the present study we utilized the potential indicators of shortFCD and longFCD approaches to characterize the changes of intrinsic functional connectivity strength after acute SD status relative to rested wakefulness (RW) status, and further explore the potential neurobiological mechanisms of SD.
Materials and Methods
Subjects
Twenty healthy subjects (12 female, 8 male; mean age, 20.6 ± 1.9 years; mean education, 14.5 ± 1.19 years) participated in a 24 h SD design experiment. All subjects met the following criteria, as in previous studies (1, 6):
• Right-handed
• Good sleep habits without any symptoms of sleep disorders [such as difficulties in sleep onset (> 30 min) and/or maintaining sleep]
• Pittsburgh sleep quality index score < 5
• No consumption of any nicotine, hypnotic, or psychoactive medications, diet pills, alcohol, and caffeine for ≥ 3 months prior and during to the current study
• Regular dietary habit with moderate weight and body shape
• No foreign implants, inborn, and acquired diseases
Each of the subjects underwent the MRI scan twice; once during RW status, and the other after 24 h' acute SD. The acute SD process started at 19:00 on the first day and lasted until 07:00 in the second day. The food and water were provided during the SD procedure. The temperature of the room was maintained between 23°C and 27°C. The team took turns to monitor and make sure that the participants did not fall asleep using video monitors. This study was approved by the Medical Research Ethical Committee of The Affiliated Huai'an No. 1 People's Hospital of Nanjing Medical University in accordance with the Declaration of Helsinki. All volunteers participated voluntarily and were informed of the purposes, methods, and potential risks of this study, and signed an informed consent form.
MRI
The MRI examination was performed, via acquisition, on a clinical 3T MRI scanner (SIEMENS Trio, Erlangen, Siemens, Germany) with a standard eight-channel head coil using a 12-channel array coil. First, we acquired a high-resolution 3D anatomical images with 176 T1-weighted images in a sagittal orientation: repetition time = 1950 ms, gap = 0 mm, echo time = 2.3 ms, thickness = 1 mm, acquisition matrix = 248 × 256, flip angle = 9°, field of view = 244 × 252 mm. Second, we also acquired 240 functional images using a single-shot Gradient-Recalled Echo-Planar Imaging pulse sequence (repetition time = 3000 ms, gap = 0.5 mm, echo time = 25 ms, thickness = 5.0 mm, flip angle = 90°, acquisition matrix = 32 × 32, field of view = 210 × 210 mm).
Attention Network Test (ANT)
Before the MRI scan, all volunteers underwent an attention network test (ANT) (1, 12, 35, 36). The ANT contained three cue conditions (no cue, center cue, spatial cue) and two target conditions (congruent and incongruent). The visual stimuli consisted of a row of five horizontal black arrows pointing leftward or rightward with the target arrow in the center. The participants responded to the direction of the central arrow by pressing the left or right buttons of the computer mouse. The task measured alerting, orienting, and conflict effects by calculating the difference between the response time and the presentation time under three different cue conditions. The accuracy rate using corrected recognition, reaction time using only trials with correct responses, and lapse rate using missing recognition, were calculated.
Data Analysis
First, the first 10 time points of the functional images were deleted, due to the possible instability of the initial MRI signal. The remaining data was analyzed by Data Processing & Analysis for Brain Imaging (DPABI 2.1, http://rfmri.org/DPABI) toolbox based on MATLAB2010a (Mathworks, Natick, MA, USA). The data preprocessing contained the following steps: including the format transformation, slice timing, head motion correction spatial normalization to the Montreal Neurological Institute (MNI) space, and smooth. The data of participants with > 1.5 mm maximum translation in x, y, or z directions and >1.5° degree of motion rotation were removed. Based on the recent work showing that higher-order models benefit from the removal of head motion effects (37, 38), after the head motion correction, The functional images were re-sampled at a resolution of 3 × 3 × 3 mm3 during the spatial normalization. Linear regression was applied to remove the effects of spurious covariates, including the Friston 24 head motion parameters, global mean signal, white matter and cerebrospinal fluid signal. Next, the functional images were entered into temporally bandpass filtered (0.01–0.1 Hz) and linearly detrended.
Calculation of Long FCD and ShortFCD Calculation Maps
The local and global FCD maps for each individual were calculated in a gray matter (GM) mask. The number of functional connections of a given voxel was considered as a degree of a node in a binary graph. First, we defined the functional connectivity between a given voxel with each of other voxels in the whole brain with a correlation threshold of r > 0.25 (39). In the present study, we adopted the threshold of r = 0.3 to calculate the FCD maps. Second, the longFCD and shortFCD were defined based on the neighborhood strategy. We defined the voxels with a correlation threshold of r > 0.25 inside their neighborhood (radius sphere ≤ 6 mm) as shortFCD, and defined the voxels with a correlation threshold of r > 0.25 outside their neighborhood (radius sphere > 6 mm) as long FCD. Next, the shortFCD and longFCD maps of each subject were divided by the mean value so as to convert to Z scores to improve the normality. Finally, the shortFCD and longFCD maps underwent spatial smoothing with a Gaussian kernel of 6 × 6 × 6 mm3 full-width at half-maximum using SPM8. The detailed procedure of the shortFCD and longFCD is given in a previous study (29).
Statistical Analysis
Data was presented as mean ± standard deviation (mean ± std). Pair t-tests were used for demographic factors (age, years of education, and ANT findings). p < 0.05 was considered as significant.
Pair t-tests were used to investigate the FCD differences in regional brain areas of the subjects during the acute SD status relative to the RW status. AlphaSim correction (threshold of individual voxel of p < 0.05 and cluster level of p < 0.05) was used to determine the statistical differences.
We used the receiver operating characteristic (ROC) curve to investigate the ability of those binarized FCD differences in regional brain areas to distinguish the SD status from the RW status, and we used Pearson correlations to evaluate the relationships between those binarized FCD differences in brain areas and ANT during the SD status. The statistical threshold was set at P < 0.05.
Results
Ant Findings
Individuals at acute SD status showed a lower accuracy rate (acute SD = 96.25 ± 2.32%, RW = 97.85 ± 1.77%; t = −2.482, p = 0.023; Figure 1A) and a longer reaction time (acute SD = 635.27 ms ± 82.68 ms; RW = 540.01 ± 48.37 ms; t = 5.013, p < 0.001; Figure 1B) during the ANT relative to the individuals at RW status.
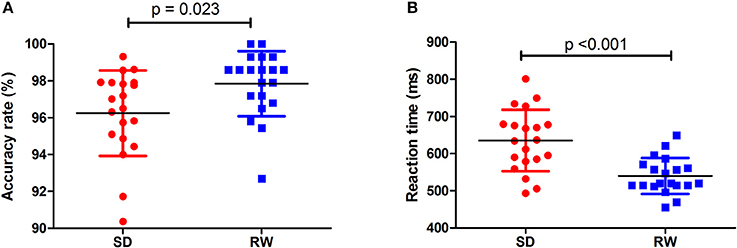
Figure 1. Behavioral findings of ANT. The accuracy rate and reaction time of RW group (A) and SD group (B), respectively. Data is presented as mean ± standard error. ANT, Attention network test; SD, Sleep deprivation; RW, Rested wakefulness.
FCD Differences Between-Groups
First, we performed one-sample t-test to explore the FCD differences at within-group level for each group. Figure 2 shows the shortFCD maps in the SD group (Figure 2A) and RW group (Figure 2B), respectively. Figure 3 shows the longFCD maps in the SD group (Figure 3A) and RW group (Figure 3B), respectively. The covered differences in brain areas both in binarized shortFCD and in binarized longFCD were larger in the SD group than that of RW group.
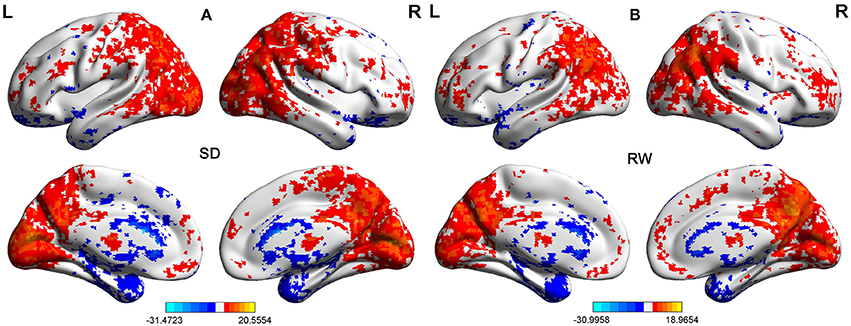
Figure 2. One sample t-test differences of SD and RW in Binarized shortFCD. The Binarized shortFCD maps in the SD group (A) and the RW group (B), respectively. These maps are the results of the within-groups using one-sample t-tests, corrected by FDR. L, left; R, right; SD, sleep deprivation; RW, rested wakefulness; shortFCD, short-range functional connectivity density; FDR, false discovery rate.
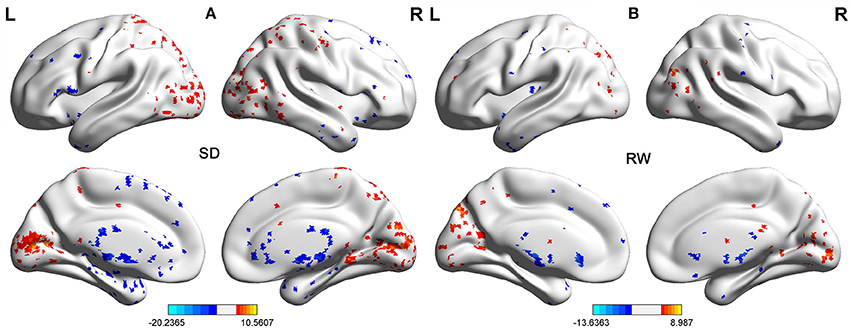
Figure 3. One sample t-test differences of SD and RW in Binarized longFCD. The Binarized longFCD maps in the SD group (A) and the RW group (B), respectively. These maps are the results of the within-groups using one-sample t-tests, corrected by FDR. L, left; R, right; SD, sleep deprivation; RW, rested wakefulness; longFCD, long-range functional connectivity density; FDR, false discovery rate.
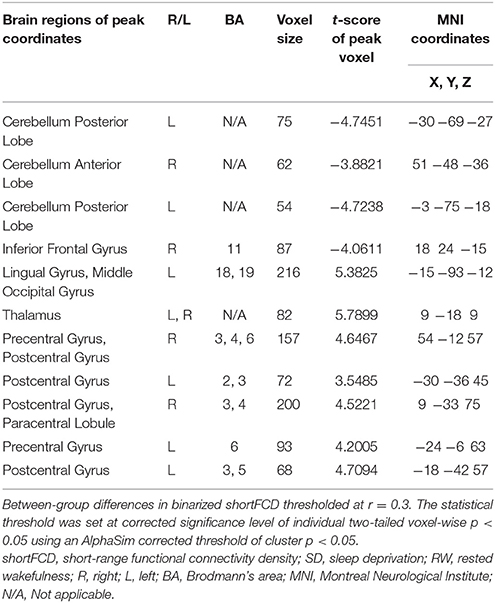
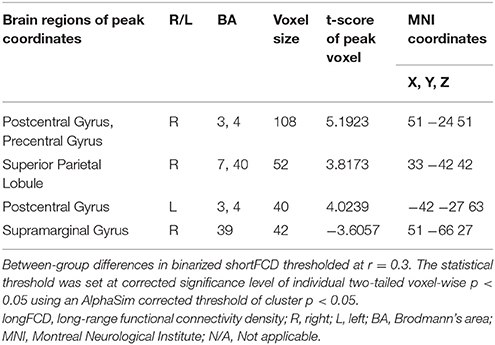
Second, we performed pair t-tests to explore the FCD differences between-groups. Compared with RW, acute SD had significant decreased binarized shortFCD areas in the left cerebellum posterior lobe, right cerebellum anterior lobe (Figure 4A) and right inferior frontal gyrus (orbitofrontal cortex), and increased binarized shortFCD areas in the left occipital gyrus, bilateral thalamus, right paracentral lobule, bilateral precentral gyrus, and bilateral postcentral gyrus (Table 1, Figure 4B). Compared with RW, acute SD had significant increased binarized longFCD areas in the right precentral gyrus, bilateral postcentral gyrus, and right superior parietal lobule in the visuospatial network, and decreased binarized longFCD areas in the right supramarginal gyrus in the default mode network (Table 2, Figure 5).
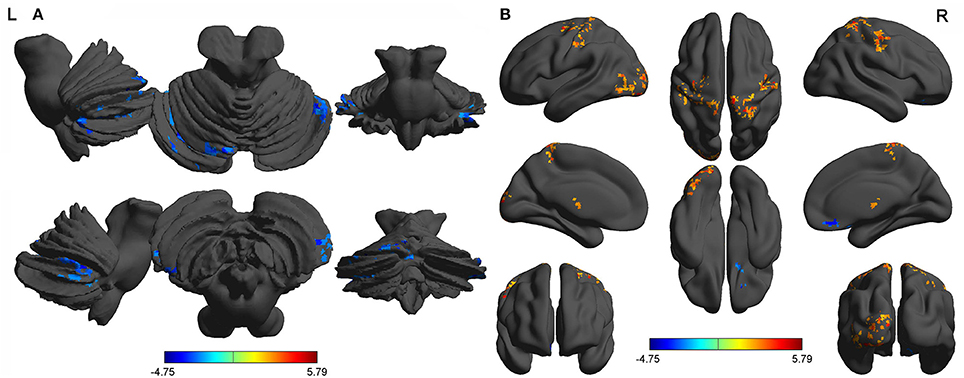
Figure 4. Binarized shortFCD differences between SD and RW. The color in the map represents the differences. The blue signifies decreased binarized shortFCD in brain areas (A), and the red color signifies increased binarized shortFCD in brain areas (B). shortFCD, short-range functional connectivity density; SD, Sleep deprivation; RW, Rested wakefulness; L, left; R, right.
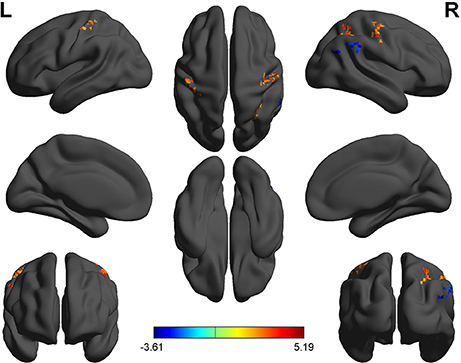
Figure 5. Binarized longFCD differences between SD and RW. The color in the map represents the differences. The red color signifies increased binarized longFCD in brain areas, and the blue signifies decreased binarized longFCD in brain areas. longFCD, long-range functional connectivity density; SD, Sleep deprivation; RW, Rested wakefulness; L, left; R, right.
ROC Curve
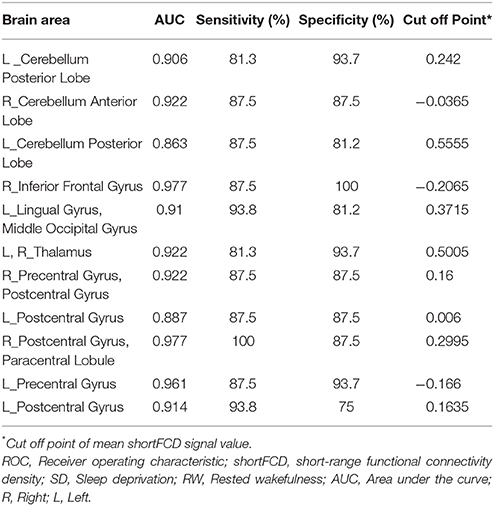
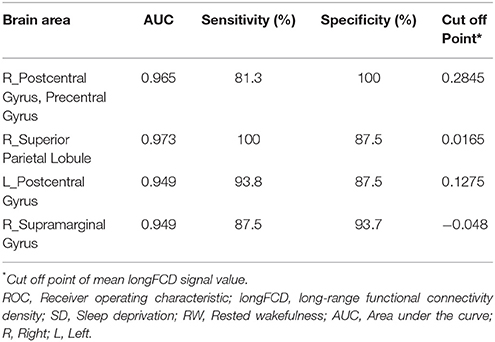
The mean beta value of binarized shortFCD (Figure 6A) and binarized longFCD (Figure 6B) differences in those altered brain areas were extracted. These different binarized FCD differences in brain areas were further used for the ROC curve to evaluate their ability to distinguish the acute SD status from the RW status. The area under the curve (AUC) values of those specific binarized FCD differences in brain areas were (mean ± std, 0.933 ± 0.035; 0.863~0.977). Further ROC curve demonstrated that the binarized FCD differences in those regional brain areas alone discriminated the acute SD status from the RW status with high degree of sensitivities (mean ± std, 89.19 ± 6%; 81.3~100%) and specificities (mean ± std, 89.15 ± 6.87%; 75~100%) (Tables 3–4, Figure 7).
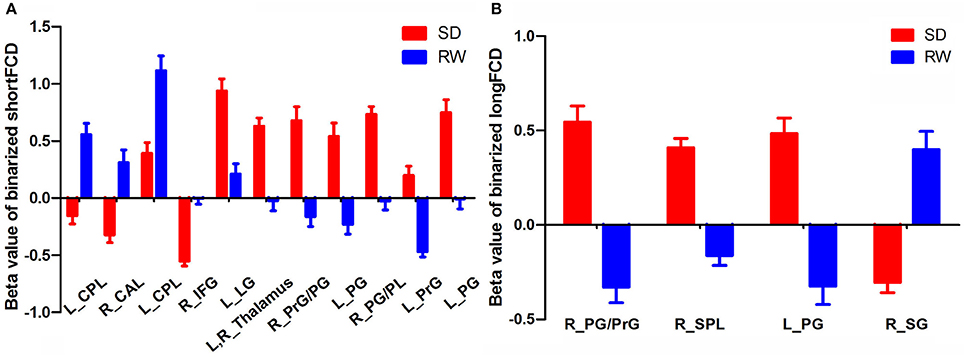
Figure 6. Binarized shortFCD value (A) and longFCD value (B) of between-group differences in brain areas. Data are mean ± standard error values. L, left; R, right; shortFCD, short-range functional connectivity density; longFCD, long-range functional connectivity density; CPL, Cerebellum posterior lobe; CAL, Cerebellum anterior lobe; IFG, Inferior frontal gyrus; LG, Lingual gyrus; PrG, precentral gyrus; PG, Postcentral gyrus; PL, Paracentral lobule; SPL, Superior parietal lobule; SG, Supramarginal gyrus; SD, Sleep deprivation; RW, Rested wakefulness.
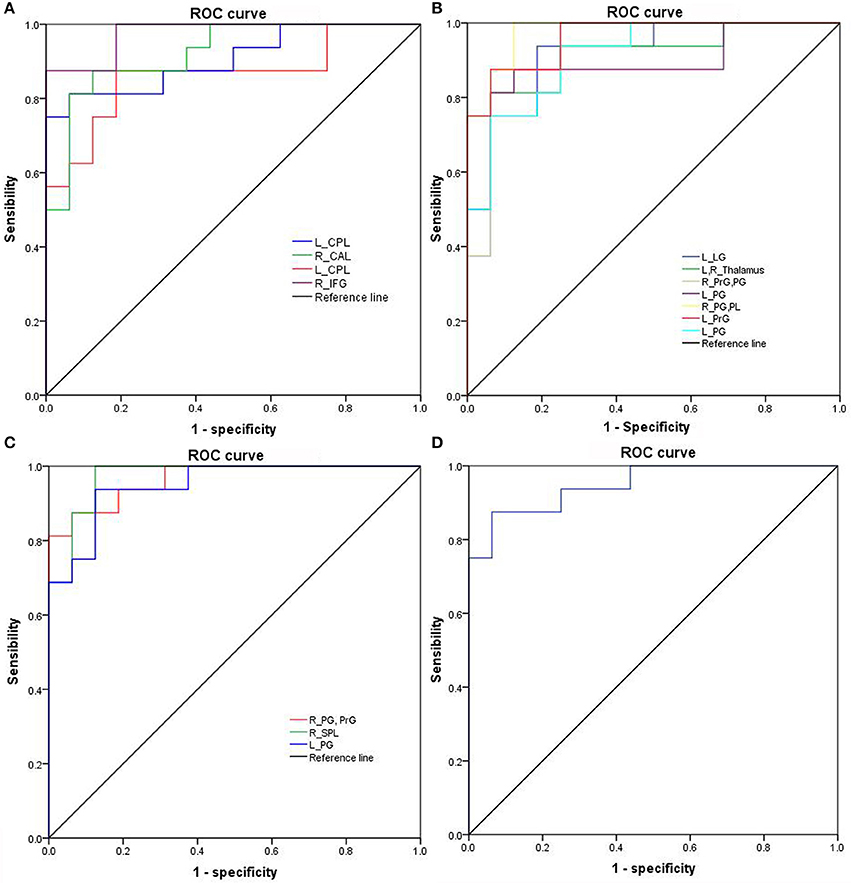
Figure 7. ROC curve of binarized FCD differences in regional brain areas. ROC curve of regional brain areas with decreased binarized shortFCD (A), increased binarized shortFCD (B), increased binarized longFCD (C), and decreased binarized longFCD (D). ROC, Receiver operating characteristic; R, right; L, left; CPL, Cerebellum posterior lobe; CAL, Cerebellum anterior lobe; IFG, Inferior frontal gyrus; LG, Lingual gyrus; PrG, precentral gyrus; PG, Postcentral gyrus; PL, Paracentral lobule; SPL, Superior parietal lobule; SG, Supramarginal gyrus; SD, Sleep deprivation; RW, Rested wakefulness; shortFCD, short-range functional connectivity density; longFCD, long-range functional connectivity density.
Pearson Correlation Analysis
The reaction time showed negative correlation with the mean beta value of binarized shortFCD in the right inferior frontal gyrus (r = −0.48, p = 0.032; Figure 8A), and the accuracy rate demonstrated a positive correlation with the mean beta value of binarized longFCD in the right supramarginal gyrus (r = 0.573, p = 0.008; Figure 8B). None of the other correlations between the mean beta value of binarized FCD in other different areas and the ANT during the acute SD status were found (p > 0.05).
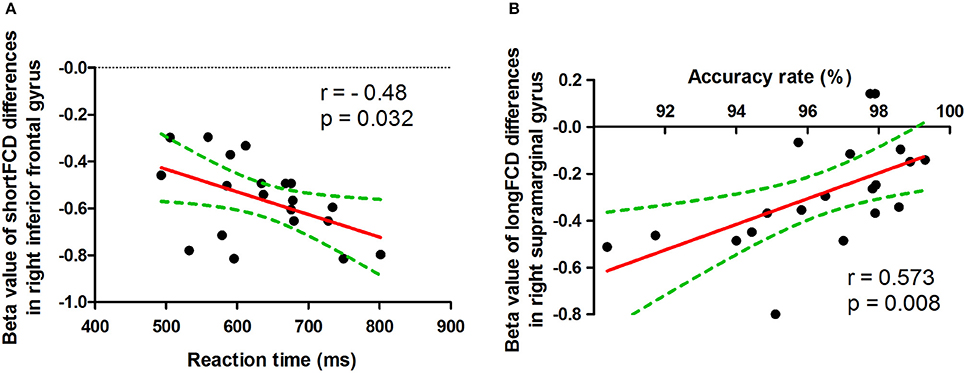
Figure 8. Pearson correlation between beta value of FCD differences in brain areas and ANT. ShortFCD, short-range functional connectivity density; longFCD, long-range functional connectivity density.
Discussion
In the present study, we utilized shortFCD and longFCD analysis to characterize the differences of intrinsic functional connectivity induced by acute SD, and their correlations with the ANT. Specifically, we found that acute SD was associated with binarized shortFCD alterations in more regional brain areas than that of binarized longFCD. Acute SD was associated with a significant decrease in binarized shortFCD areas in the cerebellum posterior/anterior lobe and orbitofrontal cortex, and significant increase in the occipital gyrus, thalamus, paracentral lobule, and precentral/postcentral gyrus. Using the binarized longFCD method, only the supramarginal gyrus in the default mode network with decreased binarized longFCD were observed after acute SD relative to RW, and significantly increased binarized longFCD in the precentral/postcentral gyrus and visuospatial network were found. Furthermore, the ANT showed correlations with the beta value of FCD differences in those brain areas during the SD status. Recently, the ROC curve was widely used to applied into the exploration of the reliability of one neuroimaging approach as a potential indicator in distinguishing one group from the other group (1, 40, 41). In general, an AUC value between 0.9 and 1 is considered as excellent, while a value between 0.8 and 0.9 is considered as good. In the present study, the ROC curve demonstrated that the AUC values of the binarized FCD differences in those brain areas showed good discriminating abilities with extremely high AUC values (0.933 ± 0.035; 0.863~0.977). Further diagnostic analysis revealed that the binarized FCD differences in those regional brain areas alone discriminated the acute SD status from the RW status with extremely high degree of sensitivity (89.19 ± 6%; 81.3~100%) and specificities (89.15 ± 6.87%; 75~100%).
The default-mode network is thought to be associated with self-referential mental activity (42), extraction of episodic memory (43), sleep and daydreaming (1, 44), and social cognitive processes related to decision making and self-regulation (45, 46). The orbitofrontal cortex, connected with prefrontal, and deep structures known to mediate sensorimotor processing, motivation, and self-evaluation, is thought to be responsible for mediating the interactions between emotional processes and cognitive functions (47, 48), and play a significant role in fatigue, executive functions, attention, and motivation (49–51). This area is particularly vulnerable to subjects with sleep loss (40, 41, 52, 53). The decreased gray matter volume in the orbitofrontal cortex has previously been reported in patients with daytime sleepiness and chronic insomnia (54, 55). In the present study, we found that acute SD was associated with a significant decreased binarized longFCD within the default mode network node and decreased binarized shortFCD in the right orbitofrontal cortex, which showed an extremely high degree of sensitivity and specificity in distinguishing the acute SD status from the RW status. In addition, the accuracy rate of the ANT demonstrated a positive correlation with the mean beta value of binarized longFCD in the default mode network node, and the reaction time of the ANT showed negative correlation with the mean beta value of binarized shortFCD in the orbitofrontal cortex. We speculated that the decreased long-/shortFCD in the default mode network and orbitofrontal cortex implicated the brain's exertion of voluntary control to remain awake and perform, which might be sensitive biomarkers for advanced cognitive function.
Higher level visual brain areas are divided into two distinct visual pathways: the object properties processing pathway and the spatial properties processing pathway (56–58). The spatial properties processing pathway runs from the occipital lobe up to the posterior parietal lobe and has been called the dorsal system. This system processes object localization and spatial attributes, and is also essential for guiding movements. Damage to the dorsal pathway disrupts the ability to visualize locations or perceive space. The postcentral gyrus is the main receptive region for external stimuli as the location of the primary somatosensory cortex. Recently the postcentral gyrus was implicated with the default mode network (59), which are functional brain hubs showing coupled slow signal fluctuations in the absence of external stimuli during restful waking and sleep (60). The thalamus is a vital region in integrating neural activity from widespread neocortical inputs and outputs, and is thought to play an important role in regulating state of sleep and wakefulness. Previous PET studies have revealed that SD could increase the metabolic rate of glucose in the visual cortex, somatosensory cortex, and fusiform gyrus, which were much higher after 48 h and 72 h than after 24 h SD (61, 62). Previous neuroimaging studies observed disturbed regional spontaneous neural activities in brain areas of the two visual pathways in insomnia patients and individuals after SD (6, 15, 25, 40, 63). In the present study we observed acute SD was associated with altered FCD areas in the thalamus and dorsal system, including significant increased binarized shortFCD areas in the occipital gyrus, thalamus and postcentral gyrus, and increased binarized longFCD areas in the postcentral gyrus and visuospatial network. The increased FCD in these regions in the visual pathway could be considered a compensatory effect to sustain the cognitive performance despite a continuing decline of activity in the higher cognition related areas. This may generate an excessive hyperarousal status, which leads to increased sensory information processing (64).
There are extensive round-trip nerve interactive fibers between the cerebellum posterior lobe(s) and the cerebral cortex. The cerebellum posterior lobe(s) has been widely used for adjusting nerve function, adjusting the start, and planning and coordinating movement. It also works together with the cerebrum to complete functions; such as cognition, language, and emotion; and to initiate, plan, and coordinate movement (65–67). In light of mounting evidence for cerebellar involvement in various neurologic and psychiatric conditions, including obstructive sleep apnea (53), depression (68), primary insomnia (40, 63), mood disorders (69) and sleep deprivation (6); this is crucial. In the present study we found acute SD showed decreased shortFCD in the cerebellum, which may indicate functional deficits associated with decreased ability in adjusting coordinate movement.
Conclusions
In summary, the longFCD and shortFCD analysis might be sensitive biomarkers to locate the underlying altered intrinsic brain functional organization in individuals during SD status relative to RW status with high degree of sensitivities and specificities. Specifically, the shortFCD analysis is more sensitive to locating the functional organization with more alterations in regional brain areas than that of longFCD. In the present study, we found that the longFCD and short FCDs in the high-order cognition related areas decreased while the arousal and sensorimotor related areas increased to sustain the cognitive performance. These findings expand our knowledge and may help give us insight into a deeper understanding of the neurobiological mechanisms of how the functional organization was altered in the sleep-deprived brain.
There are several limitations that should be noted. First, our study has a relatively small sample size and future studies with a larger sample size is necessary to corroborate our findings. Second, the electronystagmogram has not been used to dynamically monitor the sleep in the SD procedure.
Author Contributions
DK wrote the main manuscript text, DK, RL, JiyZ, and WC conceived and designed the whole experiment, DK, LS, and JiaZ collected the data, DK, RL, and JiyZ analyzed the data.
Conflict of Interest Statement
The authors declare that the research was conducted in the absence of any commercial or financial relationships that could be construed as a potential conflict of interest.
Acknowledgments
This work was supported by Key Research and Development Projects in Shaanxi province in the field of social development (2017SF-081).
References
1. Dai XJ, Liu CL, Zhou RL, Gong HH, Wu B, Gao L et al. Long-term total sleep deprivation decreases the default spontaneous activity and connectivity pattern in healthy male subjects: a resting-state fMRI study. Neuropsychiatr Dis Treat (2015) 11:761–72. doi: 10.2147/NDT.S78335
2. Drummond SP, Brown GG. The effects of total sleep deprivation on cerebral responses to cognitive performance. Neuropsychopharmacology (2001) 25:S68–73. doi: 10.1016/S0893-133X(01)00325-6
3. Jackson ML, Hughes ME, Croft RJ, Howard ME, Crewther D, Kennedy GA et al. The effect of sleep deprivation on BOLD activity elicited by a divided attention task. Brain Imaging Behav. (2011) 5:97–108. doi: 10.1007/s11682-011-9115-6
4. Luber B, Stanford AD, Bulow P, Nguyen T, Rakitin BC, Habeck C et al. Remediation of sleep-deprivation-induced working memory impairment with fMRI-guided transcranial magnetic stimulation. Cereb Cortex (2008) 18:2077–85. doi: 10.1093/cercor/bhm231
5. Nilsson JP, Soderstrom M, Karlsson AU, Lekander M, Akerstedt T, Lindroth NE et al. Less effective executive functioning after one night's sleep deprivation. J Sleep Res. (2005) 14:1–6. doi: 10.1111/j.1365-2869.2005.00442.x
6. Dai XJ, Gong HH, Wang YX, Zhou FQ, Min YJ, Zhao F et al. Gender differences in brain regional homogeneity of healthy subjects after normal sleep and after sleep deprivation: a resting-state fMRI study. Sleep Med. (2012) 13:720–7. doi: 10.1016/j.sleep.2011.09.019
7. Ohayon MM, Smolensky MH, Roth T. Consequences of shiftworking on sleep duration, sleepiness, and sleep attacks. Chronobiol Int. (2010) 27:575–89. doi: 10.3109/07420521003749956
8. Tsigos C, Chrousos GP. Hypothalamic-pituitary-adrenal axis, neuroendocrine factors and stress. J Psychosom Res. (2002) 53:865–71. doi: 10.1016/S0022-3999(02)00429-4
9. Walker MP, Stickgold R. Sleep, memory, and plasticity. Annu Rev Psychol. (2006) 57:139–66. doi: 10.1146/annurev.psych.56.091103.070307
10. Bosch OG, Rihm JS, Scheidegger M, Landolt HP, Stampfli P, Brakowski J et al. Sleep deprivation increases dorsal nexus connectivity to the dorsolateral prefrontal cortex in humans. Proc Natl Acad Sci USA. (2013) 110:19597–602. doi: 10.1073/pnas.1317010110
11. Cui J, Tkachenko O, Gogel H, Kipman M, Preer LA, Weber M et al. Microstructure of frontoparietal connections predicts individual resistance to sleep deprivation. Neuroimage (2015) 106:123–33. doi: 10.1016/j.neuroimage.2014.11.035
12. Dai XJ, Jiang J, Zhang Z, Nie X, Liu BX, Pei L et al. Plasticity and susceptibility of brain morphometry alterations to insufficient sleep. Front Psychiatry (2018) 8:266. doi: 10.3389/fpsyt.2018.00266
13. De Havas JA, Parimal S, Soon CS, Chee MW. Sleep deprivation reduces default mode network connectivity and anti-correlation during rest and task performance. Neuroimage (2012) 59:1745–51. doi: 10.1016/j.neuroimage.2011.08.026
14. Elvsashagen T, Norbom LB, Pedersen PO, Quraishi SH, Bjornerud A, Malt UF et al. Widespread changes in white matter microstructure after a day of waking and sleep deprivation. PLoS ONE (2015) 10:e0127351. doi: 10.1371/journal.pone.0127351
15. Gao L, Bai L, Zhang Y, Dai XJ, Netra R, Min Y et al. Frequency-dependent changes of local resting oscillations in sleep-deprived brain. PLoS ONE (2015) 10:e0120323. doi: 10.1371/journal.pone.0120323
16. Gao L, Zhang M, Gong H, Bai L, Dai XJ, Min Y et al. Differential activation patterns of FMRI in sleep-deprived brain: restoring effects of acupuncture. Evid Based Complement Alternat Med. (2014) 2014:465760. doi: 10.1155/2014/465760
17. Rocklage M, Williams V, Pacheco J, Schnyer DM. White matter differences predict cognitive vulnerability to sleep deprivation. Sleep (2009) 32:1100–3. doi: 10.1093/sleep/32.8.1100
18. Shao Y, Wang L, Ye E, Jin X, Ni W, Yang Y et al. Decreased thalamocortical functional connectivity after 36 hours of total sleep deprivation: evidence from resting state FMRI. PLoS ONE (2013) 8:e78830. doi: 10.1371/journal.pone.0078830
19. Verweij IM, Romeijn N, Smit DJ, Piantoni G, Van Someren EJ, van der Werf YD. Sleep deprivation leads to a loss of functional connectivity in frontal brain regions. BMC Neurosci. (2014) 15:88. doi: 10.1186/1471-2202-15-88
20. Wang L, Chen Y, Yao Y, Pan Y, Sun Y. Sleep deprivation disturbed regional brain activity in healthy subjects: evidence from a functional magnetic resonance-imaging study. Neuropsychiatr Dis Treat (2016) 12:801–7. doi: 10.2147/NDT.S99644
21. Yeo BT, Tandi J, Chee MW. Functional connectivity during rested wakefulness predicts vulnerability to sleep deprivation. Neuroimage (2015) 111:147–58. doi: 10.1016/j.neuroimage.2015.02.018
22. Killgore WD, Schwab ZJ, Kipman M, Deldonno SR, Weber M. Insomnia-related complaints correlate with functional connectivity between sensory-motor regions. Neuroreport (2013) 24:233–40. doi: 10.1097/WNR.0b013e32835edbdd
23. Li Y, Wang E, Zhang H, Dou S, Liu L, Tong L et al. Functional connectivity changes between parietal and prefrontal cortices in primary insomnia patients: evidence from resting-state fMRI. Eur J Med Res. (2014) 19:32. doi: 10.1186/2047-783X-19-32
24. Liu X, Yan Z, Wang T, Yang X, Feng F, Fan L et al. Connectivity pattern differences bilaterally in the cerebellum posterior lobe in healthy subjects after normal sleep and sleep deprivation: a resting-state functional MRI study. Neuropsychiatr Dis Treat (2015) 11:1279–89. doi: 10.2147/NDT.S84204
25. Nie X, Shao Y, Liu SY, Li HJ, Wan AL, Nie S et al. Functional connectivity of paired default mode network subregions in primary insomnia. Neuropsychiatr Dis Treat (2015) 11:3085–93. doi: 10.2147/NDT.S95224
26. Shao Y, Lei Y, Wang L, Zhai T, Jin X, Ni W et al. Altered resting-state amygdala functional connectivity after 36 hours of total sleep deprivation. PLoS ONE (2014) 9:e112222. doi: 10.1371/journal.pone.0112222
27. Liu X, Zheng J, Liu BX, Dai XJ. Altered connection properties of important network hubs may be neural risk factors for individuals with primary insomnia. Sci Rep. (2018) 8:5891. doi: 10.1038/s41598-018-23699-3
28. Luo X, Guo L, Dai XJ, Wang Q, Zhu W, Miao X et al. Abnormal intrinsic functional hubs in alcohol dependence: evidence from a voxelwise degree centrality analysis. Neuropsychiatr Dis Treat (2017) 13:2011–20. doi: 10.2147/NDT.S142742
29. Tomasi D, Volkow ND. Functional connectivity density mapping. Proc Natl Acad Sci USA. (2010) 107:9885–90. doi: 10.1073/pnas.1001414107
30. Tomasi D, Volkow ND. Aging and functional brain networks. Mol Psychiatry (2012) 471:549–58. doi: 10.1038/mp.2011.81
31. Tomasi D, Volkow ND. Gender differences in brain functional connectivity density. Hum Brain Mapp. (2012) 33:849–60. doi: 10.1002/hbm.21252
32. Wang J, Wei Q, Yuan X, Jiang X, Xu J, Zhou X et al. Local functional connectivity density is closely associated with the response of electroconvulsive therapy in major depressive disorder. J Affect Disord. (2018) 225:658–64. doi: 10.1016/j.jad.2017.09.001
33. Zhang Y, Xie B, Chen H, Li M, Liu F, Chen H. Abnormal functional connectivity density in post-traumatic stress disorder. Brain Topogr. (2016) 29:405–11. doi: 10.1007/s10548-016-0472-8
34. Tomasi D, Volkow ND. Resting functional connectivity of language networks: characterization and reproducibility. Mol Psychiatry (2012) 17:841–54. doi: 10.1038/mp.2011.177
35. Fan J, McCandliss BD, Fossella J, Flombaum JI, Posner MI. The activation of attentional networks. Neuroimage (2005) 26:471–9. doi: 10.1016/j.neuroimage.2005.02.004
36. Fan J, McCandliss BD, Sommer T, Raz A, Posner MI. Testing the efficiency and independence of attentional networks. J Cogn Neurosci. (2002) 14:340–7. doi: 10.1162/089892902317361886
37. Satterthwaite TD, Elliott MA, Gerraty RT, Ruparel K, Loughead J, Calkins ME et al. An improved framework for confound regression and filtering for control of motion artifact in the preprocessing of resting-state functional connectivity data. Neuroimage (2013) 64:240–56. doi: 10.1016/j.neuroimage.2012.08.052
38. Yan CG, Cheung B, Kelly C, Colcombe S, Craddock RC, Di Martino A et al. A comprehensive assessment of regional variation in the impact of head micromovements on functional connectomics. Neuroimage (2013) 76:183–201. doi: 10.1016/j.neuroimage.2013.03.004
39. Buckner RL, Sepulcre J, Talukdar T, Krienen FM, Liu H, Hedden T et al. Cortical hubs revealed by intrinsic functional connectivity: mapping, assessment of stability, and relation to Alzheimer's disease. J Neurosci. (2009) 29:1860–73. doi: 10.1523/JNEUROSCI.5062-08.2009
40. Dai XJ, Nie X, Liu X, Pei L, Jiang J, Peng DC et al. Gender differences in regional brain activity in patients with chronic primary insomnia: evidence from a resting-state fMRI study. J Clin Sleep Med. (2016) 12:363–74. doi: 10.5664/jcsm.5586
41. Li HJ, Dai XJ, Gong HH, Nie X, Zhang W, Peng DC. Aberrant spontaneous low-frequency brain activity in male patients with severe obstructive sleep apnea revealed by resting-state functional MRI. Neuropsychiatr Dis Treat (2015) 11:207–14. doi: 10.2147/NDT.S73730
42. Gusnard DA, Akbudak E, Shulman GL, Raichle ME. Medial prefrontal cortex and self-referential mental activity: relation to a default mode of brain function. Proc Natl Acad Sci USA (2001) 98:4259–64. doi: 10.1073/pnas.071043098
43. Cabeza R, Dolcos F, Graham R, Nyberg L. Similarities and differences in the neural correlates of episodic memory retrieval and working memory. Neuroimage (2002) 16:317–30. doi: 10.1006/nimg.2002.1063
44. Mason MF, Norton MI, Van Horn JD, Wegner DM, Grafton ST, Macrae CN. Wandering minds: the default network and stimulus-independent thought. Science (2007) 315:393–5. doi: 10.1126/science.1131295
45. Bechara A, Damasio H, Damasio AR. Emotion, decision making and the orbitofrontal cortex. Cereb Cortex (2000) 10:295–307. doi: 10.1093/cercor/10.3.295
46. Beer JS, Lombardo MV, Bhanji JP. Roles of medial prefrontal cortex and orbitofrontal cortex in self-evaluation. J Cogn Neurosci. (2010) 22:2108–19. doi: 10.1162/jocn.2009.21359
47. Etkin A, Egner T, Kalisch R. Emotional processing in anterior cingulate and medial prefrontal cortex. Trends Cogn Sci. (2011) 15:85–93. doi: 10.1016/j.tics.2010.11.004
48. Libedinsky C, Smith DV, Teng CS, Namburi P, Chen VW, Huettel SA et al. Sleep deprivation alters valuation signals in the ventromedial prefrontal cortex. Front Behav Neurosci. (2011) 5:70. doi: 10.3389/fnbeh.2011.00070
49. Hamilton DA, Brigman JL. Behavioral flexibility in rats and mice: contributions of distinct frontocortical regions. Genes Brain Behav. (2015) 14:4–21. doi: 10.1111/gbb.12191
50. Hong SB, Kim JW, Choi EJ, Kim HH, Suh JE, Kim CD et al. Reduced orbitofrontal cortical thickness in male adolescents with internet addiction. Behav Brain Funct. (2013) 9:11. doi: 10.1186/1744-9081-9-11
51. Pardini M, Bonzano L, Roccatagliata L, Mancardi GL, Bove M. The fatigue-motor performance paradox in multiple sclerosis. Sci Rep. (2013) 3:2001. doi: 10.1038/srep02001
52. Goel N, Rao H, Durmer JS, Dinges DF. Neurocognitive consequences of sleep deprivation. Semin Neurol. (2009) 29:320–39. doi: 10.1055/s-0029-1237117
53. Peng DC, Dai XJ, Gong HH, Li HJ, Nie X, Zhang W. Altered intrinsic regional brain activity in male patients with severe obstructive sleep apnea: a resting-state functional magnetic resonance imaging study. Neuropsychiatr Dis Treat (2014) 10:1819–26. doi: 10.2147/NDT.S67805
54. Altena E, Vrenken H, Van Der Werf YD, van den Heuvel OA, Van Someren EJ. Reduced orbitofrontal and parietal gray matter in chronic insomnia: a voxel-based morphometric study. Biol Psychiatry (2010) 67:182–5. doi: 10.1016/j.biopsych.2009.08.003
55. Killgore WD, Schwab ZJ, Kipman M, DelDonno SR, Weber M. Voxel-based morphometric gray matter correlates of daytime sleepiness. Neurosci Lett. (2012) 518:10–3. doi: 10.1016/j.neulet.2012.04.029
56. Blazhenkova O, Kozhevnikov M. The new object-spatial-verbal cognitive style model: Theory and measurement. Appl Cogn Psychol. (2008) 23:638–63. doi: 10.1002/acp.1473
57. Kosslyn SM, Ganis G, Thompson WL. Neural foundations of imagery. Nat Rev Neurosci. (2001) 2:635–42. doi: 10.1038/35090055
58. Kozhevnikov M, Kosslyn S, Shephard J. Spatial versus object visualizers: a new characterization of visual cognitive style. Mem Cogn. (2005) 33:710–26. doi: 10.3758/BF03195337
59. Tomasi D, Volkow ND. Association between functional connectivity hubs and brain networks. Cerebral Cortex (2011) 21:2003–13. doi: 10.1093/cercor/bhq268
60. Fukunaga M, Horovitz SG, van Gelderen P, de Zwart JA, Jansma JM, Ikonomidou VN et al. Large-amplitude, spatially correlated fluctuations in BOLD fMRI signals during extended rest and early sleep stages. Magn Reson Imaging (2006) 24:979–92. doi: 10.1016/j.mri.2006.04.018
61. Thomas M, Sing H, Belenky G, Holcomb H, Mayberg H, Dannals R et al. Neural basis of alertness and cognitive performance impairments during sleepiness. I. Effects of 24 h of sleep deprivation on waking human regional brain activity. J Sleep Res. (2000) 9:335–52. doi: 10.1046/j.1365-2869.2000.00225.x
62. Wu JC, Gillin JC, Buchsbaum MS, Hershey T, Hazlett E, Sicotte N et al. The effect of sleep deprivation on cerebral glucose metabolic rate in normal humans assessed with positron emission tomography. Sleep (1991) 14:155–62.
63. Dai XJ, Peng DC, Gong HH, Wan AL, Nie X, Li HJ et al. Altered intrinsic regional brain spontaneous activity and subjective sleep quality in patients with chronic primary insomnia: a resting-state fMRI study. Neuropsychiatr Dis Treat. (2014) 10:2163–75. doi: 10.2147/NDT.S69681
64. Perlis ML, Merica H, Smith MT, Giles DE. Beta EEG activity and insomnia. Sleep Med Rev. (2001) 5:363–74. doi: 10.1053/smrv.2001.0151
65. Desmond J, Marvel C. Cognition: cerebellum role. Encyclopedia Neurosci. (2009) 2:1079–85. doi: 10.1016/B978-008045046-9.00411-3
66. Parvizi J, Anderson SW, Martin CO, Damasio H, Damasio AR. Pathological laughter and crying: a link to the cerebellum. Brain (2001) 124:1708–19. doi: 10.1093/brain/124.9.1708
67. Yoo SS, Teh EK, Blinder RA, Jolesz FA. Modulation of cerebellar activities by acupuncture stimulation: evidence from fMRI study. Neuroimage (2004) 22:932–40. doi: 10.1016/j.neuroimage.2004.02.017
68. Liu ZF, Xu C, Xu Y, Wang YF, Zhao B, Lv YT et al. Decreased regional homogeneity in insula and cerebellum: A resting-state fMRI study in patients with major depression and subjects at high risk for major depression. Psychiat Res-Neuroim (2010) 182:211–5. doi: 10.1016/j.pscychresns.2010.03.004
Keywords: sleep deprivation, functional connectivity density, receiver operating characteristic, sensorimotor, short-range, long-range
Citation: Kong D, Liu R, Song L, Zheng J, Zhang J and Chen W (2018) Altered Long- and Short-Range Functional Connectivity Density in Healthy Subjects After Sleep Deprivations. Front. Neurol. 9:546. doi: 10.3389/fneur.2018.00546
Received: 22 May 2018; Accepted: 19 June 2018;
Published: 16 July 2018.
Edited by:
Xi-jian Dai, Jinling Hospital and Medical School of Nanjing University, ChinaReviewed by:
Xuming Liu, Wenzhou City People's Hospital, ChinaAlexander Nikolaevich Savostyanov, State Scientific-Research Institute of Physiology & Basic Medicine, Russia
Copyright © 2018 Kong, Liu, Song, Zheng, Zhang and Chen. This is an open-access article distributed under the terms of the Creative Commons Attribution License (CC BY). The use, distribution or reproduction in other forums is permitted, provided the original author(s) and the copyright owner(s) are credited and that the original publication in this journal is cited, in accordance with accepted academic practice. No use, distribution or reproduction is permitted which does not comply with these terms.
*Correspondence: Dan Kong, 156017532@qq.com
Jiyong Zheng, jyzhengdoctor@126.com
 Dan Kong1*
 Jiyong Zheng