 Katja Franke
 Christian Gaser
- 1Structural Brain Mapping Group, Department of Neurology, University Hospital Jena, Jena, Germany
- 2Department of Psychiatry, University Hospital Jena, Jena, Germany
With the aging population, prevalence of neurodegenerative diseases is increasing, thus placing a growing burden on individuals and the whole society. However, individual rates of aging are shaped by a great variety of and the interactions between environmental, genetic, and epigenetic factors. Establishing biomarkers of the neuroanatomical aging processes exemplifies a new trend in neuroscience in order to provide risk-assessments and predictions for age-associated neurodegenerative and neuropsychiatric diseases at a single-subject level. The “Brain Age Gap Estimation (BrainAGE)” method constitutes the first and actually most widely applied concept for predicting and evaluating individual brain age based on structural MRI. This review summarizes all studies published within the last 10 years that have established and utilized the BrainAGE method to evaluate the effects of interaction of genes, environment, life burden, diseases, or life time on individual neuroanatomical aging. In future, BrainAGE and other brain age prediction approaches based on structural or functional markers may improve the assessment of individual risks for neurological, neuropsychiatric and neurodegenerative diseases as well as aid in developing personalized neuroprotective treatments and interventions.
Introduction
With population growth and prolonged lifespan, the numbers of individuals with a range of (non-fatal, but) disabling disorders, including neurodegenerative diseases such as cognitive decline and dementia, are rising (1). Understanding the links between brain aging processes and neurodegenerative disease mechanisms is an urgent priority for health systems in order to establish effective strategies to deal with the rising burden. Aging is broadly defined as a time-dependent functional decline, driven by a progressive accumulation of cellular damage throughout life (2) and changes in intercellular communication (3–6). Aging is also a vastly complex process, which is individually modified by manifold genetic and environmental influences (5).
The assessment of the individual's “biological age” was recently promoted, resulting from the interaction of genes, environment, lifestyle, health, and life time, in order (i) to identify subject-specific health characteristics as well as subject-specific risk patterns for various age-related diseases based on pre-established reference curves for healthy aging, and (ii) to develop and monitor (clinical) interventions that are personally tailored based on “biological age” instead of chronological age (7). Several cell-, tissue- or function-based biomarkers that measure differences in the individual aging processes have been developed recently in order to identify and predict individual risks for age-associated diseases and mortality [for recent reviews see (8, 9)], as well as to improve intervention and treatment strategies (2, 5), including DNA methylation status, measuring the accumulation of genetic damage (7, 10, 11), telomere length, assessing telomere attrition (12–16), physical fitness, and allostatic load as a measure for physical, physiological, and metabolic health etc. (17, 18).
Structural brain maturation/aging in humans is characterized by region-specific, non-linear patterns of very well-coordinated and sequenced occurrences of progressive and regressive processes (19) / atrophy (20, 21), respectively, demonstrating robust patterns of alterations (22, 23), where some brain regions are showing greater alterations than others. With the advent of non-invasive methods of in vivo brain imaging, especially magnetic resonance imaging (MRI), and the availability of sophisticated computational methods for processing and analyzing MRI data, cross-sectional as well as longitudinal neuroimaging studies on brain structure and function are increasingly contributing to a more profound understanding of healthy as well as diseased structural brain maturation and aging for recent reviews see (8, 9).
As research increasingly focuses on the interplay between aging and disease, a growing body of research utilizes neuroimaging to develop a biomarker of individual brain health, so-called “brain age.” Lately, data-driven learning methods, including cross-validation, pattern classification, and regression-based predictive analyses, exemplify a new trend in biomedical and neuroscientific research, allowing measurements and predictions even at the single subject level (24). To determine the individual trajectory of brain maturation and aging as well as the risks for cognitive dysfunction and age-associated brain diseases, a number of structural and functional brain-based prediction methods for age or cognitive state enjoy increasing popularity in (cognitive) neuroscience, providing personalized biomarkers of brain structure, and function by identifying deviations from pre-established reference curves or automatically discriminating patients with brain disorders from healthy controls (25–30). Most of these studies are using state-of-the-art machine learning techniques to make predictions at the single-subject level. Especially pattern recognition and regression-based computational modeling methods aim to predict the values of continuous variables, like structural brain age, cognitive states, or neuropsychological characteristics (27). These new brain-based biomarkers offer a powerful strategy for using neuroscience in clinical practice and have a wide range of implementations, such as providing reference curves for healthy brain maturation/aging, predicting personalized brain maturation/aging trajectories, discovering protective, and harmful environmental influences on brain health, disentangling age-related from disease-specific changes in individual brain structure, aiding in the risk-assessment, and early detection of certain neurodegenerative diseases, tracking individual disease progression, as well as determining the individual relationship of structural brain aging to cognitive performance and neuropsychiatric symptoms (8).
The “brain age gap estimation (BrainAGE)” method, which utilizes structural MRI data to directly quantify acceleration or deceleration of individual brain aging, was the first brain aging estimation approach that (1) established reference curves for healthy brain maturation during childhood into young adulthood and for healthy brain aging during adulthood into senescence, (2) examined deviations of individual brain aging from the established reference curve of healthy brain aging in neurodegenerative diseases, (3) analyzed longitudinal changes of individual brain aging in several samples, (4) used deviations of individual brain age predictions from the established reference curve of healthy brain aging to predict worsening of cognitive functions and conversion to Alzheimer's disease (AD), (5) studied the effects of a number of several health- and lifestyle-related factors on individual brain aging, (6) monitored the effects of protective interventions on individual brain aging, and (7) was adapted to be also applied in experimental studies with rodents and nun-human primates. This review firstly describes the generation of the BrainAGE model and secondly recapitulates and integrates all studies predicting individual brain age with the innovative BrainAGE method in healthy and diseased populations. Wherever possible, studies applying other brain age prediction approaches to examine the very issue are additionally included in this review. A short summary of all BrainAGE studies summarized here can be found in Table 1.
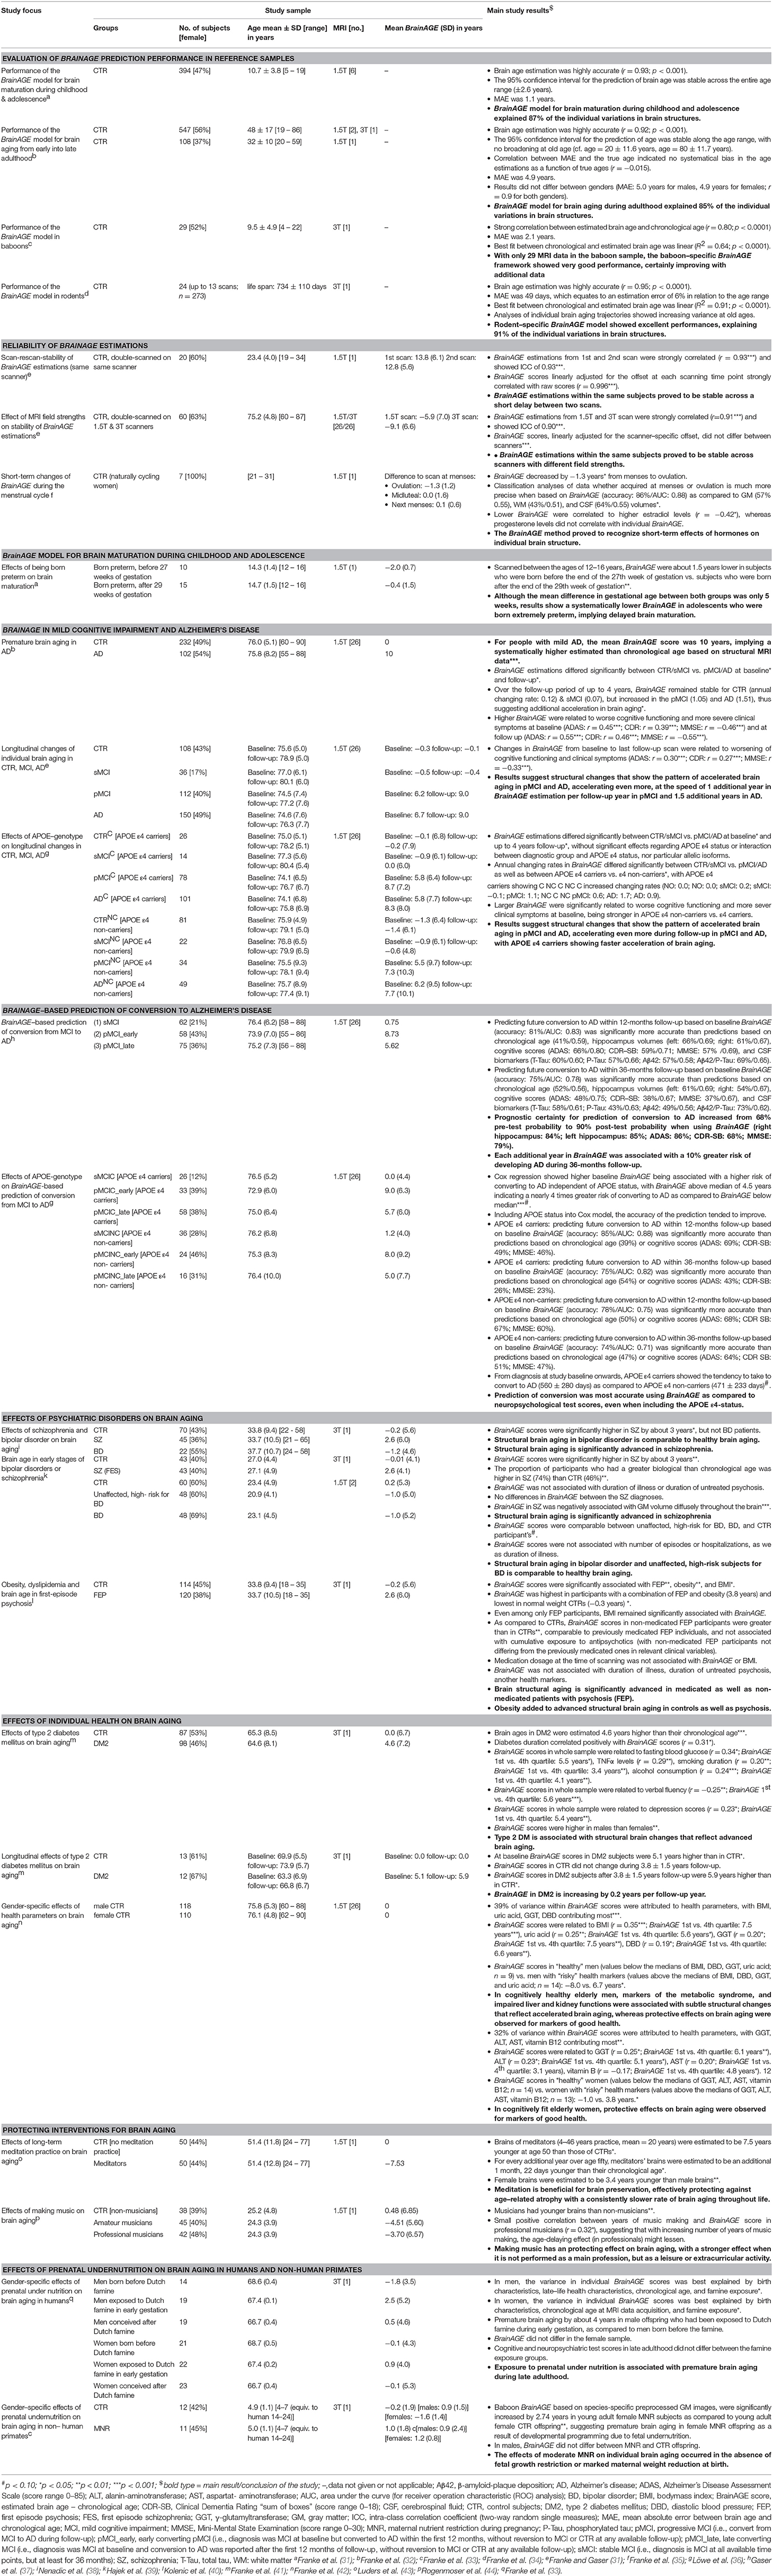
Table 1. Studies utilizing the BrainAGE model for analyzing individual brain aging.
Generation of the BrainAGE Model
A growing body of research is using high-dimensional neuroimaging data, i.e., often including several hundred (multi-modal) parameters per individual, and employing supervised, linear, or non-linear pattern recognition techniques in order to depict and quantify structural brain development and aging across the lifespan. In contrast to univariate approaches, multivariate analyses of individual brain structure are able to detect and quantify subtle, but widespread deviations in region- or voxelwise brain structure within the whole brain for the individual's age.
In general, the brain age prediction model needs to be trained first in order to subsequently assess a person's individual brain age. The brain age prediction model is generated by recognizing multivariate patterns of age-typical brain structure and parameters, utilizing MRI data of a large sample of (cognitively) healthy subjects. Subsequently, the age prediction model is applied in previously unseen test subjects, i.e., estimating the subject-specific brain ages utilizing their individual MRI data. The difference between a person's estimated brain age and its chronological age finally identifies the individual deviation from the typical maturation/aging trajectory.
Pipeline for the Generation of Brain Age Estimations
In general, the workflow of our innovative BrainAGE model includes several processing steps (Figure 1). Firstly, the raw T1-weighted image data are preprocessed with a standardized voxel-based morphometry (VBM) pipeline, resulting in comparable as well as more easily processible data to be utilized in the following analysis steps (see Preprocessing of raw MRI data). Secondly, automated data reduction of the preprocessed MRI data is performed in order to reduce computational costs, avoid method-typical over-fitting of pattern recognition, as well as to provide a robust and widely applicable age estimation model (see Data reduction). Thirdly, relevance vector regression (RVR) is performed, capturing the multidimensional maturation/aging patterns throughout the whole brain and thus modeling structural brain maturation/aging. Subsequently, individual brain ages can be estimated (see Training of the BrainAGE algorithm).
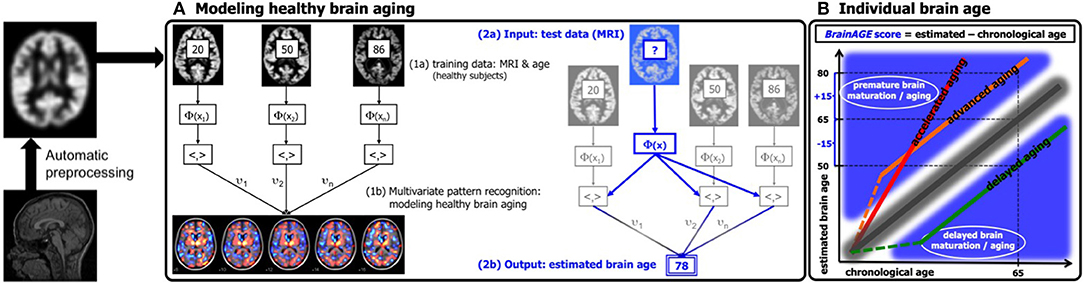
Figure 1. Depiction of the BrainAGE concept. All MRI data are automatically preprocessed via VBM. (A) The model of healthy brain aging is trained with the chronological age and preprocessed structural MRI data of a training sample (left; with an illustration of the most important voxel locations that were used by the age regression model). Subsequently, the individual brain ages of previously unseen test subjects are estimated, based on their MRI data. (B) The difference between the estimated and chronological age results in the BrainAGE score, with positive BrainAGE scores indicating advanced brain aging (orange line), increasing BrainAGE scores indicating accelerating brain aging (red line), and negative BrainAGE scores indicating delayed brain aging (green line). [Figure and legend adapted from Franke et al. (45), with permission from Hogrefe Publishing, Bern].
Preprocessing of Raw MRI Data
Preprocessing of the raw MRI data is done using SPM including the VBM8/CAT12 toolbox, running under MATLAB. More specifically, T1-weighted images are corrected for bias-field inhomogeneities (46, 47). Following, the images are spatially normalized. Afterwards, the images are segmented into the tree brain tissue types, i.e., gray matter (GM), white matter (WM), and cerebro-spinal fluid (CSF), within the same generative model (48). Furthermore, adaptive maximum a posteriori estimations (49) and a hidden Markov random field model (50) are applied in order to account for partial volume effects (51). Finally, image preprocessing includes affine registration.
Data Reduction
Preprocessed MRI data are smoothed with 4 or 8 mm full-width-at-half-maximum (FWHM) Gaussian kernels. Thereafter, data are re-sampled to 4 or 8 mm spatial resolution, resulting in 29,852 or 3,747 voxels per subject after masking out non-brain areas, respectively. Finally, principal component analysis (PCA) is applied to further reduce data dimensionality. As a great portion of the resulting voxels are still sharing much of its variances with their neighboring voxels, PCA is mathematically allowed to be performed although the numbers of data sets in the training sample is lower than the number of voxels, given the numbers of data sets in the training sample is sufficient (see Performance of the BrainAGE model for brain aging from early into late adulthood). The PCA model is calculated within the training data only and subsequently the resulting transformation parameters are utilized to reduce data dimensionality within the independent test samples.
Training of the BrainAGE Algorithm
The BrainAGE framework utilizes RVR (52, 53) with a linear kernel. Importantly, RVR does not require additional (manual) parameter optimization during the training procedure, which is advantageous over the commonly used support vector machines with regards to computational costs and robust model fitting.
In general, the age regression model is calculated within the training sample, utilizing the preprocessed structural MRI data as independent variables and the chronological ages as dependent variables, resulting in a complex model of healthy brain maturation/aging (Figure 1A, left panel). Within this specified regression task (i.e., healthy brain maturation/aging), voxel-specific weights are calculated, representing the voxel-specific importance within this regression task (for illustrations of the resulting voxel-specific weights see Figure S1 for the brain maturation model & Figure S2 for the brain aging model).
Subsequently, the brain maturation/aging model is applied to aggregate the complex, multidimensional maturation/aging pattern throughout the whole brain of a new test subject, resulting in one single value, i.e., the estimated brain age (Figure 1A, right panel).
Finally, the difference between estimated brain age and chronological age reveals the individual brain age gap estimation (BrainAGE) score. For BrainAGE, positive values are indicating advanced structural brain maturation/aging, whereas negative values are indicating delayed structural brain maturation/aging. In longitudinal studies, increasing BrainAGE scores are indicating accelerating brain aging over the time. Thus, the individual BrainAGE score is directly quantifying the amount of acceleration or deceleration of brain maturation/aging in terms of years (Figure 1B). For example, if a 70 years old individual shows a BrainAGE score of +5 years, the typical atrophy pattern of this individual resembles the brain structure of a 75 years old individual.
Cross-Validation of the BrainAGE Model in Reference Samples
In order to generate and validate the brain age model, most studies are employing a so-called “cross-validation” approach, i.e., the neuroimaging parameters of a large portion of the reference sample of healthy individuals are used to generate the brain age model. The generated brain age model is then applied to the smaller portion of the reference sample that was not included in the model generation step (i.e., “left-out”), in order to predict individual brain ages based on the identified neuroimaging parameters within the actual training sample. This procedure is repeated multiple times, until an individual brain age is provided for each subject in the whole reference sample.
To measure the accuracy of age estimation, Pearson's correlation coefficient (r), mean absolute error (MAE), and root mean squared error (RMSE) between individual estimated brain ages and chronological ages are calculated:
with n being the number of subjects in the test sample, BAi being the estimated subjects-specific brain ages, and CAi being the subject-specific chronological ages. Additionally, F statistics of the regression model is used to analyze the fit between BA and CA.
Application of the Generated BrainAGE Model in Independent Test Samples
Additionally to the cross-validation in the reference samples, the brain age model is further validated in independent test samples of healthy and clinical subjects, in order to prove the generalizability of the pre-established brain age model across different samples and even MRI scanners, which is crucial for broad application in a clinical context, as well as to investigate the power of the brain age models as a diagnostic and prediction tool at a single-subject level, for monitoring individual changes in brain aging during treatment studies, or to explore the effects of various health characteristics, diseases, and life experiences on individual brain aging.
Species-Specific Adaptations of the BrainAGE Model for Experimental Animal Studies
Species-Specific BrainAGE Model for Baboons
Within the species-specific BrainAGE model for baboons, we used a customized preprocessing pipeline as described in Franke et al. (33). To further reduce high-frequency noise, a spatial adaptive non-local means (SANLM) filter (54) is applied. The segmentation and spatial registration step requires a baboon-specific tissue probability map (TPM) as well as a “Diffeomorphic Anatomical Registration using Exponentiated Lie algebra” (DARTEL) template (55), which is estimated during an iterative process based on a rescaled human template. More specifically, affine transformation is initially used to scale the human SPM12 TPM and the CAT12 Dartel template map onto the brain size of baboons. Image resolution of this template is set to isotropic voxel size of 0.75 mm. For each of the performed iteration steps, the resulting tissue maps are averaged and subsequently smoothed with a 2 mm FWHM kernel to estimate an affine registration, finally resulting in a new TPM, a T1-average map, as well as a baboon-specific brain mask. To achieve averaged data, a median function is used in order to reduce distortions by outliers or failed processing. The iteration process is stopped when the actually accomplished change is below a pre-defined threshold as compared to the previous template, resulting in the final segmentation.
After Segmentation and Registration, Data are Smoothed With a 3 mm FWHM Gaussian Smoothing Kernel and re-sampled to 3 mm. Finally, PCA is Applied to Further Reduce Data Complexity (as Described in Data Reduction).
Species-Specific BrainAGE Model for Rodents
As described in Franke et al. (34), a preprocessing framework for automatically preprocessing and analyzing MRI data of rodents is providing analyses in the space of a Paxinos atlas (56), including several realignment and normalization steps. First, affine co-registration to the Paxinos template is applied utilizing normalized mutual information. In the next step, a deformation based morphometry (DBM) approach is utilized to analyze positional differences between every voxel within the actual brain data and a reference brain in order to detect structural differences over the entire brain. Thus, all measured time points of the data set of one animal are registered to the individual baseline scan. Afterwards, the deformations between all-time points and the subject-specific baseline measures are being estimated. Minimizing the morphological differences between the baseline and the follow-up brain scans, the deformation maps now encode the information about these differences. Subsequently, the Jacobian determinant of the deformations can be used to calculate local volume changes. Finally, the resulting Jacobian determinants in each voxel are filtered with a 0.4 mm FWHM Gaussian smoothing kernel.
Technical Notes
The BrainAGE framework is fully automatic. All steps, including MRI preprocessing, data reduction, model training, and brain age estimation, are executed within MATLAB (www.mathworks.com). For preprocessing the T1-weighted images, SPM8 is utilized (www.fil.ion.ucl.ac.uk/spm), integrating the VBM8 toolbox (http://dbm.neuro.uni-jena.de). For the generation of brain age models in baboons and rodents our new CAT12 toolbox (http://dbm.neuro.uni-jena.de) is utilized. For PCA, the “Matlab Toolbox for Dimensionality Reduction” (https://lvdmaaten.github.io/drtoolbox/) is applied. RVR analyzes are performed utilizing the toolbox “The Spider” (http://people.kyb.tuebingen.mpg.de/spider/).
Preprocessing the human MRI data takes about 20–30 min per MRI data set on a MAC OS X, Version 10.12, 2.2 GHz Intel Core i7. The whole process of training the BrainAGE model and estimating brain ages takes between 1 and 5 min in total, depending on the number of features, training, and test subjects.
Baboon TPM and template generation needs about 30 min per subject and iteration, summing up in about 48 h for the whole sample of 29 control subjects. The whole process of training the baboon-specific BrainAGE model and estimating the individual brain ages takes about 1 min in total.
Preprocessing MRI data of rodents takes about 10–15 min per MRI data set on MAC OS X, Version 10.6.3, 2.8 GHz Intel Core 2 Duo, resulting in about 5–6 h for a sample of 24 rats with up to 13 MRI data sets per subject. Within this sample, the whole process of training the rodent-specific BrainAGE model and estimating the individual brain ages is performed within about 5 min.
Evaluation of BrainAGE Prediction Performance in Reference Samples
Performance of the BrainAGE Model for Brain Maturation During Childhood and Adolescence
For generating the BrainAGE model during childhood and adolescence (31), GM and WM images of a cross-sectional reference sample of 394 healthy children and adolescents from the Pediatric MRI Data Repository [NIH MRI Study of Normal Brain Development; (57)] were utilized, aged 5–18 years (mean age = 10.7 years; SD = 3.9 years), with structural data acquired on six different MRI scanners (1.5T). Using leave-one-out cross-validation, the MAE between estimated brain age and chronological age was 1.1 years. Between estimated brain age and chronological age 87% of the variance were explained (r = 0.93; p < 0.001), with the 95% confidence interval being stable across the age range (± 2.6 years; Figure 2A).
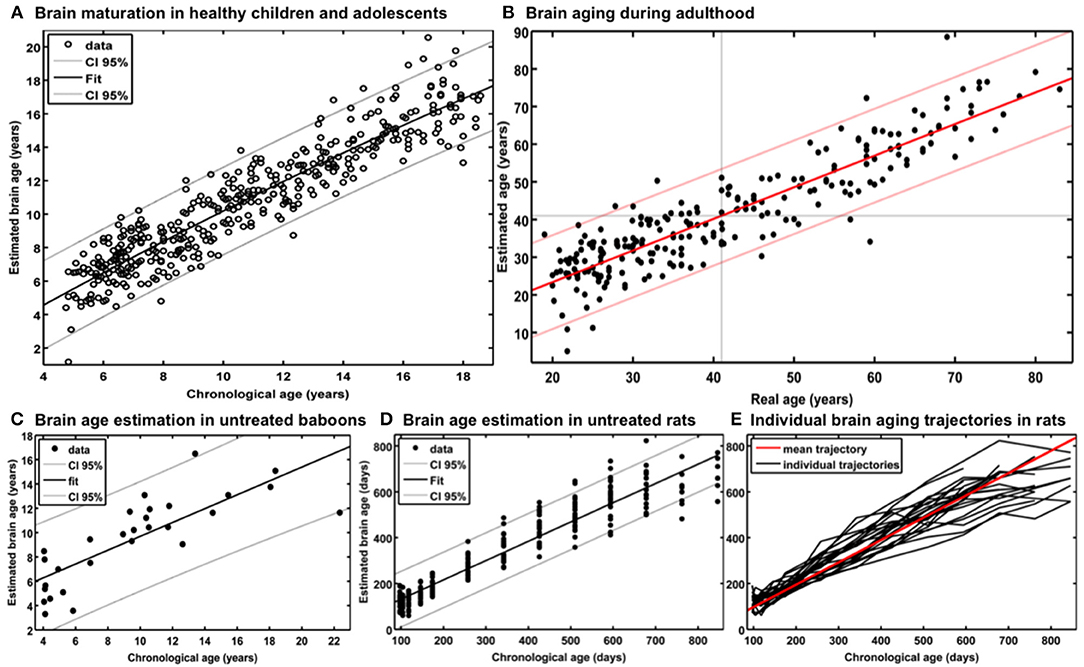
Figure 2. Reference curves for BrainAGE. (A) Individual structural brain age based on anatomical T1-images of 394 healthy subjects (aged 5–18 years). Chronological age is shown on the x-axis and the estimated brain age on the y-axis. The overall correlation between estimated brain age and chronological age is r = 0.93 (p < 0.001), and the overall MAE = 1.1 years. The 95% confidence interval of the quadratic fit is stable across the age range (±2.6 years). [Figure and legend reproduced from Franke et al. (45), with permission from Elsevier, Amsterdam.] (B) Estimated brain age and chronological age are shown for the whole test sample with the confidence interval (red lines) at a real age of 41 years of ± 11.5 years. The overall correlation between estimated brain age and chronological age is r = 0.92 (p < 0.001), and the overall MAE = 5.0 years. [Figure and legend modified from Franke et al. (32), with permission from Elsevier, Amsterdam.] (C) Scatterplot of estimated brain age against chronological age (in years) resulting from leave-one-out cross-validation in 29 healthy control baboons using their in vivo anatomical MRI scans. The overall correlation between chronological age and estimated brain age is r = 0.80 (p < 0.001), with an overall MAE of 2.1 years. [Figure and legend reproduced from Franke et al. (33), permitted under the Creative Commons Attribution License.] (D) (a) Chronological and estimated brain age are shown for a sample of untreated control rats, including the 95% confidence interval (gray lines). The overall correlation between chronological and estimated brain age was r = 0.95 (p < 0.0001). [Figure and legend reproduced from Franke et al. (34), with permission from IEEE.] (E) Longitudinal brain aging trajectories for the individual rats. [Figure and legend reproduced from Franke et al. (34), with permission from IEEE].
Additionally, training the BrainAGE model with the data from only five of the six MRI scanner sites included in the study, and then applying to data from the left-out MRI scanner, estimation accuracy proved to remain stable across all scanner sites. Prediction accuracy ranged between r = 0.90–0.95 and MAE = 1.1–1.3 years, which proved stability of brain age estimation even across scanners (31).
A number of other studies establishing models for brain maturation including age ranges from early childhood to young adulthood have been published so far (58–63). Accuracies for brain age predictions derived from cross-validation in the reference sample ranged from r = 0.43–0.96 and MAEs from 1.0 to 1.9 years. The most accurate model for brain age prediction during development in healthy individuals aged 3–20 years used a number of parameters derived from different MRI modalities (i.e., T1, T2, DTI), including cortical thickness, cortical surface area, subcortical volumes, apparent diffusion coefficient, fractional anisotropy, and T2 signal intensities in predefined subcortical regions, applying a regularized multivariate non-linear regression-like approach, resulting in r = 0.96 and MAE = 1.0 years (59). Although each single MRI modality showed similar predictive power (r ≈ 0.9) across the full age range (i.e., 3–20 years), modality-specific contributions to the generation of the brain age model differed across neuroanatomical structures and age sub-ranges, with measures of T2 signal intensity being the strongest predictors in age 3–11 years and diffusivity measures being the strongest predictors in the ages 17–20 years (59). Additionally, modality-specific subsets showed worse prediction accuracies compared to the combined model (T1 subset: r = 0.91, MAE = 1.7 years; T2 subset: r = 0.91, MAE = 1.6 years; DTI subset: r = 0.90, MAE = 1.7 years). However, the BrainAGE method (31) outperformed all other brain age models using only a single MRI modality or single-modality subsets, and additionally proved sufficient generalizability across different scanners and even across studies.
Performance of the BrainAGE Model for Brain Aging From Early Into Late Adulthood
In our first study introducing the BrainAGE model (32), two different samples were used to assess the brain age, i.e., the reference sample from the IXI database (www.brain-development.org; n = 550, aged 19–86 years, collected on three MRI scanners) and another independent test sample of healthy subjects (n = 108, aged 20–59 years, collected on a fourth scanner). The brain age of healthy subjects in both validation samples was accurately estimated, resulting in a MAE of 5 years and an overall correlation of r = 0.92, with the 95% confidence interval for the prediction of age being stable across the age range (Figure 2B). The BrainAGE model showed no systematical bias in MAE of brain age estimation as a function of chronological age (r = – 0.01). Furthermore, brain age estimation did not differ between genders (r = 0.92 for both genders; MAE = 5.0 years for males, MAE = 4.9 years for females).
Additional analyses showed that the number of subjects in the reference sample has the strongest influence on brain age prediction accuracy, even though the choice of the preprocessing approach and model-training algorithm would also influence model performance as well as generalizability (32). In detail, the accuracy of brain age estimation worsened with reducing the size of the training/reference sample (full data set for training the BrainAGE model [n = 410]: MAE = 5 years; ½ data set [n = 205]: MAE = 5.2 years; ¼ data set [n = 103]: MAE = 5.6 years). The results further recommend a fairly rapid preprocessing of the T1-weighted MRI images with affine registration and a rather broad smoothing kernel. Dimensionality reduction of the data via PCA moderately improved brain age estimation accuracy and generalizability, while at the same time speeding up the computing time for generating the BrainAGE model as well as estimating the individual brain age values of the independent test subjects (Figure 3).
Figure 3. Influences of the various parameters on BrainAGE estimation accuracy. (1) The accuracy of age estimation essentially depends on the number of subjects used for training the age estimation model (blue lines: full training sample; green lines: ½ training sample; red lines: ¼ training sample). (2) The method for preprocessing the T1-weighted MRI images also showed a strong influence on the accuracy of age estimation. (3) Data reduction via principal component analysis (PCA) only had a moderate effect on the mean absolute error (MAE). AF, affine registration; NL, non-linear registration; R4/8, re-sampling to spatial resolution of 4/8 mm; S4/8, smoothing with FWHM smoothing kernel of 4/8 mm. [Figure and legend modified from Franke et al. (32), with permission from Elsevier, Amsterdam].
A number of other studies establishing models for brain aging have been published so far (55, 60, 64–79). Accuracies for brain age predictions derived from cross-validation in the whole reference sample of healthy subjects ranged from r = 0.43–0.97, MAEs from 4.3 to 13.5 years, and RMSEs from 5.1 to 21.0 years. In general, studies mathematically modeling healthy brain aging, which use a number of parameters derived from different MRI modalities, tended to provide more accurate brain age predictions. The best performing model in a sample of healthy participants aged 8–85 years was based on a number of T1- and DTI-derived parameters, utilizing linked independent component analysis (ICA), resulted in an overall prediction accuracy of r = 0.97 and MAE = 5.9 years (67). Another study also used a number of parameters derived from different MRI modalities (i.e., T1, T2, T2*, DTI), generating and testing their brain age model by utilizing multiple linear regression in a sample of healthy individuals aged 20–74 years, resulting in an overall age prediction accuracy of r = 0.96 (74). Additionally, this study found voxel-wise mean diffusivity to be the main predictor of the brain age model (i.e., explaining 62.4% of intra-individual variance), followed by GM volume (18.3%), R2* (14.2%) and fractional anisotropy (3%). However, although DTI is a powerful tool offering unique information on tissue microstructure and neural fiber connections that cannot be obtained from standard structural MRI, parameters derived from DTI can differ significantly depending on the type of scanner, field strength, gradient strength, number of gradient orientations, preprocessing, fitting procedure, tractography algorithm etc. (80–83). Unfortunately, all studies including DTI failed to prove generalizability of the established brain age model in independent test samples and across scanners.
Another very recent study used a number of parameters derived from T1 and T2*, including cortical and subcortical measures as well as connectivity data, generating and testing the brain age model by utilizing linear support vector regression (SVR) (79). This approach showed very good performance during cross-validation within the reference sample (combined model: r = 0.93, MAE = 4.3 years), but a rather fair generalizability when validating the brain age model in an independent sample of healthy subjects, with data acquired on a different scanner (combined model: r = 0.86, MAE = 8.0 years). Aside from the BrainAGE approach, best prediction accuracies during cross-validation in the reference samples as well as during validation of the brain age model in independent test samples were achieved utilizing linear SVR (reference sample: r = 0.89, MAE = 4.3 years; independent test sample: MAE = 3.9 years; (76)], and Gaussian process regression [reference sample: r = 0.92, MAE = 6.2 years; independent test sample: r = 0.93, MAE = 5.8 years; (73)].
Performance of the BrainAGE Model in Baboons
For establishing the baboon-specific brain aging model, only GM images were used. The baboon-specific brain age estimation model was trained and tested via leave-one-out cross-validation, utilizing one MRI scan per subject. Within each cross-validation loop, PCA was calculated separately in the training set and subsequently applied to the test data before performing RVR. The baboon-specific BrainAGE model showed very good accuracy (r = 0.80), with the linear regression model showing the best fit (R2 = 0.64; p < 0.0001; Figure 2C). Calculation of MAE resulted in 2.1 years, equating to an age estimation error of 11% in relation to the age ranged included (33, 34).
Performance of the BrainAGE Model in Rodents
As described in Franke et al. (34), training and testing of the rodent-specific BrainAGE model was performed with subject-specific leave-one-out cross-validation processing, utilizing data sets of 24 rats, repeatedly scanned with up to 13 time points between 97 and 846 days after birth. In detail, to model the rodent-specific aging process, RVR was performed with the preprocessed structural MRI data of all scanning time points of 23 out of the total of 24 subjects. Subsequently, individual brain ages for each scanning time point of the left-out test subject were estimated, repeating the whole procedure for all 24 subjects. Brain age estimation was highly accurate (r = 0.95; p < 0.0001), with the linear regression model showing the best fit between chronological and estimated age (R2 = 0.91; F = 2622.3; p < 0.0001; Figure 2D). Mean MAE was 49 days, which equates to an error of 6% in relation to the age range within this study. Mean RMSE was 71 days. Additionally, longitudinal analyses of subject-specific brain aging trajectories revealed increasing variance between subjects in old age (Figure 2E).
Reliability of BrainAGE Estimations in Healthy Adults
Scan-Rescan-Stability of BrainAGE Estimations (Same Scanner)
To analyze stability and reliability of BrainAGE estimations, T1-weighted MRI data of 20 healthy subjects were utilized, applying the BrainAGE method to two MRI scans per subject, which were acquired on the same MRI scanner (1.5T) within a time period of max. 90 days. The results showed a strong scan-rescan-stability of BrainAGE estimations based on MRI data acquired on the same scanner, with mean BrainAGE scores between 1st and 2nd scan not differing among each other (p = 0.60) and the intra-class correlation coefficient (ICC; two-way random single measures) between BrainAGE scores calculated from the 1st and 2nd scan resulting in 0.93 [95% confidence interval [CI]: 0.83–0.97; (45)].
Effect of Different MRI Field Strengths on BrainAGE Estimations
To analyze estimation stability across different scanners and field strengths, T1-weighted MRI data of 60 healthy subjects (aged 60–87 years) were utilized, applying the BrainAGE method to two MRI scans per subject, acquired on two different MRI scanners (1.5T & 3T) within a short period of time. The results suggest that the field strength affects BrainAGE estimations, which should be corrected for by shifting the BrainAGE scores to a zero group mean with a linear term in both data sets in order to gain interpretability of the results (Figure S3). After linearly adjusting for the scanner-specific offset, Student's t-test did not show any difference between the BrainAGE scores calculated from the 1.5T and 3T scans (p = 1.00). ICC between the BrainAGE scores calculated from the 1.5T and 3T scans resulted in 0.90 (CI: 0.84–0.94), demonstrating strong reliability and generalizability of the BrainAGE model, even with data from different scanners and field strengths (45).
Sensitivity to Hormone-Related Short-Term Changes of BrainAGE in Women
In order to establish the BrainAGE model as an innovative tool to monitor and evaluate short-term changes in individual brain aging induced by treatments and interventions, we explored its potential to recognize short-term changes in brain structure occurring during the menstrual cycle due to varying hormonal influences (35). A total of 7 young, healthy, naturally cycling women (age range 21–31 years) were scanned on a 1.5T MRI scanner (t1) during menses, (t2) at time of ovulation, (t3) in the midluteal phase, and (t4) at their next menses. During menstrual cycle BrainAGE scores significantly differed (p < 0.05), with BrainAGE scores decreasing by −1.3 years from menses to ovulation (SD = 1.2 years; p < 0.05) and after ovulation slowly increasing (Figure 4). Additionally, estradiol levels did negatively correlate with BrainAGE scores (r = −0.42, p < 0.05), but progesterone levels did not (r = 0.08, p = 0.71).
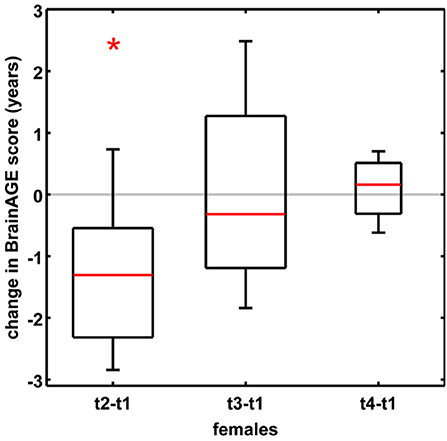
Figure 4. Change in BrainAGE scores during the menstrual cycle. BrainAGE scores significantly decreased by −1.3 years (SD = 1.2) at time of ovulation (i.e., t2-t1; *p < 0.05). The data are displayed as boxplots, containing the values between the 25th and 75th percentiles of the samples, including the median (red lines). Lines extending above and below each box symbolize data within 1.5 times the interquartile range. The width of the boxes depends on the sample size. Note: reduced sample size at t4. [Figure and legend reproduced from Franke et al. (35), with permission from Elsevier, Amsterdam].
Another study by Luders et al. (84) explored the changes in BrainAGE after pregnancy. A total of 14 healthy women (aged 25–38 years) were scanned on a 3T MRI scanner within the first two after childbirth (early postpartum) as well as 4–6 weeks after childbirth (late postpartum). BrainAGE scores were significantly decreased by an average of −5.4 years from early to late postpartum (SD = 2.4 years; p < 0.001). Additional analyzes of hormone levels also showed a profound postpartum decrease in estradiol (p < 0.001) and progesterone (p < 0.001).
Taken together, these results provide strong evidence that hormonal changes during the course of the menstrual cycle have significant effects on the individual brain structure. Furthermore, the BrainAGE method demonstrated its potential to capture and identify subtle short-term changes in individual brain structure.
Applications of BrainAGE Model for Brain Maturation During Childhood and Adolescence
Effects of Being Born Preterm on Individual Brain Maturation
In a study with pre-term born adolescents, individual BrainAGE scores of subjects being born before the end of the 27th week of gestation (i.e., GA < 27; n = 10) were compared to those being born after the end of the 29th week of gestation (i.e., GA > 29; n = 15), applying the pre-established BrainAGE model for brain maturation during childhood and adolescence (31). At MRI scanning (1.5T), subjects were aged between 12 and 16 years. The results show significantly lower BrainAGE scores by 1.6 years in the group of adolescents being born GA < 27 (−1.96 ± 0.68 years) as compared to subjects being born GA > 29 (−0.40 ± 1.50 years), although the mean difference in gestation age was only 5 weeks, thus probably implying delayed structural brain maturation.
BrainAGE in Mild Cognitive Impairment and Alzheimer's Disease
Premature Brain Aging in AD
In a first proof-of-concept application, individual brain ages was studied in a group of cognitively healthy control subjects (CTR; n = 232) and a group of patients suffering from early Alzheimer's disease (AD; n = 102), applying the pre-established BrainAGE model for brain aging during adulthood (32). For the AD group, the mean BrainAGE score was +10 years (p < 0.001), implying systematically advanced brain aging.
In another study that applied the pre-established BrainAGE model for brain aging during adulthood to data from the Alzheimer's Disease Neuroimaging Initiative (ADNI) database, baseline BrainAGE scores resulted in the following group means: (1) −0.3 years in CTR (i.e., being stable in the diagnosis of CTR during 36-months follow-up; n = 108), (2) −0.5 years in sMCI (i.e., stable MCI; being stable in the diagnosis of mild cognitive impairment (MCI) during 36-months follow-up; n = 36), (3) 6.2 years in pMCI (i.e., progressive MCI; changing diagnosis from MCI at baseline to AD during 36-months follow-up; n = 112), and (4) 6.7 years in AD (i.e., being stable in the diagnosis of AD during 36-months follow-up or until death; n = 150). Post-hoc t-tests resulted in significant BrainAGE differences between CTR/sMCI vs. pMCI/AD groups (p < 0.05), suggesting strong evidence for structural brain changes that show the pattern of advanced brain aging in the pMCI and AD groups (Figure 5A) (45).
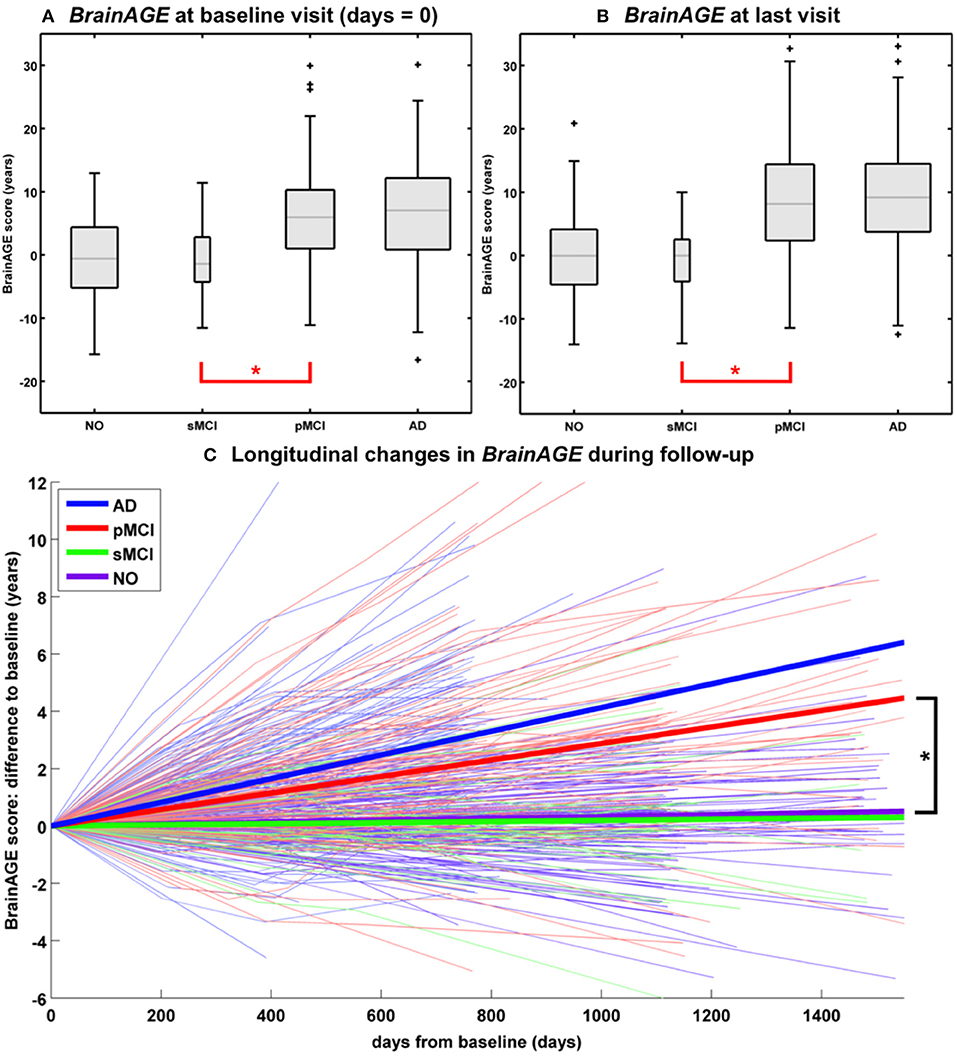
Figure 5. Longitudinal BrainAGE. Box plots of (A) baseline BrainAGE scores and (B) BrainAGE scores of last MRI scans for all diagnostic groups. Post-hoc t-tests showed significant differences between NO/sMCI vs. pMCI/AD (*p < 0.05) at both time measurements. (C) Longitudinal changes in BrainAGE scores for NO, sMCI, pMCI, and AD. Thin lines represent individual changes in BrainAGE over time; thick lines indicate estimated average changes for each group. Post-hoc t-tests showed significant differences in the longitudinal BrainAGE changes between NO/sMCI vs. pMCI/AD (*p < 0.05). [Figures and legend reproduced from Franke et al. (45), with permission from Hogrefe Publishing, Bern].
Longitudinal Changes of Individual Brain Aging in CTR, MCI, AD
Further analyses explored the individual brain aging trajectories in CTR, sMCI, pMCI, and AD during a follow-up period of up to 36 months (45). BrainAGE scores in pMCI and AD significantly increased by 1.0 additional year in brain aging per follow-up (chronological age) year in pMCI and 1.5 additional years in brain aging per follow-up (chronological age) year in AD, suggesting acceleration of individual brain aging during the course of disease (Figure 5C). With pMCI and AD subjects already showing advanced BrainAGE scores of about 6 to 7 years at baseline assessment and mean follow-up durations of 2.6 years for pMCI and 1.7 years for AD, mean BrainAGE scores at last follow-up MRI scan accumulated to about 9 years at the last MRI scan in both diagnostic groups (Figure 5B). In contrast, mean BrainAGE scores in CTR and sMCI subjects did not change during follow-up, thus suggesting no deviations from healthy brain aging in both groups.
Additionally, advanced structural brain aging was related to worse cognitive functioning and more severe clinical symptoms during the 36 months follow-up period (baseline BrainAGE scores: r = 0.39–0.46; BrainAGE scores at last follow-up visit: r = 0.46–0.55). Moreover, individual changes in BrainAGE scores were correlated with individual changes in cognitive test scores and clinical severity (r = 0.27–0.33), denoting a significant relationship between acceleration in individual brain aging and prospective worsening of cognitive functioning, being most pronounced in pMCI and AD subjects (45).
Effects of APOE-Genotype on Longitudinal Changes in CTR, MCI, AD
Studying the effects of Apolipoprotein E (APOE) on individual brain aging trajectories during a 36 months follow-up period, neither APOE ε4-status, nor particular allelic isoforms had a significant effect on baseline BrainAGE scores in the four diagnostic groups (36). However, individual brain aging accelerated significantly faster in APOE ε4-carriers as compared to APOE ε4-non-carriers in the pMCI and AD groups. More specifically, in pMCI ε4-carriers individual brain aging accelerated with the speed of 1.1 additional years per follow-up year, whereas in pMCI ε4-non-carriers individual brain aging accelerated with the speed of only about 0.6 years. Likewise, in AD ε4-carriers individual brain aging accelerated with the speed of 1.7 additional years per follow-up year, whereas in AD ε4-non-carriers individual brain aging accelerated with the speed of only about 0.9 years per follow-up year. In line with previous results, deviations from normal brain aging trajectories were not observed in healthy controls or sMCI subjects, neither in ε4-carriers nor ε4-non-carriers (Figure 6).
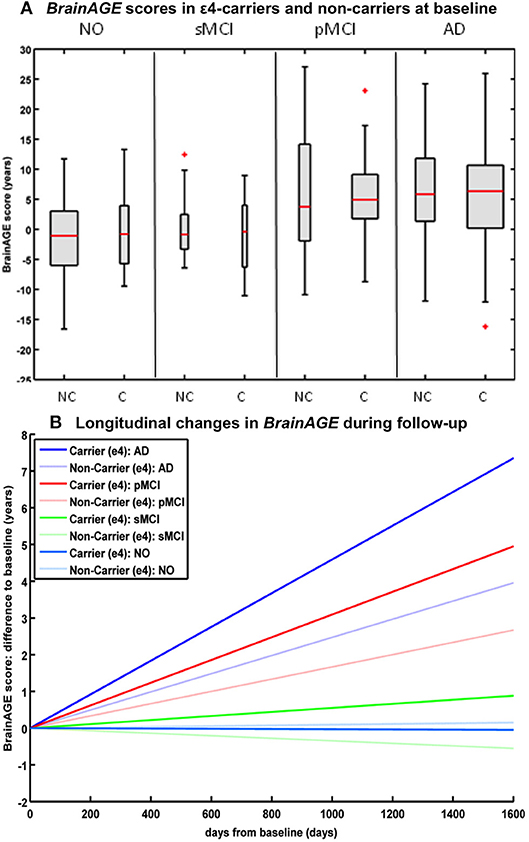
Figure 6. Longitudinal BrainAGE in APOE ε4-carriers and ε4-non-carriers. BrainAGE scores at (A) baseline for APOE ε4-carriers [C] and non-carriers [NC] in the 4 diagnostic groups NO, sMCI, pMCI, and AD. BrainAGE scores differed significantly between diagnostic groups (p < 0.001). Post-hoc tests showed significant differences between BrainAGE scores in NO as well as sMCI from BrainAGE scores in pMCI as well as AD (p < 0.05). (B) Estimated longitudinal changes in BrainAGE scores for the 4 diagnostic groups: NO (light blue), sMCI (green), pMCI (red) and AD (blue), subdivided into APOE ε4 carriers and non-carriers. Post-hoc t-tests resulted in significant differences for ε4 carriers and non-carriers as well as for NO/sMCI vs. pMCI/AD (p < 0.05). [Figures and legend reproduced from Loewe et al. (36), permitted under the Creative Commons Attribution License].
BrainAGE-Based Prediction of Conversion to Alzheimer's Disease
BrainAGE-Based Prediction of Conversion From MCI to AD
In a study by Gaser et al. (37), the BrainAGE approach was implemented to predict future conversion to AD at a single-subject level up to 36 months in advance, based on structural MRI. The sample included 195 participants diagnosed with MCI at baseline, of whom 133 participants were diagnosed with AD during 36 months of follow-up. The BrainAGE scores at baseline examination differed significantly between the participants, who did not convert to AD (i.e., sMCI; 0.7 years) and those, who converted to AD within the 1st follow-up year (i.e., pMCI_fast; 8.7 years) as well as in 2nd or 3rd follow-up year (i.e., pMCI_slow; 5.6 year). A close relationship was shown between advanced brain aging, prospective worsening of cognitive functioning, and clinical disease severity. Predicting conversion from MCI to AD by using baseline BrainAGE scores, post-test probability increased to 90%. This gain in certainty based on the baseline BrainAGE score was 22%, being the highest as compared to baseline hippocampus volumes (right/left: 16%/17%), cognitive scores (MMSE: 11%; CDR-SB: 0%; ADAS: 18%), and even state-of-the-art CSF biomarkers (T-Tau: 4%, P-Tau: 0%, Aβ42: 0%, Aβ42/P-Tau: 8%). Predicting future conversion to AD during the 1st follow-up year based on baseline BrainAGE scores showed an accuracy of 81% (area under curve (AUC) in receiver-operating characteristic (ROC) analysis = 0.83), being significantly more accurate than conversion predictions based on chronological age, hippocampus volumes, cognitive scores, and CSF biomarkers (for exact numbers see Table 1). Furthermore, higher BrainAGE scores were related to a higher risk of developing AD, i.e., each additional year in BrainAGE score induced a 10% greater risk of developing AD (hazard rate: 1.1, p < 0.001). More specifically, as compared with participants in the lowest quartile of BrainAGE scores, participants in the 2nd quartile had about the same risk of developing AD (hazard ratio [HR]: 1.1; p = 0.68), those in the 3rd quartile had a three times greater risk (HR: 3.1; p < 0.001), and those in the 4th quartile had a more than four times greater risk (HR: 4.7; p < 0.001) of developing AD (Figure 7A). BrainAGE outperformed all other baseline measures.
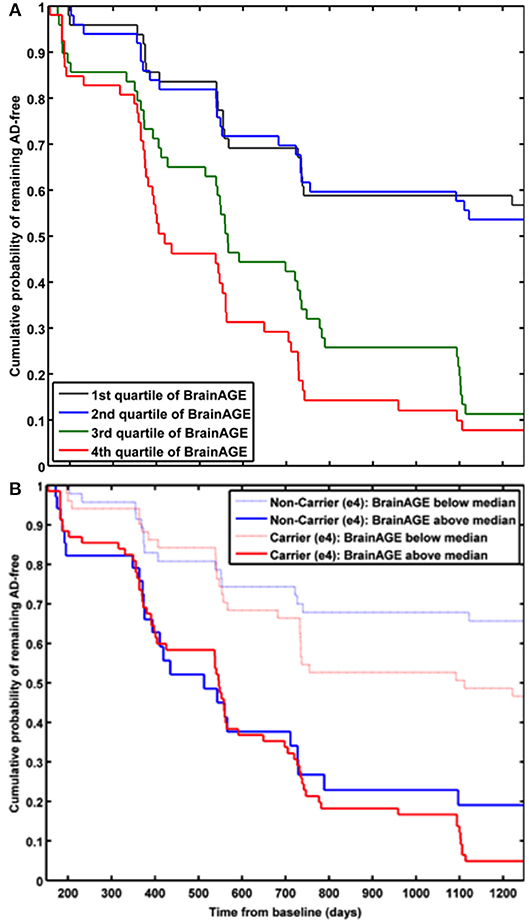
Figure 7. Cumulative probability for MCI patients of remaining AD-free based. (A) Kaplan-Meier survival curves based on Cox regression comparing cumulative AD incidence in participants with MCI at baseline by BrainAGE score quartiles (p for trend < 0.001). [Figure and legend reproduced from Gaser et al. (37), permitted under the Creative Commons Attribution License.] (B) Kaplan-Meier survival curves based on Cox regression comparing the cumulative incidence of AD incidence in ε4-carriers [red] and ε4-non-carriers [blue] with MCI at baseline, divided into patients with baseline BrainAGE scores below the median (light lines) and above the median (dark lines). Duration of follow-up is truncated at 1,250 days. [Figure and legend reproduced from Loewe et al. (36), permitted under the Creative Commons Attribution License].
Effects of APOE-Genotype on BrainAGE-Based Prediction of Conversion From MCI to AD
A study by Loewe et al. (36) additionally explored the effects of the APOE-genotype on BrainAGE-based prediction of conversion from MCI to AD during the 36 months of follow-up period. Independent of APOE status, higher baseline BrainAGE scores were associated with a higher risk of converting to AD, with BrainAGE scores above median of 4.5 years resulting in a nearly 4 times greater risk of converting to AD as compared to BrainAGE scores below the median (HR: 3.8, p < 0.001). Again, the Cox regression model based on baseline BrainAGE scores outperformed all other models based on cognitive scores, even when including the APOE ε4-status into the models (Figure 7B). Also, predictions based on baseline BrainAGE scores were significantly more accurate than predictions based on chronological age or cognitive test scores (for exact numbers see Table 1), especially in APOE ε4-carriers.
Effects of Psychiatric Disorders on Brain Aging
A recent study on the effects of psychiatric disorders on individual brain aging analyzed data from schizophrenia (SZ) patients, bipolar disorder (BD) patients (mostly with previous psychotic symptoms or episodes), as well as CTR participants, aged 21–65 years. Significantly higher BrainAGE scores by 2.6 years were found in SZ, but not BD patients, indicating advanced structural brain aging in SZ (Figure 8A). This study thus suggested, that there might be an additional progressive pathogenic component despite the conceptualization of SZ as a neurodevelopmental disorder (38).
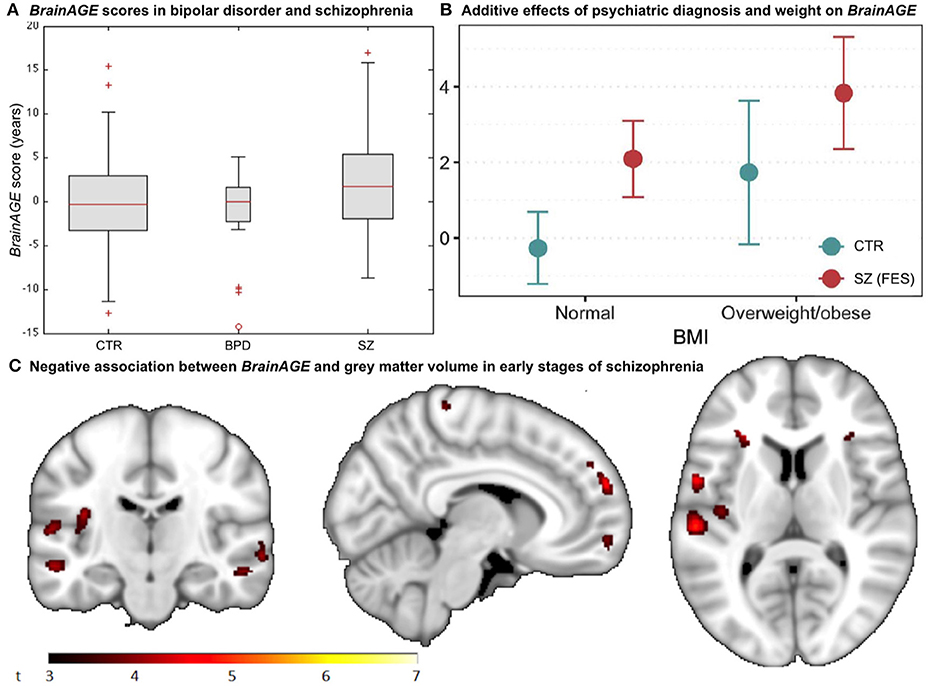
Figure 8. BrainAGE in psychiatric disorders. (A) Box-plot of BrainAGE scores in healthy controls (CTR), bipolar disorder patients (BPD), and schizophrenia patients (SZ) with significant group effect (ANOVA, p = 0.009), and schizophrenia patients showing higher BrainAGE scores than either CTR or BPD. [Figure and legend reproduced from Nenadic et al. (38), with permission from Elsevier, Amsterdam.] (B) Associations between BrainAGE scores and psychiatric diagnosis and metabolic factors. Obesity was significantly associated with BrainAGE scores additively to the effect of first-episode schizophrenia (FES; age adjusted mean and 95% confidence intervals). [Figure and legend reproduced from Kolenic et al. (40), with permission from Elsevier, Amsterdam.] (C) Negative association between BrainAGE and gray matter volume in participants with first episodes of schizophrenia-spectrum disorders (P ≤ 0.001, cluster extent = 50). [Figure and legend from Hajek et al. (39), with permission from Oxford University Press].
Interestingly, another study by Hajek et al. (39) in young adult patients with early SZ as well as young adult patients with early BD and young adults with familial risk for BD, aged 15–35 years, resulted in comparable results. Specifically, participants with first-episode SZ showed advanced BrainAGE of 2.6 years as compared to their chronological age (p < 0.001), whereas participants at familial risk for or in the early stages of BD showed no differences between brain age and chronological age as well as compared to controls (p = 0.70). Post-hoc analyses additionally showed that BrainAGE was negatively associated with GM volume diffusely throughout the brain (Figure 8C). The authors concluded that the greater presence of neurostructural antecedents may differentiate SZ from BD and that BrainAGE could consequently aid in early differential diagnosis between BD and SZ.
A third study in first-episode SZ investigated whether comorbid obesity or dyslipidemia additionally contributes to brain alterations (40). Comparable to previous studies, young adult participants with first-episode SZ (n = 120; 18–35 years) showed neurostructural alterations, which resulted in their brain age exceeding their chronological age by 2.6 years (p < 0.001). Furthermore, the diagnosis of first-episode SZ and obesity were each additively associated with BrainAGE (p < 0.001), resulting in BrainAGE scores being highest in obese participants with first-episode SZ (3.8 years) and lowest in normal weight controls (−0.3 years; Figure 8B). However, neither dyslipidemia nor medical treatment was associated with BrainAGE. In conclusion, this study suggests obesity being an independent risk factor for diffuse brain alterations, manifesting as advanced brain aging already in the early course of SZ. Thus, targeting metabolic health and intervening at the BMI level might potentially slow brain aging in schizophrenic and psychotic patients.
Effects of Individual Health on Brain Aging
Effects of Type 2 Diabetes Mellitus on Brain Aging
In the study by Franke et al. (41), the BrainAGE method was applied to a sample of participants with type 2 diabetes mellitus (DM2) and CTR participants (mean age: 65 ± 8 years) in order to quantify the effects of DM2 on individual brain aging in cognitively healthy older adults. Participants with DM2 showed significantly increased BrainAGE by 4.6 years as compared to age-matched healthy CTRs (p < 0.001). Moreover, longer diabetes duration was correlated to higher BrainAGE scores (r = 0.31, p < 0.05). Additionally, BrainAGE scores were also positively related to fasting blood glucose (r = 0.34, p < 0.05), with a difference of 5.5 years (p < 0.05) between participants with the lowest vs. highest values.
Longitudinal Effects of Type 2 Diabetes Mellitus on Brain Aging
Additionally, Franke et al. (41) further analyzed a small subsample of DM2 and CTR participants that completed a follow-up MRI scan 3.8 ± 1.5 years after their baseline assessment. GM and WM volumes did not differ between both groups or between time points. However, BrainAGE scores were increasing by 0.2 years per follow-up year in participants with DM2, but did not change in CTRs during follow-up. Specifically, baseline BrainAGE scores in DM2 patients were increased by 5.1 years as compared to CTR (p < 0.05), they even increased by 0.8 years during follow-up (p < 0.05). Thus, brain aging in DM2 did even more accelerate during follow-up.
Individual Health and Brain Aging
In addition to the effects of DM2 on individual brain aging in non-demented older adults, the study by Franke et al. (41) also explored the (additional) effects of lifestyle risk factors (i.e., smoking duration, alcohol intake), individual health marker (i.e., hypertension, TNFα), and common clinical outcomes (i.e., cognition, depression). The results revealed BrainAGE being also correlated to smoking duration (r = 0.20, p < 0.01), alcohol consumption (r = 0.24, p < 0.001), TNFα levels (r = 0.29, p < 0.01), verbal fluency (r = −0.25, p < 0.01), and depression (r = 0.23, p < 0.05), but not to hypertension (p = 0.9). Furthermore, contrasting individuals with the lowest values (i.e., 1st quartile) vs. those with the highest values in these measures (i.e., 4th quartile) resulted in BrainAGE differences of 3.4 years for smoking duration (p < 0.01), 4.1 years for alcohol intake (p < 0.01), 5.4 years for TNFα (p < 0.01), 5.6 years for verbal fluency (p < 0.001), and 5.4 years for depression (p < 0.01; Figure 9A), with all results being independent of diabetes duration, gender, and age (41).
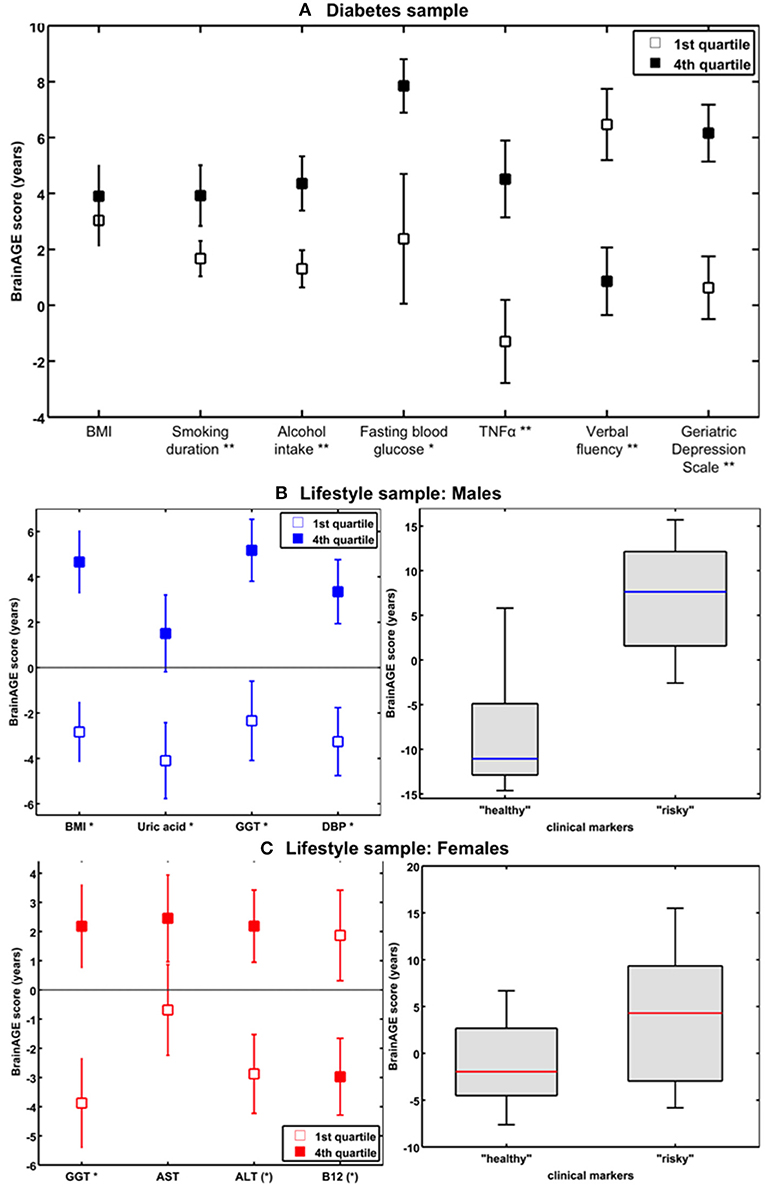
Figure 9. The effects of low vs. high levels in distinguished variables on BrainAGE. (A) Mean BrainAGE scores in participants with values in the 1st (plain squares) and 4th (filled squares) quartiles of distinguished variables from the diabetes study. [Figure and legend reproduced from Franke et al. (41), permitted under the Creative Commons Attribution License.] (B) Mean BrainAGE scores of cognitively healthy CTR men in the 1st vs. 4th quartiles of the most significant physiological and clinical chemistry parameters (left panel). BrainAGE scores of cognitively healthy CTR men with “healthy” markers (i.e., values below the medians of BMI, DBP, GGT, and uric acid; n = 9) vs. “risky” markers (i.e., values above the medians of BMI, DBP, GGT, and uric acid; n = 14; p < 0.05; right panel). [Figures and legend modified from Franke et al. (42), permitted under the Creative Commons Attribution License.] (C) Mean BrainAGE scores of cognitively healthy CTR women in the 1st vs. 4th quartiles of the most significant physiological and clinical chemistry parameters (left panel). BrainAGE scores of cognitively healthy CTR women with “healthy” markers (i.e., values below the medians of GGT, ALT, AST, and values above the median of vitamin B12; n = 14) vs. “risky” clinical markers (i.e., values above the medians of GGT, ALT, AST, and values below the median of vitamin B12; n = 13; p < 0.05; right panel). [Figures and legend modified from Franke et al. (42), permitted under the Creative Commons Attribution License]. *p < 0.05; **p < 0.01.
Gender-Specific Effects of Health Characteristics on Brain Aging
In a study by Franke et al. (42), the effects of various physiological and clinical markers of personal health on individual BrainAGE scores were further explored and quantified, utilizing a sample of cognitively unimpaired participants, aged 60–90 years.
In the male sample, the included health parameters explained 39% of the observed variance in BrainAGE (p < 0.001), with body mass index (BMI), uric acid, γ-glutamyl-transferase (GGT), and diastolic blood pressure (DBP) contributing most. Additional quartile analyses revealed significant differences in BrainAGE scores between the 1st vs. 4th quartile groups (Figure 9B, left panel), resulting in 7.5 years for BMI (p < 0.001), 6.6 years for DBP (p < 0.01), 7.5 years for GGT (p < 0.01), and 5.6 years for uric acid (p < 0.05). When combining these four health markers, the effects on individual BrainAGE even were compounded. In detail, comparing individual brain ages of male subjects with values below the medians vs. those with values above the medians of BMI, DBP, GGT, and uric acid resulted in BrainAGE scores of −8.0 vs. 6.7 years (p < 0.05; Figure 9B, right panel), thus suggesting a strong relationship between individual health and neurostructural aging in men.
In the female sample, the included health parameters explained 32% of the observed variance in BrainAGE (p < 0.01), with GGT, aspartat-amino-transferase (AST), alanin-amino-transferase (ALT), and vitamin B12 contributing most. In addition, 1st vs. 4th quartile analyses resulted in differences in BrainAGE (Figure 9C, left panel) of 6.6 years for GGT (p < 0.01), 3.1 years for AST (p < 0.10), 5.1 years for ALT (p < 0.05), and 4.8 years for vitamin B12 (p < 0.05). Again, when combining these four health markers, the effects on individual BrainAGE were compounded, resulting in mean BrainAGE scores of −1.0 vs. 3.8 years (p < 0.05; Figure 9C, right panel), thus suggesting a mediocre relationship between individual health and neurostructural aging in women.
Protecting Interventions for Brain Aging
Effects of Long-Term Meditation Practice on Brain Aging
Exploring the effects of long-term meditation practice, the study by Luders et al. (43) included 50 meditation practitioners with 4–46 years of meditation experience (mean: 20 ± 11 years) and 50 non-meditating, age-matched CTRs. At age 50 years, BrainAGE in meditation practitioners was about 7.5 years lower than in CTRs (p < 0.05). Additionally, gender exerted a main effect, with BrainAGE in females being lower by 3.4 years as compared to males (p < 0.01). Furthermore, age-by-group interaction was significant (p < 0.05), with follow-up analyses revealing significant effects for BrainAGE in meditation practitioners. In detail, for each year in chronological age over the age of 50 years, there was a significant decrease of 1 month and 22 days in BrainAGE in the meditation practitioners (Figure 10).
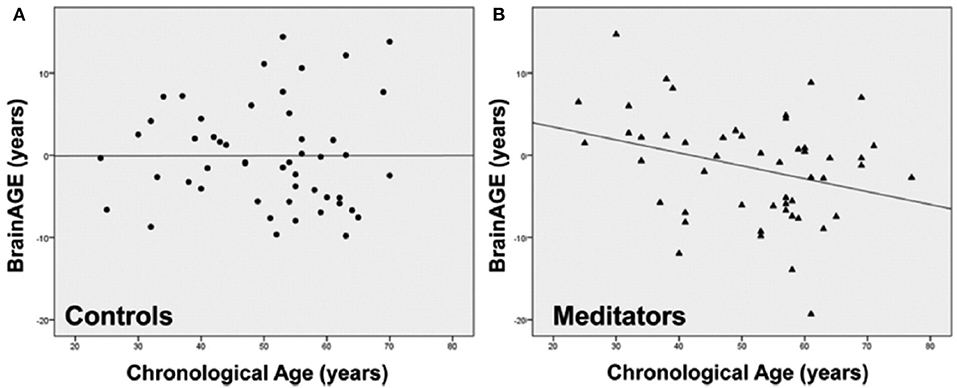
Figure 10. Group-specific links between age-related measures. Scatterplots and regression lines were generated separately for (A) controls (circles) and (B) meditation practitioners (triangles). The x-axes display the chronological age; the y-axes display the BrainAGE index (negative values indicate that participants' brains were estimated as younger than their chronological age, positive values indicate that participants' brains were estimated as older). [Figures and legend reproduced from Luders et al. (43), with permission from Elsevier].
Effects of Making Music on Brain Aging
Another study investigated the impact of music-making on brain aging, including non-musicians, amateur musicians, and professional musicians, aged 25 ± 4 years (44). All three groups were closely matched regarding age, gender, education, and other leisure activities. The “musician status” had a significant effect on BrainAGE (p < 0.05; non-musicians: −0.5 ± 6.8 years; amateur musicians: −4.5 ± 5.6 years; professional musicians: −3.7 ± 6.6 years), suggesting a decelerating effect of making music on individual brain aging. Post-hoc comparisons revealed lower BrainAGE scores in amateur musicians (p < 0.05) and professional musicians (p = 0.07) as compared to non-musicians. While no significant correlation between years involved in musical activities and BrainAGE score was found in amateur musicians (r = −0.1, n.s.), a small correlation was found in professional musicians (r = 0.3, p < 0.05). Thus, making music seems to have a slowing effect on the aging of the brain, especially for amateur musicians, while professional musicians revealed a lower effect probably due to stress-related interferences.
Gender-Specific Effects of Prenatal Undernutrition on Individual Brain Aging
Results From Studies in Humans
Utilizing a subsample of the Dutch famine birth cohort, a recent study investigated the effects of fetal undernutrition during early gestation on individual brain aging in late-life (85). The participants of the MRI subsample were aged about 67 years at the time of MRI acquisition, including individuals being born before the famine in Winter 1944/45, individuals being prenatally exposed to the famine during early gestation, and individuals being conceived after the famine. In females, 28% of the observed variance BrainAGE at age 67 years was explained by birth characteristics, chronological age at MRI data acquisition, and famine exposure (p < 0.05), whereas in males, 76% the observed variance in BrainAGE was explained by the combination of birth characteristics, late-life health characteristics, chronological age, and famine exposure (p < 0.05). In the male sample, BrainAGE scores differed significantly between the three groups (p < 0.05). In the female sample, BrainAGE scores did not differ between the groups. Post-hoc tests in the male sample showed advanced brain aging by 2.5 years (p < 0.05) in those who had been prenatally exposed to the famine during early gestation, whereas those who had been born before the famine showed delayed brain aging by −1.8 years, resulting in a difference of about 4 years (p < 0.05; Figure 11A). With regard to BrainAGE scores there were no significant differences between males and females (85).
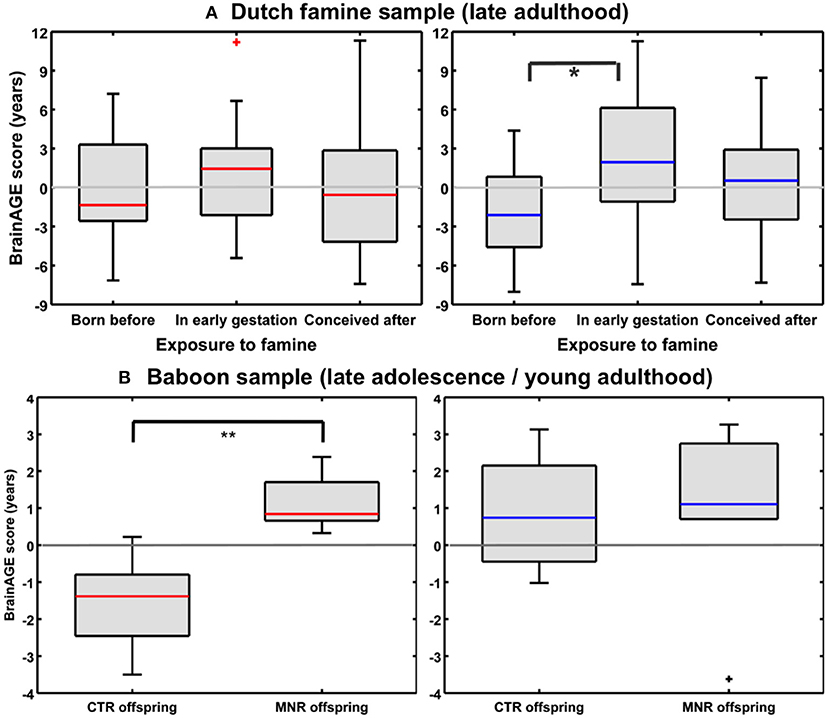
Figure 11. Effects of prenatal undernutrition on brain aging. (A) Dutch famine sample: BrainAGE scores in late adulthood differed significantly between the three groups only in men (blue), but not in women (red). In men, post-hoc tests showed significantly increased scores in those with exposure to famine in early gestation (*p < 0.05). [Figure and legend reproduced from Franke et al. (85), with permission from Elsevier, Amsterdam.] (B) Baboon sample: BrainAGE scores in late adolescence/young adulthood differed significantly between female (red) CTR and offspring with maternal nutrient restriction (MNR) by 2.7 years (**p < 0.01), but not between male (blue) CTR and MNR offspring. [Figure and legend reproduced from Franke et al. (33), permitted under the Creative Commons Attribution License].
Results From Studies in Non-human Primates
An experimental study of maternal nutrient restriction (MNR) in baboons also studied the effects of prenatal undernutrition on structural brain aging based on the baboon-specific BrainAGE model [see Species-specific BrainAGE model for baboons; (33)]. The experimental group included 11 subjects [5 females], with prenatal undernutrition being induced by MNR of 30% during the whole gestation. The CTR group included 12 same-aged subjects [5 females]. Subjects were aged 4–7 years [human equivalent to 14–24 years] at time of MRI data acquisition. In the female MNR offspring, baboon-specific BrainAGE scores were increased by 2.7 years, as compared to female CTR offspring (p = 0.01; Figure 11B), strongly suggesting premature brain aging resulting from prenatal undernutrition during the whole gestation. There were no differences in BrainAGE scores between the male MNR and CTR offspring (33).
Summary
In this review, we recapitulated studies that utilized the innovative BrainAGE biomarker to capture individual age-related brain structure, covering age ranges from childhood until late adulthood (Figure 12 for a graphic summary of all results in human studies). This predictive analytical method provides a personalized biomarker of brain structure that can help to elucidate und further examine the patterns and mechanisms underlying individual differences in brain structure and disease states. Because brain-age estimation is done on an individual level, the BrainAGE biomarker might be very well-suited for clinical use. The method is deriving individual predictions from multivariate patterns and interactions between voxels across the whole brain. In contrast to other structural measures, such as regional or global volumes, cortical thickness, or fractional anisotropy, BrainAGE scores are preserving the complex patterns of subtle variations in brain structure and their regional interactions. Additionally, reducing the complex multivariate structural information from the whole brain into a single metric resolves the problem of multiple comparisons and enables a better detection of effects (7, 24).
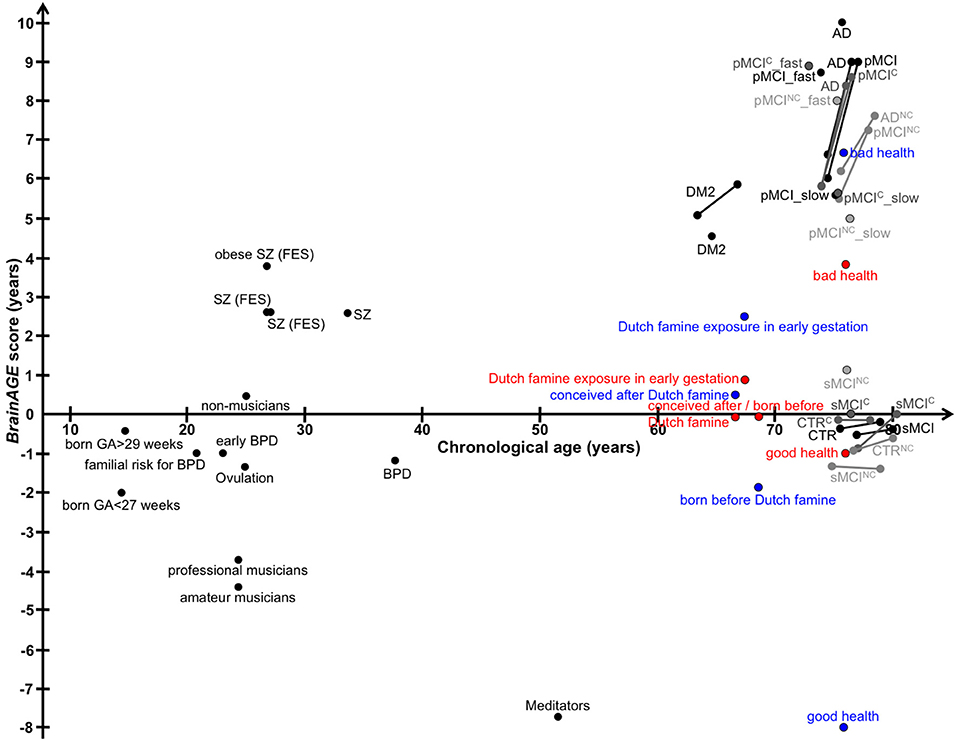
Figure 12. Graphical summary of BrainAGE results in human studies. Dots, study means; Lines, longitudinal results; Blue, males; Red, females. [AD, Alzheimer's disease; BPD, bipolar disorder; CTR, control subjects; DM2, diabetes mellitus type 2; FES, first episode of schizophrenia-spectrum disorders; GA, gestational age; MCI, mild cognitive impairment; pMCI, progressive MCI (i.e., convert from MCI to AD during follow-up); pMCI_fast, diagnosis was MCI at baseline, conversion to AD within the first 12 months (without reversion to MCI or CTR at any available follow-up; pMCI_slow, diagnosis was MCI at baseline, conversion to AD was reported after the first 12 months of follow-up (without reversion to MCI or CTR at any available follow-up); sMCI, stable MCI (i.e., diagnosis is MCI at all available time points, but at least for 36 months); SZ, schizophrenia].
According to the American Federation of Aging Research (86), markers of aging should possess certain characteristics: They should be able to determine biological aging, predict the rate of aging, monitor the fundamental processes underlying aging, and be measured accurately, efficiently, and repeatedly, without harming the subject. Further, the markers need to be applicable across the species for mechanistic examinations. However, reproducibility and accuracy of some widely used biomarkers of aging, like telomere length, vary widely due to differences in extraction methods, laboratory-dependent methodological details, and measurement methods (87–89). Thus, accuracy is sometimes so low that measurement errors impede detection of differences in telomere length (88). Although biomarkers of aging should preferably be closely related to the mechanistic aging process, development of markers of brain aging that are related to brain function and structure is much more advanced and provide a considerably higher degree of correlation to age and diagnostic specificity. Moreover, brain-aging markers based on structural MRI show less inter-individual variability and methodological variations of measurements across labs or study sites. The superiority of phenotype-related markers may be explained by a number of reasons: At present, it is easier to determine phenotype because the processes underlying brain aging are complex and not yet well-understood. This is all the more so for the many compensatory pathways in the biological environment by which the organism modulates or responds to the process of aging. Aside from the complexity being present at the cellular level, the organism can respond to an infinite number of biological and environmental influences with only limited changes to the phenotype. Consequently, establishing phenotype-related biomarkers for structural brain maturation and aging (e.g., BrainAGE) might probably be a better approach to assess and longitudinally track individual brain aging trajectories.
In general, cognitive impairment is not due to just one disease. Cognitive impairment could be caused by AD and other forms of dementia, as well as several disease conditions, e.g., traumatic brain injury, stroke, depression, or developmental disabilities. Age-related cognitive decline is a growing concern in modern societies since mental health is perceived as a major determinant limiting quality of life during aging (90). Thus, biomarkers measuring individual brain age and predicting individual trajectory of cognitive decline are highly desirable. Approaches to determine brain age based on structural neuroimaging data are designed to indicate deviations in age-related changes in brain structure by establishing reliable reference curves for healthy brain aging and providing individual brain age measures, while accounting for the multidimensional atrophy patterns in the brain. Although multiple factors affect and modify individual brain aging trajectories, normal brain aging follows coordinated and sequenced patterns of GM and WM loss as well as CSF expansion (21, 91, 92). Several studies applying the MRI-based models for structural brain aging, have already demonstrated profound relationships between premature brain aging and AD disease severity and prospective decline of cognitive functions (45), MCI and AD (93), conversion to AD (37), SZ (76, 94), traumatic brain injury (73), HIV (95), chronic pain (96), DM2 (41), and elderly people suffering from undernutrition during gestation (85), as well as being indicative of poorer physical and mental fitness, higher allostatic load, as well as increased mortality (97). Furthermore, significant associations between individual brain aging and various health parameters, personal lifestyle, or drug use (42, 98), levels of education and physical activity (77), and meditation practice (43) have been shown. However, although Brown et al. (59) showed a relation between increased premature brain maturation and increased executive intelligence measures in adolescents as well as Steffener et al. (77) showing a correlation between delayed brain aging and higher education levels in adults, this issue has to be explored in more depth with well-characterized and well-tested samples with regards to cognitive reserve and IQ levels.
In conclusion, the phenotypic approach presented here has already established and validated reference curves for age-related changes in brain structure. Furthermore, it also showed great potential for easy application in multi-center studies. Thus, this predictive analytical method provides an individualized biomarker for determining the biological age of brain structure, which also relates to cognitive function. This MRI-based marker is able to predict individual aberrations in brain maturation and aging as well as the occurrence of age-related cognitive decline and age-related neurodegenerative diseases. This review has recapitulated evidence that neuroimaging data can be used to establish biomarkers for brain aging, which has already been confirmed as providing vital prognostic information. In future, combining different biomarkers of structural and functional brain age, like the assessment of age-related changes of parameter estimates based on the “theory of visual attention” (99–103), may enhance sensitivity and specificity for detecting aberrations in biological age compared to the chronological age in various neurological and psychiatric conditions and in neurodegenerative diseases. The important prognostic information included in the estimation of the structural and functional brain age may aid in developing personalized neuroprotective treatments and interventions.
Author Contributions
All authors listed have made a substantial, direct and intellectual contribution to the work, and approved it for publication.
Funding
This work was supported by the European Community [FP7 HEALTH, Project 279281 (BrainAGE) to KF] and the German Research Foundation [DFG; Project FR 3709/1-1 to KF]. The sponsors had no role in the design and conduct of the study; collection, management, analysis, and interpretation of the data; and preparation, review, or approval of the manuscript.
Conflict of Interest Statement
The authors declare that the research was conducted in the absence of any commercial or financial relationships that could be construed as a potential conflict of interest.
Supplementary Material
The Supplementary Material for this article can be found online at: https://www.frontiersin.org/articles/10.3389/fneur.2019.00789/full#supplementary-material
References
1. Vos T, Flaxman AD, Naghavi M, Lozano R, Michaud C, Ezzati M, et al. Years lived with disability (YLDs) for 1160 sequelae of 289 diseases and injuries 1990-2010: a systematic analysis for the Global Burden of Disease Study 2010. Lancet. (2012) 380:2163–96. doi: 10.1016/S0140-6736(12)61729-2
2. Lopez-Otin C, Blasco MA, Partridge L, Serrano M, Kroemer G. The hallmarks of aging. Cell. (2013) 153:1194–217. doi: 10.1016/j.cell.2013.05.039
3. Russell SJ, Kahn CR. Endocrine regulation of ageing. Nat Rev Mol Cell Biol. (2007) 8:681–91. doi: 10.1038/nrm2234
4. Laplante M, Sabatini DM. mTOR signaling in growth control and disease. Cell. (2012) 149:274–93. doi: 10.1016/j.cell.2012.03.017
5. Rando TA, Chang HY. Aging, rejuvenation, and epigenetic reprogramming: resetting the aging clock. Cell. (2012) 148:46–57. doi: 10.1016/j.cell.2012.01.003
6. Zhang G, Li J, Purkayastha S, Tang Y, Zhang H, Yin Y, et al. Hypothalamic programming of systemic ageing involving IKK-beta, NF-kappaB and GnRH. Nature. (2013) 497:211–6. doi: 10.1038/nature12143
7. Bocklandt S, Lin W, Sehl ME, Sanchez FJ, Sinsheimer JS, Horvath S, et al. Epigenetic predictor of age. PLoS ONE. (2011) 6:e14821. doi: 10.1371/journal.pone.0014821
8. Cole JH, Franke K. Predicting age using neuroimaging: a brain ageing biomarker. Trends Neurosci. (2017) 40:681–90. doi: 10.1016/j.tins.2017.10.001
9. Franke K, Bublak P, Hoyer D, Billet T, Gaser C, Witte OW, et al. In vivo biomarkers of structural and functional brain development and aging in humans. Neurosci Biobehav Rev. (in press). doi: 10.1016/j.neubiorev.2017.11.002
10. Horvath S. DNA methylation age of human tissues and cell types. Genome Biol. (2013) 14:R115. doi: 10.1186/gb-2013-14-10-r115
11. Moskalev AA, Shaposhnikov MV, Plyusnina EN, Zhavoronkov A, Budovsky A, Yanai H, et al. The role of DNA damage and repair in aging through the prism of Koch-like criteria. Ageing Res Rev. (2013) 12:661–84. doi: 10.1016/j.arr.2012.02.001
12. Kruk PA, Rampino NJ, Bohr VA. DNA damage and repair in telomeres: relation to aging. Proc Natl Acad Sci USA. (1995) 92:258–62. doi: 10.1073/pnas.92.1.258
13. Blasco MA. Telomere length, stem cells and aging. Nat Chem Biol. (2007) 3:640–9. doi: 10.1038/nchembio.2007.38
14. Oeseburg H, De Boer RA, Van Gilst WH, Van Der Harst P. Telomere biology in healthy aging and disease. Pflugers Arch. (2010) 459:259–68. doi: 10.1007/s00424-009-0728-1
15. Harris SE, Martin-Ruiz C, Von Zglinicki T, Starr JM, Deary IJ. Telomere length and aging biomarkers in 70-year-olds: the Lothian Birth Cohort 1936. Neurobiol Aging. (2012) 33:1486.e1483–8. doi: 10.1016/j.neurobiolaging.2010.11.013
16. Heidinger BJ, Blount JD, Boner W, Griffiths K, Metcalfe NB, Monaghan P. Telomere length in early life predicts lifespan. Proc Natl Acad Sci USA. (2012) 109:1743–8. doi: 10.1073/pnas.1113306109
17. Booth T, Starr JM, Deary I. Modeling multisystem biological risk in later life: allostatic load in the Lothian birth cohort study 1936. Am J Hum Biol. (2013) 25:538–43. doi: 10.1002/ajhb.22406
18. Lara J, Godfrey A, Evans E, Heaven B, Brown LJ, Barron E, et al. Towards measurement of the healthy ageing phenotype in lifestyle-based intervention studies. Maturitas. (2013) 76:189–99. doi: 10.1016/j.maturitas.2013.07.007
19. Silk TJ, Wood AG. Lessons about neurodevelopment from anatomical magnetic resonance imaging. J Dev Behav Pediatr. (2011) 32:158–68. doi: 10.1097/DBP.0b013e318206d58f
20. Good CD, Johnsrude IS, Ashburner J, Henson RN, Friston KJ, Frackowiak RS. A voxel-based morphometric study of ageing in 465 normal adult human brains. NeuroImage. (2001) 14:21–36. doi: 10.1006/nimg.2001.0786
21. Resnick SM, Pham DL, Kraut MA, Zonderman AB, Davatzikos C. Longitudinal magnetic resonance imaging studies of older adults: a shrinking brain. J Neurosci. (2003) 23:3295–301. doi: 10.1523/JNEUROSCI.23-08-03295.2003
22. Hogstrom LJ, Westlye LT, Walhovd KB, Fjell AM. The structure of the cerebral cortex across adult life: age-related patterns of surface area, thickness, and gyrification. Cereb Cortex. (2013) 23:2521–30. doi: 10.1093/cercor/bhs231
23. Storsve AB, Fjell AM, Tamnes CK, Westlye LT, Overbye K, Aasland HW, et al. Differential longitudinal changes in cortical thickness, surface area and volume across the adult life span: regions of accelerating and decelerating change. J Neurosci. (2014) 34:8488–98. doi: 10.1523/JNEUROSCI.0391-14.2014
24. Bzdok D. Classical statistics and statistical learning in imaging neuroscience. Front Neurosci. (2016). 11:543. doi: 10.3389/fnins.2017.00543
25. Klöppel S, Stonnington CM, Chu C, Draganski B, Scahill RI, Rohrer JD, et al. Automatic classification of MR scans in Alzheimer's disease. Brain. (2008) 131:681–9. doi: 10.1093/brain/awm319
26. Koutsouleris N, Meisenzahl EM, Davatzikos C, Bottlender R, Frodl T, Scheuerecker J, et al. Use of neuroanatomical pattern classification to identify subjects in at-risk mental states of psychosis and predict disease transition. Arch Gen Psychiatr. (2009) 66:700–12. doi: 10.1001/archgenpsychiatry.2009.62
27. Cohen JR, Asarnow RF, Sabb FW, Bilder RM, Bookheimer SY, Knowlton BJ, et al. Decoding continuous variables from neuroimaging data: basic and clinical applications. Front Neurosci. (2011) 5:75. doi: 10.3389/fnins.2011.00075
28. Varoquaux G, Thirion B. How machine learning is shaping cognitive neuroimaging. Gigascience. (2014) 3:28. doi: 10.1186/2047-217X-3-28
29. Gabrieli JD, Ghosh SS, Whitfield-Gabrieli S. Prediction as a humanitarian and pragmatic contribution from human cognitive neuroscience. Neuron. (2015) 85:11–26. doi: 10.1016/j.neuron.2014.10.047
30. Arbabshirani MR, Plis S, Sui J, Calhoun VD. Single subject prediction of brain disorders in neuroimaging: promises and pitfalls. Neuroimage. (2017) 145:137–65. doi: 10.1016/j.neuroimage.2016.02.079
31. Franke K, Luders E, May A, Wilke M, Gaser C. Brain maturation: predicting individual BrainAGE in children and adolescents using structural MRI. Neuroimage. (2012) 63:1305–12. doi: 10.1016/j.neuroimage.2012.08.001
32. Franke K, Ziegler G, Kloppel S, Gaser C, Alzheimer's Disease Neuroimaging I. Estimating the age of healthy subjects from T1-weighted MRI scans using kernel methods: exploring the influence of various parameters. Neuroimage. (2010) 50:883–92. doi: 10.1016/j.neuroimage.2010.01.005
33. Franke K, Clarke GD, Dahnke R, Gaser C, Kuo AH, Li C, et al. Premature brain aging in baboons resulting from moderate fetal undernutrition. Front Aging Neurosci. (2017) 9:92. doi: 10.3389/fnagi.2017.00092
34. Franke K, Dahnke R, Clarke G, Kuo A, Li C, Nathanielsz P, et al. MRI based biomarker for brain aging in rodents and non-human primates. In: 2016 International Workshop on Pattern Recognition in Neuroimaging (PRNI) (2016).
35. Franke K, Hagemann G, Schleussner E, Gaser C. Changes of individual BrainAGE during the course of the menstrual cycle. Neuroimage. (2015) 115:1–6. doi: 10.1016/j.neuroimage.2015.04.036
36. Loewe LC, Gaser C, Franke K, Alzheimer's Disease Neuroimaging I. The effect of the APOE genotype on individual brainAGE in normal aging, mild cognitive impairment, and alzheimer's disease. PLoS ONE. (2016) 11:e0157514. doi: 10.1371/journal.pone.0157514
37. Gaser C, Franke K, Kloppel S, Koutsouleris N, Sauer H, Alzheimer's Disease Neuroimaging I. BrainAGE in mild cognitive impaired patients: predicting the conversion to alzheimer's disease. PLoS ONE. (2013) 8:e67346. doi: 10.1371/journal.pone.0067346
38. Nenadic I, Dietzek M, Langbein K, Sauer H, Gaser C. BrainAGE score indicates accelerated brain aging in schizophrenia, but not bipolar disorder. Psychiatry Res. (2017) 266:86–9. doi: 10.1016/j.pscychresns.2017.05.006
39. Hajek T, Franke K, Kolenic M, Capkova J, Matejka M, Propper L, et al. Brain age in early stages of bipolar disorders or schizophrenia. Schizophr Bull. (2019) 45:190–8. doi: 10.1093/schbul/sbx172
40. Kolenic M, Franke K, Hlinka J, Matejka M, Capkova J, Pausova Z, et al. Obesity, dyslipidemia and brain age in first-episode psychosis. J Psychiatr Res. (2018) 99:151–8. doi: 10.1016/j.jpsychires.2018.02.012
41. Franke K, Gaser C, Manor B, Novak V. Advanced BrainAGE in older adults with type 2 diabetes mellitus. Front Aging Neurosci. (2013) 5:90. doi: 10.3389/fnagi.2013.00090
42. Franke K, Ristow M, Gaser C, Alzheimer's Disease Neuroimaging I. Gender-specific impact of personal health parameters on individual brain aging in cognitively unimpaired elderly subjects. Front Aging Neurosci. (2014) 6:94. doi: 10.3389/fnagi.2014.00094
43. Luders E, Cherbuin N, Gaser C. Estimating brain age using high-resolution pattern recognition: younger brains in long-term meditation practitioners. Neuroimage. (2016) 134:508–13. doi: 10.1016/j.neuroimage.2016.04.007
44. Rogenmoser L, Kernbach J, Schlaug G, Gaser C. Keeping brains young with making music. Brain Struct Funct. (2018) 223:297. doi: 10.1007/s00429-017-1491-2
45. Franke K, Gaser C, For the Alzheimer's Disease Neuroimaging Initiative. Longitudinal changes in individual BrainAGE in healthy aging, mild cognitive impairment, and Alzheimer's disease. GeroPsych. (2012) 25:235–45. doi: 10.1024/1662-9647/a000074
46. Van Leemput K, Maes F, Vandermeulen D, Suetens P. Automated model-based bias field correction of MR images of the brain. IEEE Trans Med Imag. (1999) 18:885–96. doi: 10.1109/42.811268
47. Cohen MS, Dubois RM, Zeineh MM. Rapid and effective correction of RF inhomogeneity for high field magnetic resonance imaging. Hum Brain Mapp. (2000) 10:204–211. doi: 10.1002/1097-0193(200008)10:4<204::AID-HBM60>3.0.CO;2-2
48. Ashburner J, Friston KJ. Unified segmentation. NeuroImage. (2005) 26:839–51. doi: 10.1016/j.neuroimage.2005.02.018
49. Rajapakse JC, Giedd JN, Rapoport JL. Statistical approach to segmentation of single-channel cerebral MR images. IEEE Transact Med Imaging. (1997) 16:176–86. doi: 10.1109/42.563663
50. Cuadra MB, Cammoun L, Butz T, Cuisenaire O, Thiran JP. Comparison and validation of tissue modelization and statistical classification methods in T1-weighted MR brain images. IEEE Transac Med Image. (2005) 24:1548–65. doi: 10.1109/TMI.2005.857652
51. Tohka J, Zijdenbos A, Evans A. Fast and robust parameter estimation for statistical partial volume models in brain MRI. Neuroimage. (2004) 23:84–97. doi: 10.1016/j.neuroimage.2004.05.007
52. Tipping ME. The Relevance Vector Machine. In: Solla SA, Leen TK, Müller KR, editors. Advances in Neural Information Processing Systems 12. Cambridge, MA: MIT Press. (2000), p. 652–8.
53. Tipping ME. Sparse bayesian learning and the relevance vector machine. J Mach Learn Res. (2001) 1:211–44. doi: 10.1162/15324430152748236
54. Manjon JV, Carbonell-Caballero J, Lull JJ, Garcia-Marti G, Marti-Bonmati L, Robles M. MRI denoising using non-local means. Med Image Anal. (2008) 12:514–23. doi: 10.1016/j.media.2008.02.004
55. Ashburner J. A fast diffeomorphic image registration algorithm. Neuroimage. (2007) 38:95–113. doi: 10.1016/j.neuroimage.2007.07.007
56. Gaser C, Schmidt S, Metzler M, Herrmann KH, Krumbein I, Reichenbach JR, et al. Deformation-based brain morphometry in rats. Neuroimage. (2012) 63:47–53. doi: 10.1016/j.neuroimage.2012.06.066
57. Evans AC, Brain Development Cooperative G. The NIH MRI study of normal brain development. Neuroimage. (2006) 30:184–202. doi: 10.1016/j.neuroimage.2005.09.068
58. Dosenbach NU, Nardos B, Cohen AL, Fair DA, Power JD, Church JA, et al. Prediction of individual brain maturity using fMRI. Science. (2010) 329:1358–61. doi: 10.1126/science.1194144
59. Brown TT, Kuperman JM, Chung Y, Erhart M, Mccabe C, Hagler DJ, et al. Neuroanatomical assessment of biological maturity. Curr Biol. (2012) 22:1693–8. doi: 10.1016/j.cub.2012.07.002
60. Wang J, Li W, Miao W, Dai D, Hua J, He H. Age estimation using cortical surface pattern combining thickness with curvatures. Med Biol Eng Comput. (2014) 52:331–41. doi: 10.1007/s11517-013-1131-9
61. Cao B, Mwangi B, Hasan KM, Selvaraj S, Zeni CP, Zunta-Soares GB, et al. Development and validation of a brain maturation index using longitudinal neuroanatomical scans. Neuroimage. (2015) 117:311–8. doi: 10.1016/j.neuroimage.2015.05.071
62. Erus G, Battapady H, Satterthwaite TD, Hakonarson H, Gur RE, Davatzikos C, et al. Imaging patterns of brain development and their relationship to cognition. Cereb Cortex. (2015) 25:1676–84. doi: 10.1093/cercor/bht425
63. Khundrakpam BS, Tohka J, Evans AC, Brain Development Cooperative G. Prediction of brain maturity based on cortical thickness at different spatial resolutions. Neuroimage. (2015) 111:350–9. doi: 10.1016/j.neuroimage.2015.02.046
64. Neeb H, Zilles K, Shah NJ. Fully-automated detection of cerebral water content changes: study of age- and gender-related H2O patterns with quantitative MRI. Neuroimage. (2006) 29:910–22. doi: 10.1016/j.neuroimage.2005.08.062
65. Sabuncu MR, Van Leemput K. The Relevance Voxel Machine (RVoxM): a Bayesian method for image-based prediction. Med Image Comput Comput Assist Interv. (2011) 14:99–106. doi: 10.1007/978-3-642-23626-6_13
66. Wang B, Pham TD. MRI-based age prediction using hidden Markov models. J Neurosci Methods. (2011) 199:140–5. doi: 10.1016/j.jneumeth.2011.04.022
67. Groves AR, Smith SM, Fjell AM, Tamnes CK, Walhovd KB, Douaud G, et al. Benefits of multi-modal fusion analysis on a large-scale dataset: life-span patterns of inter-subject variability in cortical morphometry and white matter microstructure. Neuroimage. (2012) 63:365–80. doi: 10.1016/j.neuroimage.2012.06.038
68. Sabuncu MR, Van Leemput K, Alzheimer's Disease Neuroimaging I. The relevance voxel machine (RVoxM): a self-tuning Bayesian model for informative image-based prediction. IEEE Trans Med Imaging. (2012) 31:2290–306. doi: 10.1109/TMI.2012.2216543
69. Kandel BM, Wolk DA, Gee JC, Avants B. Predicting cognitive data from medical images using sparse linear regression. Inf Process Med Imaging. (2013) 23:86–97. doi: 10.1007/978-3-642-38868-2_8
70. Konukoglu E, Glocker B, Zikic D, Criminisi A. Neighbourhood approximation using randomized forests. Med Image Anal. (2013) 17:790–804. doi: 10.1016/j.media.2013.04.013
71. Mwangi B, Hasan KM, Soares JC. Prediction of individual subject's age across the human lifespan using diffusion tensor imaging: a machine learning approach. Neuroimage. (2013) 75:58–67. doi: 10.1016/j.neuroimage.2013.02.055
72. Han CE, Peraza LR, Taylor JP, Kaiser M. Predicting age across human lifespan based on structural connectivity from diffusion tensor imaging. In: IEEE Biomedical Circuits and Systems Conference (BioCAS) Proceedings (Lausanne) (2014).
73. Colec JH, Leech R, Sharp DJ, Alzheimer's Disease Neuroimaging I. Prediction of brain age suggests accelerated atrophy after traumatic brain injury. Ann Neurol. (2015) 77:571–81. doi: 10.1002/ana.24367
74. Cherubini A, Caligiuri ME, Peran P, Sabatini U, Cosentino C, Amato F. Importance of multimodal MRI in characterizing brain tissue and its potential application for individual age prediction. IEEE J Biomed Health Inform. (2016) 20:1232–9. doi: 10.1109/JBHI.2016.2559938
75. Lin L, Jin C, Fu Z, Zhang B, Bin G, Wu S. Predicting healthy older adult's brain age based on structural connectivity networks using artificial neural networks. Comput Methods Programs Biomed. (2016) 125:8–17. doi: 10.1016/j.cmpb.2015.11.012
76. Schnack HG, Van Haren NE, Nieuwenhuis M, Hulshoff Pol HE, Cahn W, Kahn RS. Accelerated brain aging in schizophrenia: a longitudinal pattern recognition study. Am J Psychiatr. (2016) 173:607–16. doi: 10.1176/appi.ajp.2015.15070922
77. Steffener J, Habeck C, O'shea D, Razlighi Q, Bherer L, Stern Y. Differences between chronological and brain age are related to education and self-reported physical activity. Neurobiol Aging. (2016) 40:138–44. doi: 10.1016/j.neurobiolaging.2016.01.014
78. Tian L, Ma L, Wang L. Alterations of functional connectivities from early to middle adulthood: clues from multivariate pattern analysis of resting-state fMRI data. Neuroimage. (2016) 129:389–400. doi: 10.1016/j.neuroimage.2016.01.039
79. Liem F, Varoquaux G, Kynast J, Beyer F, Kharabian Masouleh S, Huntenburg JM, et al. Predicting brain-age from multimodal imaging data captures cognitive impairment. Neuroimage. (2017) 148:179–88. doi: 10.1016/j.neuroimage.2016.11.005
80. Jones DK, Cercignani M. Twenty-five pitfalls in the analysis of diffusion MRI data. NMR Biomed. (2010) 23:803–20. doi: 10.1002/nbm.1543
81. Tournier JD, Mori S, Leemans A. Diffusion tensor imaging and beyond. Magn Reson Med. (2011) 65:1532–56. doi: 10.1002/mrm.22924
82. Jones DK, Knosche TR, Turner R. White matter integrity, fiber count, and other fallacies: the do's and don'ts of diffusion MRI. Neuroimage. (2013) 73:239–54. doi: 10.1016/j.neuroimage.2012.06.081
83. Van Hecke W, Emsell L, Sunaert S. Diffusion Tensor Imaging: a Practical Handbook. New York, NY: Springer (2015).
84. Luders E, Gingnell M, Poromaa IS, Engman J, Kurth F, Gaser C. Potential brain age reversal after pregnancy: younger brains at 4-6 weeks postpartum. Neuroscience. (2018) 386:309–14. doi: 10.1016/j.neuroscience.2018.07.006
85. Franke K, Gaser C, Roseboom TJ, Schwab M, De Rooij SR. Premature brain aging in humans exposed to maternal nutrient restriction during early gestation. Neuroimage. (2018) 173:460–71. doi: 10.1016/j.neuroimage.2017.10.047
86. Sprott RL. Biomarkers of aging and disease: introduction and definitions. Exp Gerontol. (2010) 45:2–4. doi: 10.1016/j.exger.2009.07.008
87. Cunningham JM, Johnson RA, Litzelman K, Skinner HG, Seo S, Engelman CD, et al. Telomere length varies by DNA extraction method: implications for epidemiologic research. Cancer Epidemiol Biomarkers Prev. (2013) 22:2047–54. doi: 10.1158/1055-9965.EPI-13-0409
88. Sanders JL, Newman AB. Telomere length in epidemiology: a biomarker of aging, age-related disease, both, or neither? Epidemiol Rev. (2013) 35:112–31. doi: 10.1093/epirev/mxs008
89. Martin-Ruiz CM, Baird D, Roger L, Boukamp P, Krunic D, Cawthon R, et al. Reproducibility of telomere length assessment: an international collaborative study. Int J Epidemiol. (2015) 44:1673–83. doi: 10.1093/ije/dyu191
90. Puvill T, Lindenberg J, De Craen AJ, Slaets JP, Westendorp RG. Impact of physical and mental health on life satisfaction in old age: a population based observational study. BMC Geriatr. (2016) 16:194. doi: 10.1186/s12877-016-0365-4
91. Raz N, Rodrigue KM. Differential aging of the brain: patterns, cognitive correlates and modifiers. Neurosci Biobehav Rev. (2006) 30:730–48. doi: 10.1016/j.neubiorev.2006.07.001
92. Terribilli D, Schaufelberger MS, Duran FL, Zanetti MV, Curiati PK, Menezes PR, et al. Age-related gray matter volume changes in the brain during non-elderly adulthood. Neurobiol Aging. (2011) 32:354–68. doi: 10.1016/j.neurobiolaging.2009.02.008
93. Ziegler G, Ridgway GR, Dahnke R, Gaser C, Alzheimer's Disease Neuroimaging I. Individualized Gaussian process-based prediction and detection of local and global gray matter abnormalities in elderly subjects. Neuroimage. (2014) 97:333–48. doi: 10.1016/j.neuroimage.2014.04.018
94. Koutsouleris N, Davatzikos C, Borgwardt S, Gaser C, Bottlender R, Frodl T, et al. Accelerated brain aging in schizophrenia and beyond: a neuroanatomical marker of psychiatric disorders. Schizophr Bull. (2014) 40:1140–53. doi: 10.1093/schbul/sbt142
95. Cole JH, Underwood J, Caan MW, De Francesco D, Van Zoest RA, Leech R, et al. Increased brain-predicted aging in treated HIV disease. Neurology. (2017) 88:1349–57. doi: 10.1212/WNL.0000000000003790
96. Cruz-Almeida Y, Fillingim RB, Riley JL III, Woods AJ, Porges E, et al. Chronic pain is associated with a brain aging biomarker in community-dwelling older adults. Pain. (2019) 160:1119–30. doi: 10.1097/j.pain.0000000000001491
97. Cole JH, Ritchie SJ, Bastin ME, Valdes Hernandez MC, Munoz Maniega S, Royle N, et al. Brain age predicts mortality. Mol Psychiatr. (2018) 23:1385–92. doi: 10.1038/mp.2017.62
98. Habes M, Janowitz D, Erus G, Toledo JB, Resnick SM, Doshi J, et al. Advanced brain aging: relationship with epidemiologic and genetic risk factors, and overlap with Alzheimer disease atrophy patterns. Transl Psychiatr. (2016) 6:e775. doi: 10.1038/tp.2016.39
99. Bublak P, Redel P, Sorg C, Kurz A, Forstl H, Muller HJ, et al. Staged decline of visual processing capacity in mild cognitive impairment and Alzheimer's disease. Neurobiol Aging. (2011) 32:1219–30. doi: 10.1016/j.neurobiolaging.2009.07.012
100. Mcavinue LP, Habekost T, Johnson KA, Kyllingsbaek S, Vangkilde S, Bundesen C, et al. Sustained attention, attentional selectivity, and attentional capacity across the lifespan. Atten Percept Psychophys. (2012) 74:1570–82. doi: 10.3758/s13414-012-0352-6
101. Habekost T, Vogel A, Rostrup E, Bundesen C, Kyllingsbaek S, Garde E, et al. Visual processing speed in old age. Scand J Psychol. (2013) 54:89–94. doi: 10.1111/sjop.12008
102. Espeseth T, Vangkilde SA, Petersen A, Dyrholm M, Westlye LT. TVA-based assessment of attentional capacities-associations with age and indices of brain white matter microstructure. Front Psychol. (2014) 5:1177. doi: 10.3389/fpsyg.2014.01177
Keywords: brain age estimation, biomarker, intervention, metabolic health, MRI, neurodegeneration, neurodevelopment, psychiatric disorders
Citation: Franke K and Gaser C (2019) Ten Years of BrainAGE as a Neuroimaging Biomarker of Brain Aging: What Insights Have We Gained? Front. Neurol. 10:789. doi: 10.3389/fneur.2019.00789
Received: 13 February 2019; Accepted: 09 July 2019;
Published: 14 August 2019.
Edited by:
Brad Manor, Institute for Aging Research, United StatesReviewed by:
Martin Gorges, University of Ulm, GermanyYenisel Cruz-Almeida, University of Florida, United States
Copyright © 2019 Franke and Gaser. This is an open-access article distributed under the terms of the Creative Commons Attribution License (CC BY). The use, distribution or reproduction in other forums is permitted, provided the original author(s) and the copyright owner(s) are credited and that the original publication in this journal is cited, in accordance with accepted academic practice. No use, distribution or reproduction is permitted which does not comply with these terms.
*Correspondence: Katja Franke, katja.franke@uni-jena.de; Christian Gaser, christian.gaser@uni-jena.de