 Nasim Sheikh-Bahaei
 Jay Acharya
 Anandh Rajamohan
 Paul E. Kim
- Division of Neuroradiology, Department of Radiology, Keck School of Medicine, University of Southern California, Los Angeles, CA, United States
Diagnosis of Posterior Reversible Encephalopathy Syndrome (PRES) in some circumstances can be challenging and structural imaging may not be sufficient to distinguish it from other differential diagnostic considerations. Advanced imaging techniques, such as MR spectroscopy or positron emission tomography (PET) can provide additional information to determine the diagnosis. Other techniques, such as susceptibility weighted imaging (SWI) improves detection of hemorrhage which has prognostic role. CT or MR Perfusion as well as Single-Photon Emission Computed Tomography (SPECT) are more useful to understand the underlying vasculopathic changes in PRES and may answer some of the unresolved controversies in pathophysiology of this complex disease. In this review we summarized the findings of previous studies using these advanced methods and their utilities in diagnosis or prognosis of PRES.
Introduction
Despite all the new developments in the field of neuroimaging, diagnosis of PRES in atypical cases remains challenging. Utilizing advanced imaging techniques can help clinicians to exclude the mimics and provide a more accurate diagnosis at the earlier stage. Some of these methods can also provide insight into the complex pathophysiology of the disease. In this article we discuss the role and findings of these advanced imaging techniques in diagnosis of PRES.
MR Spectroscopy
MR spectroscopy (MRS) provides valuable information about the brain chemicals and metabolites, neuronal and glial cells activity, cell membrane integrity and composition of the cells in the region of interest. This data can be used to differentiate PRES from other diagnoses (1), predict outcome (2), or potentially enhance our understanding about the pathophysiology of the disease (3). There is lack of large comprehensive studies on MRS changes in PRES and the current data are mainly from case reports.
The main findings in most of the cases are reduction in the ratio of N-Acetylaspartate (NAA)/Creatine (Cr) (Figure 1) and NAA/Choline (Chol) (1–6). It has been claimed that this reduction is more due to increased Chol and Cr levels rather than a mild reduction in NAA. These alterations in the level of metabolites were seen beyond the boundary of T2/FLAIR signal changes and both in white and gray matters indicating the diffuse process in PRES (3). More interestingly, in some studies the level of NAA remained low and Chol high in the subacute phase of the disease (from 2 weeks to 2 months) despite normalization of the structural MRI and resolution of the clinical symptoms (1, 2, 4).
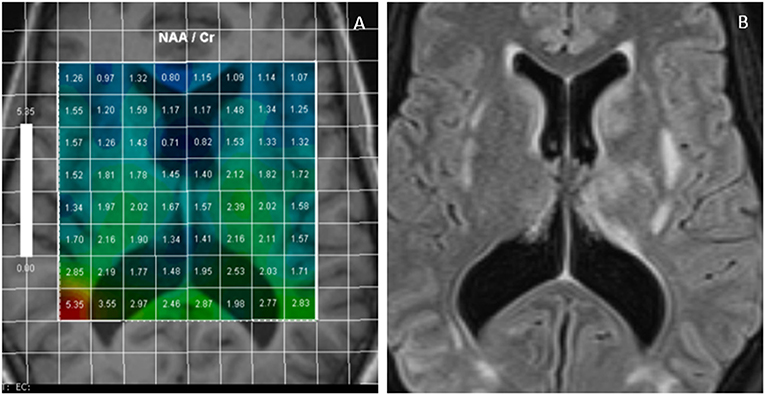
Figure 1. Multivoxel MR Spectroscopy in a PRES case shows reduced NAA/Cr in many regions such as periventricular white matter and around basal ganglia (A); FLAIR images of the same case demonstrates foci of white matter hyperintensities (B).
NAA is an amino acid that is mainly synthesized in the mitochondria of the neurons, axons, and dendrites. It is considered a marker of neuroaxonal viability, function, and density. Its reduction in PRES is more likely secondary to disruption of the synapses and neuroaxonal function rather than permanent loss of neurons or cell death as the changes are usually reversible with no evidence of atrophy at the later stage. Presence of vasogenic edema could also contribute to the mild reduction of NAA through dilution effect (3) with reduction of the density of neurons in each MRS voxel.
Chol is a marker of cell membrane turnover, inflammation, glial cell activation and demyelination. In PRES, increased in Chol peak is considered to be related to glial cell activation and also membrane synthesis in the subacute phase of the disease (1, 3).
There are contradictory results about the level of lactate (Lac) in PRES between different studies, as some detected increased peak of lac (2, 4) while others did not (1, 3). Know et al. presented four pediatrics cases with PRES and showed no changes in the level of NAA, Chol and Cr, but increased in Lac. Nearly all of them had complete remission in the follow up MRS exams (7). In adults and based on limited data, the peak of Lac is considered as a marker of tissue infarction rather than changes directly related to PRES (2).
Initial changes in the level of NAA, Chol, and Cr or even persistent changes in the subacute phase of PRES does not predict poor outcome but can be used to differentiate PRES from other mimicking pathologies, such as infarct, demyelination, encephalitis or tumor (8). Presence of Lac is in favor of infarct or other pathologies and could indicate permanent tissue damage. Increased ratio Chol/Cr is more favorable for tumor compared to PRES in which both Chol and Cr levels increase. Metabolic changes in demyelinating processes are usually restricted to white matter unlike PRES which are present in both gray and white matter (3).
Susceptibility Weighted Imaging (SWI)
Hemorrhage is identified in 15–17% of PRES cases in large cohorts using Gradient echo (GRE), FLAIR or CT (9). However, recent studies have reported higher prevalence of hemorrhage (26–64%) in PRES using SWI (10, 11). There are three main types of hemorrhage in PRES: cerebral microbleeds (CMB, <5 mm), intraparenchymal hematoma (IPH, >5 mm) and subarachnoid hemorrhage (SAH) with or without intraventricular extension. CMB has become the most common type of hemorrhage identified in recent PRES studies due to superiority of SWI in detecting CMB. This may also explain the higher prevalence of total hemorrhage in the recent data (9, 10). CMB can hardly be seen in other sequences, such as FLAIR, T1, and T2. Moreover, there are several reports confirming the advantage of SWI compared to GRE or T2* sequences in identifying CMB or small hemorrhages (12, 13).
Many studies have claimed that evidence of hemorrhage in imaging is associated with poor prognosis or fatal outcome (9, 11), while others did not show the same association (10). Hemorrhage is also associated with more severe T2/FLAIR signal changes and presence of cytotoxic edema and restriction in diffusion-weighted images (DWI) (14). Although the direct effect of CMB on prognosis of PRES is not completely understood, follow up studies (between 4 and 320 days) have shown that CMBs secondary to PRES remained unchanged even after normalization of the FLAIR signal (10), which could have long term implications.
Moreover, there are reports of PRES development secondary to cerebral amyloid angiopathy inflammation (CAA-I) (15). Presence of multiple CMBs on SWI, particularly if they were present prior to the latest onset of PRES, can suggest CAA-I as the cause of attack.
Susceptibility weighted angiography (SWAN) has also been used in PRES showing transient reduction in the susceptibility of the venous system at the initial phase of PRES, associated with hyperperfusion which was normalized by day 40 (16).
Based on current data, performing SWI will provide additional valuable information, which can be used to predict the outcome of PRES. However, longitudinal data are required to investigate the effects of CMB secondary to PRES in long term prognosis and their potential predisposition to other neurological disorders, such as hemorrhagic stroke or Alzheimer's disease in the future.
CT and MR Perfusion
The results of CT perfusion studies in PRES are contradictory. Some studies have found hyperperfusion with increased cerebral blood flow (CBF), cerebral blood volume (CBV) and reduction in time to peak (TTP) and mean transit time (MTT) (17–19) (Figure 2). Other studies showed opposite results with vasoconstriction, reduction in CBF, near normal CBV, and increased in TTP, MTT, and time to drain (TTD) (20–22).
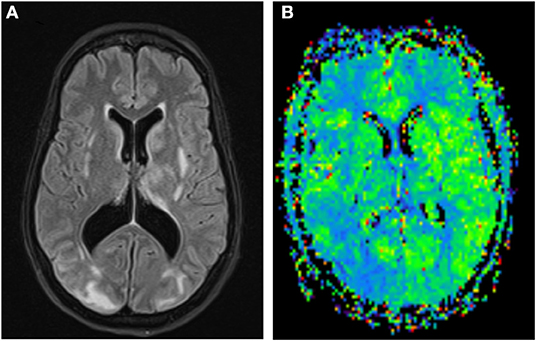
Figure 2. FLAIR images of a PRES case with white matter hyperintensities more prominent in the right occipital lobe (A); MR Perfusion shows reduction in MTT in the right occipital lobe suggestive of hyperperfusion (B).
The reports on MR perfusion follow the same pattern with conflicting results across different studies. Although many authors reported decreased CBF, CBV, and increased MTT (23–25), there are few reports of increased perfusion in PRES cases (26–28).
There are two main theories regarding the development of vasculopathy and vasogenic edema in PRES:
(1) Severe hypertension exceeds the limit of autoregulation in vessels, leading to hyperperfusion, vascular dilatation, endothelial damage, leakage, and vasogenic edema.
(2) The earlier original theory which was based on vasospasm and hypoperfusion as a compensatory mechanism against hypertension resulting in brain ischemia and consequently vasogenic edema (29).
Collective data in recent years however, might be more suggestive of a combination pathway with vasoconstriction and vasodilatation changes both present at the same time or sequential in the course of the disease. When the systemic blood pressure rises, the neurovasculature system attempts to maintain a constant flow by autoregulation, and arterioles constrict to create compensatory resistance and avoid hyperperfusion (30, 31). It has been shown in animal models that when the blood pressure exceeds the upper limit of autoregulation, the constricted arterioles forced to dilate and there is blood brain barrier disruption and extravasation of the fluid and red blood cells into the parenchyma (32). In addition, there is evidence of endothelial injury in the small vessels leading to endothelial thickening, occlusion of the small vessels, microbleeds, and hypoperfusion.
Although the abovementioned mechanisms can explain the underlying pathophysiology of vasculopathy in hypertension induced PRES, they cannot be generalized to all PRES cases as many of them present with normal or near normal blood pressure. A growing body of evidence suggests in clinical conditions presenting with PRES, there are similar systemic processes contributing to vasculopathy including activation of immune system, increased in cytokines and interleukins, endothelial damage with increased permeability, increased leukocyte adherence, and consequently microcirculatory dysfunction, focal vasoconstriction and vasodilatation and beading of the vessels and consequently tissue damage (21, 29).
The conflicting results in perfusion studies more likely reflect the complex pathophysiology of PRES and dynamic vascular changes during the course of the disease. The initial cause of PRES might also play a role. The time of imaging in relation to the onset of symptoms and also the start of antihypertensive therapy and intensity of treatment could significantly affect the result of perfusion studies. In a report by Casey et al., they found transient hypoperfusion in a PRES case treated aggressively with antihypertensive drugs. The hypo-perfused regions returned to normal after reducing the intensity of treatment and keeping the blood pressure above a certain level (30).
Although perfusion studies may not help the diagnosis or prognosis of PRES in day to day clinical practice, they can be used for better understanding of the pathophysiology of this complex and heterogeneous condition. Further larger studies with standard techniques on more homogenous cohort are required in acute, subacute and later phases of PRES to advance our knowledge about the patterns of vasculopathy and changes of perfusion in PRES.
Single-Photon Emission Computed Tomography (SPECT) and Positron Emission Tomography (PET)
The most common type of SPECT used in PRES is Technetium-99 m-hexamethylpropyleneamineoxime (99 mTc-HMPAO). The results of SPECT in PRES are very similar to CT and MR perfusions with conflicting reports of hypo or hyperperfusion. Some studies found hypoperfusion in watershed areas and in regions of vasogenic edema on MRI (33, 34), while other reported hyperperfusion in T2 FLAIR hyperintense regions (26–28). There are also reports of using single-photon emission CT with N-isopropyl-(123)I-p-iodoamphetamine (IMP-SPECT) during recovery stages of PRES, showing normal uptake in most cases when MRI became normal (35, 36). Although hypoperfusion in IMP-SPECT at early follow up (11 days) (34) or focal hyperperfusion in a case with persistent MRI changes after 30 days (36) were also reported. (133)Xe-SPECT has also been used to assess perfusion in PRES and showed low uptake in areas of vasogenic edema (36).
Data is limited on the utility of PET in PRES. In most of studies, the whole body PET was performed for diagnosis of the underlying cancer or to detect metastases.
The first report of using (18 F) fluorodeoxyglucose (FDG)-PET in PRES was on a young boy with systemic lupus erythematosus. They found hypometabolism in occipital-parietal region where T2 hyperintensity and hemorrhage were present (37). Rath et al. used FDG and (11 C) methionine (MET)-PET to differentiate atypical unilateral PRES from low-grade tumor, showed decreased uptake of FDG and minimal uptake of MET in the regions of MRI abnormality in PRES (38). Brain Gliomas on the other hand have high MET uptake due to increased metabolic rate and their uptake ratio is associated with the tumor viability (39). Although many studies have found hypometabolism in FDG, there is a report of increased FDG uptake in the regions of T2 FLAIR hyperintensities in a pediatric patient with Burkitt's lymphoma presented with PRES (40).
FDG-PET uptake usually has close association with the MRI changes, it becomes normal at the later stage of PRES when the FLAIR signal normalizes (41) but remains low with persistent MRI changes in more severe cases (42).
(11 C) Pittsburgh compound (PiB) and (18 F) FDG-PET were also used on a PRES case secondary to CAA-I. High amyloid uptake in PiB and focal hypometabolism in FDG was found in the regions of FLAIR/T2 hyperintensity (43).
Based on limited data available, utility of PET in PRES is mainly to distinguish it from tumor. Low FDG and MET uptake can differentiate the two that is particularly useful in cases with unilateral or marked asymmetric changes mimicking mass in the structural imaging.
Discussion
When the clinical presentation of the PRES is unusual or there are atypical changes in the structural imaging, advanced imaging techniques can help in distinguishing PRES from mimics. Table 1 summarizes the imaging features of PRES in different advanced imaging techniques.
- MRS can help differentiating PRES from low grade tumor, demyelination or other encephalitis.
- SWI is the best sequence to detect CMB and can significantly improve the rate of hemorrhage detection. The knowledge about load and number of persistent CMB after the onset of PRES would provide valuable information, which may have potential long-term implication.
- There are contradictory results about perfusion changes in PRES. These studies can be used for better understanding the disease pathophysiology rather than diagnosis of PRES. The conflicting results are most likely secondary to dynamic vascular changes during the course of the disease, complex pathophysiology with variations across different underlying causes, timing of the perfusion studies, and the use of antihypertensive treatments. To address these issues there is a need for larger cohort studies using more standard methods, alleviating some of the co-founding factors.
- MET and FDG PET can also be used to differentiate PRES from low grade glioma.
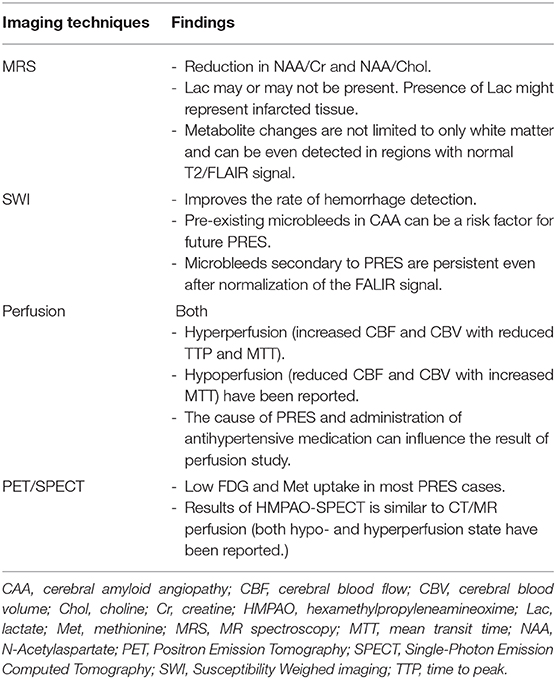
Table 1. Summary of imaging features using different advanced imaging techniques in PRES.
Author Contributions
All authors listed have made a substantial, direct and intellectual contribution to the work, and approved it for publication.
Conflict of Interest
The authors declare that the research was conducted in the absence of any commercial or financial relationships that could be construed as a potential conflict of interest.
References
1. Lee SY, Kim SH, Lee SH, Baek HJ, Shon HS, Kim SS. Serial MR spectroscopy in relapsing reversible posterior leukoencephalopathy syndrome. Neurologist. (2009) 15:338–41. doi: 10.1097/NRL.0b013e3181914af6
2. Sengar AR, Gupta RK, Dhanuka AK, Roy R, Das K. MR imaging, MR angiography, and MR spectroscopy of the brain in eclampsia. AJNR Am J Neuroradiol. (1997) 18:1485–90.
3. Eichler FS, Wang P, Wityk RJ, Beauchamp NJ Jr, Barker PB. Diffuse metabolic abnormalities in reversible posterior leukoencephalopathy syndrome. AJNR Am J Neuroradiol. (2002) 23:833–7. Retrieved from: http://www.ajnr.org/content/23/5/833/tab-article-info
4. Ewertsen C, Kondziella D, Danielsen ER, Thomsen C. Good outcome after posterior reversible encephalopathy syndrome (PRES) despite elevated cerebral lactate: a case report. Acta Radiol Open. (2015) 4:2058460115578324. doi: 10.1177/2058460115578324
5. Yuan JL, Wang SK, Guo XJ, Ding LL, Gu H, Hu WL. Reduction of NAA/Cr ratio in a patient with reversible posterior leukoencephalopathy syndrome using MR spectroscopy. Arch Med Sci Atheroscler Dis. (2016). 1:98–100. doi: 10.5114/amsad.2016.62376
6. Ferreira TS, Reis F, Appenzeller S. Posterior reversible encephalopathy syndrome and association with systemic lupus erythematosus. Lupus. (2016) 25:1369–76. doi: 10.1177/0961203316643598
7. Kwon S, Koo J, Lee S. Clinical spectrum of reversible posterior leukoencephalopathy syndrome. Pediatr Neurol. (2001) 24:361–4. doi: 10.1016/S0887-8994(01)00265-X
8. Tsutsumi M, Akimoto J, Nakajima N, Hashimoto R, Haraoka J. Two cases of posterior reversible encephalopathy syndrome resembling brainstem glioma. Clin Neurol Neurosurg. (2012) 114:1062–5. doi: 10.1016/j.clineuro.2012.02.027
9. Hefzy HM, Bartynski WS, Boardman JF, Lacomis D. Hemorrhage in posterior reversible encephalopathy syndrome: imaging and clinical features. AJNR Am J Neuroradiol. (2009) 30:1371–9. doi: 10.3174/ajnr.A1588
10. McKinney AM, Sarikaya B, Gustafson C, Truwit CL. Detection of microhemorrhage in posterior reversible encephalopathy syndrome using susceptibility-weighted imaging. AJNR Am J Neuroradiol. (2012) 33:896–903. doi: 10.3174/ajnr.A2886
11. Alhilali LM, Reynolds AR, Fakhran S. A multi-disciplinary model of risk factors for fatal outcome in posterior reversible encephalopathy syndrome. J Neurol Sci. (2014) 347:59–65. doi: 10.1016/j.jns.2014.09.019
12. Goos JD, van der Flier WM, Knol DL, Pouwels PJ, Scheltens P, Barkhof F, et al. Clinical relevance of improved microbleed detection by susceptibility-weighted magnetic resonance imaging. Stroke. (2011) 42:1894–900. doi: 10.1161/STROKEAHA.110.599837
13. Cheng AL, Batool S, McCreary CR, Lauzon ML, Frayne R, Goyal M, et al. Susceptibility-weighted imaging is more reliable than T2*-weighted gradient-recalled echo MRI for detecting microbleeds. Stroke. (2013) 44:2782–6. doi: 10.1161/STROKEAHA.113.002267
14. Hiremath SB, Anantrao Gautam A, Anil S, Thomas R, Benjamin G. Susceptibility-weighted angiography and diffusion-weighted imaging in posterior reversible encephalopathy syndrome–is there an association between hemorrhage, cytotoxic edema, blood pressure and imaging severity? J Neuroradiol. (2017) 44:319–25. doi: 10.1016/j.neurad.2017.05.002
15. Masrori P, Montagna M, De Smet E, Loos C. Posterior reversible encephalopathy syndrome caused by cerebral amyloid angiopathy-related inflammation. Acta Neurol Belg. (2019) 119:505–7. doi: 10.1007/s13760-019-01172-w
16. Ollivier M, Wanono E, Leclercq D, Domont F, Trunet S, Dormont D, et al. Transient reduction in venous susceptibility during posterior reversible encephalopathy syndrome. J Neurol Sci. (2015) 358:505–6. doi: 10.1016/j.jns.2015.09.359
17. Wartenberg KE, Parra A. CT and CT-perfusion findings of reversible leukoencephalopathy during triple-H therapy for symptomatic subarachnoid hemorrhage-related vasospasm. J Neuroimaging. (2006) 16:170–5. doi: 10.1111/j.1552-6569.2006.00031.x
18. Hedna VS, Stead LG, Bidari S, Patel A, Gottipati A, Favilla CG, et al., Posterior reversible encephalopathy syndrome (PRES) and CT perfusion changes. Int J Emerg Med. (2012) 5:12. doi: 10.1186/1865-1380-5-12
19. Oehm E, Hetzel A, Els T, Berlis A, Keck C, Will HG, et al. Cerebral hemodynamics and autoregulation in reversible posterior leukoencephalopathy syndrome caused by pre-/eclampsia. Cerebrovasc Dis. (2006) 22:204–8. doi: 10.1159/000093810
20. Vanacker P, Matias G, Hagmann P, Michel P. Cerebral hypoperfusion in posterior reversible encephalopathy syndrome is different from transient ischemic attack on CT perfusion. J Neuroimaging. (2015) 25:643–6. doi: 10.1111/jon.12158
21. Sarbu N, López-Rueda A, Chirife O, Capurro S. CT-perfusion time-maps likely disclose the earliest imaging signs of posterior reversible encephalopathy syndrome (PRES). J Neuroradiol. (2014) 41:147–9. doi: 10.1016/j.neurad.2013.08.003
22. Sanelli PC, Jacobs MA, Ougorets I, Mifsud MJ. Posterior reversible encephalopathy syndrome on computed tomography perfusion in a patient on “Triple H” therapy. Neurocrit Care. (2005) 3:46–50. doi: 10.1385/NCC:3:1:046
23. Bartynski WS, Boardman JF. Catheter angiography, MR angiography, and MR perfusion in posterior reversible encephalopathy syndrome. AJNR Am J Neuroradiol. (2008) 29:447–55. doi: 10.3174/ajnr.A0839
24. Brubaker LM, Smith JK, Lee YZ, Lin W, Castillo M. Hemodynamic and permeability changes in posterior reversible encephalopathy syndrome measured by dynamic susceptibility perfusion-weighted MR imaging. AJNR Am J Neuroradiol. (2005) 26:825–30. Retrieved from: http://www.ajnr.org/content/26/4/825/tab-article-info
25. Engelter ST, Petrella JR, Alberts MJ, Provenzale JM. Assessment of cerebral microcirculation in a patient with hypertensive encephalopathy using MR perfusion imaging. AJR Am J Roentgenol. (1999) 173:1491–3. doi: 10.2214/ajr.173.6.10584788
26. Apollon KM, Robinson JN, Schwartz RB, Norwitz ER. Cortical blindness in severe preeclampsia: computed tomography, magnetic resonance imaging, and single-photon-emission computed tomography findings. Obstet Gynecol. (2000). 95:1017–9. doi: 10.1016/S0029-7844(00)00878-4
27. Schwartz RB, Jones KM, Kalina P, Bajakian RL, Mantello MT, Garada B, et al. Hypertensive encephalopathy: findings on CT, MR imaging, and SPECT imaging in 14 cases. AJR Am J Roentgenol. (1992) 159:379–83. doi: 10.2214/ajr.159.2.1632361
28. Schwartz RB. Hyperperfusion encephalopathies: hypertensive encephalopathy and related conditions. Neurologist. (2002) 8:22–34. doi: 10.1097/00127893-200201000-00003
29. Bartynski WS. Posterior reversible encephalopathy syndrome, part 2: controversies surrounding pathophysiology of vasogenic edema. AJNR Am J Neuroradiol. (2008) 29:1043–9. doi: 10.3174/ajnr.A0929
30. Casey SO, McKinney A, Teksam M, Liu H, Truwit CL. CT perfusion imaging in the management of posterior reversible encephalopathy. Neuroradiology. (2004) 46:272–6. doi: 10.1007/s00234-003-1053-6
31. Auer L. The sausage-string phenomenon in acutely induced hypertension–arguments against the vasospasm theory in the pathogenesis of acute hypertensive encephalopathy. Eur Neurol. (1978) 17:166–73. doi: 10.1159/000114941
32. MacKenzie ET, Strandgaard S, Graham DI, Jones JV, Harper AM, Farrar JK. Effects of acutely induced hypertension in cats on pial arteriolar caliber, local cerebral blood flow, and the blood-brain barrier. Circ Res. (1976) 39:33–41. doi: 10.1161/01.RES.39.1.33
33. Naidu K, Moodley J, Corr P, Hoffmann M. Single photon emission and cerebral computerised tomographic scan and transcranial doppler sonographic findings in eclampsia. Br J Obstet Gynaecol. (1997) 104:1165–72. doi: 10.1111/j.1471-0528.1997.tb10941.x
34. Fujiwara Y, Higaki H, Yamada T, Nakata Y, Kato S, Yamamoto H, et al. Two cases of reversible posterior leukoencephalopathy syndrome, one with and the other without pre-eclampsia. J Obstet Gynaecol Res. (2005) 31:520–6. doi: 10.1111/j.1447-0756.2005.00345.x
35. Mima A, Matsubara T, Endo S, Murakami T, Hashimoto Y. Use of a polysulfone hemodialysis membrane may prevent recurrent posterior reversible encephalopathy syndrome in a patient undergoing hemodialysis. Int Urol Nephrol. (2014) 46:255–60. doi: 10.1007/s11255-013-0434-y
36. Tajima Y, Isonishi K, Kashiwaba T, Tashiro K. Two similar cases of encephalopathy, possibly a reversible posterior leukoencephalopathy syndrome: serial findings of magnetic resonance imaging, SPECT and angiography. Intern Med. (1999) 38:54–8. doi: 10.2169/internalmedicine.38.54
37. Pavlakis SG, Frank Y, Kalina P, Chandra M, Lu D. Occipital-parietal encephalopathy: a new name for an old syndrome. Pediatr Neurol. (1997) 16:145–8. doi: 10.1016/S0887-8994(96)00292-5
38. Rath JJ, Koppen H, Treurniet FE, Comans EF, Wirtz PW. Reversible posterior leucoencephalopathy syndrome mimicking low-grade glioma: differentiation by positron emission tomography. Clin Neurol Neurosurg. (2011) 113:785–7. doi: 10.1016/j.clineuro.2011.08.001
39. Kato T, Shinoda J, Oka N, Miwa K, Nakayama N, Yano H, et al., Analysis of 11C-methionine uptake in low-grade gliomas and correlation with proliferative activity. AJNR Am J Neuroradiol. (2008) 29:1867–71. doi: 10.3174/ajnr.A1242
40. Saad Aldin E, McNeely P, Menda Y. Posterior reversible encephalopathy syndrome on 18F-FDG PET/CT in a pediatric patient with Burkitt's lymphoma. Clin Nucl Med. (2018) 43:195–8. doi: 10.1097/RLU.0000000000001979
41. Meyer MA, Galloway G, Khan S. Transient blindness associated with reversible occipital white matter abnormalities: two patients studied by MR, CT, and 18F-FDG PET imaging. J Neuroimaging. (1998) 8:240–2. doi: 10.1111/jon199884240
42. Hyoung Seop Kim MD, Ja Young Choi MD, Mi Ri Seo MD. Posterior Reversible Encephalopathy Syndrome (PRES) in a chronic alcoholic patient after having steam bath: a case report. Brain Neurorehabil. (2014) 7:66–70. doi: 10.12786/bn.2014.7.1.66
Keywords: MR spectroscopy (MRS), CT perfusion (CTP), positron emission tomography (PET), posterior reversible encephalopathy syndrome (PRES), MR perfusion, susceptibility weight imaging
Citation: Sheikh-Bahaei N, Acharya J, Rajamohan A and Kim PE (2020) Advanced Imaging Techniques in Diagnosis of Posterior Reversible Encephalopathy Syndrome (PRES). Front. Neurol. 11:165. doi: 10.3389/fneur.2020.00165
Received: 08 August 2019; Accepted: 21 February 2020;
Published: 11 March 2020.
Edited by:
Max Wintermark, Stanford University, United StatesReviewed by:
Ajay Gupta, Cornell University, United StatesHeng Liu, Affiliated Hospital of Zunyi Medical College, China
Copyright © 2020 Sheikh-Bahaei, Acharya, Rajamohan and Kim. This is an open-access article distributed under the terms of the Creative Commons Attribution License (CC BY). The use, distribution or reproduction in other forums is permitted, provided the original author(s) and the copyright owner(s) are credited and that the original publication in this journal is cited, in accordance with accepted academic practice. No use, distribution or reproduction is permitted which does not comply with these terms.
*Correspondence: Nasim Sheikh-Bahaei, nasim.sheikh-bahaei@med.usc.edu