 Kyle C. Kern
 Marwah S. Zagzoug1
 Clinton B. Wright
 Richard Leigh
- 1Stroke Branch, National Institute of Neurological Disorders and Stroke, National Institutes of Health, Bethesda, MD, United States
- 2Department of Neurology, Johns Hopkins Medicine, Baltimore, MD, United States
Background: The progression of FLAIR white matter hyperintensities (WMHs) on MRI heralds vascular-mediated cognitive decline. Even before FLAIR WMH progression, adjacent normal appearing white matter (NAWM) already demonstrates microstructural deterioration on diffusion tensor imaging (DTI). We hypothesized that elevated DTI free water (FW) would precede FLAIR WMH progression, implicating interstitial fluid accumulation as a key pathological step in the progression of cerebral small vessel disease.
Methods: Participants at least 3 months after an ischemic stroke or TIA with WMH on MRI underwent serial brain MRIs every 3 months over the subsequent year. For each participant, the WMHs were automatically segmented, serial MRIs were aligned, and a region of WMH penumbra tissue at risk was defined by dilating lesions at any time point and subtracting baseline lesions. Penumbra voxels were classified as either stable or progressing to WMH if they were segmented as new lesions and demonstrated increasing FLAIR intensity over time. Aligned DTI images included FW and FW-corrected fractional anisotropy (FATissue) and mean diffusivity (MDTissue). Logistic regression and area under the receiver-operator characteristic curve (AUC) were used to test whether baseline DTI predicted voxel-wise classification of stable penumbra or progression to WMH while covarying for clinical risk factors.
Results: In the included participants (n = 26, mean age 71 ± 9 years, 31% female), we detected a median annual voxel-wise WMH growth of 2.9 ± 2.6 ml. Each baseline DTI metric was associated with lesion progression in the penumbra, but FW had the greatest AUC of 0.732 (0.730 – 0.733) for predicting voxel-wise WMH progression pooled across participants.
Discussion: Baseline increased interstitial fluid, estimated as FW on DTI, predicted the progression of NAWM to WMH over the following year. These results implicate the presence of FW in the pathogenesis of cerebral small vessel disease progression.
Introduction
White matter hyperintensity (WMH) lesions detected on FLAIR MRI are a hallmark of chronic cerebrovascular disease and vascular contributions to cognitive impairment and dementia (VCID). WMHs are associated with risk for recurrent stroke, (1) cognitive decline, (2) and incident dementia (3). Progression of WMH is also associated with cognitive decline (2) and conversion to mild cognitive impairment or dementia (4). Progressive WMH accumulation implicates cerebral small vessel disease (SVD), although WMHs are also seen in other pathologies including Alzheimer's disease. The pathophysiology of WMH progression is unclear but may be due to arteriolosclerosis, subclinical ischemia, endothelial damage with blood-brain barrier (BBB) disruption, (5) vasogenic edema, (6) venous stasis or collagenosis, (7) demyelination, and axonal injury (8). Although there are no known therapies that directly affect the progression of WMH, a better understanding of the pathophysiological changes detected on imaging preceding progression could facilitate future therapeutic development.
In patients with stroke and chronic cerebrovascular disease, imaging has helped elucidate the changes leading to WMH progression. The normal appearing white matter (NAWM) immediately surrounding FLAIR WMH is termed the WMH “penumbra” and is at greatest risk for progression into overt FLAIR WMH lesions (9). Diffusion tensor imaging (DTI) can detect impaired white matter integrity even in the NAWM, characterized by reduced fractional anisotropy (FA) and increased mean diffusivity (MD) (9). DTI measures the directional diffusion of water in tissue and is more sensitive to demyelination, axonal damage, or fluid shifts than conventional MRI. In the WMH penumbra, increased MD and reduced FA can be detected, extending far past the edge of visible WMH on FLAIR (9–14). In a longitudinal cohort study of elderly volunteers over 18 months, new WMH progression occurred mostly within 3 mm of the edge of periventricular WMH, with no new WMH voxels detected past 5 mm (15). Other longitudinal studies have found that alterations in MD and FA in the WMH penumbra predict the progression of NAWM into the new WMH (10, 16, 17).
More complex DTI models can further elucidate white matter microstructure by modeling distinct tissue compartments. DTI free water (FW) imaging models the diffusion signal as having two components: a fast, freely moving (isotropic) diffusion signal that reflects a CSF-like compartment and a slower, hindered diffusion signal that reflects tissue architecture (18). Within white matter, the isolated CSF-like signal is estimated as the FW fraction. The other component of the diffusion signal modeled is the tissue tensor compartment, which can provide FW-corrected measures of WM integrity: FATissue and MDTissue. These FW-corrected measures of white matter integrity may more closely reflect the integrity of underlying white matter after removing the influence of free water and CSF partial volume effects. The estimated FW signal within white matter is also relevant to the underlying physiology since it is thought to reflect interstitial fluid. Increased DTI FW in white matter is closely associated with chronic cerebrovascular disease and VCID. FW measurements outperformed conventional imaging markers of cerebral SVD in predicting disability and processing speed in sporadic SVD and CADASIL patients (19). FW is also altered in the NAWM of the WMH penumbra, suggesting altered FW is an early precursor to WMH progression (20).
In this study of participants with prior ischemic stroke or TIA and evidence of early confluent WMH on MRI, we measured longitudinal changes in white matter FW and tested the hypothesis that increased FW is a predictor of NAWM progression to WMH remote from the infarct.
Methods
Human research protocol
This study was approved by the Ethics and Institutional Review Boards of NINDS/NIH (IRB Protocol Number: 18N0020), Suburban Hospital, Johns Hopkins Medicine, Bethesda, MD, and MedStar Washington Hospital Center, Washington, DC (Protocol Number: 2018-093) and is registered with clinicaltrials.gov (NCT03366129). All subjects provided written informed consent.
Data integrity and availability
The corresponding author oversaw the integrity of data collection and analysis. Data will be made available upon reasonable request to the corresponding author after close-out and publication of the parent study under a formal data-sharing agreement and with approval from the requesting researcher's local ethics committee. The software used is freely available for non-commercial use (Freesurfer, FSL, DIPY, QIT) or commercially available (STATA).
Study population
Patients with a history of ischemic stroke or TIA were eligible for enrollment in this observational study if a prior MRI showed evidence of chronic SVD, defined on FLAIR MRI as early confluence of WMH in regions remote from any visible infarct. Participants were excluded if they were unable to tolerate MRI, could not ambulate without assistance, could not communicate, had severe dementia as determined by a cognitive screening test, or had concurrent neurologic disease predisposing to WMH of non-cerebrovascular origin. Characteristics of the index ischemic event were derived from the medical chart and a review of available images. The etiology of the index ischemic event was classified using the TOAST classification (21). The first research MRI occurred at least 3 months after a prior stroke or TIA, and serial scans were acquired every 3 months for the following year. Due to disruptions in research surrounding the COVID-19 pandemic, some time points were missed. For participants that missed their 1-year time point, MRIs performed during the second year of the study were used to quantify WMH lesion growth. The data were acquired between September 2018 and October 2022.
MRI protocol
For each participant, brain MRIs were acquired serially on the same scanner at one of two hospital sites using a 3T Siemens Skyra or a 3T Phillips Achieva. The acquisition included a 3D T1 (resolution 1 × 1 × 1 mm), a 3D FLAIR (resolution 1 × 1 × 1 mm), an axial FLAIR (resolution ~1 × 1 × 3.5 mm), DTI (Siemens: 12 directional images with B = 1,000 s/mm2, 4 B = 0 images, resolution 1.7 × 1.7 × 3.5 mm or Phillips: 15 directions at B = 1,000 s/mm2, 1 B = 0 image, 2 × 2 × 3.5 mm), and a susceptibility-weighted image (SWI) (Siemens: 0.86 × 0.86 × 1.5 mm or Phillips: 0.57 × 0.57 × 2 mm) (see Supplementary Methods).
MRI processing
MRI data were analyzed using FreeSurfer v7.2 (freesurfer.net), (22) the FMRIB Software Library v6.0 (fsl.fmrib.ox.ac.uk), (23) DIPY 1.4 (dipy.org), (24) and the Quantitative Imaging Toolkit (cabeen.io/qitwiki) (25).
DTI processing
After correction for motion and eddy current distortions using FSL (26), a single-shell FW model was fit using DIPY (27, 28). The resulting images included the FW fraction, fractional anisotropy corrected for FW (FATissue), mean diffusivity corrected for FW (MDTissue), and a trace image calculated as the geometric mean of the diffusion-weighted images.
Alignment of longitudinal images
For each time point, 3D FLAIR images were rigidly aligned to the T1. DTI was aligned within-subject to the T1 first using rigid boundary-based registration with the trace (29) and then non-linearly using the FA. This approach provided the best anatomical alignment in the periventricular regions, where most WMH occurs. For each participant, all time point T1s were rigidly aligned to a midpoint space equidistant from all time points (to minimize longitudinal alignment bias) and averaged. For each modality, transforms to T1 and then to midpoint were combined, interpolating only once.
Infarcts, lesions, and tissue segmentation
Chronic infarcts were manually segmented on baseline 3D FLAIR and T1 with reference to acute MRI when available to exclude them from the regions of interest (ROI) used for analysis. The FLAIR hyperintense regions surrounding infarcts were also excluded from white matter and lesion masks. T1, 3D FLAIR, and axial FLAIR were used to segment WMH, white matter, gray matter, and CSF for each time point using FreeSurfer-based SAMSEG (Supplementary Methods) (22). Segmentations were visually inspected and manually corrected for accuracy and to exclude FLAIR hyperintensity associated with chronic infarcts. Lesions at any time point were combined across time, the summation mask was dilated by 3 mm, and then the baseline WMH was subtracted to create a WMH penumbra for both baseline and de novo lesions remote from chronic infarcts. The WMH penumbra is at greatest risk for WMH progression in SVD, so it provides an ideal region to study the imaging changes that precede new WMH development. A prior longitudinal analysis found that most new WMH progression occurred within 3 mm of the periventricular WMH edge, and none occurred past 5 mm over a median of 18 months (15). The remaining non-lesion, non-penumbra white matter comprised the NAWM mask that remained stable throughout the study period. Cerebral microbleeds (CMBs) and lacunes were counted on SWI and FLAIR, respectively, according to established criteria (30, 31). Chronic cortical infarcts were also identified on baseline images using FLAIR and T1 as wedge-shaped FLAIR hyperintense lesions with T1 cortical hypointensity at least 5 mm in diameter in a vascular territory.
Localizing lesion progression
FLAIR lesion progression was determined empirically by calculating voxel-wise FLAIR intensity changes over time rather than relying on image segmentation alone. To accomplish this and permit longitudinal comparisons across scan sessions, at each time point, FLAIR intensity was normalized to the mean signal intensity of the gray matter and then denoised using a non-local means filter (25). Within the WMH penumbra, the slope of FLAIR intensity change over time was calculated at each white matter voxel using linear regression. Similar to the lesion difference method employed by Schmidt et al. (32) the regression coefficient at each voxel was converted to a Z-statistic (Figure 1) using the mean and standard deviation of the regression coefficients within stable NAWM. Z-statistics were cluster-corrected using thresholds Z ≥ 2.3 and p < 0.01 based on Gaussian Random Field Theory. Regions of significant FLAIR signal change were reviewed for both increasing and decreasing intensity changes. At the border of segmented WMH and the surrounding penumbra, there were no regions that significantly decreased in FLAIR signal intensity over the study period, so WMH penumbra voxels were classified as WMH progression or stable. Penumbra voxels demonstrating increasing FLAIR signal intensity and segmented as new lesions at later time points were classified as WMH lesion progression, while all remaining penumbra voxels were classified as stable.
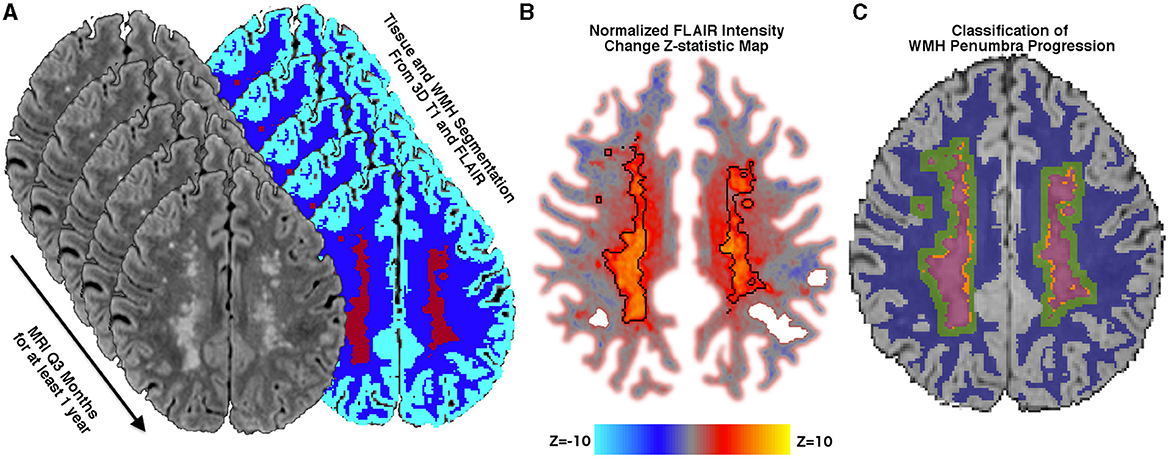
Figure 1. Methods. (A) Tissue segmentation using FLAIR and T1 into the cerebrospinal fluid, normal appearing white matter (NAWM) (blue), gray matter (cyan), and white matter hyperintensities (WMH) (maroon). 3D FLAIR is normalized to mean gray matter signal intensity and then rigidly aligned to a midpoint space. (B) Normalized FLAIR intensity is regressed over time, and the slope is converted into a Z-statistic map using the mean and standard deviation of the slope within stable NAWM tissue. A Z-statistic map is shown with baseline lesions outlined in black. The Z-statistic map is thresholded and cluster-corrected with Z ≥ 2.3 and p < 0.01. (C) WMH lesions at any time point are dilated by 3 mm, and baseline WMHs (maroon) are subtracted, thereby creating a baseline WMH penumbra. Penumbra WM voxels that are segmented as new WMHs at any subsequent time point and demonstrate significantly increasing normalized FLAIR intensity over time are classified as new WMH lesion growth (orange), while voxels not meeting these criteria are classified as WMH penumbra: No growth (green).
Statistical analysis
Statistical analysis was performed using STATA v17.0 (stata.com). Mean and standard deviation were used for normally distributed variables, while median and interquartile range were used for non-normally distributed variables. Multiple linear regression was used to identify clinical predictors of WMH growth, considering baseline WMH, age, sex, and race. Simple regression was used to test the relationship between WMH growth and additional imaging markers such as cerebral microbleeds, lacunes, and chronic infarct volume.
Region of interest approach
Across four white matter ROIs (NAWM, penumbra: no growth, WMH progression, and baseline lesions), baseline differences in normalized FLAIR intensity and DTI metrics (FW, FATissue, and MDTissue) were assessed with repeated-measures ANOVA and a post-hoc Tukey's test. Separate mixed-effects linear regression models were used to estimate the mean change over time for each DTI metric or FLAIR signal intensity within these tissue ROIs. Fixed effects included tissue ROI (NAWM as reference), time, hospital site (due to potential scanner differences), age, sex, race (Black, Hispanic, or other), and baseline WMH volume, while random effects included intercepts for participants. Change within ROIs was identified as a tissue-by-time interaction, and pairwise comparisons were performed with Bonferroni correction. Residuals were inspected for normality and heteroscedasticity.
Voxel-wise approach
Within the WMH penumbra, each voxel was classified as either new WMH lesion progression or no growth over the study period using the voxel-wise analysis described above. For each DTI metric, logistic regression was used to test whether baseline metrics predicted voxel-wise classification of progression to WMH across all participants' pooled penumbra voxels while covarying for age, sex, race, and baseline WMH volume. Clustering of standard errors was incorporated to adjust for the non-independence of voxels within the same participant.
Receiver-operator characteristic (ROC) curve analysis was used to quantify the classification performance of each baseline DTI metric's logistic regression to predict voxel-wise WMH progression. The resulting area under the ROC curve (AUC) was used to compare the classification performance of the baseline DTI metrics, and bootstrap resampling was used to calculate 95% confidence intervals. We also report log-likelihood R2 values (pseudo R2) from the logistic regression analyses.
Results
Participants
A total of 26 participants with at least 1-year follow-up were included in this analysis (see Table 1) after excluding 1 participant with an interval ischemic stroke. Participants had a median of 4 visits (IQR 2) with a median visit-to-visit interval of 126 (IQR 95) days. The index ischemic event was stroke in 24 participants and TIA in 2 participants. For two participants with TIA, one had a chronic subcortical infarct (i.e., lacune) at presentation, and the other had a transient territorial perfusion delay that localized with the presenting symptoms. The etiology of index ischemic events was classified as small-vessel occlusion (SVO) in 9 (35%), cardioembolism (CE) in 6 (23%), large-artery atherosclerosis (LAA) in 4 (15%), and undetermined etiology in 7 (27%) participants. The median time from the index ischemic event to baseline imaging was 116 (IQR 61) days. On baseline imaging, CMBs were present in 7 (27%), lacunes were present in 10 (38%), and chronic cortical infarcts were present in 8 (31%) participants.
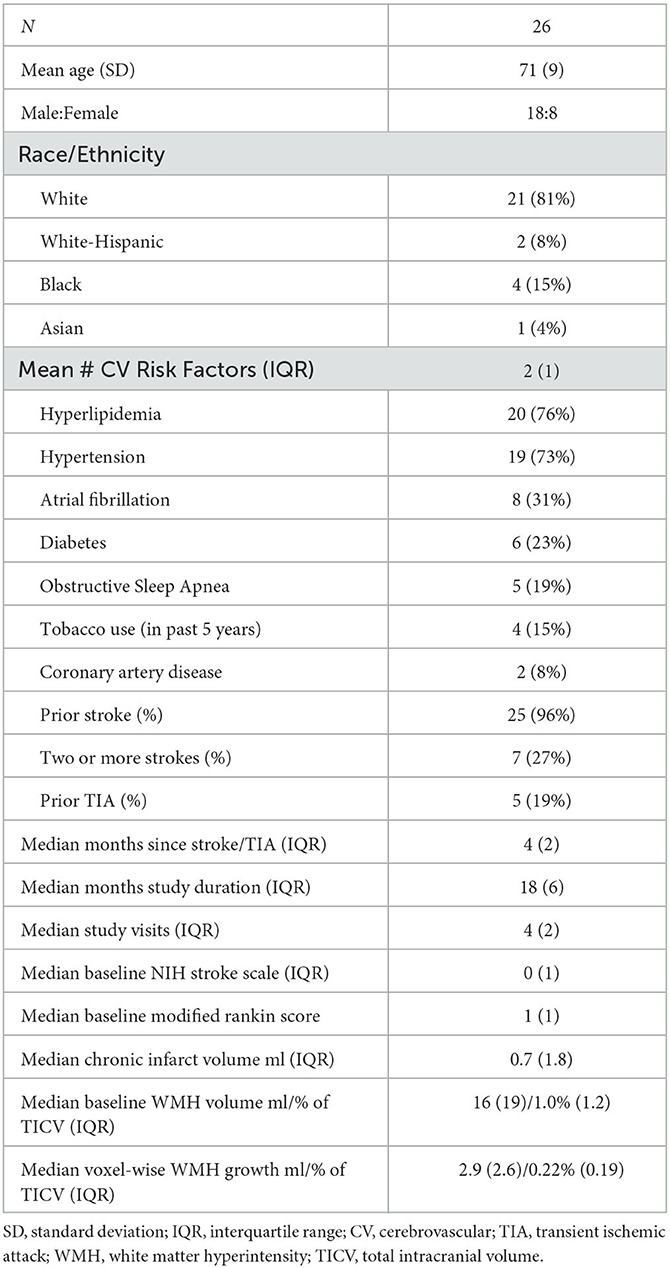
Table 1. Participant characteristics.
White matter hyperintensity progression
Using voxel-wise analysis of FLAIR signal intensity change to confirm new WMH, mean WMH growth was 2.9 ± 2.6 ml per year (0.22 ± 0.19% of TICV). There were no regions where FLAIR signal intensity significantly decreased over the course of the study. Over 1 year, WMH progression involved a median of 8% of the 3 mm WMH penumbra volume (IQR 6%, range 3–21%). Annualized WMH growth was associated with baseline WMH volume [beta 0.123 (0.050–0.196), p = 0.002] but not age, sex, or race. There were no group differences in annualized WMH growth for those with and without CMBs, with and without lacunes, nor with and without cortical infarcts. There were no group differences in WMH growth by the etiology of the index ischemic events (SVO, CE, or LAA).
DTI changes in white matter regions of interest
Free water differed at baseline for each of the four regions [F(3, 25) = 534.1; p < 0.0001; Table 2 and Figure 2A]. FW increased over time within the penumbra region where new lesion growth was detected and in the baseline WMH lesions (Table 2, Figure 3A). However, after multiple comparison correction, only FW within the new WMH region increased relative to NAWM [0.034/year (0.011–0.057); p = 0.001] or the penumbra: no growth region [0.025/year (0.002–0.048); p = 0.025]. FATissue (corrected for FW) differed at baseline between all regions [F(3, 25) = 149.9; p < 0.0001; Table 2 and Figure 2B]. FATissue decreased over time in the baseline lesions, but this decrease was not significantly more than in other regions (Figure 3B). MDTissue (corrected for FW) differed between all regions [F(3, 25) = 167.5; p < 0.0001; Table 2 and Figure 2C]. MDTissue increased in only the new lesion growth region (Table 2, Figure 3C), and the slope was different from both NAWM (difference: 1.4 × 10⁻⁵/year [0.23–2.5 × 10⁻⁵]; p = 0.009) and baseline lesions [difference: 1.19 × 10⁻⁵/year (0.05–2.3 × 10⁻⁵); p = 0.035].

Table 2. Baseline and longitudinal change in white matter measures.
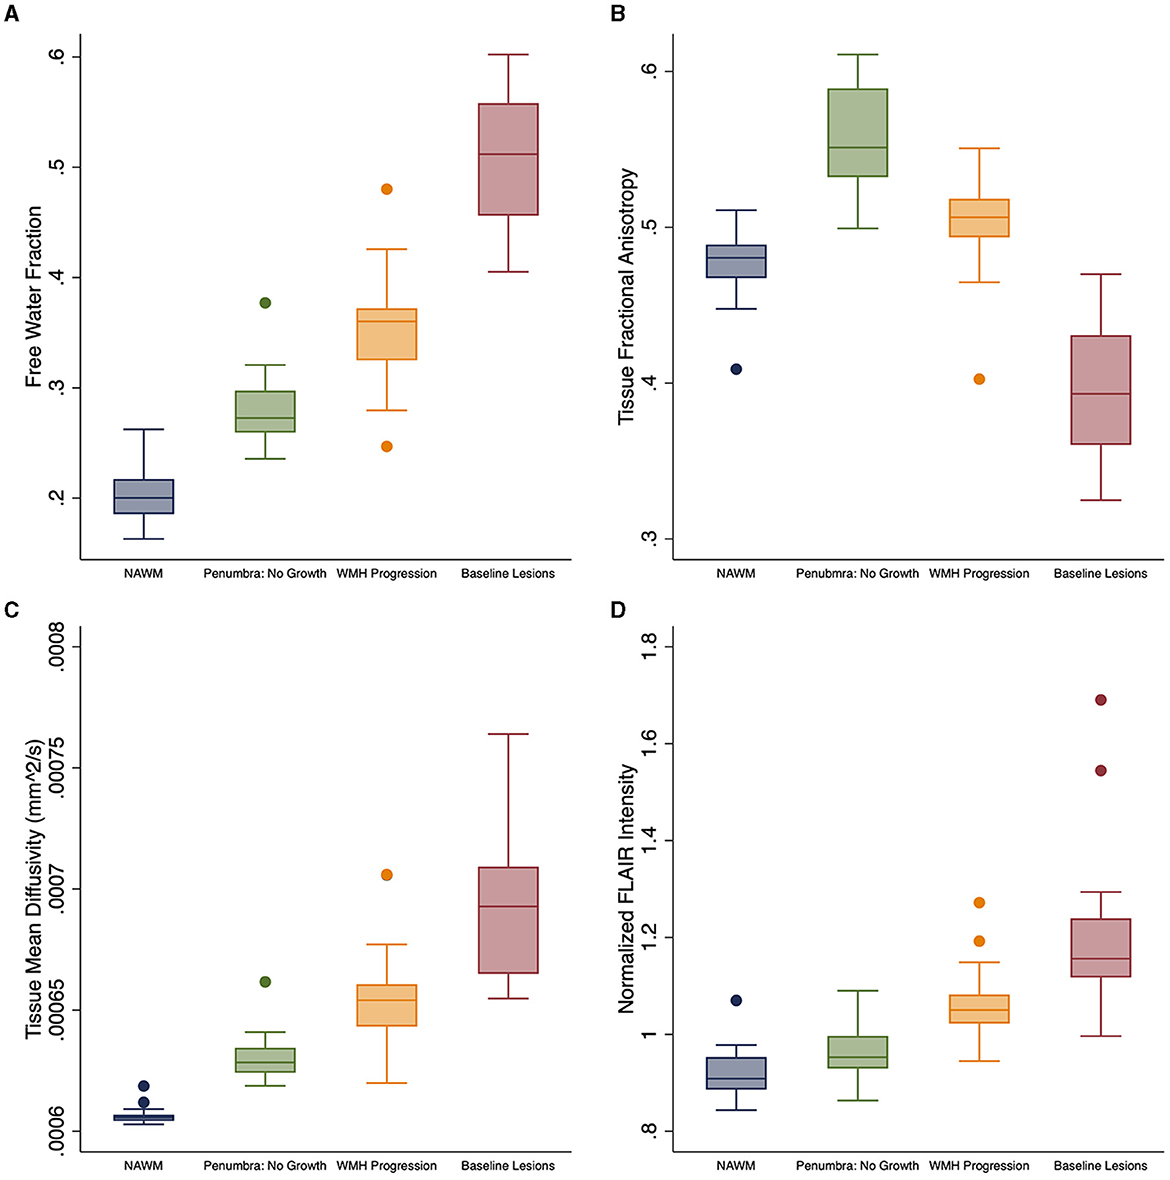
Figure 2. Baseline white matter DTI differences. Baseline differences across tissue regions for white matter measures: (A) free water (FW), (B) FATissue, (C) MDTissue, and (D) normalized FLAIR intensity. FATissue, FW-corrected fractional anisotropy; MDTissue, FW-corrected mean diffusivity.
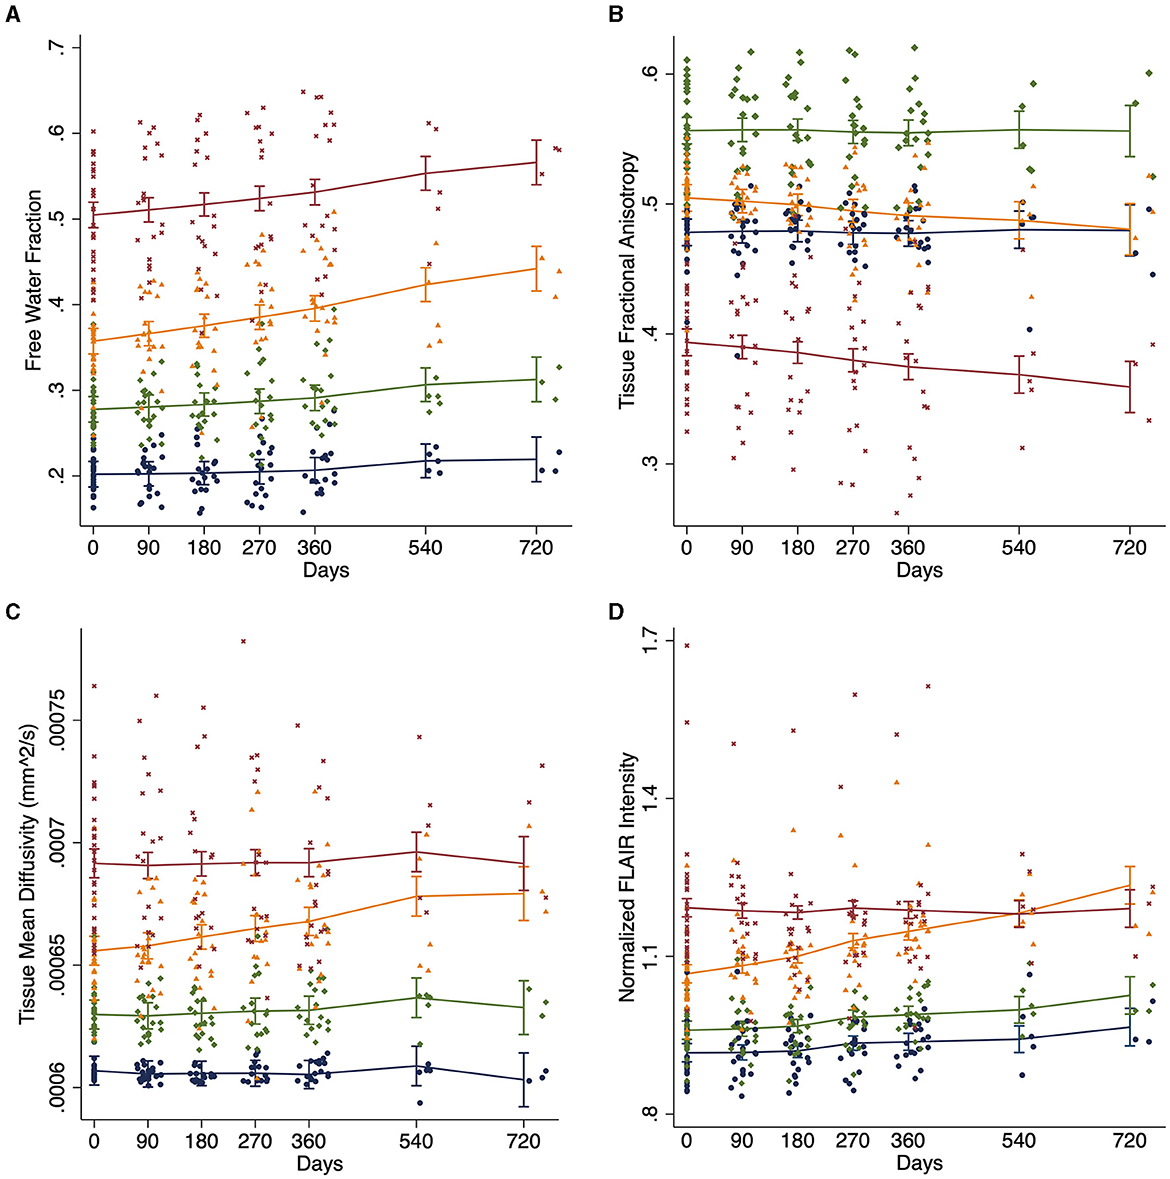
Figure 3. White matter longitudinal changes. Change in white matter measures over time across tissue regions estimated using linear mixed effects models for (A) DTI free water, (B) tissue fractional anisotropy (FATissue), (C) tissue mean diffusivity (MDTissue), and (D) normalized FLAIR intensity. Blue: normal appearing white matter (NAWM); Green: stable WMH penumbra voxels; Orange: WMH penumbra voxels progressing to a new WMH lesion; and Maroon: baseline white matter hyperintensities (WMH).
Normalized FLAIR signal intensity in white matter regions
At baseline, mean normalized FLAIR signal intensity was different within each of the white matter regions [F(3, 25) = 92.6, p < 0.05, Table 2 and Figure 2D]. As expected, mixed effects linear regression demonstrated an interaction between region and time, such that mean normalized FLAIR intensity increased by 0.058 per year (0.026–0.09) in the WMH penumbra: new lesion growth region (Table 2, Figure 3D). This change was different from NAWM [difference: 0.058 (0.015–0.101); p = 0.003], penumbra: no growth [difference: 0.050 (0.006–0.093); p = 0.015], and baseline WMH lesions [difference: 0.082 (0.038–0.12); p < 0.001].
Voxel-wise predictors of WMH progression
Using logistic regression across all participants' pooled WMH penumbra voxels and covarying for age, sex, race, MRI site, and baseline WMH lesion volume, each DTI metric at baseline was associated with voxel-wise progression to a new WMH lesion. Baseline voxel-wise FW provided the highest classification performance among DTI metrics with an AUC of 0.732 (0.730–0.733; pseudo R2 0.068; p < 0.001) from the ROC curve analysis. Balancing sensitivity and specificity using the Liu method (33), an optimal cutoff point of FW = 0.293 predicted progression to FLAIR WMH lesion over the study period with a sensitivity of 0.70 and a specificity of 0.66. MDTissue [AUC = 0.633 (0.631–0.635); pseudo R2 = 0.020; p < 0.001] and FATissue [AUC = 0.592 (0.590–0.594); pseudo R2 = 0.015; p < 0.001] provided less discriminatory power, although they were still associated with voxel-wise WMH lesion progression (Figure 4). Finally, clinical predictors alone (age, sex, race, and baseline WMH volume) did not predict voxel-wise WMH progression[(AUC = 0.543 (0.541–0.545); R2 = 0.006; p = 0.7].

Figure 4. Prediction of WMH progression. Receiver operator characteristic (ROC) curve to classify WMH penumbra voxels, pooled across all participants (n = 953,568 voxels) and corrected for within-subject covariance, as stable or progressing to new WMH using clinical predictors in combination with DTI predictors for free water (FW: orange), tissue mean diffusivity (pink), tissue fractional anisotropy (lavender), or clinical predictors alone: age, sex, race, and baseline WMH volume (black). WMH, white matter hyperintensity. AUC, area under the ROC curve.
Discussion
In this longitudinal study of participants with prior ischemic stroke or TIA, we detected an increasing WMH volume remote from the infarct of 2.9 ml per year over 1–2 years that was preceded by locally elevated DTI FW. Based on our literature review, this is the first study to demonstrate the predictive properties of FW for the progression of WMH. Elevated MDTissue and decreased FATissue, each corrected for FW, also preceded the development of new WMH. However, we did not detect changes in FATissue over time. Of these DTI metrics, baseline FW provided the best discriminatory index for predicting the local progression of WMH penumbra into new WMH, improving upon the classification performance of clinical measures alone. As expected, since WMHs were segmented and confirmed using FLAIR images, the normalized FLAIR signal increased as new WMH developed.
Locally elevated and rising FW over time likely reflects the accumulation of interstitial fluid within NAWM tissue. The accumulation of interstitial fluid contributes to the conspicuity of WMH on FLAIR. An accumulation of FW may represent fluid shifts from the vascular space to the interstitial space, which might occur in the setting of increased vascular permeability, reduced clearance, or both. Prior in vivo studies have demonstrated increased BBB permeability in chronic SVD (5), and pathology studies have found excess fibrinogen deposition in chronic cerebrovascular lesions, supporting this hypothesis (34, 35). Alternatively, reduced clearance could occur in the setting of venous pathology, and prior studies have found an association between elevated FW and venous disruption on susceptibility-weighted MRI at 7 Tesla in patients with SVD (36). Pathology studies have also found more venous collagenosis associated with a higher WMH burden (7). More recently, a role for impaired glymphatic drainage has also been proposed for the pathogenesis of WMH lesions (37). Arteriolosclerosis is the most common pathologic correlate to WMH on imaging, (38) and arteriolar stiffening, or reduced compliance, impairs vasomotion and paravascular fluid clearance, thereby resulting in interstitial fluid accumulation (39). These phenomena may also be reflected by enlarged perivascular spaces (PVS), which are also associated with SVD risk factors, SVD imaging markers, and cognition in SVD and stroke patients (40–43). The FW fraction likely partially reflects fluid in the PVS since most PVS are below the resolution of diffusion imaging.
Previous studies of middle-aged to older adult community populations have also demonstrated reduced integrity of NAWM in the WMH penumbra, including reduced FA and cerebral blood flow and increased FLAIR intensity, MD, and FW (9, 12, 15, 16, 20). A cross-sectional study recently demonstrated increased white matter FW extending 8 mm from the edge of FLAIR WMH in a large cohort of community participants with elevated cardiovascular risk (20). Longitudinal studies have also shown that reduced FA and cerebral blood flow and increased normalized FLAIR intensity and MD precede the development of WMH over time (10, 15, 17). Khan et al. (44) also demonstrated DTI changes preceding new WMH development from 3 months to 1 year after ischemic stroke. By applying a 3-tissue diffusion signal composition to DTI images, they found that white matter progressing to new WMH already demonstrated more CSF-like and gray matter-like signals and less white matter-like signals at baseline compared to non-progressing NAWM (44). In this study, we build upon these findings by demonstrating that elevated FW precedes progression of NAWM into WMH and provides better discriminatory classification than tissue DTI measures, suggesting that accumulation of interstitial fluid plays a key pathogenic role in the development of new WMH lesions.
While baseline FATissue was lower in the penumbra voxels progressing to WMH than those that did not progress, FATissue was lower still in the NAWM and lowest in chronic WMH. This discrepancy has been demonstrated previously and is due to normal anatomical variation in FA: more central and periventricular white matter bundles (where WMH predominates) tend to be more heavily myelinated than fibers located closer to the cortical surface (9, 12, 20). Normalizing FA to an FA atlas of healthy controls can circumvent the anatomical variation in FA (16), although we did not find reports using this approach with FATissue measures.
Normalized FLAIR intensity has also been identified as a sensitive, continuous measure for cerebrovascular disease. Rather than dichotomizing FLAIR images as lesions or NAWM, FLAIR intensity provides complementary information to DTI in predicting new lesions (16). In this study, we used normalized FLAIR intensity to reliably identify WMH growth. Most prior studies performed lesion segmentation on FLAIR and then subtracted lesion masks. To reduce the risk of false positive changes, we examined changes in normalized FLAIR intensity directly, similar to the methods developed by Schmidt et al. for the Lesion Segmentation Toolbox (32). However, rather than compare two time-point differences, we evaluated the slope over multiple time points. In this manner, we identified WMHs that are reliably progressing when compared to NAWM that is not progressing. The limitations of this approach are that it may be conservative and that shorter duration fluctuations in WMH progression and regression will be missed due to the assumption of linearity. We did not find regional WMH regression in the WMH penumbra over 1 year in this cohort, but evaluation of individual time-point differences might reveal instances of WMH regression (45, 46). This method of comparing normalized FLAIR intensities voxel-wise may be less reliable in participants undergoing more dramatic brain structural changes, such as during the first 3 months after stroke (47), or over much longer time periods when significant brain atrophy is likely. However, morphometric approaches using non-linear brain alignment could be more effective for detecting voxel-wise progression, particularly when dynamic structural changes are expected.
Prior efforts to harmonize DTI acquisition and post-processing techniques for multi-site clinical studies have focused on the conventional DTI measures FA and MD, using various region of interest approaches and histogram methods to capture a whole-brain measure of SVD that best reflects clinical and cognitive status (48). Similar attempts to harmonize FW measures are underway as part of the MARK VCID network (49). Regional approaches, on the other hand, may capture more subtle tissue changes over shorter time periods. This may lend more power to understanding pathophysiology and detecting treatment effects, but it remains to be determined how closely these regional changes relate to disability, cognitive performance, or progression to dementia.
While the strengths of this study include multiple, frequent follow-up visits over 1–2 years (median 4 visits per participant, 112 visits total), the number of participants is relatively small, which may limit generalizability and limit our analysis of clinical risk factors or other imaging markers that may also predict WMH progression. Blood pressure control, in particular, was not measured in this study but is the most significant clinical predictor for WMH progression. However, the focus of this study was to compare the predictive value of DTI metrics within at-risk white matter regions for classifying the voxel-wise progression of WMH, for which the sample size was 953,568 voxels. Finally, while we investigated WMH remote from chronic infarction as an indicator of underlying SVD, we cannot exclude subclinical cardioembolic or atheroembolic events as additional contributors to WMH progression. While prior studies found that WMH progressed faster in the setting of prior small vessel stroke, (50) our sample size was likely insufficient to identify differential progression due to index stroke etiology.
While prior studies have evaluated longitudinal changes in FA and MD in NAWM progressing to WMH, here, we also identify longitudinal changes in NAWM FW, which has recently been reported to be more closely associated with SVD disability and cognitive processing speed than other imaging markers of SVD (19). However, we estimated FW by applying a bi-tensor model to DTI with a single high B-value, which requires additional assumptions, parameter initialization, and spatial regularization (27, 28). Single-shell FW methods have also been shown to be affected by tissue perfusion that may result in an overestimation of the FW content (51). Multi-shell DTI would provide a more robust FW measure but requires longer scan times. For this reason, clinical DTI sequences are typically single-shell, so most of the recent studies using DTI FW in cerebrovascular disease have used similar approaches and yet have still demonstrated robust clinical relevance for the single-shell-derived FW measure.
Conclusion
By evaluating voxel-wise longitudinal changes in white matter at risk for progression to WMHs in participants with chronic stroke, we identify FW as the most predictive DTI measure for progression, indicating that accumulation of interstitial fluid is an early event in the progression of white matter damage.
Data availability statement
The datasets presented in this article are not readily available because data will be made available upon reasonable request to the corresponding author after close-out and publication of the parent study under a formal data sharing agreement and with approval from the requesting researcher's local Ethics Committee. Requests to access the datasets should be directed to rleigh4@jhu.edu.
Ethics statement
The studies involving humans were approved by National Institutes of Health Institutional Review Board (IRB #18N0020). The studies were conducted in accordance with the local legislation and institutional requirements. The participants provided their written informed consent to participate in this study.
Author contributions
KK: conceptualization, investigation, data curation, methodology, software, formal analysis, manuscript original draft preparation, and visualization. MZ: project administration, protocol development, and protocol supervision. RG: supervision, formal analysis review, and manuscript review and editing. CW: protocol supervision, formal analysis review, and manuscript review and editing. RL: funding acquisition, protocol development, protocol supervision, project supervision, investigation, methodology, formal analysis, and manuscript review and editing. All authors contributed to the article and approved the submitted version.
Funding
This study was fully funded by the Intramural Research Program of the National Institute of Neurological Disorders and Stroke (NINDS), National Institutes of Health, Bethesda, MD, USA.
Acknowledgments
The authors thank the stroke programs at MedStar Washington Hospital and Suburban Hospital including the clinicians and research staff. This study used the computational resources of the NIH HPC Biowulf cluster: hpc.nih.gov.
Conflict of interest
CW reports honorarium from Uptodate.com for articles on Vascular Dementia.
The remaining authors declare that the research was conducted in the absence of any commercial or financial relationships that could be construed as a potential conflict of interest.
Publisher's note
All claims expressed in this article are solely those of the authors and do not necessarily represent those of their affiliated organizations, or those of the publisher, the editors and the reviewers. Any product that may be evaluated in this article, or claim that may be made by its manufacturer, is not guaranteed or endorsed by the publisher.
Supplementary material
The Supplementary Material for this article can be found online at: https://www.frontiersin.org/articles/10.3389/fneur.2023.1172031/full#supplementary-material
Abbreviations
AUC, Area under the receiver-operator characteristic curve; CSF, cerebrospinal fluid; DIPY, diffusion imaging in python; DTI, diffusion tensor imaging; FA, fractional anisotropy; FATissue, Free Water-corrected Fractional Anisotropy; FLAIR, fluid attenuated inversion recovery; FSL, FMRIB Software Library; FW, free water; MD, mean diffusivity; MDTissue, Free Water-corrected Mean Diffusivity; MRI, magnetic resonance imaging; NAWM, normal appearing white matter; NIH, National Institutes of Health; NINDS, National Institute of Neurological Disorders and Stroke; QIT, Quantitative Imaging Toolbox; ROC, receiver-operator characteristic; ROI, regions-of-interest; SAMSEG, Sequence Adaptive Multimodal SEGmentation; SVD, small vessel disease; TIA, transient ischemic attack; VCID, vascular contributions to cognitive impairment and dementia; WMH, white matter hyperintensities.
References
1. Park JH, Heo S, Lee M, Kwon H, Kwon S, Lee J, et al. White matter hyperintensities and recurrent stroke risk in patients with stroke with small-vessel disease. Eur J Neurol. (2019) 26:911–8. doi: 10.1111/ene.13908
2. Schmidt R, Ropele S, Enzinger C, Petrovic K, Smith S, Schmidt H, et al. White matter lesion progression, brain atrophy, and cognitive decline: the austrian stroke prevention study. Ann Neurol. (2005) 58:610–6. doi: 10.1002/ana.20630
3. Prins ND, van Dijk EJ, den Heijer T, Vermeer SE, Koudstaal PJ, Oudkerk M, et al. Cerebral white matter lesions and the risk of dementia. Arch Neurol. (2004) 61:1531–4. doi: 10.1001/archneur.61.10.1531
4. de Havenon A, Sheth KN, Yeatts SD, Turan TN, Prabhakaran S. White matter hyperintensity progression is associated with incident probable dementia or mild cognitive impairment. Stroke Vasc Neurol. (2022) 7:357. doi: 10.1136/svn-2021-001357
5. Wardlaw JM, Doubal FN, Valdes-Hernandez M, Wang X, Chappell FM, Shuler K, et al. Blood-brain barrier permeability and long-term clinical and imaging outcomes in cerebral small vessel disease. Stroke. (2013) 44:525–7. doi: 10.1161/STROKEAHA.112.669994
6. Black S, Gao F, Bilbao J. Understanding white matter disease: Imaging-pathological correlations in vascular cognitive impairment. Stroke. (2009) 40:S48–52. doi: 10.1161/STROKEAHA.108.537704
7. Keith J, Gao FQ, Noor R, Kiss A, Balasubramaniam G, Au K, et al. Collagenosis of the deep medullary veins: an under recognized pathologic correlate of white matter hyperintensities and periventricular infarction? J Neuropathol Exp Neurol. (2017) 76:299–312. doi: 10.1093/jnen/nlx009
8. van Swieten JC, van den Hout JH, van Ketel BA, Hijdra A, Wokke JH, van Gijn J. Periventricular lesions in the white matter on magnetic resonance imaging in the elderly. A morphometric correlation with arteriolosclerosis and dilated perivascular spaces. Brain. (1991) 114: 761–74. doi: 10.1093/brain/114.2.761
9. Maillard P, Fletcher E, Harvey D, Carmichael O, Reed B, Mungas D, et al. White matter hyperintensity penumbra. Stroke. (2011) 42:1917–22. doi: 10.1161/STROKEAHA.110.609768
10. Maillard P, Fletcher E, Lockhart SN, Roach AE, Reed B, Mungas D, et al. White matter hyperintensities and their penumbra lie along a continuum of injury in the aging brain. Stroke. (2014) 45:1721–6. doi: 10.1161/STROKEAHA.113.004084
11. Promjunyakul NO, Lahna DL, Kaye JA, Dodge HH, Erten-Lyons D, Rooney WD, et al. Comparison of cerebral blood flow and structural penumbras in relation to white matter hyperintensities: a multi-modal magnetic resonance imaging study. J Cereb Blood Flow Metab. (2016) 36:1528–36. doi: 10.1177/0271678X16651268
12. Nasrallah IM, Hsieh MK, Erus G, Battapady H, Dolui S, Detre JA, et al. White matter lesion penumbra shows abnormalities on structural and physiologic MRIS in the coronary artery risk development in young adults cohort. AJNR Am J Neuroradiol. (2019) 40:1291–8. doi: 10.3174/ajnr.A6119
13. Wu X, Ge X, Du J, Wang Y, Sun Y, Han X, et al. Characterizing the penumbras of white matter hyperintensities and their associations with cognitive function in patients with subcortical vascular mild cognitive impairment. Front Neurol. (2019) 10:348. doi: 10.3389/fneur.2019.00348
14. Wang X, Wang Y, Gao D, Zhao Z, Wang H, Wang S, et al. Characterizing the penumbras of white matter hyperintensities in patients with cerebral small vessel disease. Jpn J Radiol. (2023). doi: 10.1007/s11604-023-01419-w
15. Promjunyakul N, Lahna D, Kaye JA, Dodge HH, Erten-Lyons D, Rooney WD, et al. Characterizing the white matter hyperintensity penumbra with cerebral blood flow measures. Neuroimage Clin. (2015) 8:224–9. doi: 10.1016/j.nicl.2015.04.012
16. Maillard P, Carmichael O, Harvey D, Fletcher E, Reed B, Mungas D, et al. Flair and diffusion MRI signals are independent predictors of white matter hyperintensities. AJNR Am J Neuroradiol. (2013) 34:54–61. doi: 10.3174/ajnr.A3146
17. de Groot M, Verhaaren BF, de Boer R, Klein S, Hofman A, van der Lugt A, et al. Changes in normal-appearing white matter precede development of white matter lesions. Stroke. (2013) 44:1037–42. doi: 10.1161/STROKEAHA.112.680223
18. Pierpaoli C, Jones DK. Removing CSF contamination in brain DT-MRIs by using a two-compartment tensor model. Proc. Intl. Soc. Mag. Reson. Med. 2004;11:1215.
19. Duering M, Finsterwalder S, Baykara E, Tuladhar AM, Gesierich B, Konieczny MJ, et al. Free water determines diffusion alterations and clinical status in cerebral small vessel disease. Alzheimers Dement. (2018) 14:764–74. doi: 10.1016/j.jalz.2017.12.007
20. Mayer C, Nagele FL, Petersen M, Frey BM, Hanning U, Pasternak O, et al. Free-water diffusion MRI detects structural alterations surrounding white matter hyperintensities in the early stage of cerebral small vessel disease. J Cereb Blood Flow Metab. (2022) 14:271678X221093579. doi: 10.1177/0271678X221093579
21. Adams HP, Bendixen BH, Kappelle LJ, Biller J, Love BB, Gordon DL, et al. Classification of subtype of acute ischemic stroke. Definitions for use in a multicenter clinical trial. Toast trial of org 10172 in acute stroke treatment. Stroke. (1993) 24: 35–41. doi: 10.1161/01.STR.24.1.35
22. Cerri S, Puonti O, Meier DS, Wuerfel J, Mühlau M, Siebner HR, et al. A contrast-adaptive method for simultaneous whole-brain and lesion segmentation in multiple sclerosis. Neuroimage. (2021) 225:117471. doi: 10.1016/j.neuroimage.2020.117471
23. Smith SM, Jenkinson M, Woolrich MW, Beckmann CF, Behrens TE, Johansen-Berg H, et al. Advances in functional and structural mr image analysis and implementation as FSL. Neuroimage. (2004) 23:S208–219. doi: 10.1016/j.neuroimage.2004.07.051
24. Garyfallidis E, Brett M, Amirbekian B, Rokem A, van der Walt S, Descoteaux M, et al. Dipy, a library for the analysis of diffusion MRI data. Front Neuroinform. (2014) 8:8. doi: 10.3389/fninf.2014.00008
25. Cabeen RP, Laidlaw DH, Toga AW. Quantitative Imaging Toolkit: Software for Interactive 3D Visualization, Data Exploration, and Computational Analysis of Neuroimaging Datasets. Proceedings of the International Society for Magnetic Resonance in Medicine (ISMRM), (2018) 2854.
26. Andersson JLR, Sotiropoulos SN. An integrated approach to correction for off-resonance effects and subject movement in diffusion MR imaging. Neuroimage. (2016) 125:1063–78. doi: 10.1016/j.neuroimage.2015.10.019
27. Pasternak O, Sochen N, Gur Y, Intrator N, Assaf Y. Free water elimination and mapping from diffusion mri. Magn Reson Med. (2009) 62:717–30. doi: 10.1002/mrm.22055
28. Golub M, Neto Henriques R, Gouveia Nunes R. Free-water dti estimates from single b-value data might seem plausible but must be interpreted with care. Magn Reson Med. (2021) 85:2537–51. doi: 10.1002/mrm.28599
29. Greve DN, Fischl B. Accurate and robust brain image alignment using boundary-based registration. Neuroimage. (2009) 48:63–72. doi: 10.1016/j.neuroimage.2009.06.060
30. Cordonnier C, Potter GM, Jackson CA, Doubal F, Keir S, Sudlow CL, et al. Improving interrater agreement about brain microbleeds: development of the brain observer microbleed scale (bombs). Stroke. (2009) 40:94–9. doi: 10.1161/STROKEAHA.108.526996
31. Fazekas F, van Buchem M, Mok V, DeCarli C, Werring D, Viswanathan A, et al. Neuroimaging standards for research into small vessel disease and its contribution to ageing and neurodegeneration. The Lancet Neurol. (2013) 12: 822-−38. doi: 10.1016/S1474-4422(13)70124-8
32. Schmidt P, Pongratz V, Kuster P, Meier D, Wuerfel J, Lukas C, et al. Automated segmentation of changes in flair-hyperintense white matter lesions in multiple sclerosis on serial magnetic resonance imaging. Neuroimage Clin. (2019) 23:101849. doi: 10.1016/j.nicl.2019.101849
33. Liu X. Classification accuracy and cut point selection. Stat Med. (2012) 31:2676–86. doi: 10.1002/sim.4509
34. Young VG, Halliday GM, Kril JJ. Neuropathologic correlates of white matter hyperintensities. Neurology. (2008) 71:804–11. doi: 10.1212/01.wnl.0000319691.50117.54
35. Hainsworth AH, Minett T, Andoh J, Forster G, Bhide I, Barrick TR, et al. Neuropathology of white matter lesions, blood-brain barrier dysfunction, and dementia. Stroke. (2017) 48:2799–804. doi: 10.1161/STROKEAHA.117.018101
36. Zhang R, Huang P, Jiaerken Y, Wang S, Hong H, Luo X, et al. Venous disruption affects white matter integrity through increased interstitial fluid in cerebral small vessel disease. J Cereb Blood Flow Metab. (2021) 41:157–65. doi: 10.1177/0271678X20904840
37. Wardlaw JM, Liebeskind DS. Not just blood: brain fluid systems and their relevance to cerebrovascular diseases. Stroke. (2022) 53:1399–401. doi: 10.1161/STROKEAHA.122.037448
38. Erten-Lyons D, Woltjer R, Kaye J, Mattek N, Dodge HH, Green S, et al. Neuropathologic basis of white matter hyperintensity accumulation with advanced age. Neurology. (2013) 81:977–83. doi: 10.1212/WNL.0b013e3182a43e45
39. van Veluw SJ, Hou SS, Calvo-Rodriguez M, Arbel-Ornath M, Snyder AC, Frosch MP, et al. Vasomotion as a driving force for paravascular clearance in the awake mouse brain. Neuron. (2020) 105:549–61. doi: 10.1016/j.neuron.2019.10.033
40. Maclullich AM, Wardlaw JM, Ferguson KJ, Starr JM, Seckl JR, Deary IJ. Enlarged perivascular spaces are associated with cognitive function in healthy elderly men. J Neurol Neurosurg Psychiatry. (2004) 75:1519–23. doi: 10.1136/jnnp.2003.030858
41. Huijts M, Duits A, Staals J, Kroon AA, de Leeuw PW, van Oostenbrugge RJ. Basal ganglia enlarged perivascular spaces are linked to cognitive function in patients with cerebral small vessel disease. Curr Neurovasc Res. (2014) 11:136–41. doi: 10.2174/1567202611666140310102248
42. Adams HH, Hilal S, Schwingenschuh P, Wittfeld K, van der Lee SJ, DeCarli C, et al. A priori collaboration in population imaging: The uniform neuro-imaging of virchow-robin spaces enlargement consortium. Alzheimers Dement. (2015) 1:513–20. doi: 10.1016/j.dadm.2015.10.004
43. Arba F, Quinn TJ, Hankey GJ, Lees KR, Wardlaw JM, Ali M, et al. Enlarged perivascular spaces and cognitive impairment after stroke and transient ischemic attack. Int J Stroke. (2018) 13:47–56. doi: 10.1177/1747493016666091
44. Khan W, Khlif MS, Mito R, Dhollander T, Brodtmann A. Investigating the microstructural properties of normal-appearing white matter (NAWM) preceding conversion to white matter hyperintensities (WMHS) in stroke survivors. Neuroimage. (2021) 232:117839. doi: 10.1016/j.neuroimage.2021.117839
45. Cho AH, Kim HR, Kim W, Yang DW. White matter hyperintensity in ischemic stroke patients: IT may regress over time. J Stroke. (2015) 17:60–6. doi: 10.5853/jos.2015.17.1.60
46. Wardlaw JM, Chappell FM, Valdes Hernandez MDC, Makin SDJ, Staals J, Shuler K, et al. White matter hyperintensity reduction and outcomes after minor stroke. Neurology. (2017) 89:1003–10. doi: 10.1212/WNL.0000000000004328
47. Brodtmann A, Khlif MS, Egorova N, Veldsman M, Bird LJ, Werden E. Dynamic regional brain atrophy rates in the first year after ischemic stroke. Stroke. (2020) 51:e183–92. doi: 10.1161/STROKEAHA.120.030256
48. Zeestraten EA, Benjamin P, Lambert C, Lawrence AJ, Williams OA, Morris RG, et al. Application of diffusion tensor imaging parameters to detect change in longitudinal studies in cerebral small vessel disease. PLoS ONE. (2016) 11:e0147836. doi: 10.1371/journal.pone.0147836
49. Maillard P, Lu H, Arfanakis K, Gold BT, Bauer CE, Zachariou V, et al. Instrumental validation of free water, peak-width of skeletonized mean diffusivity, and white matter hyperintensities: Markvcid neuroimaging kits. Alzheimers Dement. (2022) 14:e12261. doi: 10.1002/dad2.12261
50. Leys D, Englund E, Del Ser T, Inzitari D, Fazekas F, Bornstein N, et al. White matter changes in stroke patients. Relationship with stroke subtype and outcome. Eur Neurol. (1999) 42:67–75. doi: 10.1159/000069414
Keywords: white matter hyperintensities, cerebral small vessel disease, ischemic stroke, diffusion tensor imaging, free water
Citation: Kern KC, Zagzoug MS, Gottesman RF, Wright CB and Leigh R (2023) Diffusion tensor free water MRI predicts progression of FLAIR white matter hyperintensities after ischemic stroke. Front. Neurol. 14:1172031. doi: 10.3389/fneur.2023.1172031
Received: 24 February 2023; Accepted: 23 August 2023;
Published: 22 September 2023.
Edited by:
Hans-Peter Müller, University of Ulm, GermanyReviewed by:
Cheryl R. McCreary, University of Calgary, CanadaMaria Del Carmen Valdés Hernández, University of Edinburgh, United Kingdom
Copyright © 2023 Kern, Zagzoug, Gottesman, Wright and Leigh. This is an open-access article distributed under the terms of the Creative Commons Attribution License (CC BY). The use, distribution or reproduction in other forums is permitted, provided the original author(s) and the copyright owner(s) are credited and that the original publication in this journal is cited, in accordance with accepted academic practice. No use, distribution or reproduction is permitted which does not comply with these terms.
*Correspondence: Richard Leigh, rleigh4@jhu.edu