


- 1 Swartz Center for Computational Neuroscience, Institute for Neural Computation, University of California San Diego, La Jolla, CA, USA
- 2 Mayo Systems Electrophysiology Laboratory, Department of Neurology, Mayo Clinic, Rochester, MN, USA
- 3 Seoul Brain Neurology Clinic, Seoul, Korea
Electrode arrays are sometimes implanted in the brains of patients with intractable epilepsy to better localize seizure foci before epilepsy surgery. Analysis of intracranial EEG (iEEG) recordings is typically performed in the electrode channel domain without explicit separation of the sources that generate the signals. However, intracranial EEG signals, like scalp EEG signals, could be linear mixtures of local activity and volume-conducted activity arising in multiple source areas. Independent component analysis (ICA) has recently been applied to scalp EEG data, and shown to separate the signal mixtures into independently generated brain and non-brain source signals. Here, we applied ICA to unmix source signals from intracranial EEG recordings from four epilepsy patients during a visually cued finger movement task in the presence of background pathological brain activity. This ICA decomposition demonstrated that the iEEG recordings were not maximally independent, but rather are linear mixtures of activity from multiple sources. Many of the independent component (IC) projections to the iEEG recording grid were consistent with sources from single brain regions, including components exhibiting classic movement-related dynamics. Notably, the largest IC projection to each channel accounted for no more than 20–80% of the channel signal variance, implying that in general intracranial recordings cannot be accurately interpreted as recordings of independent brain sources. These results suggest that ICA can be used to identify and monitor major field sources of local and distributed functional networks generating iEEG data. ICA decomposition methods are useful for improving the fidelity of source signals of interest, likely including distinguishing the sources of pathological brain activity.
Introduction
The goal of cognitive neuroscience is to correlate behavior and experience with brain function. While animal studies provide the opportunity to record neural activity directly, either at the level of single units or of local field potentials, human neuroscience is typically limited to non-invasive, whole-brain imaging techniques typically considered to have limited spatial and/or temporal resolution. Scalp electroencephalographic (EEG) recordings have sub-millisecond temporal resolution, but their spatial resolution is limited by the typical multi-centimeter scale spacing of electrodes on the scalp surface, by the broad point-spread functions of far-field potentials generated in cortical areas, and by the difficulty of estimating source distributions on the highly folded brain surface from sparse measurements on the smooth and electrically distant scalp surface. Estimation of the locations of neurophysiological current sources that generate the electric fields recorded by EEG sensors is also inherently a mathematically underdetermined problem whose solution requires the use of additional physiological constraints to limit the infinite solution space.
Independent component analysis (ICA) is a signal decomposition technique that finds a set of maximally independent signals that mix linearly to produce the recorded data (Bell and Sejnowski, 1995). An ICA decomposition separates the channel data matrix into a mixing matrix whose columns each weight the relative contributions of an independent component (IC) to the electrodes, and a matrix of IC activity or activation time series. ICA has been used to interpret scalp EEG signals recorded during cognitive and perceptual tasks (Makeig et al., 1996, 1997, 2002, 2004a,b). Additionally, many IC scalp maps visualizing their topographic projections to the EEG electrode montage exhibit biophysically simple patterns consistent with fields generated by dipolar current sources, in the absence of any explicit field pattern constraints in the ICA model (Makeig et al., 1997, 2004a).
Intracranial EEG (iEEG) is an invasive technique for recording the electrical activity of the human brain in patients with medically intractable partial epilepsy (Engel, 1996). Intracranial signals are recorded from surgically implanted subdural arrays on the cortical surface or from intraparenchymal depth probes. These typically use electrodes with 1–10 mm2 surface area and 1-cm spacing, and are generally implicitly assumed to record activity from the proximal brain tissue (Bullock et al., 1995; Nunez and Srinivasan, 2006). Clinically, iEEG has played a critical role in the success of epilepsy surgery, and is considered the gold standard for localization of seizure foci (Berger, 1929; Jasper and Penfield, 1949; Wyler et al., 1984; Engel and Crandall, 1987; Luders et al., 1992; Dewar et al., 1996) and for precise cortical mapping of sensory, motor, and language areas prior to surgery (Penfield and Kristiansen, 1951; Penfield, 1954; Ojemann, 1982; Burchiel et al., 1989; Luders et al., 1995; Tharin and Golby, 2007).
Since for clinical purposes patient intracranial recordings are continued for several days, patients may be allowed to volunteer for cognitive neuroscience studies during intracranial monitoring. Thus, human intracranial recordings have also been analyzed in studies of language (Ojemann et al., 1983, 1989), motor activity (Arroyo et al., 1993; Crone et al., 1998a,b; Miller et al., 2007a; Ball et al., 2008), visually guided behaviors (Klopp et al., 2001), face recognition (Halgren et al., 1994a,b; Klopp et al., 2000; Quiroga et al., 2005), memory (Cameron et al., 2001; Fell et al., 2001; Rizzuto et al., 2006), spatial cognition (Kahana et al., 1999), and attention (Ray et al., 2008).
Intracranial recordings involving implantation of electrodes directly onto neocortex and into deep medial temporal structures (amygdala and hippocampus) is often treated as the “gold standard” to which clinical scalp EEG results are compared and the estimated locations of pathological activity verified (Cooper et al., 1965; Kobayashi et al., 2001). However, by simple biophysics intracranial recordings, like scalp EEG, are mixtures of volume-conducted activities of many current sources (Nunez and Srinivasan, 2006). Despite this, iEEG data are frequently examined without the application of signal separation methods.
Because of volume conduction within the brain, signals recorded from clinical iEEG arrays or strips may include activities generated distal as well as proximal to the electrodes. Activity generated in tissue proximal to an electrode (or to the active reference electrode) may not necessarily dominate each iEEG channel signal, and typically the relative strengths of proximal and distal contributions to the channel signals are not measured. Direct measurements would require more complex multi-resolution 3-D electrode arrays. However, since volume conduction and superposition of brain source signals to both EEG and iEEG electrodes is linear and without appreciable delay (Nunez and Srinivasan, 2006), we propose that ICA should work just as well for separating iEEG signal mixtures as for separating scalp EEG mixtures, thus providing a clinically feasible way to separate proximal and distal iEEG components and, possibly, to better observe their individual dynamics and localize their cortical distributions.
That intracranial recordings are from epilepsy and other pre-surgical patients means that cognitive research is performed using brains producing pathologic activity. Although ictal (seizure) episodes are typically not used in the analysis of the cognitive experiments, ongoing pathological brain signals may also occur during interictal (between-seizure) periods. Thus, abnormal brain signals may be mixed with the task-relevant brain signals under inquiry in data from cognitive iEEG experiments performed by epileptic patients. ICA might be able to separate the volume-conducted contributions of abnormal interictal activity from normal brain signals, if these arise within separable source domains. Moreover, ICA may be able to unmix normal brain activity from epileptic source activity, thereby revealing more about the location and temporal dynamics of the latter than visual inspection of the mixed data channels themselves. For these reasons, we propose that ICA may be useful in the interpretation of intracranial data.
Here, we used ICA to unmix independent sources of intracranial EEG data from four patients with medically intractable epilepsy as they performed a visually cued finger movement task. We first tested whether the time series of intracranial recordings in the channel domain were themselves wholly independent and whether ICA could represent the data as a mixture of more independent source signals. Next, we studied whether the grid projection maps associated with the iEEG independent components (ICs) may be consistent with projections of compact, dipolar source regions or possibly of source networks including more than one tightly connected brain area. Finally, we studied whether ICs might better identify brain areas that are functionally linked to interictal pathologic activity (intermittent rhythmic delta activity and interictal spikes) and to subject motor behavior.
Materials and Methods
Four patients with medically intractable epilepsy participated in this Mayo Clinic Internal Review Board approved study. The research protocol deviates from standard clinical practice because of the simultaneous acquisition of continuous, prolonged EEG recordings from scalp and intracranial electrodes. Patients gave their informed consent after the research protocol was presented to them in detail.
Simultaneous Scalp and Intracranial EEG Recordings
Scalp EEG recordings were obtained from at least 21 scalp electrodes placed according to the International 10–20 system using gauze, glue and conductive collodion gel. The scalp electrodes were commercially available 8-mm gold disc electrodes (Astro-Med; Grass instruments).
Intracranial depth and/or grid electrodes (Adtech, Inc.) were implanted according to standard pre-surgical evaluation protocol (Engel and Crandall, 1987; Luders et al., 1992; Engel, 1996). The intracranial electrode arrays were composed of 4-mm diameter Platinum/Iridium (Pt/Ir) contacts separated by 10 mm center-to-center spacing.
Scalp and intracranial EEG recordings were obtained using a scalp suture for ground and reference for one of the patients and the mastoid electrode contralateral to the majority of the intracranial electrode for three of the patients.
The following table lists the locations and numbers of electrodes used from each of the participants of the study.
Data Acquisition and Pre-Processing
For epilepsy monitoring, continuous video monitoring via scalp EEG and iEEG were recorded with a 128-channel, digital 12-bit, XLTEK system (XLTEK Inc.) with a sampling rate of 500 Hz. Patient 4 was recorded with a 128-channel, digital 24-bit, Neuralynx (Neuralynx Inc.), sampling at 32 kHz, and subsequently downsampled to 2 kHz.
Channels with significant artifact and dominated by non-biological noise were removed from further analysis. The number of intracranial and scalp EEG channels used in the analysis of each patient dataset is indicated in Table 1.
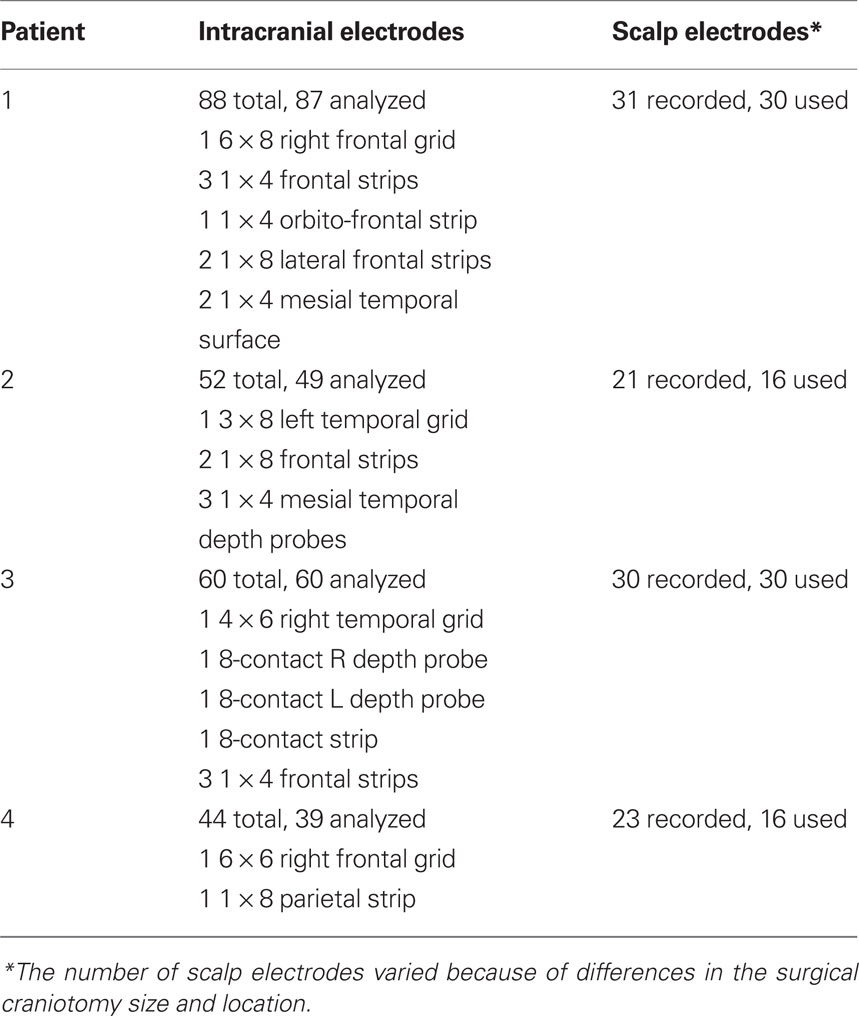
Table 1 Numbers and locations of electrodes.
Line noise (60 Hz noise) and its harmonics were removed on a single channel basis via harmonic analysis (Mitra and Pesaran, 1999; Jarvis and Mitra, 2001) using Matlab based software from http://www.chronux.org. Briefly, multi-taper spectral estimates (Thomson, 1982) were performed on a 1-s sliding widow with 50% overlap. Five tapers were used for each estimate, and a zero padding factor of 210 to ensure high resolution in the frequency domain. A goodness-of-fit F-statistic (Thomson, 1982) was used to determine which frequencies had statistically significant peaks, p < 0.05. The line noise for Patient 4 was statistically insignificant.
Visually Cued Finger Movement Task
Patients participated in a cued finger movement task for language and motor evaluation. The subject was presented with either the text of one finger name (“thumb”, “index”, etc.) among five fingers in one hand, or a picture of one hand with an arrow designating one finger (Figure 1A). Patient volunteers were asked to press the one of 10 keys under each finger corresponding to the stimulus. Trials were time limited to 1.57 s, and failure to respond within the allotted time was considered an incorrect response. Auditory feedback was presented in the form of a brief tone 1.24 s after the stimulus presentation. Two different audio frequencies were used for correct versus incorrect responses. Stimuli were presented in a block design (Figure 1B), in the following order: left hand picture stimuli, right hand picture stimuli, left hand word stimuli, right hand word stimuli, with the presentation of specific fingers in random order within a block. There were 400 trials in total for the task, consisting of 20 picture presentations and 20 text presentations for each finger. The task was performed twice for three of the patients (800 trials) and once for one of the patients. Thereby 400 (Patient 4) or 800 trials (patients 1,2,3) were recorded, yielding recordings from 12.5 min to 25.7 min in duration.
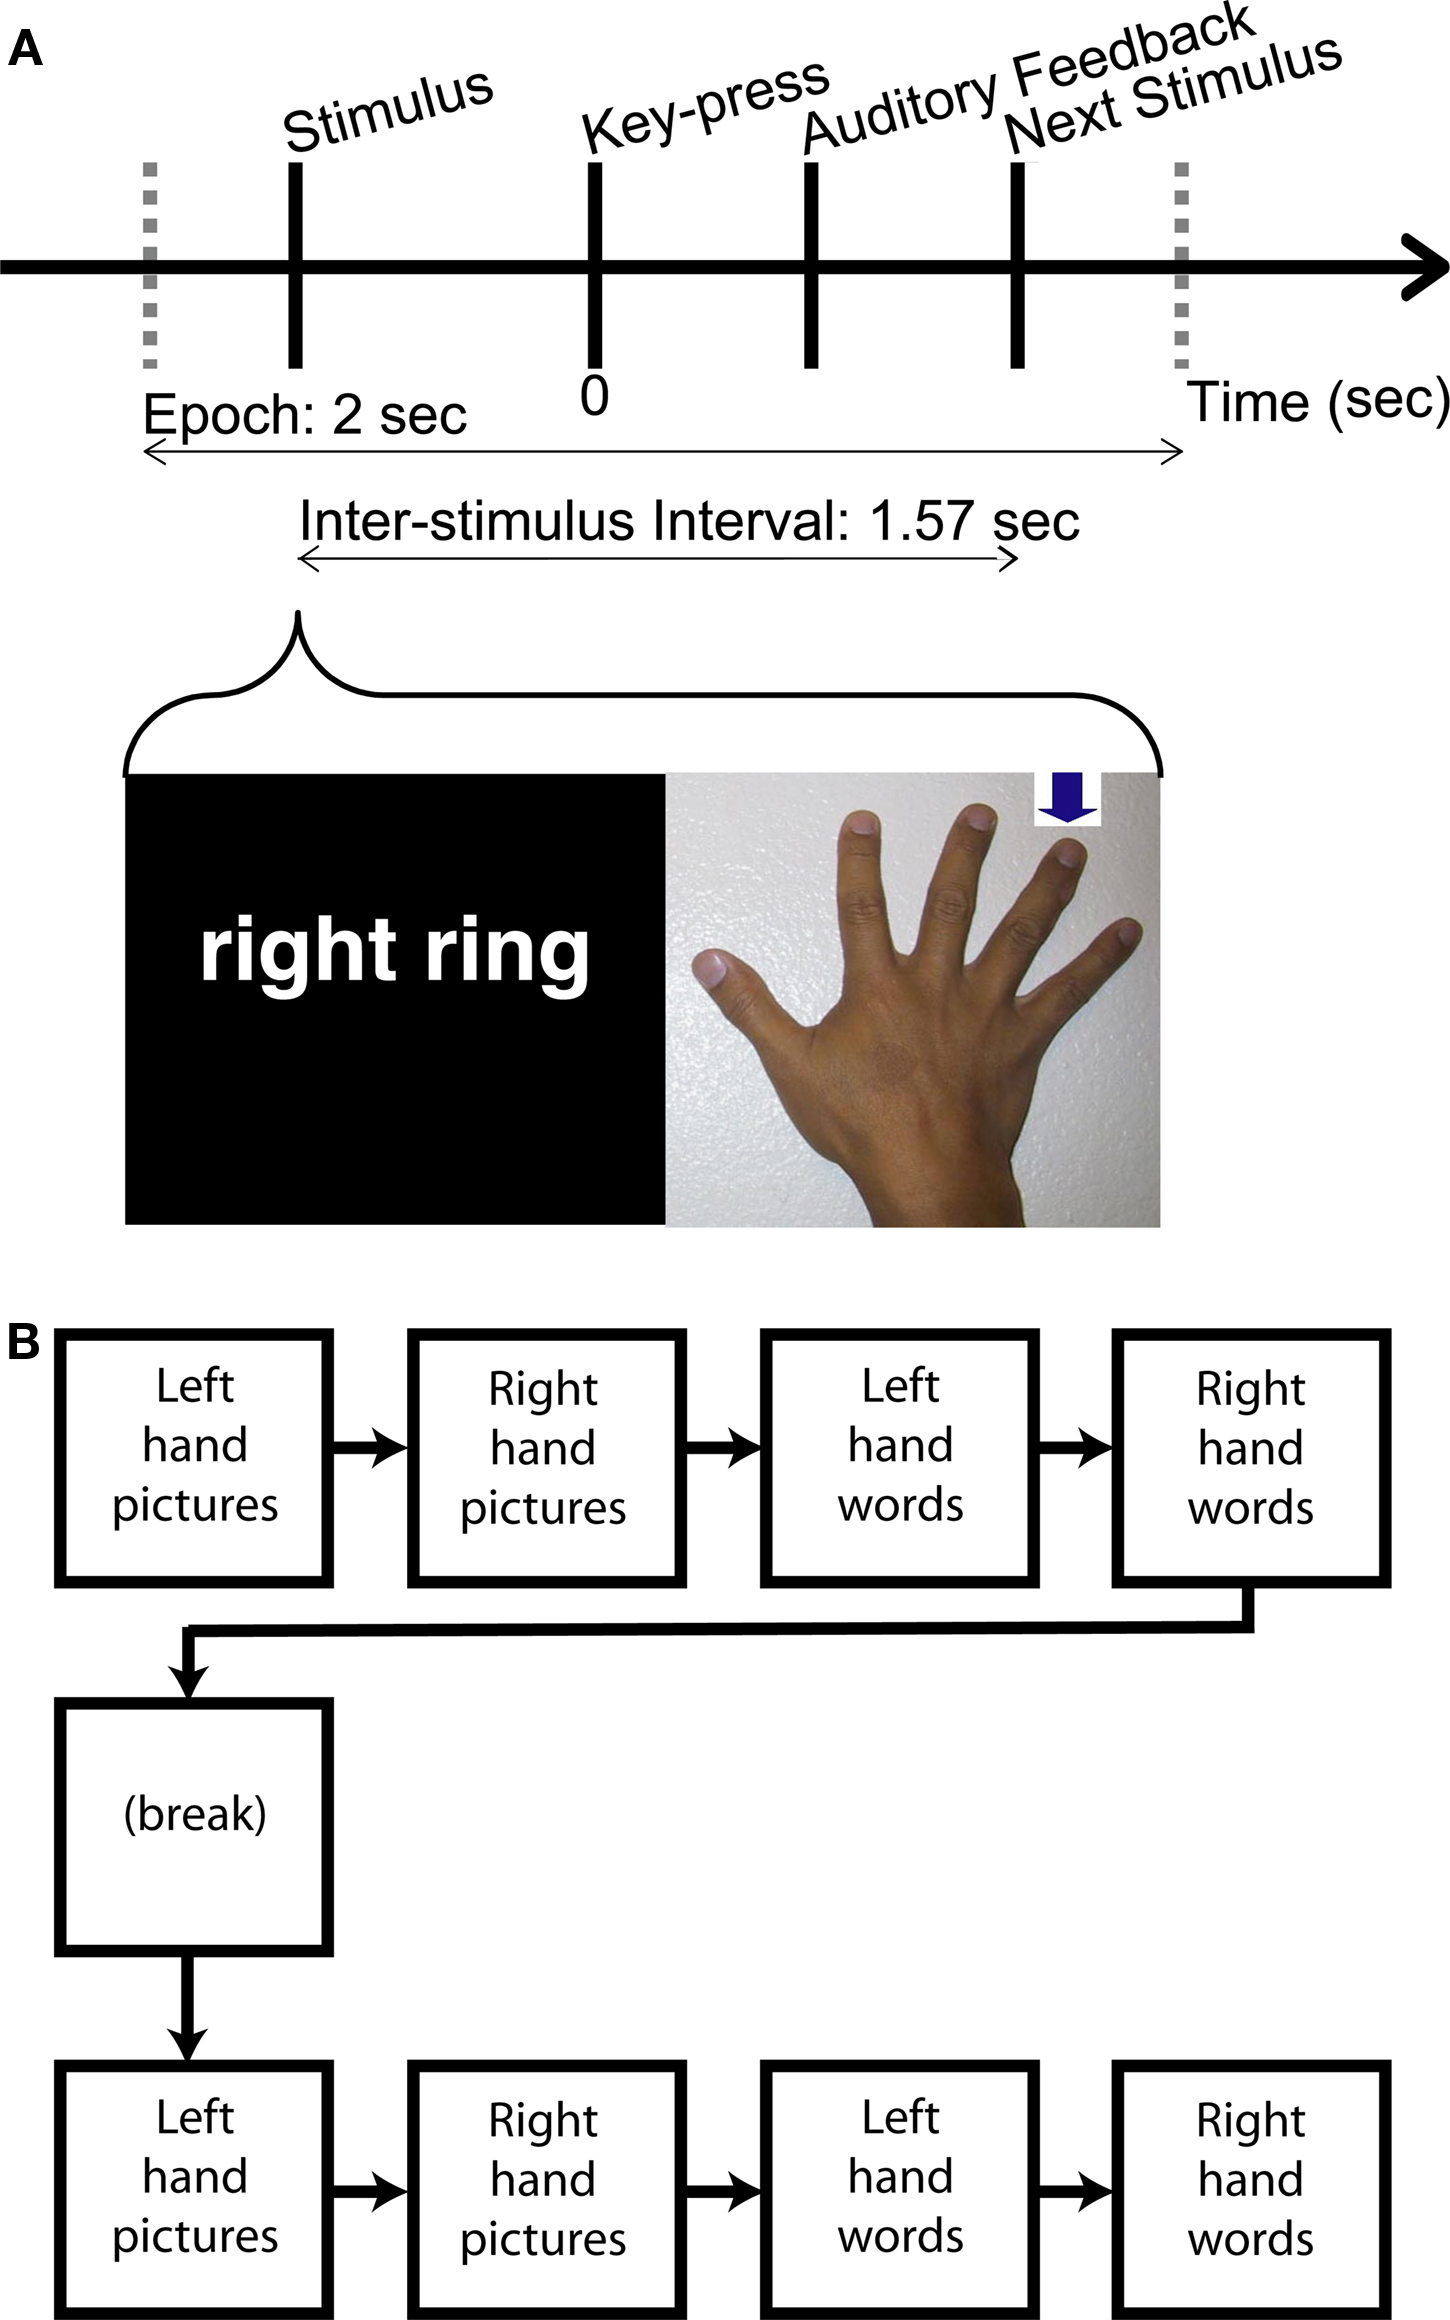
Figure 1. Schematic of visually cued finger movement task. (A) One of 20 stimuli indicating which finger to move is presented to the patient. Half of the stimuli are words naming a finger, and the other half are pictures of a hand with an arrow pointing to a finger. Stimuli are spaced 1.57 s apart. For trial-average spectral changes computed in this study, the data were parsed into 2-s epochs centered on the key-press. (ICA was performed on the continuous data before epoching.) Patients are presented with an audio tone indicating whether their performance on a given trial was correct or incorrect. (B) The study was a block design, with a block for each hand and stimulus type. The presentation of finger stimuli was randomized within a block. The entire experimental task was run twice for Patients 1,2,3 and once for Patient 4.
Electrode Localization
Locations of implanted electrodes were estimated for visualization using the LOC software package of Miller et al. (2007b). Axes in a Talairach coordinate system were identified from post-surgical lateral CT scans of the patient’s brain using glabella and inion skull landmarks. Corresponding Brodmann areas were estimated from the Talairach coordinates using Talairach Daemon software (Lancaster et al., 2000).
Data Analysis
Independent component analysis (ICA)
Extended infomax ICA (Bell and Sejnowski, 1995; Lee et al., 1999) was performed on the intracranial data and separately on the scalp EEG from each patient. In the ICA model, a set of recorded time series X(t) is the linear combination of a mixing matrix, A, and a set of source signals, S(t).

The solution to ICA is an unmixing matrix, W, that when multiplied by the original data produce a set of maximally independent time series “activations” U(t).

Multiplying both sides of the equation by the pseudo-inverse of W gives a description of the original data as the product of a mixing matrix W(−1) and the component time series or activations matrix U(t) * W(−1) is a square matrix with ICs represented in columns and electrodes represented in rows.

Note that the unmixing matrix W is the inverse of A when the activations U(t) are the activities of the underlying sources S(t). In practice, U and S may differ in the order of the components and in their unit scales and/or polarities, since an altered scale and/or reversed polarity of a component time signal in U(t) can be cancelled out by an inversely altered scale and/or reversed polarity of the component scalp map in the corresponding column of W(−1).
Pair-wise mutual information
Mutual information based on differential entropy was computed between pairs of channels or pairs of components. Differential entropy, the extension of information entropy to continuous random variables, was used here in mutual information calculations because recorded voltages can take on continuous values. Mutual information between two random variables X and Y is based on differential entropy (Cover and Thomas, 2006) and defined as

where h(X) and h(Y) are the marginal differential entropies for X and Y, respectively based on the marginal probability densities p(x) and p(y), and h(X,Y) is the joint differential entropy based on joint probability density p(x,y).

Note that statistical independence can only be precisely determined on an infinite dataset. The marginal and joint probability densities were approximated in Matlab using Riemann sums as

where Ni is the number of values in the ith bin, N is the total number of values, and Δx is the bin size. The Δx factor in the denominator ensures that the area under the probability density function sums to unity. Differential entropy then becomes:

when the formula for differential entropy from Eq. 7 is substituted into Eq. 4, the Δx and Δy cancel out, giving

The time series data were divided into 100 bins for the entropy estimates of all channels and components, which used a bin size of 7.5–15.5 s depending on the length of the patient’s dataset.
Percent variance accounted for (PVAF)
The relationship between a channel's activity and the activity of independent components was quantified by percent variance. The percent variance accounted for (pvaf) by component j of the signal Xi(t) at channel i was computed as:

Here, Xi(t) is the time series for the ith channel, W−1 is the ICA mixing matrix, Ui is the activation time series of the ith component, Xj,i is the back-projection of component j to channel i, and var() is variance over time t.
Spectral analysis
The time series of channels and independent components were de-trended with a high-pass Butterworth filter with a pass-band above 2 Hz, and 40-dB attenuation at the stop band of 1 Hz. Time series were subsequently low-pass filtered with a Butterworth filter with a 200 Hz pass-band limit, with 60 dB attenuation in the stop band at 240 Hz.
Baseline-normalized trial-average event-locked spectral estimates were performed on 2-s trials centered on the key-press. Spectra were estimated as an average over K = 5 independent tapers using the multi-taper method (Thomson, 1982; Percival and Walden, 1993; Mitra and Pesaran, 1999; Jarvis and Mitra, 2001) based on a single-tapered sliding 250-ms window with 10-ms overlap. The baseline for a trial was the average spectral change of a given frequency band over the entire 2-s epoch.
Spectral power and coherence estimates for channels and component signals exhibiting pathological slow wave activity were estimated as an average over five independent estimates using the multi-taper method applied to consecutive 10-s segments of time series data that was pre-filtered with a Butterworth low-pass filter with an edge frequency of 40-Hz and 60-dB attenuation by 60 Hz. The confidence limit for the magnitude of the coherence across all frequencies was estimated by

in which P = 0.05 represents the 95% confidence limit, N is the number of trials or epochs, and NK the number of degrees of freedom (Jarvis and Mitra, 2001; Berg et al., 2006).
Results
To test whether the iEEG and scalp EEG channels were not themselves mutually independent, we first asked whether the time series of the intracranial ICs were more statistically independent than the time series of the intracranial channels themselves. To do this we computed pair-wise mutual information between all pairs of channels and between all pairs of IC time series. The histograms in Figure 3 demonstrate that pairs of iEEG channels have higher pair-wise mutual information than pairs of iEEG ICs, with as expected a larger reduction produced by ICA for scalp EEG channels than for iEEG channels. Table 2 indicates the mean and range of values.
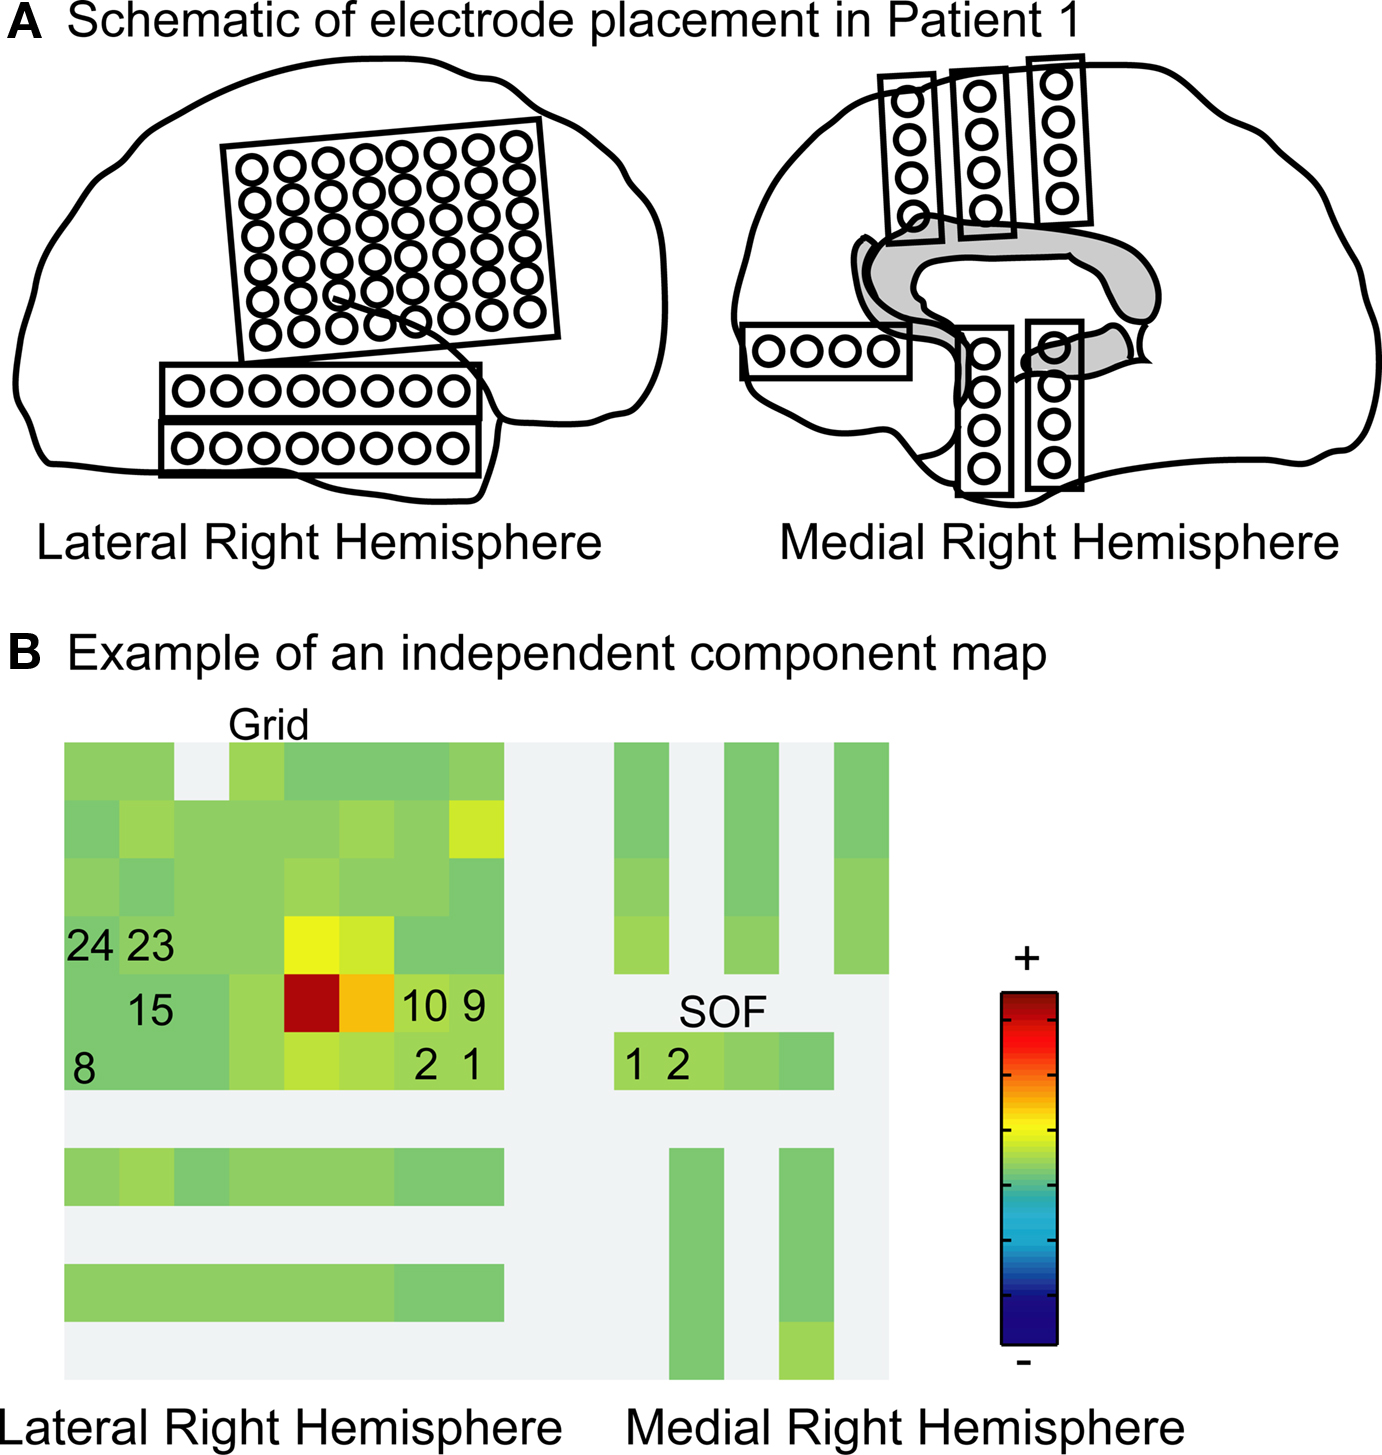
Figure 2. Example independent component. (A) Schematic of electrode placement for Patient 1 (not to scale). Lateral view of right hemisphere on the left, and medial view of right hemisphere on the right. (B) Example map from one independent component. Each square represents an electrode from (A). Electrodes referred to in later figures and text (e.g., Grid9, SOF1, etc.) are labeled here.
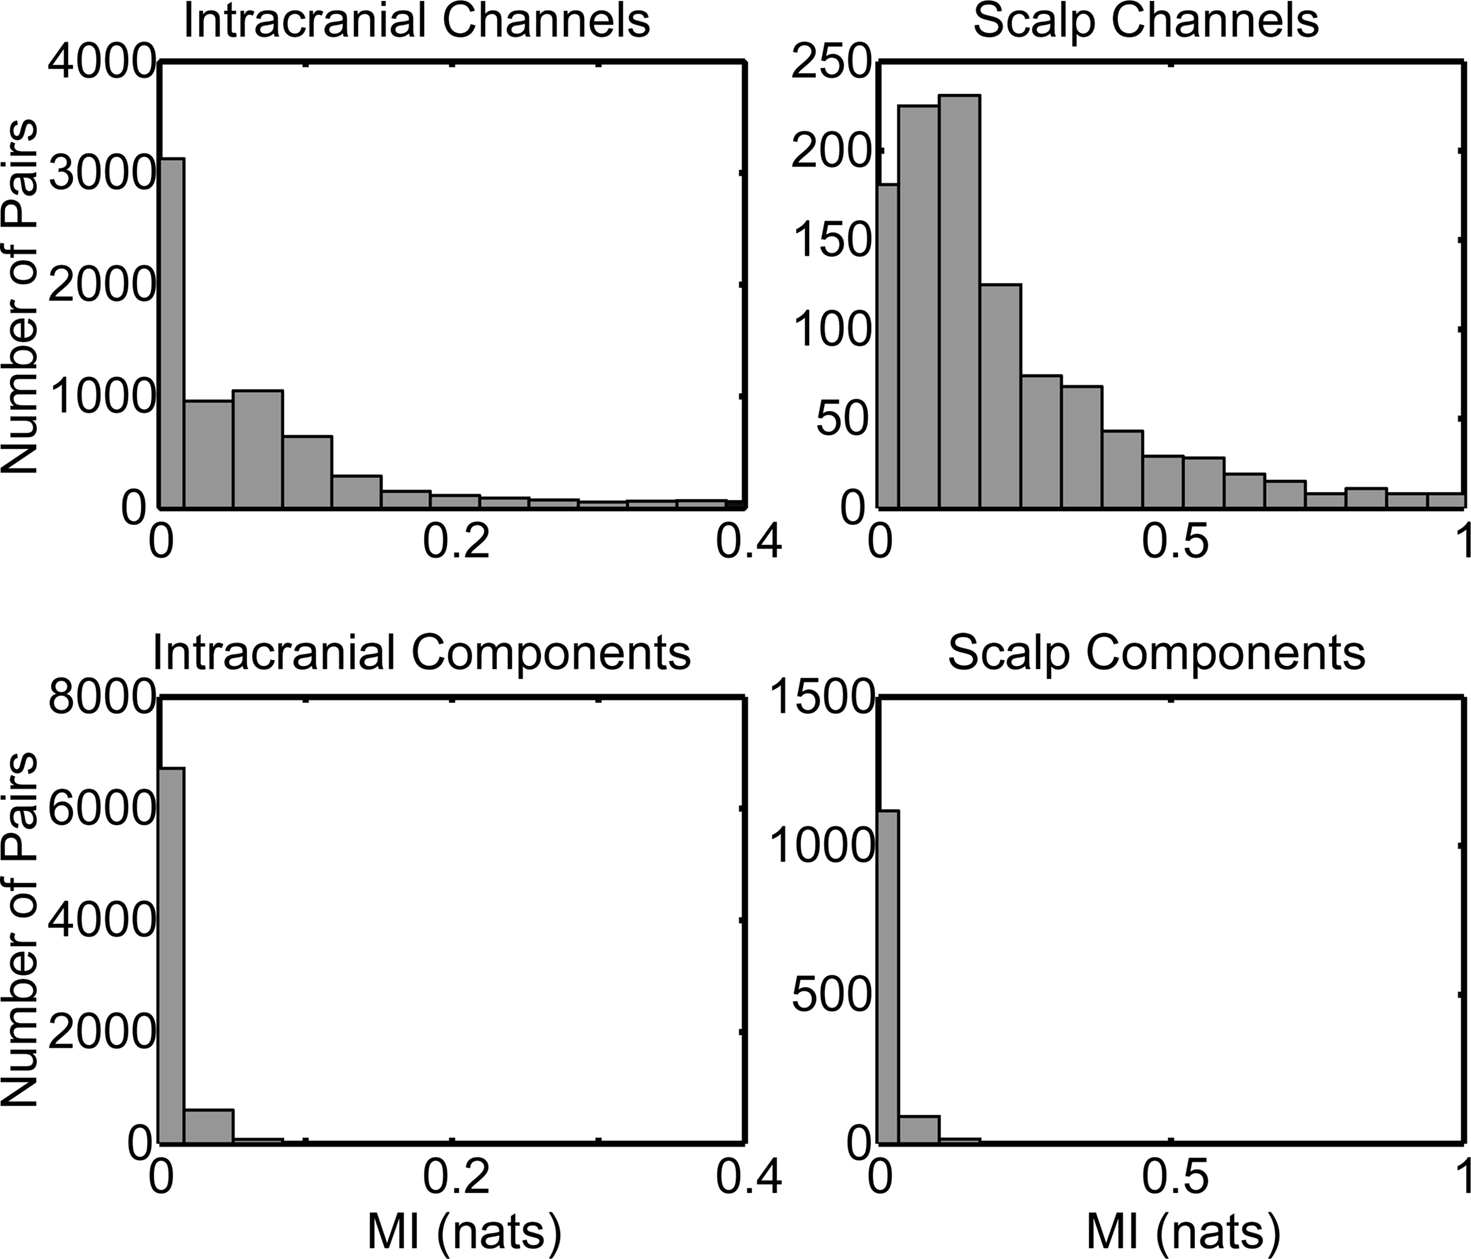
Figure 3. Reduction in pair-wise mutual information of independent components as compared to channels. Histograms of normalized pair-wise mutual information between channels (top row) and between independent components (bottom row) returned from ICA performed on intracranial data (left) and on scalp EEG (right). As expected, the pair-wise mutual information of independent components is greatly reduced as compared to the pair-wise mutual information of channel recordings. The plot combines results from the recordings of four patients. Nats are the units of mutual information using the natural logarithm.
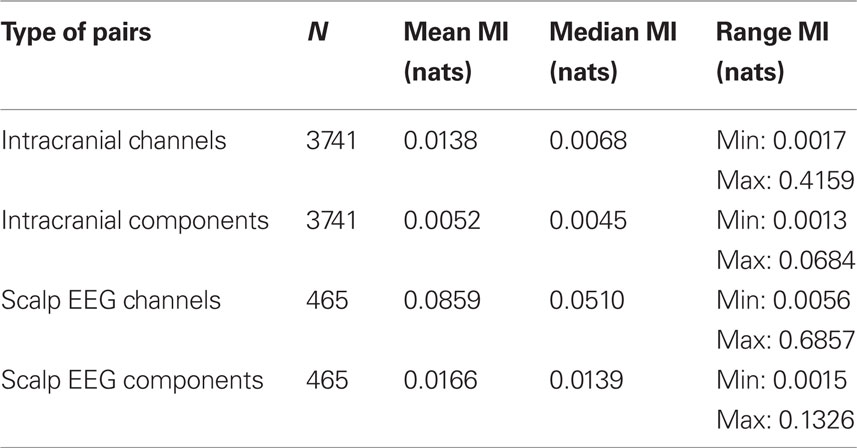
Table 2. Statistics on histogram of the pair-wise mutual information for Patient 1.
The quantitative relationship between channels and components was then assessed with a “percent variance accounted for” (PVAF) metric. The percent variance of each iEEG channel accounted for by its maximum IC (component that accounts for the maximal percent variance of that channel) is depicted for Patient 1 (Figure 4A). If intracranial channel signals were independent (e.g., if arising from activity in wholly separate cortical domains), their maximal ICs would each account for 100% of their signal, and the plotted squares in Figure 4A would appear white for all the depicted electrode channels. Instead, as Figure 4A shows, the variance contributed to each intracranial channel by its largest-contributing IC ranged from only 21.5% to 92.6% (Figure 4B). For Patients 2, 3, and 4, these limits were 15.9–77.6%, 21.1–90.1%, and 5.42–94.9%, respectively. The distribution from all four patients, shown in Figure 4C, exhibited a broad range with a mean under 50%.
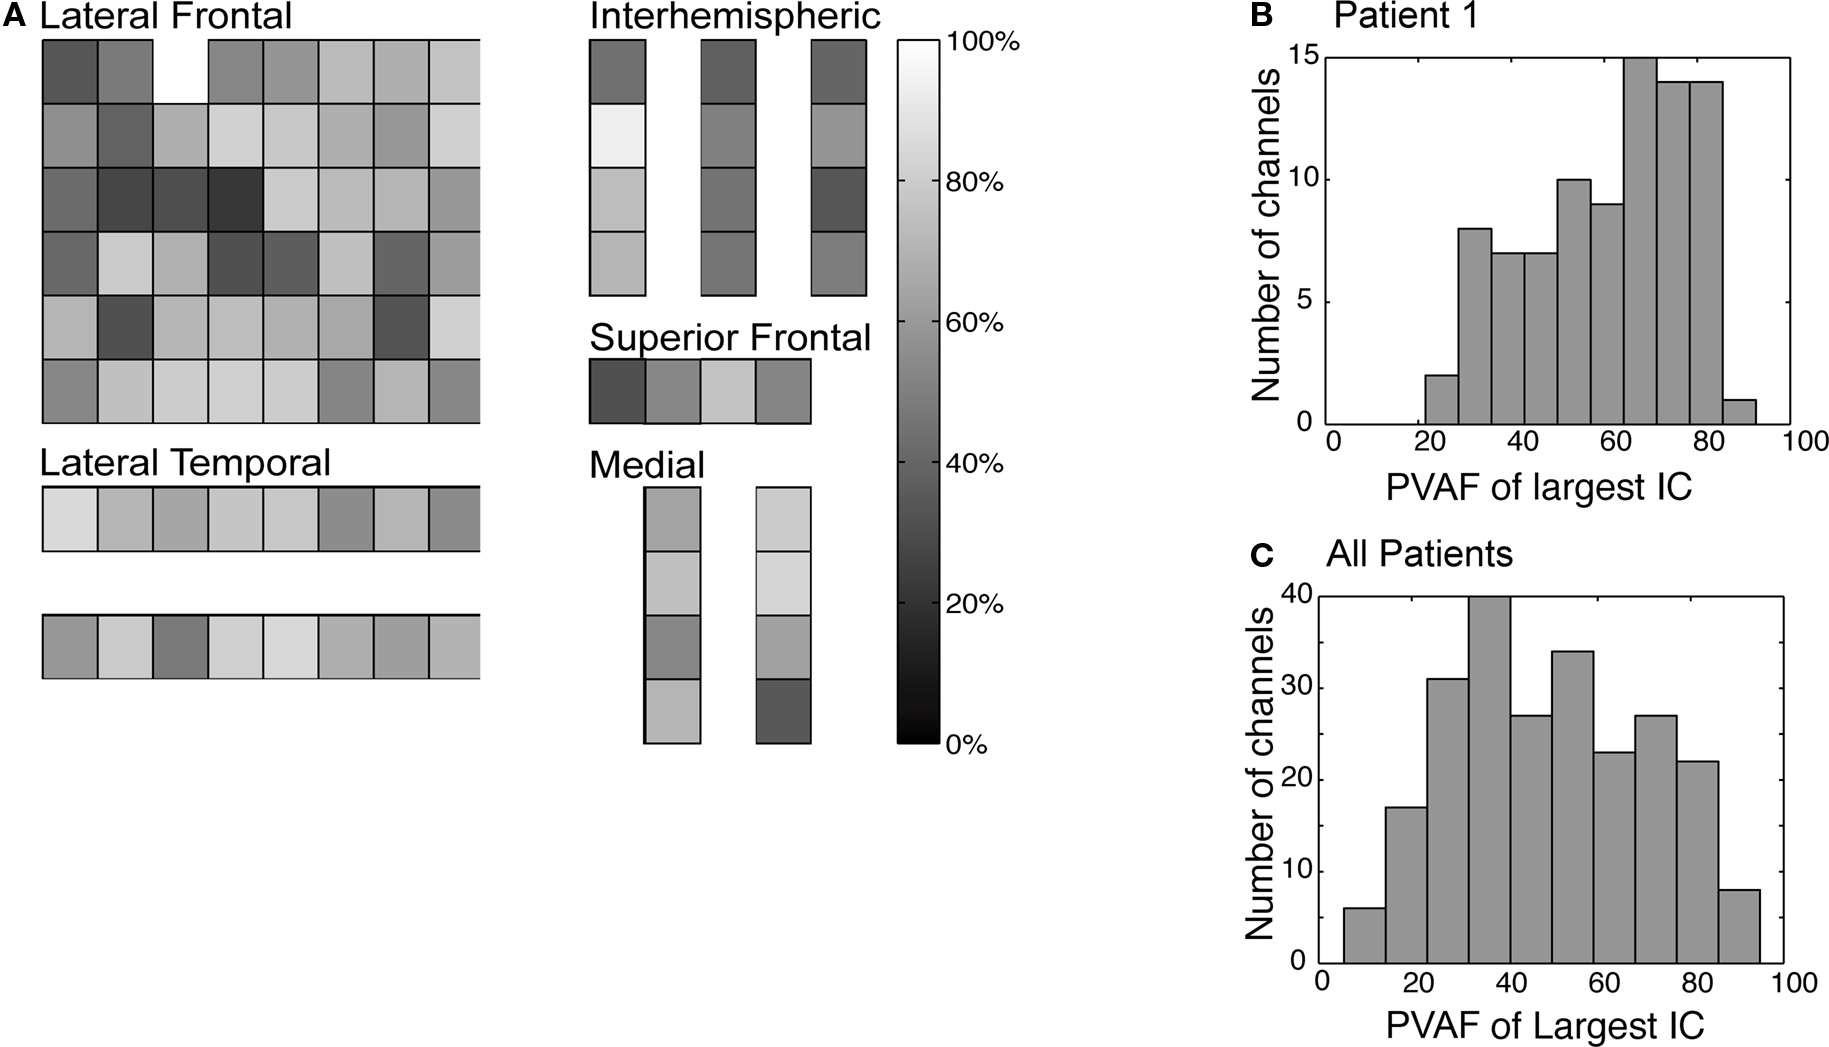
Figure 4. Range in percent variance of each intracranial channel accounted for by its maximum component. (A) Quasi-topographic display of intracranial (iEEG) channels for a single patient, from a medial view of the right hemisphere (left) and lateral view of the right hemisphere (right). The percent variance of an iEEG channel’s activity accounted for by its maximum component indicated with the gray scale. Individual iEEG channels exhibit a wide range in how much of their variance is accounted for by a single component. Channels shown in white are dominated by a single independent component, whereas channels in dark gray are accounted for by a linear combination of multiple components. (B) Histogram of maximum percent variance of iEEG channels shown in (A). A range of values is demonstrated. (C) Combined histogram of the percent variance of maximal independent component projection to each iEEG channel, across all four patients. The range in maximum percent variance accounted for (PVAF) is similar for all patients.
We next examined the maps visualized by plotting columns of the ICA mixing (inverse weight) matrix and asked whether they were ordered and consistent with an origin in a focal brain area, by i.e., resembling plausible projections of a single distal or proximal source area contributing to the affected channels through volume conduction. We find iEEG IC maps to be separable into a few categories: (a) proximal ICs, (b) diffuse ICs, (c) complex ICs, and (d) noisy ICs. Figure 5 shows example IC maps from Patient 1 in the first three categories. The bar chart in Figure 6 depicts the fraction of IC maps judged to fall into each category for each patient. The criteria used were as follows: maps that projected to no more than two electrodes were categorized as “focal”; maps that projected to more than two contiguous electrodes were categorized as “diffuse”; maps that projected to multiple sets of contiguous electrodes were categorized as “complex”; remaining maps from (mostly small) components whose maps appear to project to iEEG channels in a disordered manner were categorized as “noisy”.
Figure 5. Examples of independent component maps. (A) Four example components with focal grid maps. (B) Examples of components with more diffuse grid maps. These component maps could represent the projections of more focal current sources distal from the grid, or synchronous activity of a wider domain of cortex proximal to the implanted grid. (C) Set of components that project to widely separated electrode channels.
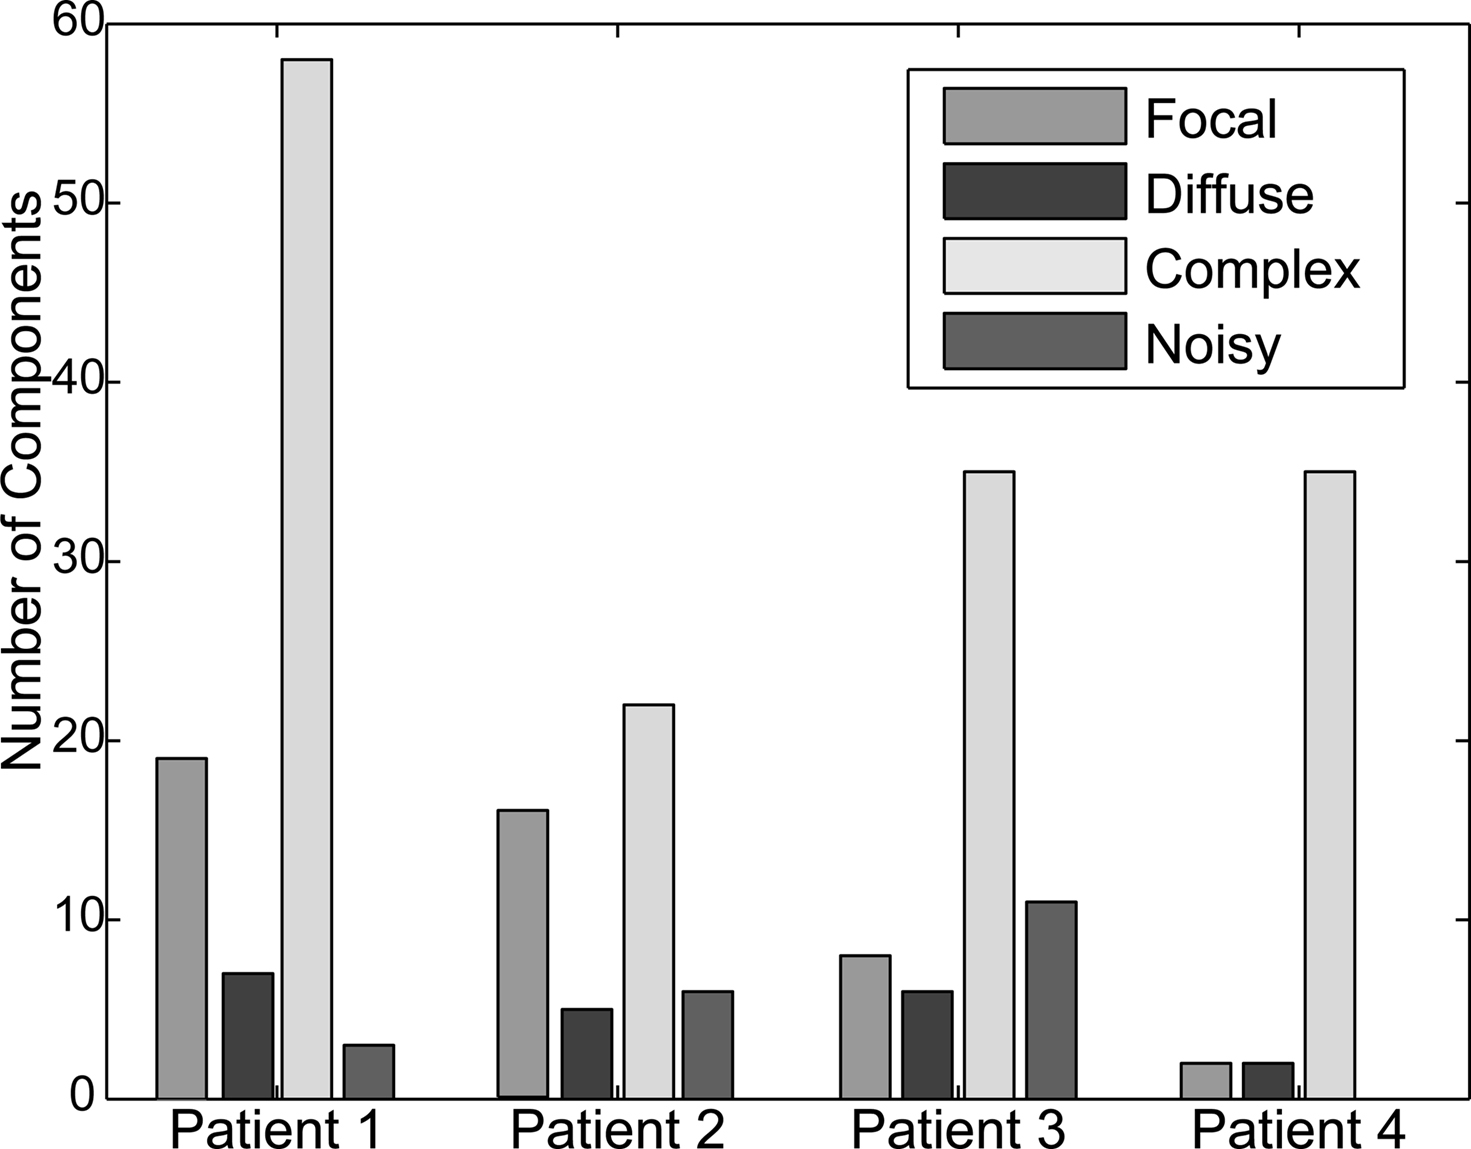
Figure 6. Classes of component maps. Percentage of components for each patient falling into each of the four categories based on visual inspection and manual classification.
The strongest assessment of the utility of ICA for analysis of intracranial EEG data is to examine whether the resultant ICs separate functionally meaningful brain signals. Because these data were acquired from epilepsy patients who performed a visually cued movement task, we could look for both interictal pathological as well as motor task-related brain dynamics. Patient 1 had a 6 × 8 iEEG grid implanted over right frontal cortex plus electrode strips over a variety of cortical areas including lateral temporal lobe, medial temporal lobe, and medial frontal areas (see Figure 2 and Table 1). The etiology of Patient 1-s partial epilepsy was a structural abnormality in the medial frontal lobe, with pathology demonstrating cortical dysplasia (Kuzniecky et al., 1995). Frontal scalp EEG signals demonstrated increased power in the delta frequency band as compared to other electrodes. More specifically, the iEEG data exhibited episodes of rhythmic moderate amplitude delta frequency activity on the following set of frontally located channels: Grid1, Grid2, Grid9, Grid10, SOF1, and SOF2. Five of the 87 ICs, totaling 21.8% of the variance of the intracranial data, projected to some of these six grid channels.
Figure 7 shows an example of one of these, IC3, which projects strongly both to a single lateral frontal channel (Grid1) as well as to the most anterior two channels of the orbito-frontal strip (SOF1, SOF2). A sample 2-s segment of IC3 activity, and the whole iEEG signals at three channels to which it most strongly projects are shown in Figure 7B, an example of abnormal delta activity on intracranial channels.
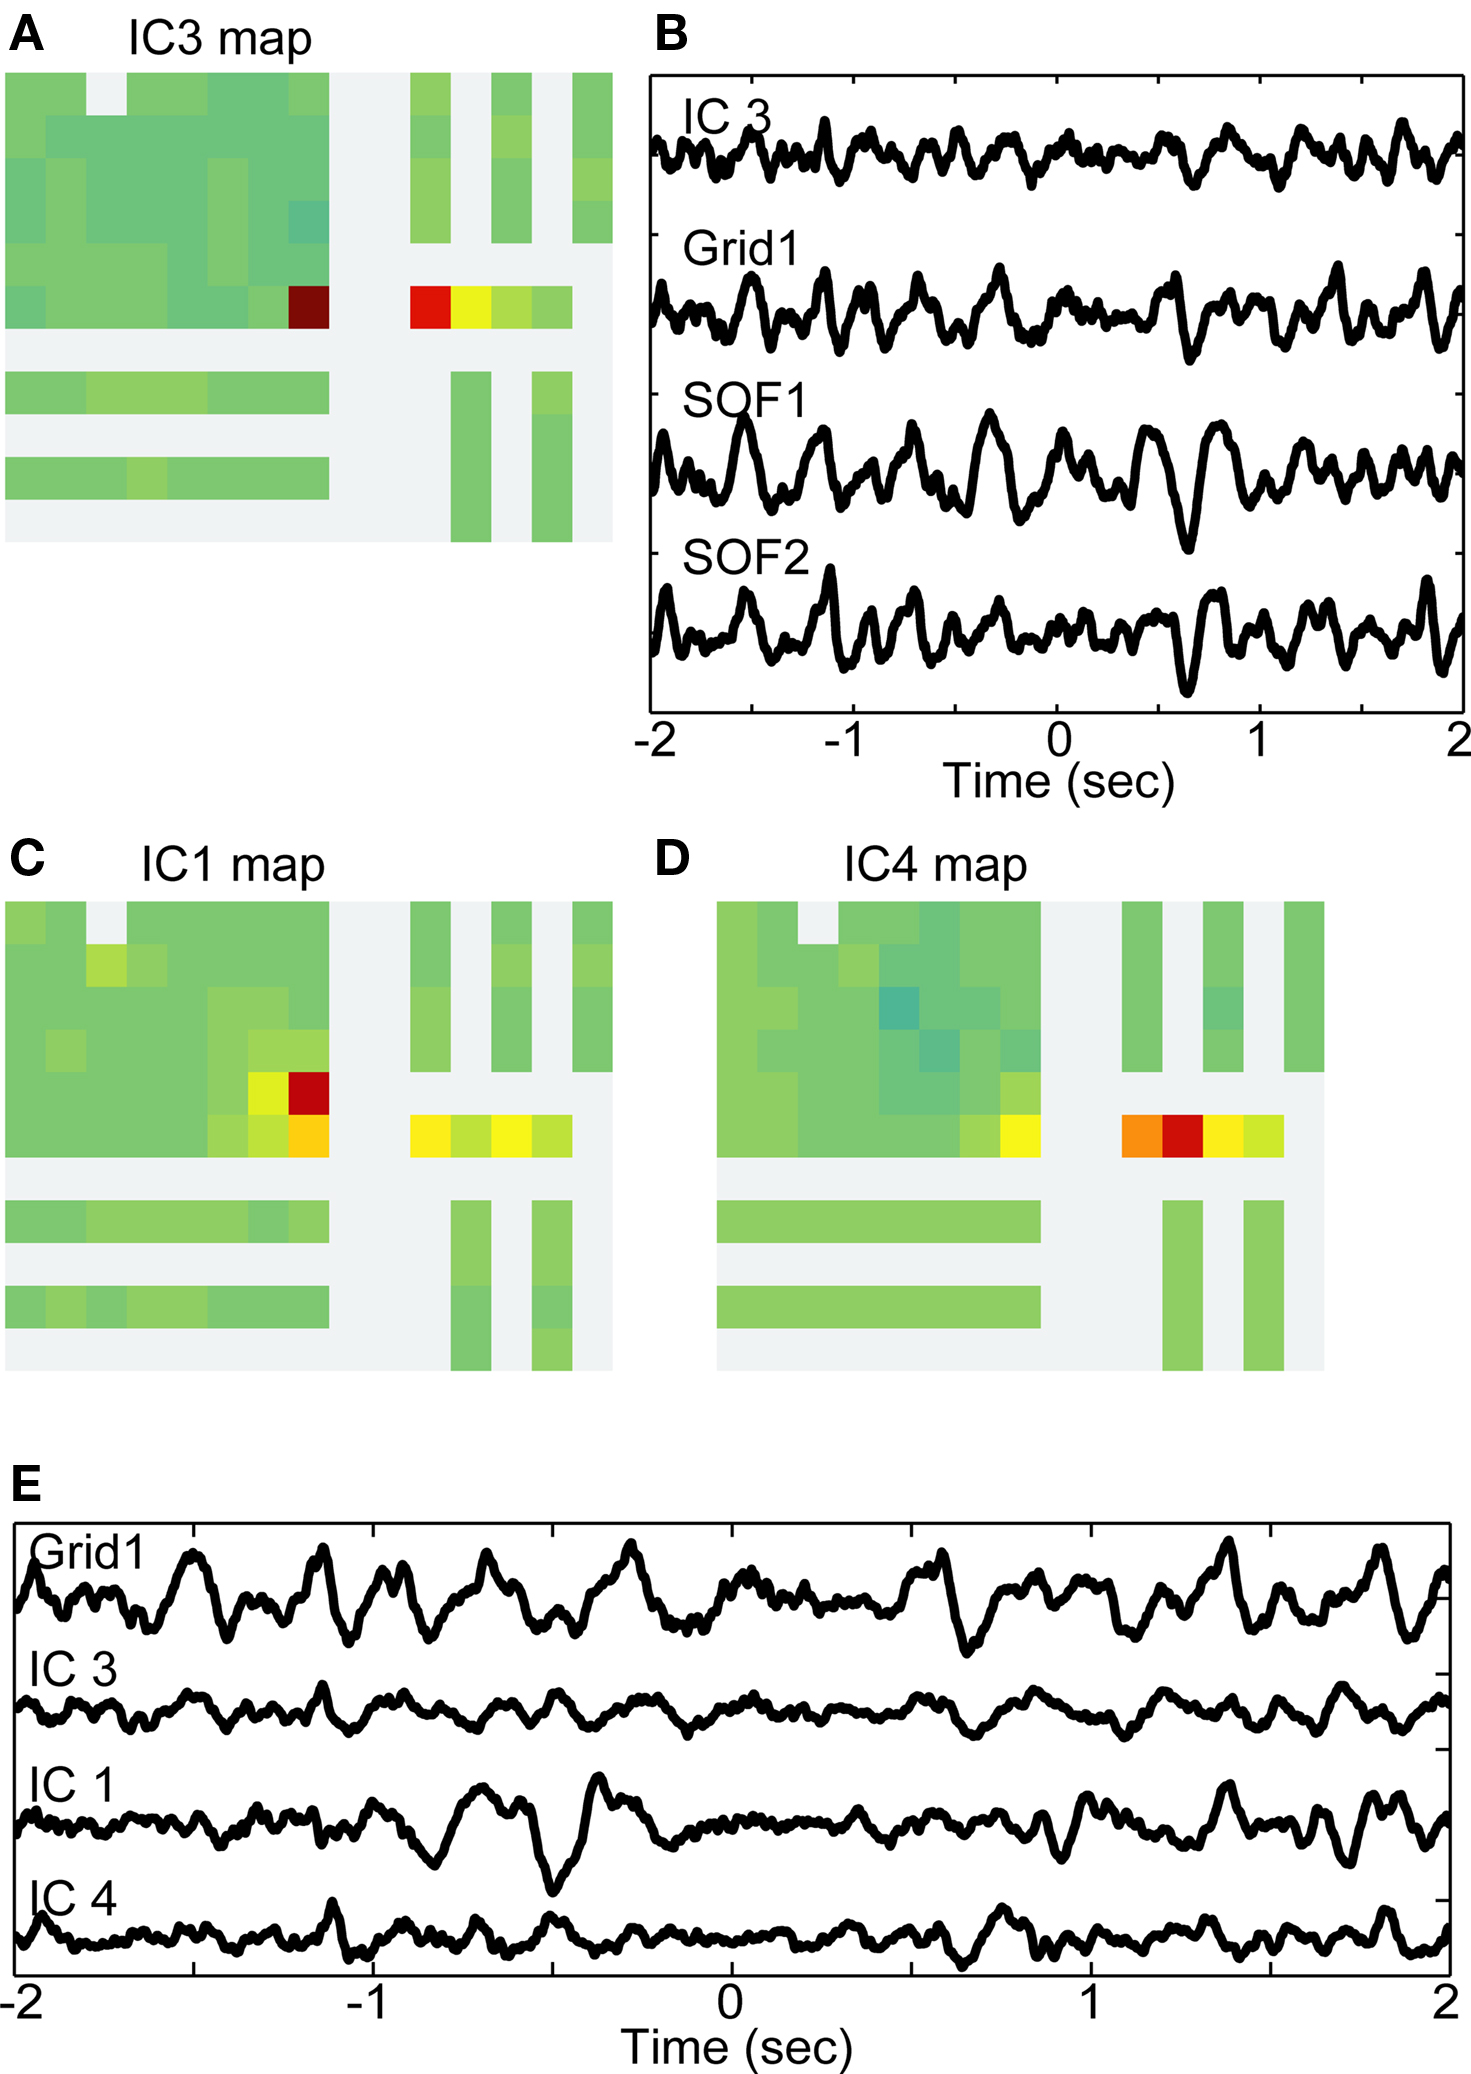
Figure 7. Multiple independent components associate lateral and medial frontal channels with interictal delta activity. (A) Map from independent component 3 (IC3) projecting to Grid1 and to two adjacent channels from the superior orbital frontal strip: SOF1 and SOF2. (B) Example 2-s time series from IC3 and the three channels to which it projects in varying degrees. (C) Map of IC1 projecting most strongly to Grid9 (red-colored electrode), but also to Grid1, SOF1, SOF3, and Grid10. (D) Map of IC4 projecting most strongly to SOF2 (red), but also SOF1 (orange), Grid1 (yellow), and SOF2 (yellow). (E) Example 2-s time series from Grid 1 and thethree independent components with maps shown in A, C, and D.
The log power spectrum of IC3, based on the average of spectral estimates of contiguous 10-s segments of the data, contained a peak at 3 Hz. The two channels to which the map of IC3 most strongly projects, Grid1 and SOF1, has significant power in the 2 Hz to 6 Hz band (Figures 8A and 8B), and the coherence of the two channels was statistically significant between 2 and 6 Hz (Figure 8C). For comparison, the coherences between Grid1 and its five next-to-nearest neighbor channels were computed. Before computing coherence, the data were first high-pass filtered at 2 Hz to provide a conservative estimate of the delta band coherence. These channels did not exhibit pathological delta activity and were not weighted in any of the IC maps projecting to Grid1. The mean coherence between Grid1 and these other five channels was insignificant at all frequencies (Figure 8D).
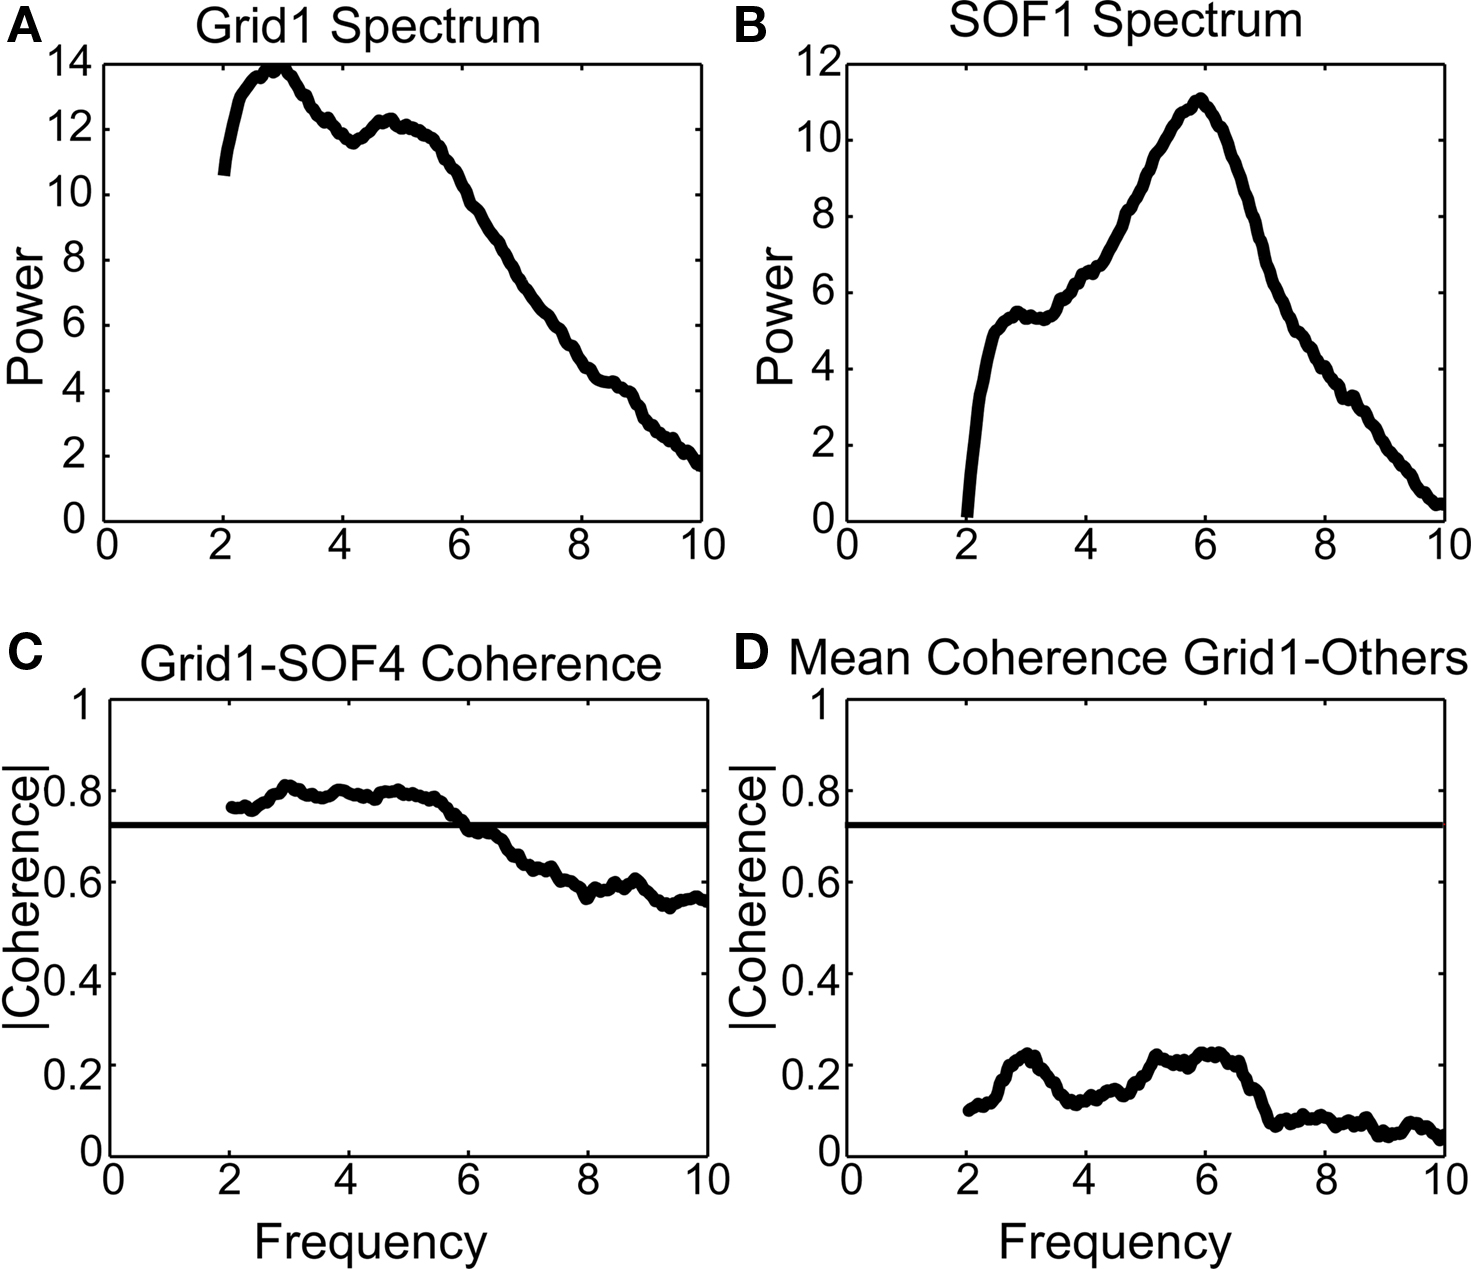
Figure 8. Low-frequency coherence between channels identified by independent component 1 (IC1). (A) Multi-taper power spectral estimates intracranial channel Grid1. (B) Multi-taper power spectral estimate of intracranial superior orbital frontal channel SOF1 (Figure 7A). (C) The two channels, identified by IC3 in Figure 2, are significantly coherent in the delta band, consistent with the clinical report describing “episodes of coincident rhythmic moderate amplitude delta frequency” on these electrodes. (D) By contrast, the coherence of Grid1 with each of its next-nearest neighboring channel is not statistically significant; the average of these five coherences is shown here.
ICA also identified components exhibiting classic movement-related dynamics. Grid24, an iEEG channel in or near primary motor cortex Brodmann area 4 of Patient 1, exhibited classic movement-related spectral changes including peri-movement alpha and beta range power decreases and simultaneous gamma band power increases. ICA decomposition of this patient’s data revealed one component with a strong projection to Grid24. IC18 accounted for 89% of the activity on Grid24 (Figure 9), and demonstrates the same alpha, beta, and gamma band movement-related spectral changes seen on Grid24 (Figure 9).
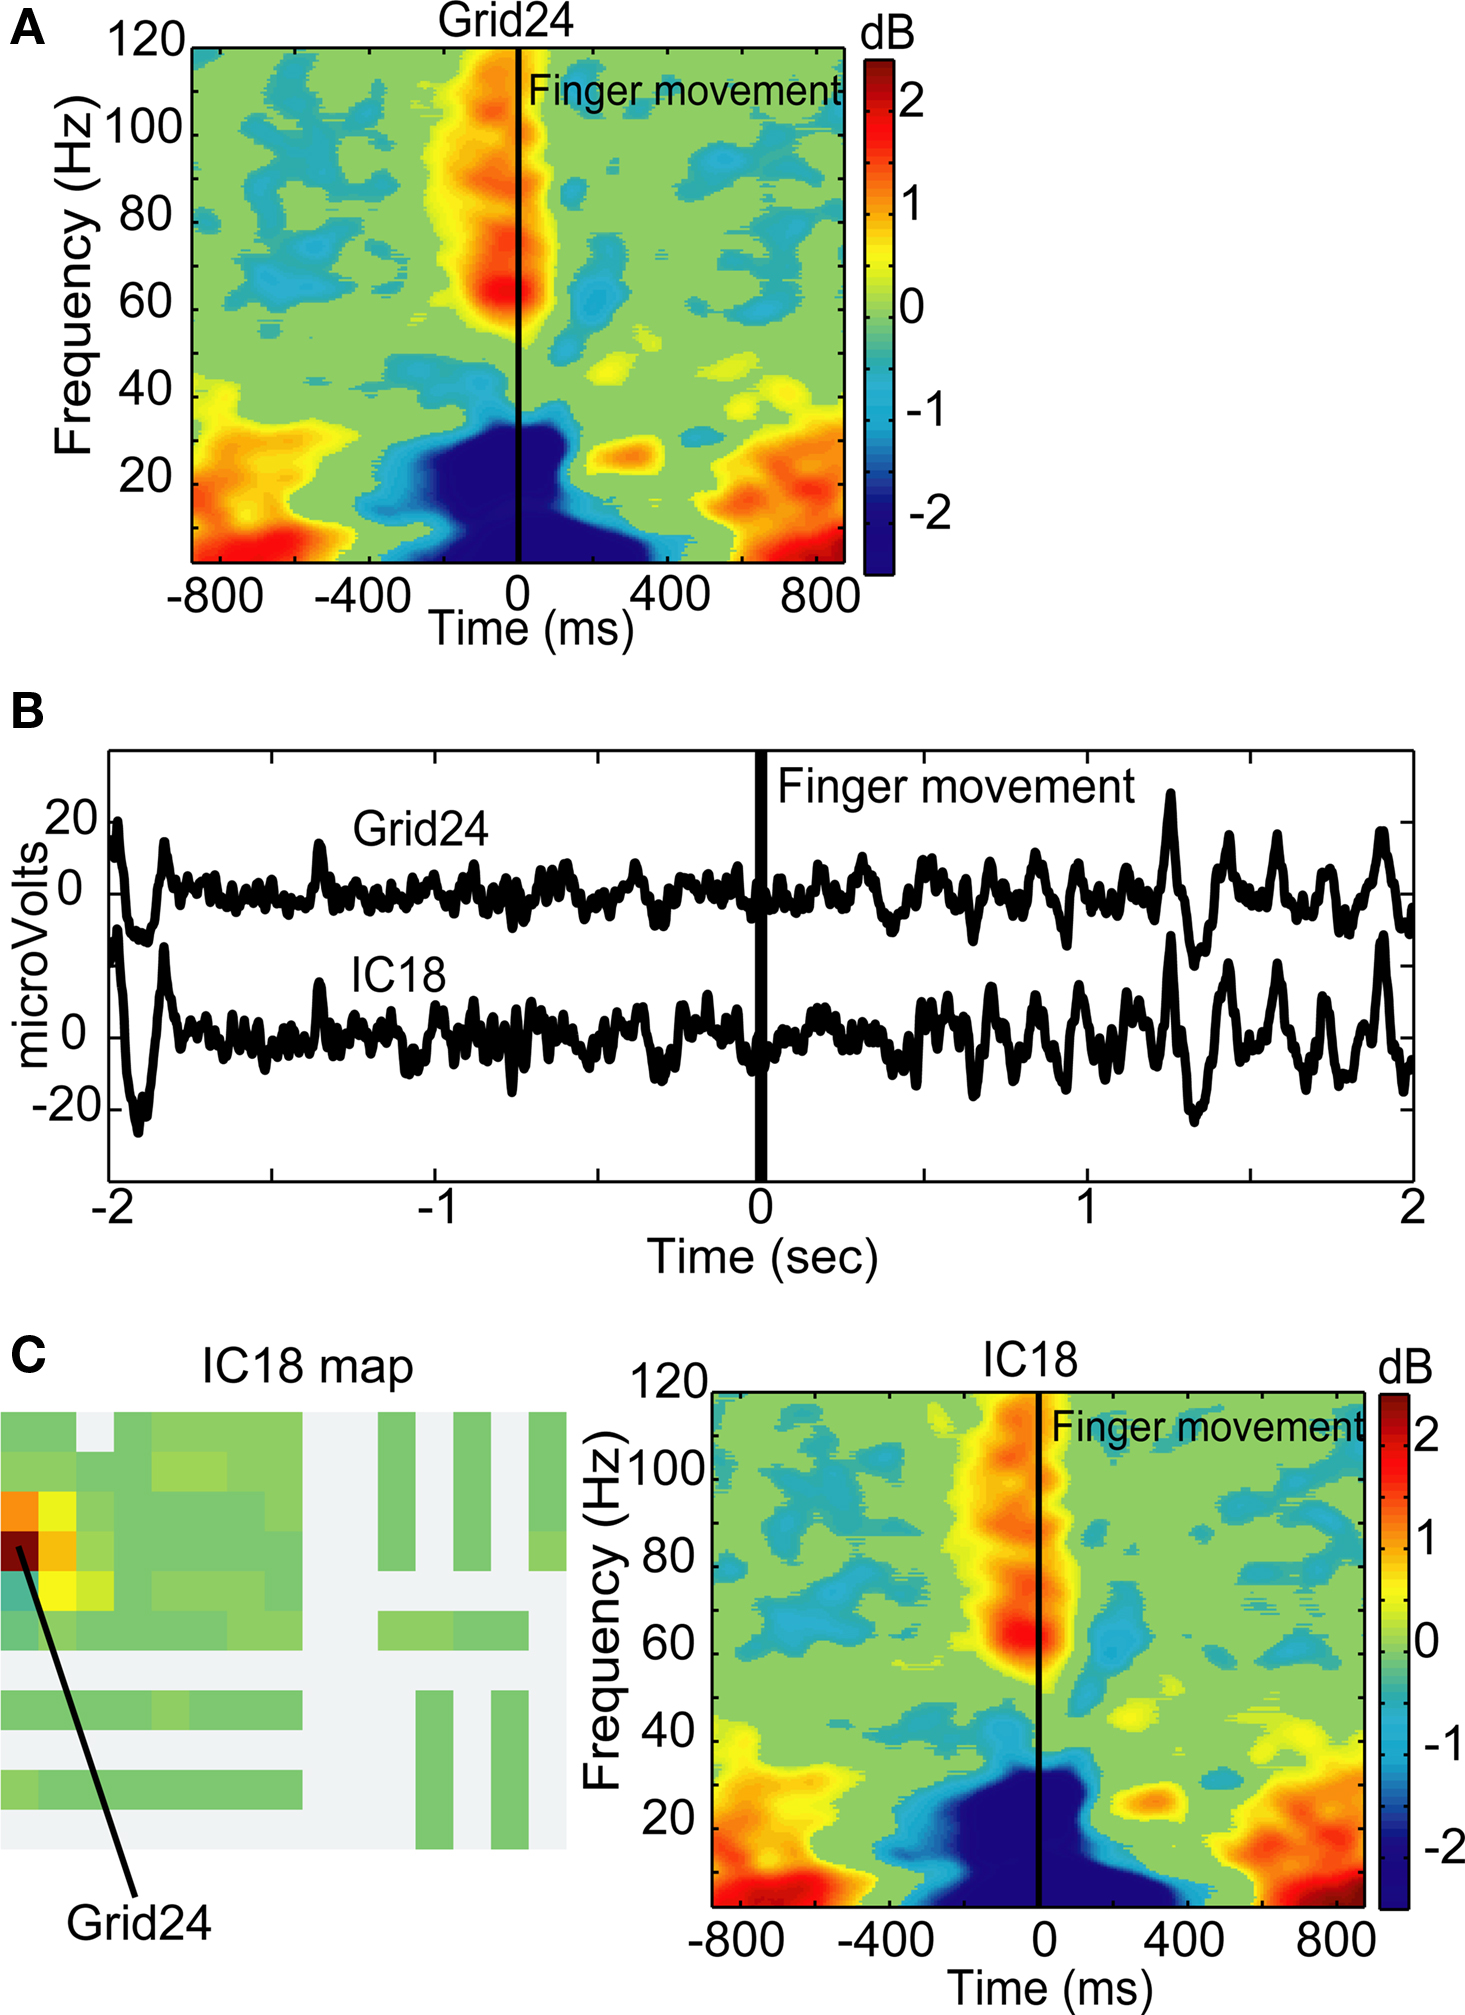
Figure 9. Mu blocking and movement-related spectral dynamics. (A) Trial-average event-locked log power spectrum for Grid24, an electrode in or near primary motor cortex (compare C). (B) Time series of Grid24 and IC18 from an example 2-s segment including the finger movement (at 0 ms). Suppression of mu began approximately 1.7 s before the movement and lasted until 0.5 s after movement onset. (C) Component map and trial-average event-locked log power spectrum for IC18. The grid map of IC18 maximally back-projects to Grid24 with smaller projections to neighboring channels. IC18 shows strong gamma increase during the movement and concurrent power decreases in both the beta and alpha power bands.
IC23 (Figure 10A) separates out the alpha and beta activity associated with mu blocking, but without the gamma component. IC23 projects predominantly to Grid23, which is in or near Brodmann area 6 corresponding to pre-motor and supplementary motor cortex. Two additional components demonstrated event-related spectral changes time-locked to the movement, but with slightly different temporal dynamics of gamma power and with maps projecting to different subsets of channels. IC68 shows a strong gamma power increase time-locked to the movement and projects most strongly to Grid15 which is in or near Brodmann area 6 corresponding to pre-motor and supplementary motor cortex (Figure 10B). IC63 shows a gamma power increase tens of milliseconds after the movement and a strong projection to Grid8, which is in or near the superior temporal gyrus (Figure 10C).
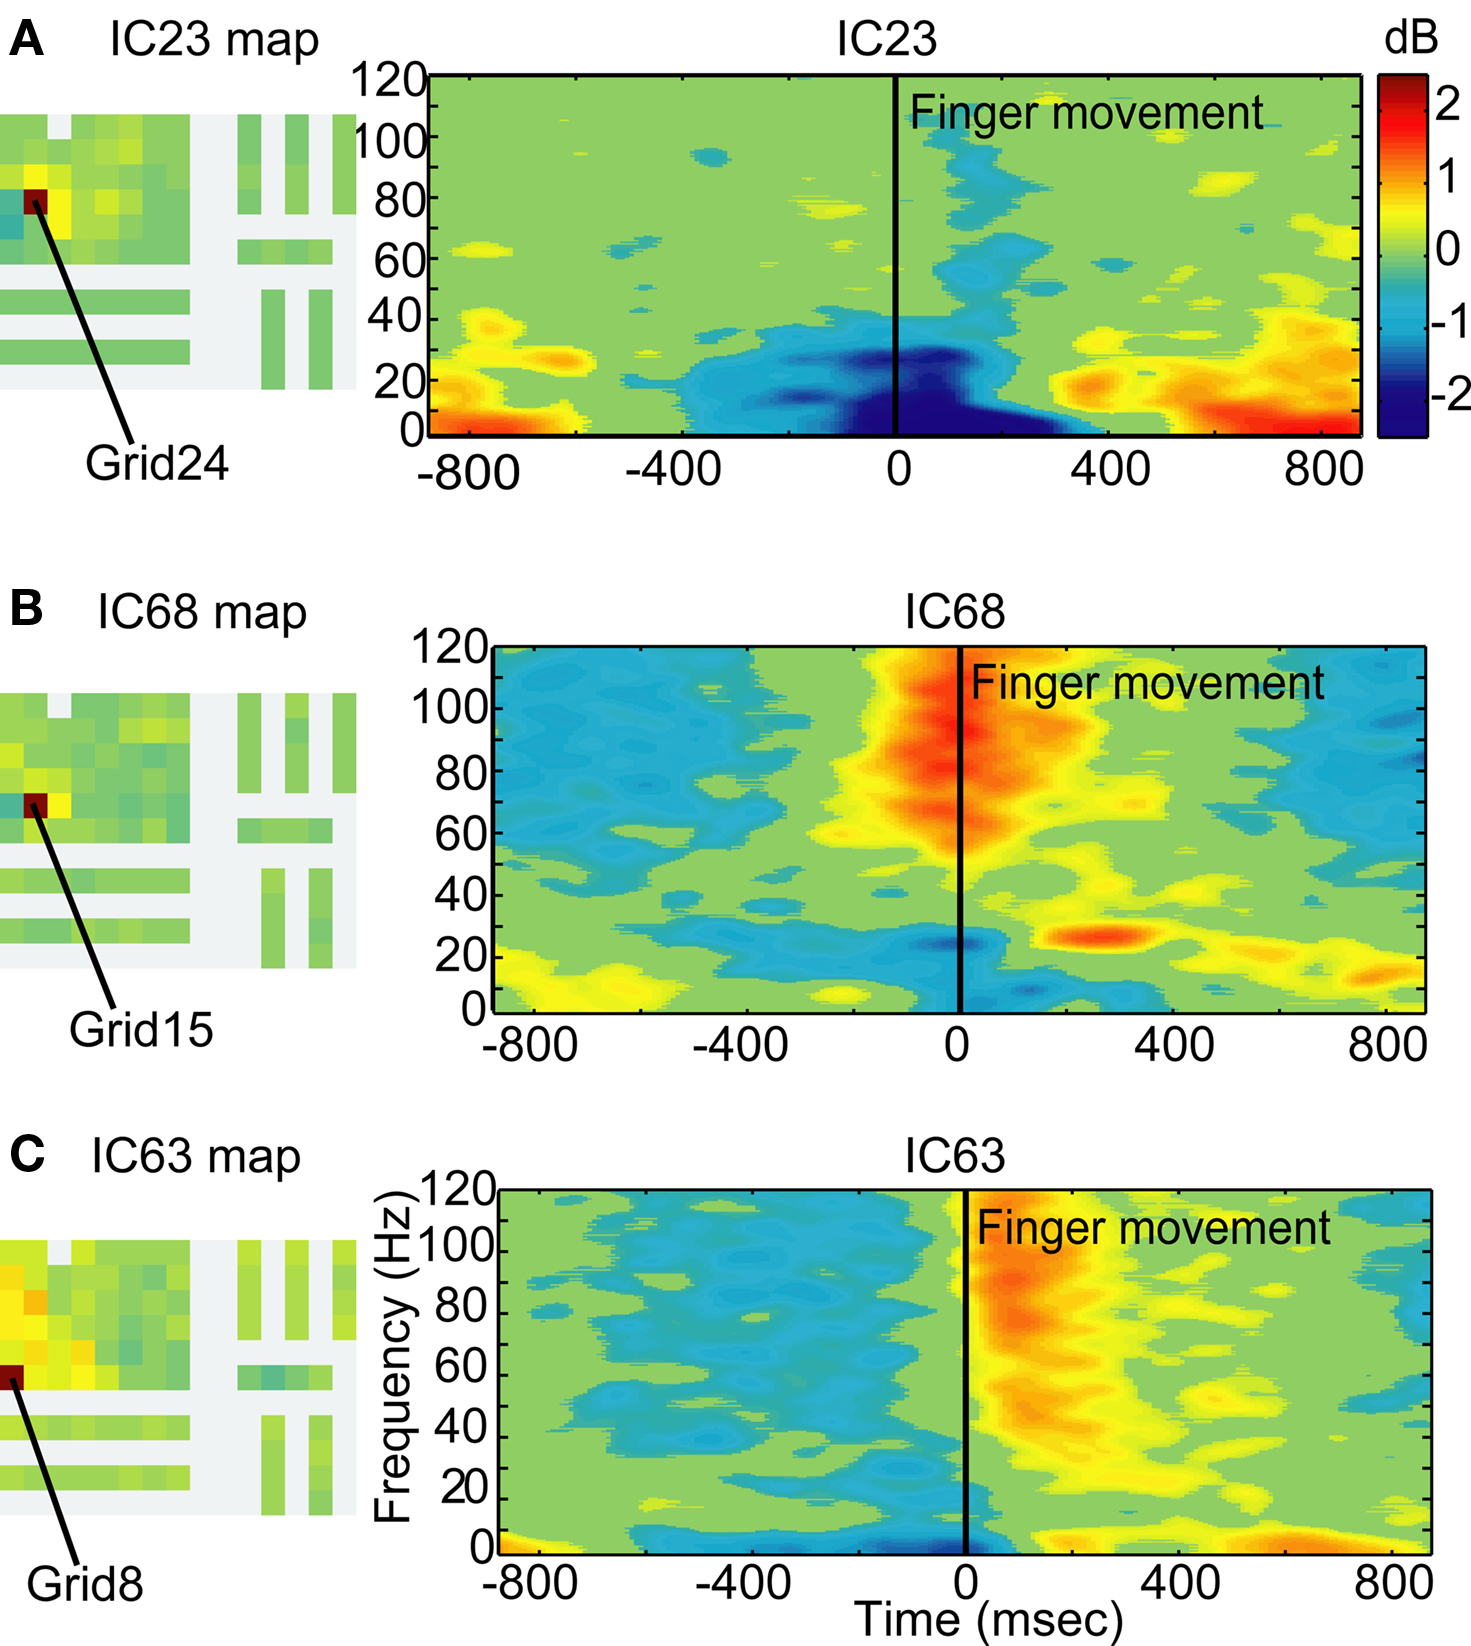
Figure 10. Independent components capture separable dynamics in different regions of motor cortex Grid maps and event-locked log power spectra for three independent components. (A) The grid map of IC23 projects most strongly to Grid23 (red), located over or near Brodmann Area 6 of the pre-central gyrus, and also projects to neighboring electrodes. IC23 demonstrates an alpha and beta power decrease time-locked to the finger movement, followed by a rebound power increase. (B) The grid map of IC68 projects most strongly to Grid15 (red), also over or near Brodmann Area 6. As compared to IC23, the movement-locked beta power decrease is smaller in amplitude. IC68 additionally demonstrates a broadband gamma power increase time-locked to the movement but with less precision in time than IC18 (Figure 9). (C) The grid map for IC63 projects most strongly to Grid8 (red), near the superior temporal gyrus and bordering on Area 43 of the pre-central gyrus. The event-locked spectral dynamics demonstrate a broadband gamma power increase within 100 ms after finger movement onset.
Discussion
To our knowledge, this is the first study in which ICA has been applied to human intracranial data for interpretation of functional brain signals, although Hu et al. (2007) applied ICA to concurrently recorded iEEG and scalp EEG to remove the contributions of sources near the scalp reference channel from the iEEG channel data. We applied ICA to intracranial data recorded during a cognitive task because it has been instructive for other researchers in decomposing the linear mixtures recorded by scalp EEG data into maximally independent model sources whose dynamics are modulated on a task basis. To an equal extent that the assumptions underlying ICA are reasonable approximations for scalp EEG, they are also reasonable for iEEG. ICA is a model based upon the assumption that the voltages recorded at the level of sensors, are produced by (nearly) independent current components that sum linearly and are spatially stationary over the duration of the recording. Linearity is accepted as a reasonable approximation based on the biophysics of electromagnetism through brain tissue at the macroscopic level measured in scalp EEG and iEEG recordings (Nunez et al., 2001; Nunez and Srinivasan, 2006). The spatial stationarity of sources at the scale recorded by 1-cm spaced electrodes during ∼20-min recordings is an empirical question that is used here as a plausible gross approximation. Traveling waves are observed in cortical recordings on much finer spatial scales (Rubino et al., 2006) and spread to a small enough extent that they could appear synchronous on the cm2 scale of standard iEEG recordings (Freeman et al., 2006). It should be noted that ICA does not exclude moving sources; rather, it accounts for the dynamics of a moving source as successive, temporally overlapping activations of multiple spatially adjacent or overlapping components. Although ICA may not capture all the aspects of the multi-scale spatiotemporal dynamics of cortical signals, we propose the use of ICA to spatially filter iEEG signals with the goal of improving on the standard approach in which each intracranial channel is inspected individually.
Our results suggest that ICA is useful for the interpretation of intracranial data by unmixing and separating functionally meaningful signals that have biologically plausible component maps, and by separating pathological activity from task-based activity. We first tested the independence of intracranial recordings by comparing their degree of independence to that of component signals found by infomax ICA. These are maximally independent signals linearly combining to produce the data. Both the mutual information histogram and the PVAF measures demonstrated that ICA decomposed the data into a set of signals with much greater independence than the original signals.
ICA decomposition can identify maximally independent component signals in any dataset, and independent component signals are never less independent than the recorded signals, but given independent signals (such as its own output), infomax ICA returns the same signals (within some numeric limits). Applied to clinical iEEG data, ICA returns components rather different than the input channel signals. Thus, our results demonstrate that intracranial signals from standard clinical iEEG electrodes are in fact not independent as recorded, and have synchronous features in common to multiple electrode channels. Many of the signals that ICA finds in iEEG have grid maps that may plausibly be associated with a source not located under any single iEEG electrode. Our results demonstrate that each iEEG channel signal cannot be regarded as unitary and independently generated, and suggest use of ICA as a reasonable pre-processing step for the analysis of iEEG data.
Some researchers re-reference intracranial data to a bipolar montage or compute a surface Laplacian to remove volume conduction effects from the data. We did not apply these spatial filters for several reasons. First, the data are reduced in dimensionality by these transformations. Note that ICA should return an equivalent result when applied to data after dimension-preserving linear filtering. Second, and more importantly, a Laplacian derivation inherently assumes that the orientation of the source area is parallel to the recording grid. Akalin Acar et al. (2009) show an example of an independent component that could clearly only be accounted for by a sulcal source not oriented parallel to the recording grid. Since sulcal territories are typically estimated to make up roughly 2/3 of the cortical surface, Laplacian derivations are apt to ignore or distort many recorded source processes. ICA uses a much stronger restriction (relative independence) on the time courses of source processes, and by so doing can find spatial filters for any locally synchronous source distribution, including sulcal sources. Another shortcoming of Laplacian filtering, at least in straightforward applications, is its rather crude spatial sampling. ICA can also find spatial filters for source areas not centered on a recording channel, another major advantage relative to Laplacian decomposition.
We then asked how many of the spatial patterns exhibited by the component maps from the ICA decomposition appear biologically meaningful. We found that only a fraction of the component maps identify components projecting to single channels, components we categorized as “focal,” while the large majority project to multiple electrodes. Another set of component maps, those projecting to multiple nearby electrodes, were categorized as “diffuse”. Diffuse component maps project to multiple channels in brain tissue likely to be anatomically connected or that might represent volume conduction effects with limited spatial spread. Of the diffusely projecting component maps, most demonstrated a steep decrement in component weights from the highest weighted channel to surrounding channels. Another type of component map projecting to multiple electrodes was categorized as “complex” because the affected electrodes were not located in contiguous brain regions. We hypothesized that these component maps identify functionally unitary brain processes, distinct from that of other components. In many cases, these projections may be to electrodes located to either pole of a dipolar source field. We also found examples of pathological components with synchronous projections to multiple electrodes.
We cannot make any concrete claims about the locations of components based on ICA alone without first building individualized forward head models to predict how current sources generate the electric fields that appear as voltage changes on the sensors. However, we postulate that the most parsimonious explanation for focal component maps is that they each represent a brain source domain in close proximity to the affected electrode. The diffusely projecting component maps might represent either, (1) wide (multi-cm) areas of local cortical field activity coupled synchronously, or (2) the projection through volume conduction of activity generated in a (smaller) distal source area to a wide array of sensors. For example, a radially oriented focal source on the inferior cortical surface might project to a much wider area on the superior cortical surface.
However, the cortical surface wave propagation speed (approximately 2 m/s), would not be compatible with the appearance of synchronous source activity at observed EEG frequencies across a domain of cortex with a diameter of >1 cm (possibility 1) above). For example, a propagating wave (or “phase cone”, Freeman, 2004) at 10 Hz radiating out from the center of a cortical patch 4 cm in diameter would require ∼10 ms to reach its edge, a phase lag of 36°; at 20 Hz, this would represent a phase lag of 72°, whereas ICA models the iEEG data as sums of source activities each synchronous or nearly synchronous across the recording grid.
However, these two quite different possibilities cannot be definitively disambiguated without a forward model of the current flow through the brain volume conductor taking into account the complications of operative skull insults and the non-conductive plastic sheets housing the electrode grids. Using such a model, Akalin Acar et al. have demonstrated an iEEG independent component compatible with radially projecting field activity synchronous across a roughly cm-scale patch of neuropile located on gyral or sulcal cortex beneath the iEEG electrode grid, but not directly under any of the grid electrodes, and a second, diffuse iEEG independent component well modeled by a cm-scale source on the wall of a sulcus below the recording grid. This component projected diffusely, with opposite sign, to two sets of iEEG electrodes, but only minimally to the electrodes closest to the estimated source (Akalin Acar et al., 2009).
Although synchronous activity across a multi-cm cortical region has not been reported in the normal awake brain, in fact few studies have looked in spatial detail at the extent and dynamics of synchrony across mm to cm spatial scales within either animal or human cortex. Given that the “diffuse” component maps in our data typically have strong foci surrounded by a more weakly weighted penumbra, representative of steep voltage gradients, it is most likely that these components represent activity in cortex local to the recording grids. However, more detailed source analysis requires use of a sufficient forward head model, ultimately combined with use of higher-density, multi-scale recording grids.
The “complex” component maps in some cases suggested origins near different sets of electrodes that were functionally (and near-synchronously) coupled. Again, the dipolar nature of cortical fields mean that each component has two opposite projection directions (in which the projected signals have opposite sign). In some cases, “complex” maps might thus be generated by a small number of bivalent dipolar projections to the iEEG grid.
Finally, some of the independent components were not categorizable as focal, diffuse, or complex and were described as “noisy”. The ICA algorithm, by design, decomposes the data into the same number of components as there are sensors. The number of potential proximal and distal coherent components contributing by volume conduction to an iEEG data set, however, is likely larger than the number of electrodes. ICA therefore must mix the contributions of small source signal contributions into the available number of components. Thus, the smallest components returned by ICA may not be dominated by any single source signal, and all might not be recovered in multiple successive decompositions, since the (randomized) order in which the data are considered affects details of infomax ICA output.
An additional test of the utility of intracranial ICA, beyond the qualitative assessment of the biological plausibility of component maps, was to determine whether the time series of independent components group signals from disparate areas of the brain that are functionally linked. The prevalence of stereotyped pathological signals in these data provided the opportunity to use signals that are well characterized in the channel domain. We identified one type of clinically important signal to test whether ICA can successfully separate pathological signals from non-pathological signals. Frontal intermittent rhythmic delta activity (FIRDA) is a non-specific but commonplace pathological brain signal that can be seen in EEG of patients with tumors (Kubota and Ohnishi, 1997), increased intracranial pressure, and toxic-metabolic disorders (Niedermeyer, 2003). ICA decomposition of scalp EEG data has been shown to successfully separate FIRDA from other brain activity in patients with Creutzfeldt–Jakob disease, and associates FIRDA with periodic lateralized epileptiform discharges (PLEDs) (Hung et al., 2007). In our intracranial data, ICA separated FIRDA from other ongoing brain activity. Further, ICA separated 12 components having maps including projections to some subset of the six channels clinically identified as exhibiting frontal intermittent delta activity. Four of these components showed maximal spectral peaks at 3 Hz, and the remainder exhibited a maximum at 6 Hz with a smaller peak near 3 Hz.
Why were the FIRDA signals accounted for by multiple independent components rather than being aggregated into a single component? ICA models the data as the weighted mixture of independent source signals that remain spatially stationary through the duration of the recording. Different FIRDA trains appearing on different combinations of channels through the course of the 20-min recording will necessarily be accounted for by more than one ICA component signal. Else, the source generators of FIRDA may have been hierarchical rather than independent, as is suggested by a novel analysis of ictal epilepsy data (Repucci et al., 2001). Alternatively, the FIRDA signal could be a traveling wave that extends beyond the cm2 scale over which ICA spatial stationarity is assumed with this methodology.
As a further test of whether ICA separates functionally meaningful signals in intracranial data, we also examined how the decomposition parsed event-related signals triggered from cued finger movements. The cortical dynamics associated with finger movement are well characterized and therefore provide a good model for testing ICA. The mu rhythm is a periodic signal with a stereotyped morphology including a sharply contoured wave followed by a rounded phase, observed over rolandic cortex of humans during periods of stillness and is attenuated with motor activity. Mu rhythm, like posterior alpha activity, is therefore viewed as an “idling” brain rhythm (Jasper and Andrews, 1938; Gastaut et al., 1952; Niedermeyer and Lopes da Silva, 1999). The suppression of this rhythm during movements is a well-known phenomenon first observed in the time domain of scalp EEG during movement (Jasper and Andrews, 1938), and later determined by spectral decomposition to be comprised of alpha and beta components (Pfurtscheller and Aranibar, 1977, 1980). This classical movement-induced brain signature is robustly evident across modalities including EEG (Stancak and Pfurtscheller, 1996), MEG (Salmelin and Hari, 1994), and intracranial recordings (Arroyo et al., 1993; Crone et al., 1998a,b; Aoki et al., 1999; Ohara et al., 2000; Klopp et al., 2001; Miller et al., 2007a), and in response to movements of different modalities including the tongue, foot, and hand (Pfurtscheller et al., 1994). Hand movement paradigms that have elicited this stereotyped pattern have included manually squeezing of rubber ball (Pfurtscheller and Aranibar, 1980; Pfurtscheller, 1982), finger movements from visual cue (Pfurtscheller et al., 1997; Klopp et al., 2001); fist clenching and relaxing (Miller et al., 2007a), sustained muscle contraction (Crone et al., 1998a,b), and more complex tasks involving the hand (Aoki et al., 2001; Rektor et al., 2006). Recent studies with data acquired at higher sampling rates have demonstrated an increase in gamma band power concurrent with the alpha and beta power decreases associated with mu (Crone et al., 1998a,b; Miller et al., 2007a).
It was therefore expected that our visually cued finger movement task would elicit mu rhythm blocking and its associated alpha and beta power decreases, concurrent with and following movement-related gamma power increases over motor cortex. Indeed, intracranial channels in Patient 1, who had electrodes implanted over peri-rolandic area, exhibited these well-established spectral changes time-aligned to finger movements. ICA decomposition revealed one component (IC18) with strong projections to an electrode over pre-central cortex and weaker projections to the neighboring channels, which also exhibited salient movement-locked alpha, beta, and gamma band perturbations. The broader spatial extent of beta dynamics than gamma dynamics is consistent with reports of other researchers (Crone et al., 1998a,b; Miller et al., 2007a). Furthermore, our finding of gamma power changes in components that project to primary motor areas (M1) but not nearby supplementary motor area (SMA) is consistent with the observation of Ohara et al. (2000) who reported event-related gamma synchronization in S1 and M1 but not SMA. The effectiveness of ICA to separate predicted event-related dynamics in our intracranial data suggests that ICA could be applied to data acquired during more sophisticated cognitive and perceptual tasks to identify further details of event-related cortical brain dynamics within functionally connected regions.
ICA can identify and characterize component signals mixed by volume conduction without any constraints on where those components are located. The results from ICA decomposition of EEG data may be used in conjunction with source localization models, such as equivalent single dipole or multiple dipole modeling with boundary element (BEM) or finite element (FEM) head models, to answer both “what” and “where” questions about brain function – what source activities produce the observed brain electrical data and where are they generated? The putative sources of intracranial data identified by ICA can only be used for source localization by incorporating a sophisticated forward model, as forward models for EEG assume an intact skull, and are thus insufficient for use with epilepsy patients with craniotomies. Skull anisotropy has an effect on the accuracy of dipole localization to begin with (Yvert et al., 1997), and the craniotomy has significant effects on volume conduction (Oostenveld and Oostendorp, 2002). Therefore, a critical step in extending this work is the development of forward head models of patient-specific skulls with craniotomies (Akalin Acar and Makeig, 2008). When used in conjunction with patient-specific forward models, ICA can likely give more information about the spatial distribution of both pathological and normal brain activities recorded by iEEG and/or scalp EEG sensors (Akalin Acar et al., 2009).
The infomax ICA algorithm used here has a strong and possibly fallible assumption of spatial stationarity of the component signal areas over the entire length of the recording. Newer decomposition methods have been developed that explicitly account for moving components, such as complex ICA (Anemuller et al., 2003, 2006; Dyrholm et al., 2006, 2007) and an ICA algorithm for finding multiple component mixtures in spatially non-stationary data (Palmer et al., 2006), all of which have been applied to scalp EEG data. The application of these algorithms to iEEG data might refine and extend the results reported here.
While intracranial recordings from patients with focal refractory epilepsy provide a unique opportunity for analysis of human brain signals with sub-millisecond resolution and improved spatial resolution, there may be limitations to the extrapolation of healthy, normal-functioning brain activity from these studies performed on pathological brain tissue. It is therefore critical to find a robust means for separating epileptic and otherwise pathological brain signals from the task-related brain signals under investigation. ICA is a novel approach for addressing this problem without requiring high-density, multi-resolution recording arrays. Our analyses demonstrate that intracranial signals are not independent as recorded, suggesting that analysis of event-related brain dynamics in the “independent component domain” can offer additional insights not readily apparent from the traditional channel domain analysis.
Here, we demonstrate as well that ICA decomposition may be useful for the interpretation of event-related iEEG data. Our simple task paradigm, including previously well-characterized dynamics, validates the use of ICA-based analysis of event-related intracranial data. The success of this approach suggests that new discoveries of brain dynamics associated with more complicated cognitive and behavioral tasks could be aided by the use of ICA in iEEG data analysis.
Conflict of Interest Statement
The authors declare that the research was conducted in the absence of any commercial or financial relationships that could be construed as a potential conflict of interest.
Acknowledgments
This work was supported by a gift from The Swartz Foundation (Old Field NY) and by grants from the National Institutes of Health (R01 NS047293) and the National Science Foundation USA (0613595). We thank Karla Crockett for assisting in the acquisition of these data and Andrey Vankov for software development that aided data acquisition. We also thank Jason Palmer, Eric Halgren, Pamela Reinagel, Ifije Ohiorhenuan, and Jason Sherfey for critically useful discussions about this work.
References
Akalin Acar, Z., and Makeig, S. (2008). “Head modeling and cortical localization in epilepsy,” Proceedings of IEEE EMBC 2008, Vancouver, Canada.
Akalin Acar, Z., Worrell, G., and Makeig, S. (2009). “Patch basis electrocortical source imaging in epilepsy,” IEEE Engineer Med Biol Soc 2009, Minneapolis, Minnesota.
Anemuller, J., Duann, J. R., Sejnowski, T. J., and Makeig, S. (2006). Spatio-temporal dynamics in fMRI recordings revealed with complex independent component analysis. Neurocomputing 69, 1502–1512.
Anemuller, J., Sejnowski, T. J., and Makeig, S. (2003). Complex independent component analysis of frequency-domain electroencephalographic data. Neural. Netw. 16, 1311–1323.
Aoki, F., Fetz, E. E., Shupe, L., Lettich, E., and Ojemann, G. A. (1999). Increased gamma-range activity in human sensorimotor cortex during performance of visuomotor tasks. Clin. Neurophysiol. 110, 524–537.
Aoki, F., Fetz, E. F., Shupe, L., Lettich, E., and Ojemann, G. A. (2001). Changes in power and coherence of brain activity in human sensorimotor cortex during performance of visuomotor tasks. Biosystems 63, 89–99.
Arroyo, S., Lesser, R. P., Gordon, B., Uematsu, S., Jackson, D., and Webber, R. (1993). Functional significance of the mu rhythm of human cortex: an electrophysiologic study with subdural electrodes. Electroencephalogr. Clin. Neurophysiol. 87, 76–87.
Ball, T., Demandt, E., Mutschler, I., Neitzel, E., Mehring, C., Vogt, K., Aertsen, A., and Schulze-Bonhage, A. (2008). Movement related activity in the high gamma range of the human EEG. Neuroimage 41, 302–310.
Bell, A. J., and Sejnowski, T. J. (1995). An information-maximization approach to blind separation and blind deconvolution. Neural Comput. 7, 1129–1159.
Berg, R. W., Whitmer, D., and Kleinfeld, D. (2006). Exploratory whisking by rat is not phase locked to the hippocampal theta rhythm. J. Neurosci. 26, 6518–6522.
Berger, H. (1929). Uber das Elektrenkephalogramm des Menschen. Arch. Psychiatr. Nervenkr. 87, 527–570.
Bullock, T. H., McClune, M. C., Achimowicz, J. Z., Iragui-Madoz, V. J., Duckrow, R. B., and Spencer S. S. (1995). EEG coherence has structure in the millimeter domain: subdural and hippocampal recordings from epileptic patients. Electroencephalogr. Clin. Neurophysiol. 95, 161–177.
Burchiel, K. J., Clarke, H., Ojemann, G. A., Dacey, R. G., and Winn, H. R. (1989). Use of stimulation mapping and corticography in the excision of arteriovenous malformations in sensorimotor and language-related neocortex. Neurosurgery 24, 322–327.
Cameron, K. A., Yashar, S., Wilson, C. L., and Fried, I. (2001). Human hippocampal neurons predict how well word pairs will be remembered. Neuron 30, 289–298.
Cooper, R., Winter, A. L., Crow, H. J., and Walter, W. G. (1965). Comparison of subcortical, cortical and scalp activity using chronically indwelling electrodes in man. Electroencephalogr. Clin. Neurophysiol. 18, 217–228.
Cover, T. M., and Thomas, J. A. (2006). Elements of Information Theory. New York: John Wiley & Sons, Inc.
Crone, N. E., Miglioretti, D. L., Gordon, B., and Lesser, R. P. (1998a). Functional mapping of human sensorimotor cortex with electrocorticographic spectral analysis. II. Event-related synchronization in the gamma band. Brain 121, 2301–2315.
Crone, N. E., Miglioretti, D. L., Gordon, B., and Lesser, R. P. (1998b). Functional mapping of human sensorimotor cortex with electrocorticographic spectral analysis. I. Alpha and beta event-related desynchronization. Brain 121, 2271–2299.
Dewar, S., Passaro, E., Fried, I., and Engel, J., Jr. (1996). Intracranial electrode monitoring for seizure localization: indications, methods and the prevention of complications. J. Neurosci. Nurs. 28, 280–284, 289–292.
Dyrholm, M., Makeig, S., and Hansen, L. K. (2006). “Model structure selection in convolutive mixtures,” in Proceedings of Independent Component Analysis and Blind Signal Separation, 3889, 74–81.
Dyrholm, M., Makeig, S., and Hansen, L K. (2007). Model selection for convolutive ICA with an application to spatiotemporal analysis of EEG. Neural. Comput. 19, 934–955.
Engel, J. Jr., and Crandall, P. H. (1987). Intensive neurodiagnostic monitoring with intracranial electrodes. Adv. Neurol. 46, 85–106.
Fell, J., Klaver, P., Lehnertz, K., Grunwald, T., Schaller, C., Elger, C. E., and Fernandez, G. (2001). Human memory formation is accompanied by rhinal-hippocampal coupling and decoupling. Nat. Neurosci. 4, 1259–1264.
Freeman, W. J. (2004). Origin, structure, and role of background EEG activity. Part 2. Analytic phase. Clin. Neurophysiol. 115, 2089–2107.
Freeman, W. J., Holmes, M. D., West, G.A., and Vanhatalo, S. (2006). Fine spatiotemporal structure of phase in human intracranial EEG. Clin. Neurophysiol. 117, 1228–1243.
Gastaut, H., Terzian, H., and Gastaut, Y. (1952). Study of a little electroencephalographic activity: rolandic arched rhythm. Mars. Med. 89, 296–310.
Halgren, E., Baudena, P., Heit, G., Clarke, J. M., Marinkovic, K., Chauvel, P., and Clarke, M. (1994a). Spatiotemporal stages in face and word processing. I. Depth-recorded potentials in the human occipital, temporal and parietal lobes. J. Physiol. Paris. 88, 1–50.
Halgren, E., Baudena, P., Heit, G., Clarke, J. M., Marinkovic, K., Chauvel, P., and Clarke, M. (1994b). Spatiotemporal stages in face and word processing. 2. Depth-recorded potentials in the human frontal and Rolandic cortices. J. Physiol. Paris. 88, 51–80.
Hu, S., Stead, M., and Worrell, G. A. (2007). Automatic identification and removal of scalp reference signal for intracranial EEGs based on independent component analysis. IEEE Trans. Biomed. Eng. 54, 1560–1572.
Hung, C. I., Wang, P. S., Soong, B. W., Teng, S., Hsieh, J. C., and Wu, Y. T. (2007). Blind source separation of concurrent disease-related patterns from EEG in Creutzfeldt-Jakob disease for assisting early diagnosis. Ann. Biomed. Eng. 35, 2168–2179.
Jarvis, M. R., and Mitra, P. P. (2001). Sampling properties of the spectrum and coherency of sequences of action potentials. Neural. Comput. 13, 717–749.
Jasper, H., and Penfield, W. (1949). Electrocorticograms in man: effect of voluntary movement upon the electrical activity of the precentral gyrus. Arch. Psychiatr. Neurol. 182, 163–174.
Jasper, H. H., and Andrews, H. L. (1938). Electro-encephalography. III. Normal differentiation of occipital and precentral regions in man. Arch. Neurol. Psychiatry 39, 96–115.
Kahana, M. J., Caplan, J. B., Sekuler, R., and Madsen, J. R. (1999). Using intracranial recordings to study theta. Trends Cogn. Sci. 3, 406–407.
Klopp, J., Marinkovic, K., Chauvel, P., Nenov, V., and Halgren, E. (2000). Early widespread cortical distribution of coherent fusiform face selective activity. Hum. Brain Mapp. 11, 286–293.
Klopp, J., Marinkovic, K., Clarke, J., Chauvel, P., Nenov, V., and Halgren, E. (2001). Timing and localization of movement-related spectral changes in the human peri-Rolandic cortex: intracranial recordings. Neuroimage 14, 391–405.
Kobayashi, K., Merlet, I., and Gotman, J. (2001). Separation of spikes from background by independent component analysis with dipole modeling and comparison to intracranial recording. Clin. Neurophysiol. 112, 405–413.
Kubota, F., and Ohnishi, N. (1997). Study on FIRDA and 3 Hz rhythmic slow wave bursts occurring in the frontal area of epileptic patients. Clin. Electroencephalogr. 28, 112–116.
Kuzniecky, R., Morawetz, R., Faught, E., and Black, L. (1995). Frontal and central lobe focal dysplasia: clinical, EEG and imaging features. Dev. Med. Child Neurol. 37, 159–166.
Lancaster, J. L., Woldorff, M. G., Parsons, L.M., Liotti, M., Freitas, C.S., Rainey, L., Kochunov, P.V.,Nickerson, D., Mikiten, S.A., and Fox, P.T. (2000). Automated Talairach atlas labels for functional brain mapping. Hum. Brain Mapp. 10, 120–131.
Lee, T. W., Girolami, M., and Sejnowski, T. J. (1999). Independent component analysis using an extended infomax algorithm for mixed subgaussian and supergaussian sources. Neural. Comput. 11, 417–441.
Luders, H., Awad, I., Burgess, R., Wyllie, E., and Van Ness, P. (1992). Subdural electrodes in the presurgical evaluation for surgery of epilepsy. Epilepsy Res. Suppl. 5, 147–156.
Luders, H. O., Dinner, D. S., Morris, H. H., Wyllie, E., and Comair, Y. G. (1995). Cortical electrical stimulation in humans. The negative motor areas. Adv. Neurol. 67, 115–129.
Makeig, S., Bell, A. J., Jung, T.-P., and Sejnowski, T. J. (1996). “Independent component analysis of electroenceaphalographic data,” in Advances in Neural Information Processing Systems Vol. 8, eds M. M. D. Touretzky and M. Hasselmo (Cambridge, MA: MIT Press), 145–151.
Makeig, S., Debener, S., Onton, J., and Delorme, A. (2004a). Mining event-related brain dynamics. Trends Cogn. Sci. 8, 204–210.
Makeig, S., Delorme, A., Westerfield, M., Jung, T. P., Townsend, J., Courchesne, E., and Sejnowski, T. J.(2004b). Electroencephalographic brain dynamics following manually responded visual targets. PLoS Biol. 2, e176. doi:10.1371/journal.pbio.0020176.
Makeig, S., Jung, T. P., Bell, A. J., Ghahremani, D., and Sejnowski, T. J. (1997). Blind separation of auditory event-related brain responses into independent components. Proc. Natl. Acad. Sci. U.S.A. 94, 10979–10984.
Makeig, S., Westerfield, M., Jung, T. P., Enghoff, S., Townsend, J., Courchesne, E., and Sejnowski, T. J. (2002). Dynamic brain sources of visual evoked responses. Science 295, 690–694.
Miller, K. J., Leuthardt, E. C., Schalk, G., Rao, R. P., Anderson, N. R., Moran, D. W., Miller, J. W., and Ojemann, J. G. (2007a). Spectral changes in cortical surface potentials during motor movement. J. Neurosci. 27, 2424–2432.
Miller, K. J., Makeig, S., Hebb, A.O., Rao, R.P.N., denNijs, M., and Ojemann, J. G. (2007b). Cortical electrode localization from X-rays and simple mapping for electrocorticographic research: the “Location on Cortex” (LOC) package for MATLAB. J. Neurosci. Methods 162, 303–308.
Mitra, P. P., and Pesaran, B. (1999). Analysis of dynamic brain imaging data. Biophys. J. 76, 691–708.
Niedermeyer, E., and Lopes da Silva, F. H. (1999). Electroencephalography: Basic Principles, Clinical Applications, and Related Fields. Baltimore: Williams & Wilkins.
Nunez, P. L., and Srinivasan, R. (2006). Electric Fields of the Brain: The Neurophysics of EEG. New York: Oxford University Press.
Nunez, P. L., Wingeier, B. M., and Silberstein, R. B. (2001). Spatial-temporal structures of human alpha rhythms: theory, microcurrent sources, multiscale measurements, and global binding of local networks. Hum. Brain Mapp. 13, 125–164.
Ohara, S., Ikeda, A., Kunieda, T., Yazawa, S., Baba, K., Nagamine, T., Taki, W., Hashimoto, N., Mihara, T., and Shibasaki, H. (2000). Movement-related change of electrocorticographic activity in human supplementary motor area proper. Brain 123, 1203–1215.
Ojemann, G. A. (1982). Models of the brain organization for higher integrative functions derived with electrical stimulation techniques. Hum. Neurobiol. 1, 243–249.
Ojemann, G. A. (1983). Neurosurgical management of epilepsy: a personal perspective in. Appl. Neurophysiol. 46, 11–18.
Ojemann, G. A., Fried, I., and Lettich, E. (1989). Electrocorticographic (ECoG) correlates of language. I. Desynchronization in temporal language cortex during object naming. Electroencephalogr. Clin. Neurophysiol. 73, 453–463.
Oostenveld, R., and Oostendorp, T. F. (2002). Validating the boundary element method for forward and inverse EEG computations in the presence of a hole in the skull. Hum. Brain Mapp. 17, 179–192.
Palmer, J. A., Kreutz-Delgado, K., and Makeig, S. (2006). “Super-gassian mixture source model for ICA” Proceedings of the 6th International Symposium on Independent Component Analysis, Springer.
Penfield, W., and Kristiansen, K. (1951). Epileptic Seizure Patterns. Springfield, IL: Charles C. Thomas.
Percival, D. B., and Walden, A. T. (1993). Spectral Analysis for Physical Applications. London: Cambridge University Press.
Pfurtscheller, G., Neuper, C. and Aranibar, A. (1977). Event-related cortical desynchronization detected by power measurements of scalp EEG. Electroencephalogr. Clin. Neurophysiol. 42, 817–826.
Pfurtscheller, G., and Aranibar, A. (1980). Changes in central EEG activity in relation to voluntary movement. I. Normal subjects. Prog. Brain Res. 54, 225–231.
Pfurtscheller, G., Auer, L., and Oberbauer, R. (1982). The influence of skull defects and reperfusion after extraintracranial arterial bypass surgery on the sensorimotor EEG rhythm. J. Neurol.Neurosurg. Psychiatry 45, 1106–1112.
Pfurtscheller, G., and Neuper, C. (1997). Motor imagery activates primary sensorimotor area in humans. Neurosci. Lett. 239, 65–68.
Pfurtscheller, G., Pregenzer, M., and Neuper, C. (1994). Visualization of sensorimotor areas involved in preparation for hand movement based on classification of mu and central beta rhythms in single EEG trials in man. Neurosci. Lett. 181, 43–46.
Quiroga, R., Reddy, Q. L., Kreiman, G., Koch, C., and Fried, I. (2005). Invariant visual representation by single neurons in the human brain. Nature 435, 1102–1107.
Ray, S., Niebur, E., Hsiao, S.S., Sinai, A., and Crone, N. E. (2008). High-frequency gamma activity (80-150 Hz) is increased in human cortex during selective attention. Clin. Neurophysiol. 119, 116–133.
Rektor, I., Sochurkova, D., and Bockova, M. (2006). Intracerebral ERD/ERS in voluntary movement and in cognitive visuomotor task. Prog. Brain Res. 159, 311–330.
Repucci, M. A., Schiff, N. D., and Victor, J. D. (2001). General strategy for hierarchical decomposition of multivariate time series: implications for temporal lobe seizures. Ann. Biomed. Eng. 29, 1135–1149.
Rizzuto, D. S., Madsen, J. R., Bromfield, E. B., Schulze-Bonhage, A., and Kahana, M. J. (2006). Human neocortical oscillations exhibit theta phase differences between encoding and retrieval. Neuroimage 31, 1352–1358.
Rubino, D., Robbins, K. A., and Hatsopoulos, N. G. (2006). Propagating waves mediate information transfer in the motor cortex. Nat. Neurosci. 9, 1549–1557.
Salmelin, R., and Hari, R. (1994). Spatiotemporal characteristics of sensorimotor neuromagnetic rhythms related to thumb movement. Neuroscience 60, 537–550.
Stancak, A. Jr., and Pfurtscheller, G. (1996). Mu-rhythm changes in brisk and slow self-paced finger movements. Neuroreport 7, 1161–1164.
Tharin, S., and Golby, A. (2007). Functional brain mapping and its applications to neurosurgery. Neurosurgery 60(4 Suppl 2), 185–201; discussion 201–202.
Wyler, A. R., Ojemann, G. A., Lettich, E., and Ward, A. A. Jr. (1984). Subdural strip electrodes for localizing epileptogenic foci. J. Neurosurg. 60, 1195–1200.
Keywords: ICA, intracranial, EEG, electrocorticography, ECoG, epilepsy, mu
Citation: Whitmer D, Worrell G, Stead M, Lee K and Makeig S (2010) Utility of independent component analysis for interpretation of intracranial EEG. Front. Hum. Neurosci. 4:184. doi: 10.3389/fnhum.2010.00184
Received: 09 October 2009;
Accepted: 09 September 2010;
Published online: 02 November 2010.
Edited by:
Olivier Bertrand, Institut National de la Santé et de la Recherche Médicale, FranceReviewed by:
Sara L. Gonzalez Andino, Hôpitaux Universitaires de Genève, SwitzerlandPedro Valdes-Sosa, Cuban Neuroscience Center, USA
Copyright: © 2010 Whitmer, Worrell, Stead, Lee and Makeig. This is an open-access article subject to an exclusive license agreement between the authors and the Frontiers Research Foundation, which permits unrestricted use, distribution, and reproduction in any medium, provided the original authors and source are credited.
*Correspondence: Diane Whitmer, Starlab Barcelona S.L. C. Teodor Roviralta, 45 08022, Barcelona, Spain. e-mail:ZHdoaXRtZXJAdWNzZC5lZHU=