


- 1Swartz Center for Computational Neuroscience, Institute for Neural Computation, University of California San Diego, La Jolla, CA, USA
- 2Human Neuromechanics Laboratory, School of Kinesiology, University of Michigan, Ann Arbor, MI, USA
Human cognition has been shaped both by our body structure and by its complex interactions with its environment. Our cognition is thus inextricably linked to our own and others’ motor behavior. To model brain activity associated with natural cognition, we propose recording the concurrent brain dynamics and body movements of human subjects performing normal actions. Here we tested the feasibility of such a mobile brain/body (MoBI) imaging approach by recording high-density electroencephalographic (EEG) activity and body movements of subjects standing or walking on a treadmill while performing a visual oddball response task. Independent component analysis of the EEG data revealed visual event-related potentials that during standing, slow walking, and fast walking did not differ across movement conditions, demonstrating the viability of recording brain activity accompanying cognitive processes during whole body movement. Non-invasive and relatively low-cost MoBI studies of normal, motivated actions might improve understanding of interactions between brain and body dynamics leading to more complete biological models of cognition.
Introduction
Brain processes are closely tied to the physical reference of our bodily sensations and actions within and with respect to our 3-D environment. Within this “embodied cognition” framework, a primary function of human perception and cognition is to assist our behavioral selection and motor control (Churchland et al., 1994). New information is continually integrated by our brains, allowing us to predict how further events in our current environment may be influenced by our actions. We often reduce our processing load by actively manipulating the environment (e.g., by drawing and then referring to maps during navigation), and are able to integrate features of the environment into our functional brain/body action system. For example, a tennis player’s racket becomes an integral part of his/her action system, influencing aspects of the environment (the ball) to shape future events (the opponent’s return) (Maravita and Iriki, 2004). From a physiological perspective, the theory of embodied cognition is supported by evidence that brain areas that originally evolved to organize motor behavior of animals in their three-dimensional environments also support human cognition (Rizzolatti et al., 2002). Thus, analysis of simultaneously recorded human brain activity and motor behavior during physical interactions with the natural environment (and/or other agents in it) could be an invaluable resource for understanding the distributed brain activity supporting embodied human cognition and behavior.
Concurrent imaging of brain and body dynamics has been restricted by mechanical constraints of most functional brain imaging modalities that severely limit the scope of brain imaging during natural motor behavior. For fear of introducing intractable movement artifacts, subjects in hemodynamic and magnetic imaging experiments are required to lie or sit still, interacting with their environment via highly restricted movements (minimal-range button presses, foot taps, wrist flexions, etc.). Even if movement artifact were not a concern, the size and weight of traditional imaging sensors and the need to keep them in contact with the head prohibit recording during many forms of natural subject movement. Although virtual-reality systems can be used to simulate movements in larger environments, participants in such experiments neither produce natural behavior nor experience the concomitant proprioceptive and vestibular sensations (Gramann et al., 2010). functional near-infrared spectroscopy (fNIR) has been used to measure brain activation during actual human locomotion (Miyai et al., 2001; Suzuki et al., 2004, 2008), but this technique lacks the temporal resolution necessary to record brain activity on the timescale of typical motor planning and behavior and has limited sensitivity to activity of non-superficial cortex.
To overcome the limitations of traditional brain imaging methods, we implemented a mobile brain/body imaging (MoBI) approach that uses high-density scalp electroencephalography (EEG) and motion capture to simultaneously record brain and body dynamics while allowing human subjects near complete freedom of the body and the head (Makeig et al., 2009). EEG is the only non-invasive method of recording brain activity that involves sensors light enough to allow uninhibited movement and has sufficient time resolution to record brain activity on the time scale of natural motor behavior. Traditionally, EEG experimental paradigms severely restricted body, head, and eye movements of participants for fear of introducing non-brain artifacts in EEG recordings. However, data-driven approaches can disentangle brain and non-brain activity recorded from scalp electrodes (Makeig et al., 2004, 2009).
To test the feasibility and limitations of MoBI recording and analysis, we used a dual-task experimental design in which subjects stood, walked, and ran on a treadmill while at the same time attending to a secondary cognitive task (a standard visual oddball task). The goal was to test and demonstrate the feasibility of recording and analyzing brain activity accompanying cognitive processes (including, in particular, the well-known visual P300 or P3 feature of the visual event-related potential, ERP) while subjects were actively walking. Our aim was to identify typical component features of the average ERP associated with target discrimination in a standard visual target detection (“oddball”) task as well as to assess the possibility of measuring changes in the underlying brain activity distribution as subjects walked at different speeds. Additional information gained from recording kinematics synchronized with brain activity significantly improved the breadth of possible movement and EEG data analyses (Gwin et al., 2010), allowing investigation of the EEG activity accompanying walking and concurrent somatosensory perception (Gwin et al., in press).
Though here we do not report analyses of brain activities associated with specific aspects of the recorded movements themselves, the present study demonstrates the feasibility of and necessary requirements for MoBI studies. We here demonstrate the reliable measurement and source modeling of the amplitudes, latencies, scalp topographies, and source distributions of visual stimulus-evoked potentials in standing and walking movement conditions.
Materials and Methods
Participants
Subjects included 12 healthy adult subjects recruited from the University of Michigan. One subject’s data had to be excluded due to excessive artifacts in the EEG recordings. The remaining 11 subjects (mean age 24.2 years ± 3.4 SD; 10 males, 1 female) were familiar with treadmill walking and had no history of neurological disorders. Informed consent was obtained from each subject prior to the experiment and all procedures were approved by the local ethics committee and complied with the standards defined in the Declaration of Helsinki.
Experimental Design and Procedure
Subjects were asked to stand, walk, or run on a treadmill facing a computer monitor placed 50 cm in front of them (Figure 1). Non-target (80%) and target (20%) stimuli (vertical or 45° rotated black crosses, respectively) were displayed for 500 ms on a white background. Inter-stimulus intervals varied quasi-randomly between 500 and 1500 ms. Participants performed four different movement conditions: (1) standing on the treadmill; (2) slow walking (0.8 m/s); (3) fast walking (1.25 m/s); (4) and running (1.9 m/s). Each session began with the standing condition followed by the other three conditions in random order. Two 10-min experimental blocks were performed for each condition. During the first block, subjects pressed a button on a Wii (Nintendo, Kyoto, Japan) remote control held in their right hand whenever the target stimulus appeared. During the second block, subjects silently counted the number of target stimuli presented without pressing any button on the Wii remote. Both blocks were aggregated for data analyses. Custom DataRiver and Producer software (Delorme et al., 2010; Vankov et al., 2010) captured and synchronized data from the EEG and Wii remote online. All other data streams were synchronized offline.
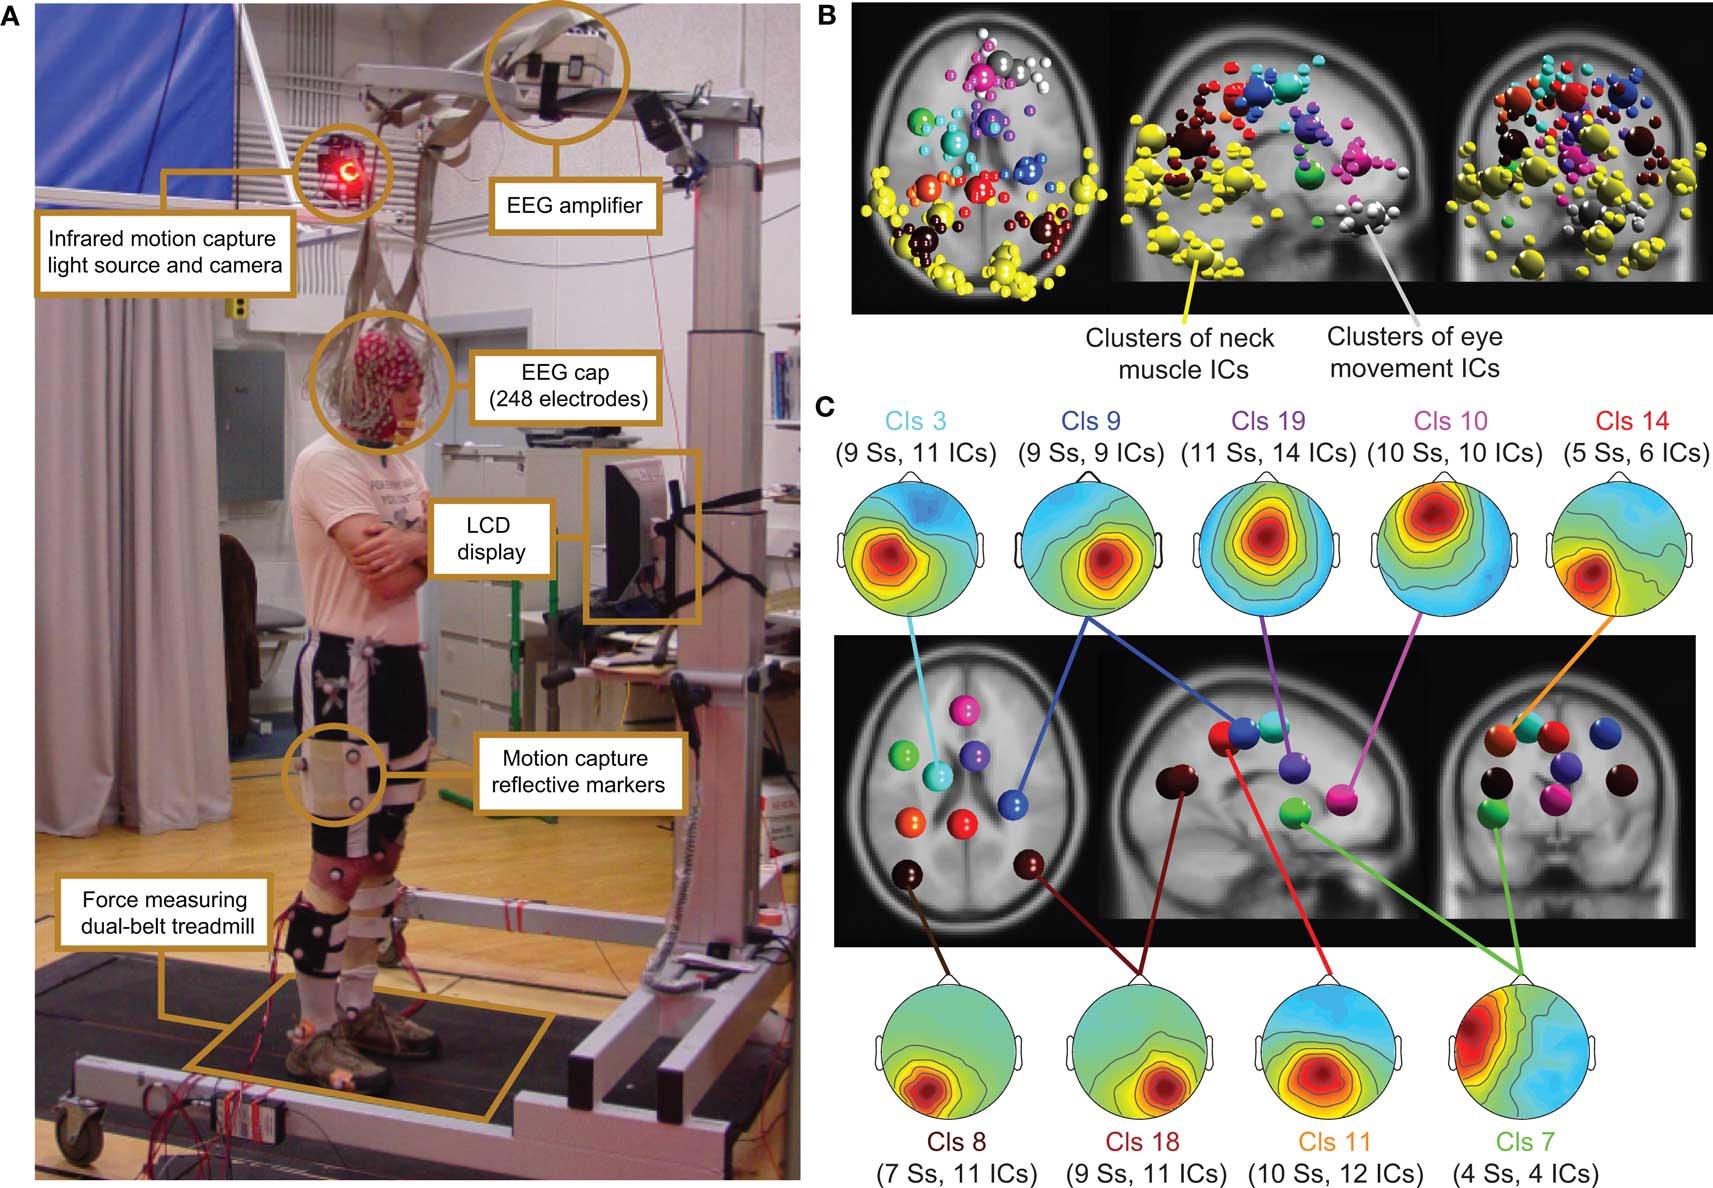
Figure 1. (A) Experimental setup: subject standing on the dual-belt treadmill facing the LCD display. Components of the experimental setup are highlighted and described in the linked text boxes. (B) Equivalent-dipole locations of independent component (IC) processes (small spheres) and IC cluster centroids (large spheres) projected on horizontal, sagittal, and coronal views of the standard MNI brain. (Yellow) Neck-muscle ICs; (gray) eye-movement ICs; (other colors) brain-based ICs (C) (Scalp maps) Mean projections to the scalp of the indicated brain-based IC clusters. Labels give the index (Cls #), number of subjects (Ss), and number of independent components (# ICs) for each cluster.
EEG Recording
Subject stood, walked, or ran on a force-measuring treadmill with two (24′-wide) belts mounted flush with the floor with a gap of 0.75′ between them (Collins et al., 2009). The EEG was recorded from 248 active electrodes at a sampling rate of 512 Hz (Active II, Biosemi, Netherlands). Electrodes were placed on the head using a custom cap; electrode impedance was brought below 20 kΩ. The amplifier was placed on a stand above the subject’s head (Figure 1).
EEG Analysis
During a first visual inspection of the data, individual channels with prominent artifacts were removed from the data. Subsequently, channels with standard deviations larger than 1000 μV were rejected, as were channels with kurtosis more than 5 SD from the mean kurtosis across all channels. Finally, we removed channels that were de-correlated (r < 0.4) from neighboring channels more than 1% of the time. On average, 130 EEG channel signals remained (range, 89–164; SD, 24.6; see Figure S1 in Supplementary Material for distribution). EEG data were then re-referenced offline to an average reference. Data intervals containing extreme peak-to-peak deflections (±1000 μV) were excluded from further analysis. Normal eye movement potentials did not qualify data for rejection.
Data were analyzed by custom Matlab scripts built on the open source EEGLAB toolbox (Delorme and Makeig, 2004) (http//sccn.ucsd.edu/eeglab). After digitally filtering to remove frequencies below 1 Hz, we applied an adaptive independent component analysis (ICA) mixture model algorithm [AMICA] (Palmer et al., 2006, 2008) generalizing previously proposed infomax (Bell and Sejnowski, 1995; Lee et al., 1999a) and multiple mixture (Lee et al., 1999b; Lewicki and Sejnowski, 2000) ICA approaches, to parse EEG signals into spatially static, maximally temporally independent component (IC) processes (Makeig et al., 1996). Default extended-mode training parameters were used.
For each subject, IC activation time series were classified as accounting primarily for brain or non-brain source activities by visual inspection of their activation time courses, spectra, and scalp topographies. Then an equivalent current dipole model was computed for each IC scalp topography using a boundary element head model (BEM) implemented in the DIPFIT toolbox (Oostenveld and Oostendorp, 2002). The co-registration of the MNI brain (Montreal Neurological Institute, MNI, Quebec) with standard EEG electrode positions was performed by aligning landmarks (nasion, inion, ears, and vertex), then rescaling and rotating the montage using DIPFIT functions implemented in the EEGLAB toolbox. ICs with bilaterally distributed scalp maps were fit with a dual equivalent dipole model with a left-right positional symmetry constraint.
Next, ICs were classified as accounting for brain activity if their equivalent dipole models were located in the brain and their scalp projection through a spherical forward head model had less than 15% residual variance from the IC scalp map. Those ICs with model equivalent dipole(s) located outside the brain (including those accounting primarily for scalp or neck muscle activities) were also rejected for further analysis when their equivalent dipole models had more than 50% residual variance from the spherical forward-model scalp projection. This procedure led to an average of 18.4 ICs per participant (±3.9 SD) used in further analyses (range 15–25; 203 ICs in all).
Following ICA decomposition, the data were separated into 2-s epochs with onsets of visual stimuli relative to a 1-s pre-stimulus baseline. Selected ICs from all subjects were then clustered based on similarities in equivalent dipole locations and mean event-related dynamics (mean log spectra, ERPs, event-related spectral perturbations (ERSPs), and inter-trial coherences, ITCs). To compute ERSPs and ITCs, each IC time series was transformed into a spectrographic image using 3-cycle Morlet wavelets with an increasing number of wavelet cycles across a frequency range between 3 Hz (3 cycles) and 150 Hz (75 cycles). Spectrographic images were converted to mean ERSP images by converting the trial spectrograms to log power, averaging trials for each segment, and then subtracting the across-epochs mean log power at each frequency in the pre-stimulus interval beginning 1000 ms before visual stimulus onsets (Makeig, 1993).
Subsequently, each of the IC measures using in clustering (other than dipole locations) was reduced to their first 10 principal components (PCs) by principal component analysis (PCA) and weighted for subsequent clustering. The equivalent dipole location is inherently three-dimensional and was up-weighted by a factor of 25. ERSP PCs were given a weight of 3, ERP PCs were weighted by 5, and spectra and ITCs were given a weight of 1. These weights were chosen heuristically based on the experimental protocol: the relatively large weight for dipole location compensated for its inherently reduced dimensionality and promoted spatially tight clusters. Because we used transient visual stimulation, we expected temporally distinct ERPs in spatially distinct brain regions; up-weighting them made clustering more sensitive to IC ERP differences. Other aspects of brain responses to visual stimulation are revealed in ERSPs; these were consequently weighted higher than spectra and ITC measures. These weighted measures were further compressed by PCA into a single 53-dimensional cluster position vector. ICs were then clustered using a K-means clustering algorithm applied to the matrix of IC-pair distances in this cluster position space using EEGLAB. ICs whose distance to any cluster centroid in joint measure space was more than three standard deviations from the mean were removed from further analysis. There were 32 of these outliers (leaving 171 clustered ICs, mean 15.5 ICs per subject; of these, 83 were brain source ICs, an average of 7.5 brain per subject).
Event-related potential analysis
After ERPs were reduced to linear mixtures of brain-activity ICs only, back projected to and summed at the scalp electrodes, two peak features (referred to below as “N1” and “P3”) were selected for further analysis based on the literature at fronto-central (Fz), centro-central (Cz), and parieto-central (Pz) electrode positions. To measure the N1 peak (referred to as the “N1 component” in ERP literature), for each subject and condition the peak negative ERP values between 80 and 200 ms at were located and their smoothed amplitudes (including two sample points before and after the peak) were measured relative to a 200-ms pre-stimulus baseline value. P3 feature amplitudes at the same three scalp channels were measured as mean ERP amplitude in the time period between 350 ms and 450 ms. For each ERP feature (N1, P3), a 2 × 3 factorial repeated measures analysis of variance (ANOVA) was performed with factors “Stimulus” (target versus non-target stimuli) and “Movement” (standing, slower walking, and faster walking). Three electrode locations (Fz, Cz, Pz) were treated as a repeated measure. In cases where the assumption of sphericity was violated, Greenhouse–Geisser corrected values are reported. Post hoc honestly significant difference (HSD) contrasts (Tukey, 1949) were used for further testing of significant main effects.
Results
Independent component analysis decomposition of EEG recorded during standing, slow walking, and fast walking dissociated brain activity from line noise, as well as from neck muscle and eye movement activity. During running, large mechanical artifacts were present in the EEG that could not be decomposed by ICA into one or only a few components. Instead, the EEG during running had to be pre-processed using a template-based artifact rejection technique that made use of the kinematic data derived from motion capture (Gwin et al., 2010). Here, we report results for the standing, slow walking, and fast walking conditions only.
Scalp Recorded Event-Related Potentials Before and After Spatial Filtering
We inspected scalp recorded ERPs time-locked to the onset of targets or non-target visual stimuli while subjects were standing, slow walking, or fast walking (Figure 2). As expected, the activity recorded by most scalp channels was contaminated with non-brain artifacts that were most pronounced during fast walking. Thus, we excluded all non-brain IC processes and back-projected the activities of only those ICs whose equivalent current dipoles were located in the brain. This rejected IC activities associated with scalp and neck muscle activities, eye movements, line noise, electrocardiogram, and other artifacts.
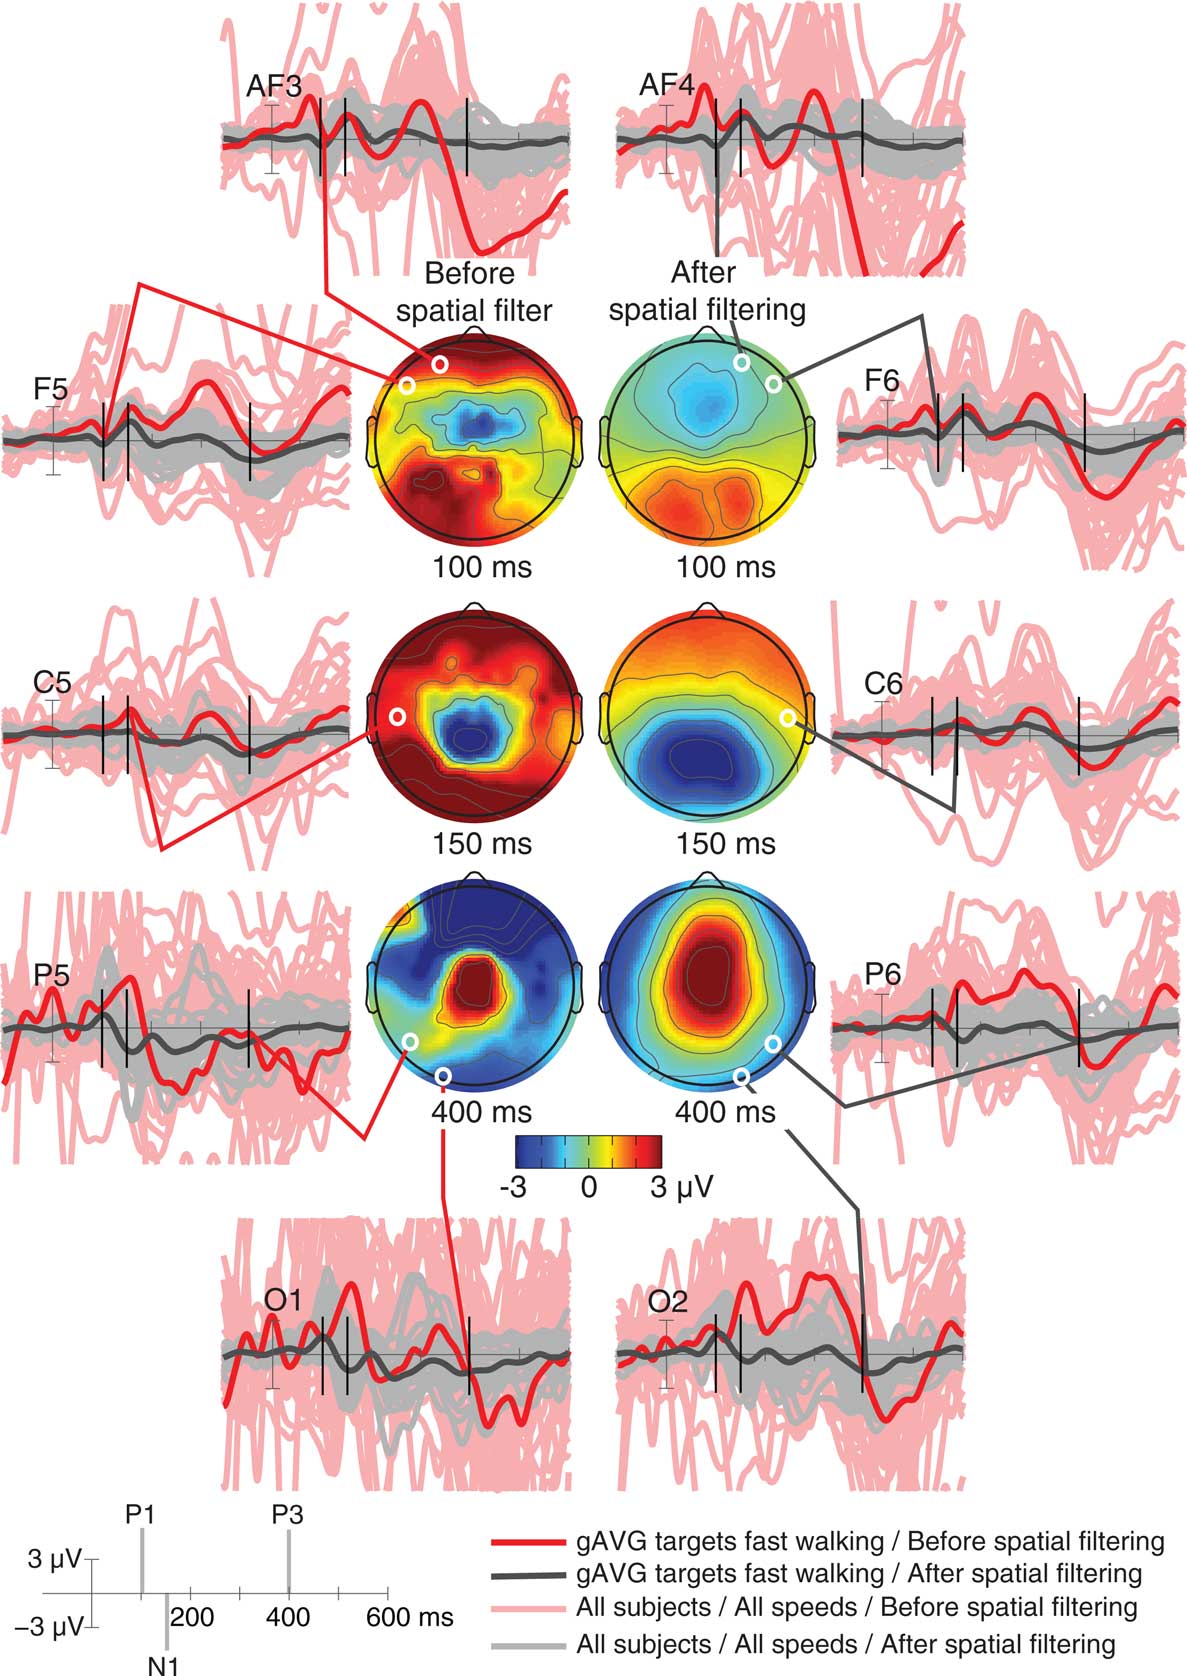
Figure 2. Single-subject and grand average visual target event-related potentials at indicated electrodes across three movement conditions (standing, slow walking, and fast walking). Overlapping single-subject and movement-condition ERP traces are shown before (light pink traces) and after (gray traces) spatially filtering and rejection of artifacts using ICA. Bold traces show the grand average (gAVG) ERPs at the indicated electrode locations in the most contaminated fast walking condition only, before (red) and after (black) removing non-brain independent component (IC) processes. Scalp maps show grand average scalp topographies of the raw (left column) and the artifact-removed ERPs at three peak latencies (100 ms, P1; 150 ms, N1; 400 ms, P3). White dots indicate the locations of the indicated electrodes.
To test the relative contributions of clustered brain, non-brain (eye- and neck-muscle), and all other non-clustered ICs to the grand average ERPs time locked to onsets of target and non-target stimuli, we computed the relative variance of clustered brain, non-brain, and non-clustered ICs (as identified by their scalp maps, spectra, and dipole location) to the overall signal (all reconstructed ICs) (Figure 3).
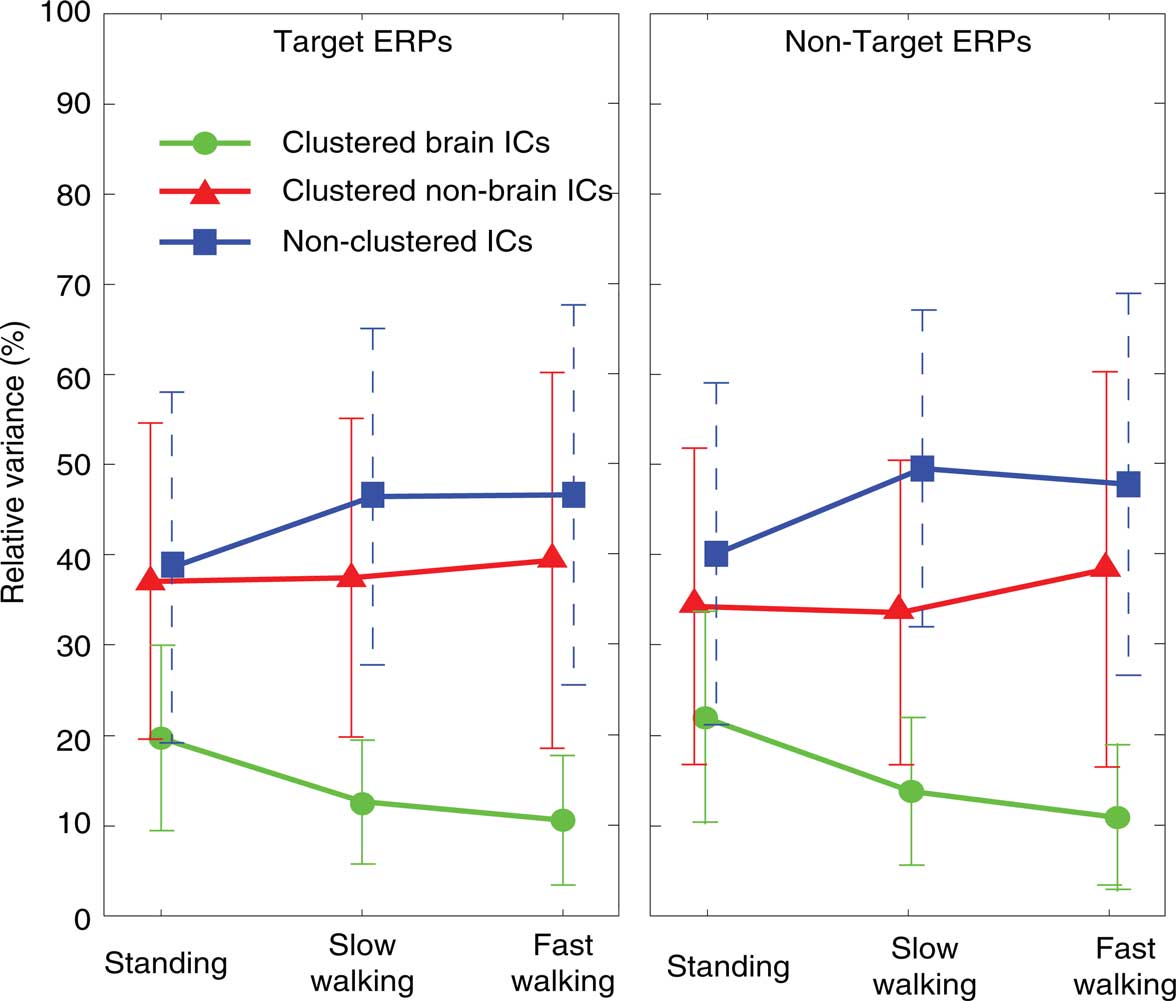
Figure 3. Percentage of variance of clustered brain IC ERP projections (measured from −1 to 2 s, green lines), clustered non-brain IC projections (eye-movement and neck muscle activities; red lines), and non-clustered IC projections (unclassified; blue lines) relative to the variance of the grand-average ERPs summing projections of all three IC classes. Left and right panels show results for ERPs time locked to onsets of target (left column) and non-target stimuli (right column) in the three movement conditions (standing, slow walking, fast walking).
As Figure 3 shows, the raw grand-average ERPs before spatial filtering included more identifiable non-brain source activities (36.7% across all conditions) and other non-identifiable activity (44.9% across all conditions) than source activities identified as arising in the brain; the variance of their summed projections was only 14.9% on average of the raw ERP variance. The ERP contribution of clustered brain components decreased with increasing movement speed [F(2,20) = 21.63, p < 0.001; η2 = 0.684] while the variance of the ERP contributions from the non-brain and non-cluster ICs was not significantly different across movement conditions (all p’s > 0.4).
Contributions of Brain, Eye-, and Neck Muscle ICs to the Surface Signal
Next, we investigated mean task-dependent activities of spatially segregated IC clusters following onsets of standard and target stimuli. In a first step we computed the percent variance accounted for (pvaf) by each IC cluster contributing to the scalp ERP across the latency range from stimulus onset to 600 ms post stimulus. Clusters of independent component processes associated with brain, eye, and neck muscle activity were combined and back-projected to the sensors (Figure 4, light gray area). The strongest contribution to the back-projected activity originated from clusters representing eye movements and neck muscle activity. One independent component cluster (Cluster 6) representing vertical eye movements accounted for approximately 52, 90, and 77% of the variance of the grand-average ERP (aggregated over target and standard stimuli) while subjects were standing, slow walking, and fast walking, respectively1. The nine clusters representing neck muscle activity accounted for 5, 3, and 15% of the variance of the grand-average ERP during standing, slow walking, and fast walking, respectively. In contrast, the percent variance of the grand-average ERP accounted for by the nine IC clusters representing brain activity was 6, 3, and 4% during standing, slow walking, and fast walking, respectively. Thus, the contribution of identifiable brain IC processes to the grand-mean ERP was relatively small compared to the contributions of eye movement and neck muscle activities. To further investigate the contributions of independent component clusters representing brain activity to the ERPs, we excluded eye and neck muscle clusters.
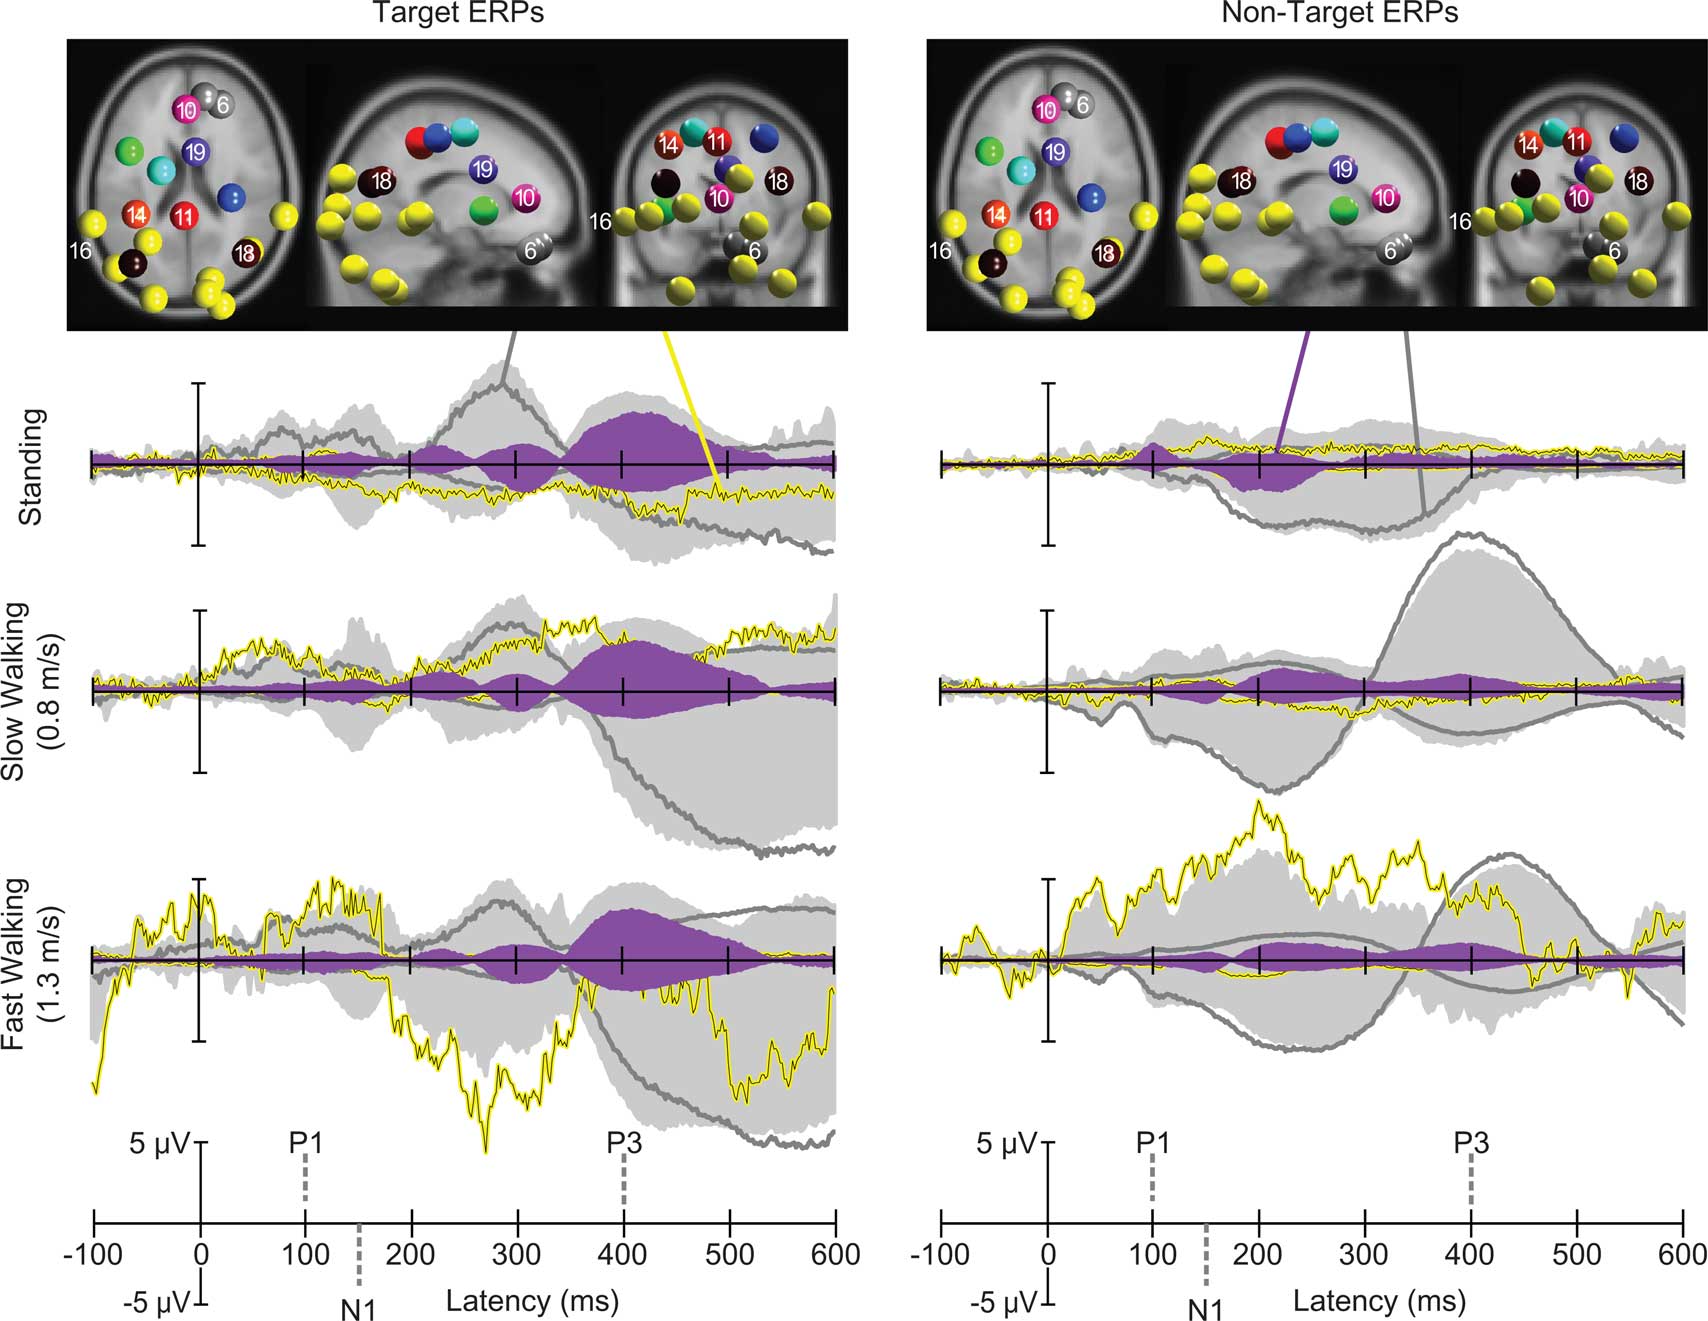
Figure 4. Centroids of IC clusters (colored spheres) visualized in the MNI brain volume in horizontal, sagittal, and coronal views. Gray and yellow spheres represent eye and neck muscle activity clusters, respectively. Other-colored spheres mark centroids of brain IC clusters. Traces display grand-mean ERP envelopes (maximum and minimum channel ERP values at each latency) summing back-projections of all IC clusters (light gray areas), envelopes of one representative neck muscle cluster (Cluster 16, yellow traces) and a representative eye movement cluster (Cluster 6, dark gray traces). Filled purple envelopes show the back-projected contribution of one IC cluster (19) with equivalent dipoles in or near anterior cingulate cortex. Left column: visual target stimulus responses in the three movement conditions. Right column: non-target stimulus responses.
The Impact of Attention and Movement on the ERP
As Figure 5 shows, the spatially filtered ERPs summing only the clustered brain source activities included the expected visual evoked P1–N1 peak sequence at posterior electrode locations in all three movement conditions (Anderer et al., 1998; Herrmann and Knight, 2001). In all movement conditions, P1 peak amplitude was comparable for target and non-target responses, while the N1 peak amplitude at posterior scalp electrodes was larger in target than in non-target stimulus responses (e.g., at electrode Pz [F(1,10) = 11.72, p < 0.007; η2 = 0.540]). In the latency range of the late positive (P3) complex (between 350 and 450 ms), mean ERP amplitude was larger following target stimuli (e.g., at electrode Pz [F(1,10) = 20.49, p < 0.001; η2 = 0.672]), and this difference was constant across movement conditions (p’s < 0.003).
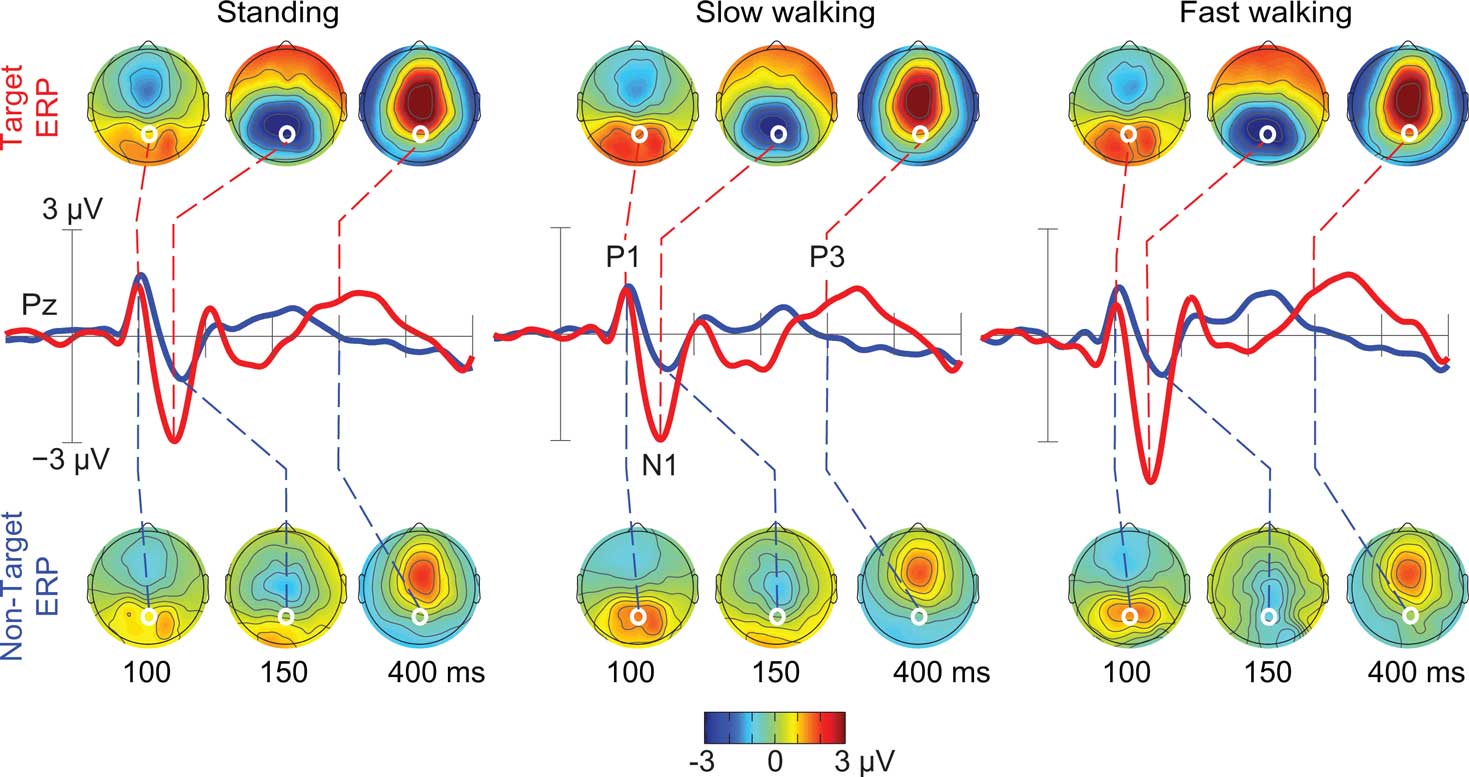
Figure 5. Grand-average ERPs following ICA-based artifact removal in the standing, slow walking, and fast walking conditions. Middle-row traces show ERP time courses at electrode Pz (red, target ERPs; blue, non-target ERPs). Scalp maps show the grand-average ERP scalp distributions at 100, 150, and 400 ms after onsets of target stimuli (upper row) and non-target stimuli (lower row). White dots indicate the location of electrode Pz. Note the scalp map similarities across movement conditions.
To test whether N1 and P3 peaks demonstrated comparable amplitudes in the three movement conditions, we compared component amplitudes associated with target and non-target responses for standing, slow walking, and fast walking. Figure 6 displays individual P3 amplitudes for target and non-target stimuli in each of the three movement conditions. To test whether component amplitudes were similar across movement and stimulus conditions, we computed intra-class correlation coefficients (ICCs) using a two-way mixed model. The results revealed an ICC of 0.603 (averaged measures ICC = 0.901; p’s < 0.001) signifying that P3 amplitudes were similar in all conditions. Comparable results were obtained for P3 amplitudes with a significant ICC of 0.628 (averaged measures ICC = 0.910; all p’s < 0.001).
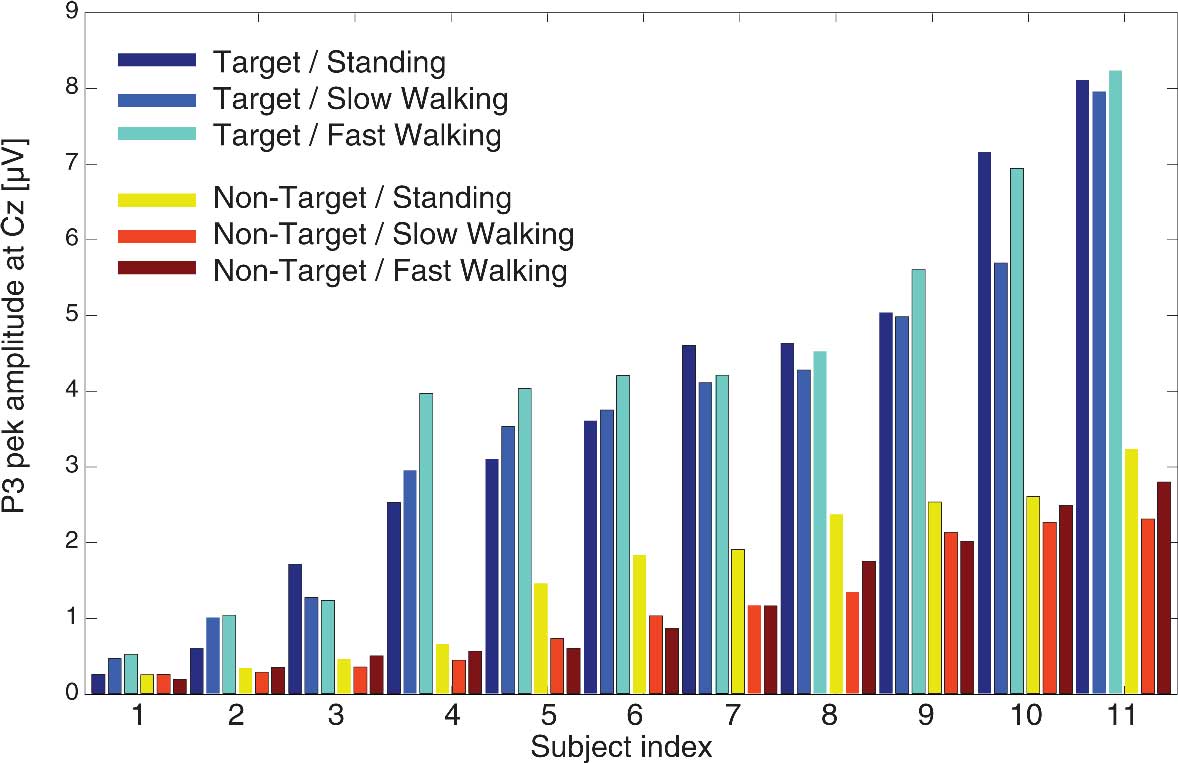
Figure 6. Individual P3 peak amplitudes at electrode Cz for target stimuli (cool colors) and non-target stimuli (warm colors) in the three movement conditions.
The significant ICCs for N1 and P3 peak amplitudes indicate that ICA-based spatial filtering successfully separated brain activity from non-brain activity while subjects were actively moving and that, after spatially filtering the averaged responses, the speed of movement did not affect the amplitudes of either early or late visual stimulus ERP features.
Clusters of Brain ICs and the Associated Event-Related Potential
Computing the pvaf by brain IC clusters most strongly contributing to the scalp ERP in the latency ranges of the N1 and the P3 complexes revealed that, as expected, a distributed set of brain areas were involved in generating these ERP features (Tables S1 and S2 in Supplementary Material) (Makeig et al., 2002, 2004b). Clusters of IC processes located in or near the occipital and parietal cortex (Cls 11, 14, and 18 in Figure 4) accounted for 30% of variance in the 80–200 ms time window of the grand average ERP summing the back-projections of brain IC clusters only (Figure 7).
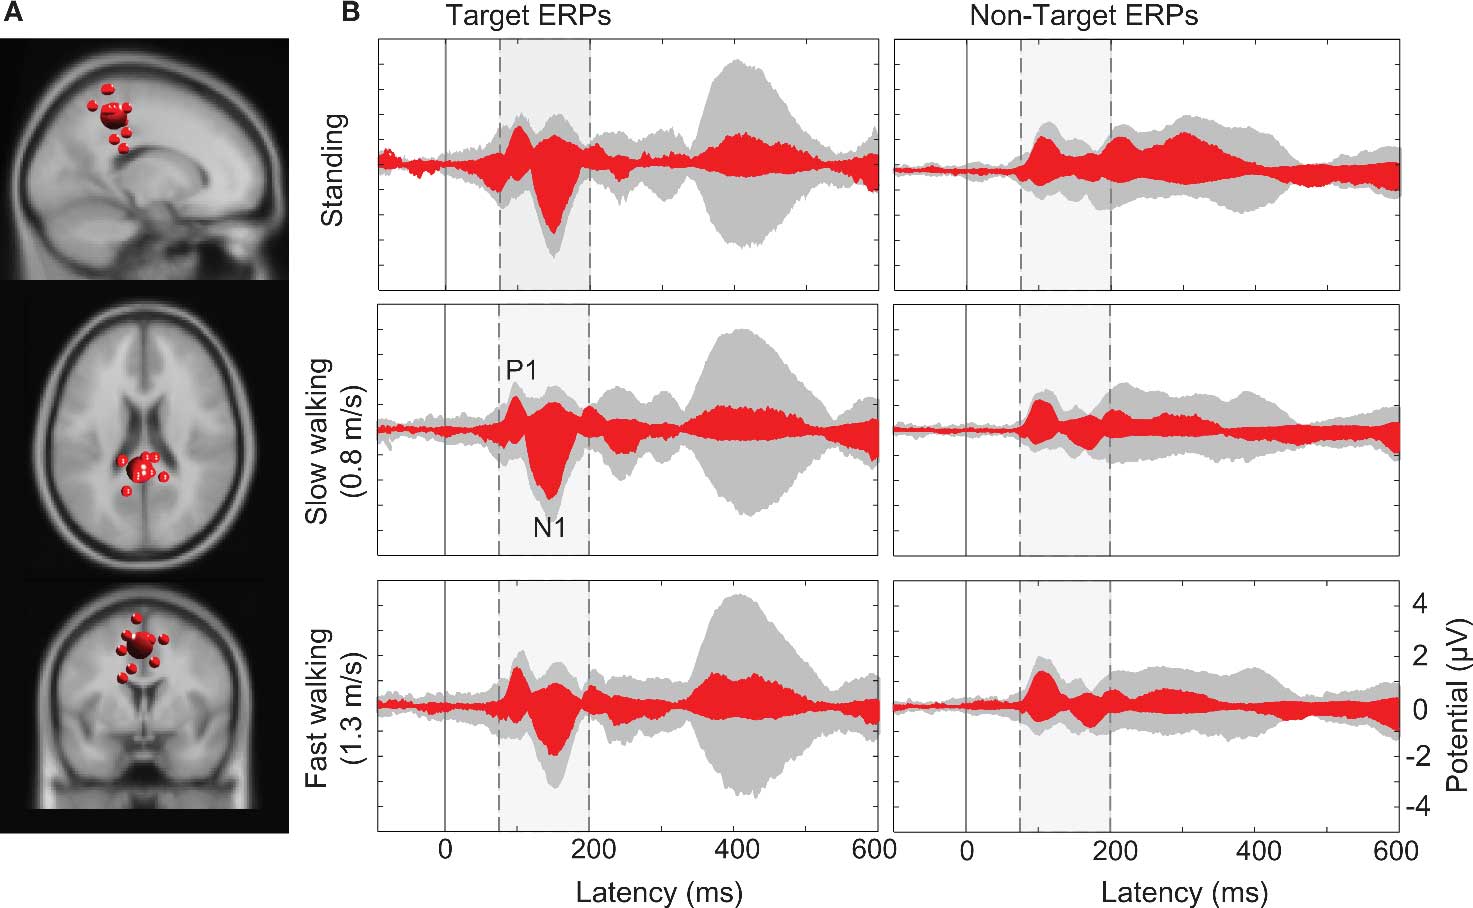
Figure 7. (A) Centroid (bigger sphere) and individual ICs (12 ICs from 10 subjects displayed as smaller spheres) in or near superior parietal cortex (BA7) projected onto the standard MNI brain volume. (B) Target and non-target stimulus ERPs (middle and right columns) in the (dashed/shaded) P1-N1 latency range. Gray-shaded “ERP envelopes” tightly enclose the bundle of spatially filtered scalp channel ERP traces at each latency. Red-filled envelopes outline the ERP contributions of the IC cluster contributing most strongly to the “ERP envelopes.”
Larger visual evoked N1 peaks at posterior electrodes in the target-stimulus ERPs (Figure 7B left column) were accounted by ICA as indexing increased activity in IC clusters located in or near right-lateral occipital cortex, and superior and inferior parietal cortex. In contrast, 40% of the variance in the 350–500 ms time window of the target-response ERPs was accounted for in all movement conditions by two IC clusters (Cls 19 and 10) with equivalent dipoles in or near anterior cingulate cortex (see Figures 4 and 8; Tables S1 and S2 in Supplementary Material).
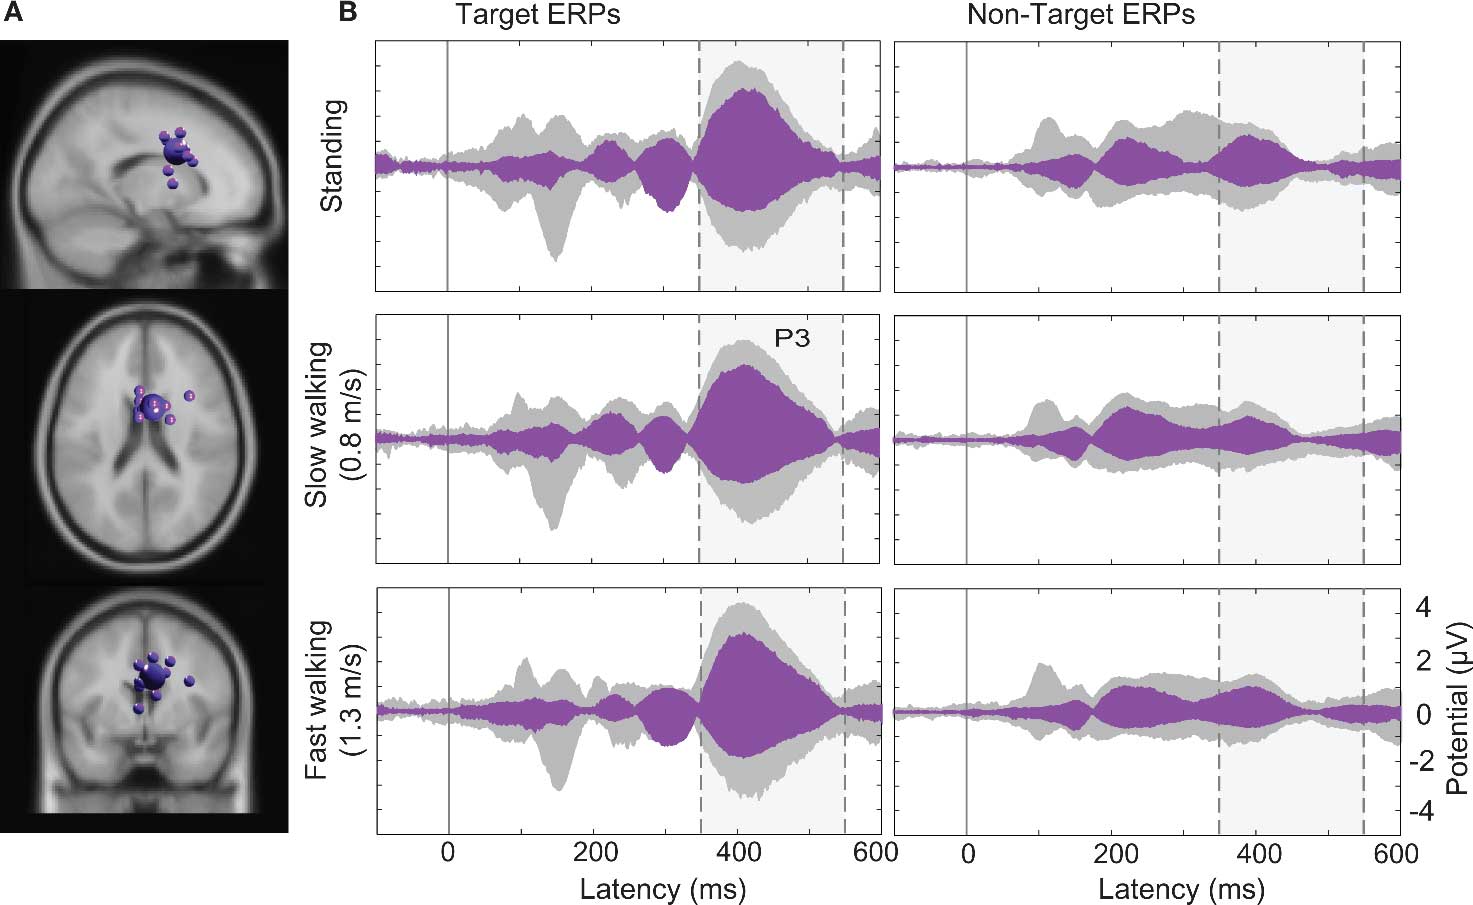
Figure 8. (A) Centroid (bigger sphere) and individual ICs of the IC cluster (19) contributing most strongly to the P3 peak. This cluster comprised 13 ICs from 11 subjects (here displayed as smaller spheres) in or near anterior cingulate cortex (BA32, here shown in the standard MNI brain volume). (B) Target and non-target stimulus ERPs (middle and right columns) in the (dashed/shaded) P3 latency range. Gray-shaded “ERP envelopes” enclose the bundle of spatially filtered scalp channel ERP values. Magenta-filled envelopes enclose the ERP contributions to the scalp channel data.
Discussion
We recorded and analyzed brain activity accompanying cognitive processing of two visual stimuli (vertical/horizontal and diagonal crosses), while participants stood or walked on a treadmill at various speeds. We used the well-known visual oddball paradigm to test whether it was possible to replicate, during steady-state walking, the event-related P3 target/non-target differences typically seen during discrimination of rare versus frequent visual stimuli while seated. The results demonstrate that ICA decomposition and spatial filtering does allow recording and analysis of cognitive and sensory EEG brain activity while subjects perform constant whole-body movements.
Inspection of scalp activity at single channels in different movement conditions demonstrated that, as expected, the traditional approach of averaging all or most stimulus responses at each scalp channel is not appropriate to imaging the mobile brain. Faster walking was associated with larger displacements of the head (Hirasaki et al., 1999) and with at least three non-brain sources of recorded EEG activity: (1) mechanical artifacts reflecting frequency-specific cable sway produced by head movement (Gwin et al., 2010), (2) eye movements (e.g., vertical) associated with head displacements, combined with (3) neck muscle activity compensating for head displacements to maintain visual focus on the monitor. That is, while participants were walking their heads moved up and down, from side to side, and from back to front with each step cycle. The faster the participants walked, the more pronounced these head displacements (Hirasaki et al., 1999).
To perform the secondary visual task, head displacements occurring during walking or running had to be compensated for to allow inspection of the stationary LCD display. Independent components accounting for eye movements thus explained most of the variance of the raw scalp ERP, with neck muscle activities explaining some additional variance. Using data-driven ICA source decomposition methods, we were able to separate brain EEG activities, very likely arising as locally synchronous islands of cortical field activity, from electric signals associated with eye movements and neck muscle activity. Although large artifacts produced in the data record during jogging (likely in large part arising from cable sway) were more difficult to remove from the rest of the data, near future developments in wireless dry electrodes and EEG recording systems might eliminate or minimize this problem (Lin et al., 2008).
Reducing the scalp data to only the contributions of IC processes with robust equivalent dipole models located in the brain itself, we found that N1 amplitudes were enhanced at posterior electrodes following target stimulus onsets, replicating the finding that task instruction and frequency (here, “respond to the rare stimulus”) have an influence on this response feature (Potts et al., 2004) and further supporting the observation that the N1 reflects discriminative processes at an attended location (Vogel and Luck, 2000). In addition, P3 amplitudes were more positive following target than non-target stimuli, reproducing results of a long history of reports on this ERP feature (Sutton et al., 1965; Picton, 1992; Soltani and Knight, 2000).
Our ICA decompositions of the concatenated single-trial EEG data again revealed that both ERP components (N1 and P3) are accounted as summed mixtures of concurrent volume-conducted potential contributions from several cortical areas (Makeig et al., 1999, 2002, 2004; Makeig, 2002). While parieto-occipital and parietal sources significantly contributed to the N1 component, the cortical areas contributing most strongly to the P3 feature were located in or near two areas of anterior cingulate cortex. These results replicate earlier findings that a widespread set of areas was involved in the generation of the P3 in immobile, seated participants (Makeig et al., 2004). Here we demonstrated, for the first time, that a generally similar set of cortical sources contribute to the N1 and P3 complexes of non-target averaged visual stimulus responses while subjects stand and walk (either at 0.8 or 1.25 m/s).
Several investigations have shown smaller P3 amplitudes of ERPs time locked to secondary-task stimuli when primary task difficulty was increased. Ebersbach et al. (1995) also demonstrated that walking produced a significant (nearly one-digit) decrease in a digit recall. Here, interestingly, there was no influence of walking speed on P3 peak amplitude. This result suggests that steady treadmill walking did not pose any greater demands on performance of the visual oddball task than standing. It is likely our concurrent tasks were too easy to produce an attentional resource conflict. This is consistent with prior work suggesting that multi-tasking does not pose a significant threat to postural stability in healthy young adults (for a review, see Woollacott and Shumway-Cook, 2002). Future studies could vary the difficulties of the motor and/or cognitive tasks to study this question further.
In sum, we here have demonstrated the feasibility of MoBI studies of event-related EEG dynamics in subjects performing full-body movements in a 3-D environment. Future MoBI studies will address critical questions concerning macroscopic brain dynamic patterns supporting motivated motor behavior and more general aspects of embodied cognition. Answers to many questions that were formerly not possible to investigate using brain imaging may now be approached. For example: How are eye movements, head movements and brain activity accompanying attentional orienting interrelated? What are the accompanying brain activity of spatial cognitive processes while subjects experience natural vestibular and proprioceptive feedback associated with heading changes during navigation? New information available from detailed analysis of concurrently recorded EEG and body motion data, an imaging modality we refer to as MoBI, should open new avenues for analyzing the association of brain dynamics with specific aspects of movement (Prilutsky et al., 2005; Fitzsimmons et al., 2009; Kao et al., 2010) and motivated action (Makeig et al., 2009).
Conflict of Interest Statement
The authors declare that the research was conducted in the absence of any commercial or financial relationships that could be construed as a potential conflict of interest.
Footnote
- ^The summed variance accounted by back-projecting clusters of independent component processes to the ERP data can exceed 100% because of possible phase cancellation of IC contributions to the scalp channel signals with opposite sign.
References
Anderer, P., Pascual-Marqui, R. D., Semlitsch, H. V., and Saletu, B. (1998). Differential effects of normal aging on sources of standard N1, target N1 and target P300 auditory event-related brain potentials revealed by low resolution electromagnetic tomography (LORETA). Electroencephalogr. Clin. Neurophysiol. 108, 160–174.
Bell, A. J., and Sejnowski, T. J. (1995). An information-maximization approach to blind separation and blind deconvolution. Neural Comput. 7, 1129–1159.
Churchland, P. S., Ramachandran, V. S., and Sejnowski, T. J. (1994). “A critique of pure vision,” in Large-Scale Neuronal Theories of the Brain, eds C. Koch and J. L. Davis (Cambridge, MA: MIT Press), 23–60.
Collins, S. H., Adamczyk, P. G., Ferris, D. P., and Kuo, A. D. (2009). A simple method for calibrating force plates and force treadmills using an instrumented pole. Gait Posture, 29, 59–64.
Delorme, A., Kothe, C., Bigdely-Shamlo, N., Vankov, A., Oostenveld, R., and Makeig, S. (2010). “Matlab tools for BCI research?,” in Human-Computer Interaction and Brain-Computer Interfaces, eds D. Tan and A. Nijholt (Berlin: Springer), 241–259.
Delorme, A., and Makeig, S. (2004). EEGLAB: an open source toolbox for analysis of single-trial EEG dynamics including independent component analysis. J. Neurosci. Methods 134, 9–21.
Ebersbach, G., Dimitrijevic, M. R., and Poewe, W. (1995). Influence of concurrent tasks on gait: a dual-task approach. Percept. Mot. Skills 81, 107–113.
Fitzsimmons, N. A., Lebedev, M. A., Peikon, I. D., and Nicolelis, M. A. (2009). Extracting kinematic parameters for monkey bipedal walking from cortical neuronal ensemble activity. Front. Integr. Neurosci. 3:3. doi: 10.3389/neuro.07.003.2009.
Gramann, K., Onton, J., Riccobon, D., Mueller, H. J., Bardins, S., and Makeig, S. (2010). Human brain dynamics accompanying use of egocentric and allocentric reference frames during navigation. J. Cogn. Neurosci. 22, 2836–2849.
Gwin, J. T., Gramann, K., Makeig, S., and Ferris, D. P. (2010). Removal of movement artifact from high-density EEG recorded during walking and running. J. Neurophysiol. 103, 3526–3534.
Gwin, J. T., Gramann, K., Makeig, S., and Ferris, D. P. (in press). Electrocortical activity is coupled to gait(cycle )phase during treadmill walking. Neuroimage.
Herrmann, C. S., and Knight, R. T. (2001). Mechanisms of human attention: event-related potentials and oscillations. Neurosci. Biobehav. Rev. 25, 465–476.
Hirasaki, E., Moore, S. T., Raphan, T., and Cohen, B. (1999). Effects of walking velocity on vertical head and body movements during locomotion. Exp. Brain Res. 127, 117–130.
Kao, P. C., Lewis, C. L., and Ferris, D. P. (2010). Invariant ankle moment patterns when walking with and without a robotic ankle exoskeleton. J. Biomech. 43, 203–209.
Lee, T. W., Girolami, M., and Sejnowski, T. J. (1999a). Independent component analysis using an extended infomax algorithm for mixed subgaussian and supergaussian sources. Neural Comput. 11, 417–441.
Lee, T. W., Lewicki, M. S., Girolami, M., and Sejnowski, T. J. (1999b). Blind source separation of more sources than mixtures using overcomplete representations. IEEE Signal Process. Lett. 6, 87–90.
Lewicki, M.S., Sejnowski, T.J., (2000). Learning overcomplete representations. Neural Comput. 12, 337–365.
Lin, C.-T., Ko, L.-W., Chiou, J.-C., Duann, J.-R., Huang, C. C., Liang, C. C., Chiu, T.-W., and Jung, T.-P. (2008). “Noninvasive neural prostheses using mobile and wireless EEG,” in Proceedings of the IEEE 96, 1167–1183.
Makeig, S. (1993). Auditory event-related dynamics of the EEG spectrum and effects of exposure to tones. Electroencephalogr. Clin. Neurophysiol. 86, 283–293.
Makeig, S. (2002). Response: event-related brain dynamics – unifying brain electrophysiology. Trends Neurosci. 25, 390.
Makeig, S., Bell, A. J., Jung, T. P., and Sejnowski, T. J. (1996). Independent component analysis of electroencephalographic data. Adv. Neural Inf. Process. Syst. 8, 8, 145–151.
Makeig, S., Debener, S., Onton, J., and Delorme, A. (2004a). Mining event-related brain dynamics. Trends Cogn. Sci. 8, 204–210.
Makeig, S., Delorme, A., Westerfield, M., Jung, T.-P., Townsend, J., Courchesne, E., and Sejnowski, T. J. (2004b). Electroencephalographic brain dynamics following manually responded visual targets. PLoS Biol. 2, e176. doi: 10.1371/journal.pbio.0020176.
Makeig, S., Gramann, K., Jung, T. P., Sejnowski, T. J., and Poizner, H. (2009). Linking brain, mind and behavior. Int. J. Psychophysiol. 73, 95–100.
Makeig, S., Westerfield, M., Jung, T. P., Covington, J., Townsend, J., Sejnowski, T. J., and Courchesne, E. (1999). Functionally independent components of the late positive event-related potential during visual spatial attention. J. Neurosci. 19, 2665–2680.
Makeig, S., Westerfield, M., Jung, T. P., Enghoff, S., Townsend, J., Courchesne, E., and Sejnowski, T. J. (2002). Dynamic brain sources of visual evoked responses. Science 295, 690–694.
Miyai, I., Tanabe, H. C., Sase, I., Eda, H., Oda, I., Konishi, I., Tsunazawa, Y., Suzuki, T., Yanagida, T., and Kubota, K. (2001). Cortical mapping of gait in humans: a near-infrared spectroscopic topography study. Neuroimage 14, 1186–1192.
Oostenveld, R., and Oostendorp, T. F. (2002). Validating the boundary element method for forward and inverse EEG computations in the presence of a hole in the skull. Hum. Brain Mapp. 17, 179–192.
Palmer, J. A., Kreutz-Delgado, K., and Makeig, S. (2006). “Super-Gaussian mixture source model for ICA,” in Lecture Notes in Computer Science, eds J. Rosca, D. Erdogmus, J. C. Principe, and S. Haykin, (Heidelberg: Springer), 854–861.
Palmer, J. A., Makeig, S., Delgado, K. K., and Rao, B. D. (2008). “Newton method for the ICA mixture model,” in IEEE International Conference on Acoustics, Speech and Signal Processing, 2008. ICASSP 2008. IEEE, Las Vegas, Nevada, 1805–1808.
Picton, T. W. (1992). The P300 wave of the human event-related potential. J. Clin. Neurophysiol. 9, 456–479.
Potts, G. F., Patel, S. H., and Azzam, P. N. (2004). Impact of instructed relevance on the visual ERP. Int. J. Psychophysiol. 52, 197–209.
Prilutsky, B. I., Sirota, M. G., Gregor, R. J., and Beloozerova, I. N. (2005). Quantification of motor cortex activity and full-body biomechanics during unconstrained locomotion. J. Neurophysiol. 94, 2959–2969.
Rizzolatti, G., Fogassi, L., and Gallese, V. (2002). Motor and cognitive functions of the ventral premotor cortex. Curr. Opin. Neurobiol. 12, 149–154.
Soltani, M., and Knight, R. T. (2000). Neural origins of the P300. Crit. Rev. Neurobiol. 14, 199–224.
Sutton, S., Braren, M., Zubin, J., and John, E. R. (1965). Evoked-potential correlates of stimulus uncertainty. Science 150, 1187–1188.
Suzuki, M., Miyai, I., Ono, T., and Kubota, K. (2008). Activities in the frontal cortex and gait performance are modulated by preparation. An fNIRS study. Neuroimage 39, 600–607.
Suzuki, M., Miyai, I., Ono, T., Oda, I., Konishi, I., Kochiyama, T., and Kubota, K. (2004). Prefrontal and premotor cortices are involved in adapting walking and running speed on the treadmill: an optical imaging study. Neuroimage 23, 1020–1026.
Vankov, A., Bigdely-Shamlo, N., and Makeig, S. (2010). “DataRiver – a software platform for real-time management of multiple data streams,” in Fourth International BCI Meeting Asilomar, California.
Vogel, E. K., and Luck, S. J. (2000). The visual N1 component as an index of a discrimination process. Psychophysiology 37, 190–203.
Keywords: mobile brain/body imaging, EEG, walking, embodied cognition, independent component analysis
Citation: Gramann K, Gwin JT, Bigdely-Shamlo N, Ferris DP and Makeig S (2010) Visual evoked responses during standing and walking. Front. Hum. Neurosci. 4:202. doi: 10.3389/fnhum.2010.00202
Received: 22 June 2010;
Accepted: 03 October 2010;
Published online: 29 October 2010.
Edited by:
Judith M. Ford, Yale University School of Medicine, USACopyright: © 2010 Gramann, Gwin, Bigdely-Shamlo, Ferris and Makeig. This is an open-access article subject to an exclusive license agreement between the authors and the Frontiers Research Foundation, which permits unrestricted use, distribution, and reproduction in any medium, provided the original authors and source are credited.
*Correspondence: Klaus Gramann, Swartz Center for Computational Neuroscience, Institute for Neural Computation, University of California San Diego, La Jolla, CA, USA. e-mail:a2xhdXNAc2Njbi51Y3NkLmVkdQ==