 Christian Kaul1,2,3

- 1 Department of Psychology and Center for Neural Science, New York University, New York, NY, USA
- 2 Institute of Cognitive Neuroscience, University College London, London, UK
- 3 Wellcome Trust Centre for Neuroimaging, Institute of Neurology, University College London, London, UK
- 4 Institute of Neuroradiology, University of Zurich, Zurich, Switzerland
Face perception in humans is mediated by activation in a network of brain areas. Conventional univariate fMRI data analysis has not localized differential responses to viewing male as compared with viewing female faces within this network. We tested whether we could detect neural response patterns specific to viewing male vs. female faces in 40 participants. Replicating earlier work, face stimuli evoked activation in the core (inferior occipital gyrus, IOG; fusiform gyrus, FG; and superior temporal sulcus, STS), as well as extended (amygdala, inferior frontal gyrus, IFG; insula, INS; and orbitofrontal cortex, OFC) regions of the face network. Multivariate pattern classification of activity within these regions revealed successful decoding of gender information, significantly above chance, in the IOG, FG, STS, IFG, INS, and OFC, but not in the amygdala. Multiple control regions indicated that this result might be restricted to face-responsive regions. Our findings suggest that gender information is distributed across the face network and is represented in the core regions that process invariant facial features, as well as the extended regions that process changeable aspects of faces.
Introduction
Face perception, a highly developed visual skill in humans, is mediated by activation in a distributed neural system that encompasses “core” regions in the visual cortex, and “extended” limbic and prefrontal regions (Haxby et al., 2000; Ishai et al., 2005). The core system includes the fusiform gyrus (FG, also called “FFA”) and the inferior occipital gyrus (IOG, also called “OFA”) that process the identification of individuals (Kanwisher et al., 1997; Ishai et al., 1999; Grill-Spector et al., 2004); and the superior temporal sulcus (STS), where gaze direction and speech-related movements are processed (Puce et al., 1998; Hoffman and Haxby, 2000). The extended system includes the amygdala (AMG) and insula (INS), where facial expressions are processed (Phillips et al., 1997; Ishai et al., 2004); the inferior frontal gyrus (IFG), where semantic aspects are processed (Leveroni et al., 2000; Ishai et al., 2002); and regions of the reward circuitry, including the nucleus accumbens and orbitofrontal cortex (OFC), where the assessment of facial beauty and sexual relevance is processed (Aharon et al., 2001; O’Doherty et al., 2003; Kranz and Ishai, 2006; Ishai, 2007). It has been recently suggested that neural activation and effective connectivity in regions of the core and extended networks are stimulus- and task-dependent (Fairhall and Ishai, 2007; Ishai, 2008). Furthermore, activation in these face-selective regions is modulated by cognitive factors such as expertise, attention, visual imagery, and emotion (Gauthier et al., 1999; Ishai et al., 2000, 2002; Vuilleumier et al., 2001). It is currently unknown, however, whether the gender of a face is represented within the face network and whether or not this representation is localized to a specific region.
Although gender discrimination is an automatic and effortless aspect of face perception, conventional fMRI data analyses have not yet identified regions specialized for the discrimination of facial gender. An early positron emission tomography (PET) study reported that gender categorization activated a posterior region in extrastriate cortex, whereas face identification activated the FG and anterior regions in temporal cortex (Sergent et al., 1992), however perception of male faces was not compared with that of female faces. Adaptation to the gender and race of faces can be observed in the cingulate gyrus, but only weak adaptation effects are seen in the core face system (Ng et al., 2006). Moreover, there is no evidence for differential activation associated with facial gender across the core or extended face networks; rather, any gender-specific differences are modulated by the sexual preference of the participants (Kranz and Ishai, 2006). Furthermore, a recent study reported no effect of male vs. female faces in most areas of the core and extended face network during both encoding and recognition of face stimuli, except for a weak effect in the insula and amygdala during encoding, which was attributed to the emotional character of the face-stimuli (Ino et al., 2010).
As previous studies that failed to demonstrate gender-specific activation used conventional univariate fMRI data analyses, we hypothesized that using multivariate pattern analysis (Haynes and Rees, 2005; Kamitani and Tong, 2005) might enable us to decode gender-specific patterns of activation in the human brain. We therefore re-analyzed data from the Kranz and Ishai (2006) study, as it offered a particularly rich dataset of 40 participants (hetero- and homosexual men and women) who viewed male and female faces and rated their attractiveness. We used a sparse logistic regression (SLR) algorithm (Yamashita et al., 2008) to identify brain areas containing differential spatial activity patterns during the perception of male, as compared with the perception of female faces. To that end, we examined activity within the core and extended regions of the face network. We then compared results from face-responsive regions with results from various control regions in the cingulate gyrus, parietal, and early visual cortex.
Materials and Methods
Detailed information about stimuli, tasks, and fMRI data acquisition were described in (Kranz and Ishai, 2006). Below we provide information about the new multivariate pattern analyses.
Participants
Forty normal, right-handed participants (mean age 26 ± 3 years, 10 subjects in each of four groups, hetero- and homosexual men and women) with normal vision participated in the study. All participants gave informed written consent for the procedure in accordance with protocols approved by the University Hospital of Zurich. Participants were classified as hetero- or homosexuals based on their self-report in a modified version of the Sell (1996) questionnaire.
Stimuli and Task
Stimuli were displayed using Presentation1 and projected with a magnetically shielded LCD video projector onto a translucent screen placed at the feet of the participant. Participants viewed grayscale photographs of faces (three runs) and rated facial attractiveness (five runs). In each run, two epochs of male and two epochs of female faces (30 s each) alternated with epochs of phase-scrambled faces (21 s in viewing, 12 s in attractiveness rating). During an epoch each stimulus was presented for 3 s, with no blank periods between the stimuli. In total, during the viewing condition, 60 male and 60 female faces were presented. During the rating of facial attractiveness, 100 male and 100 female faces were presented. Stimuli included unfamiliar, famous, and emotional (fearful and happy) faces. The order of runs was randomized across participants. Importantly, each run included an equal number of male and female faces. As participants were not instructed to pay attention to the facial gender, any gender processing was implicit during the two tasks. Figure 1 (top) shows examples of the face-stimuli used in the study.
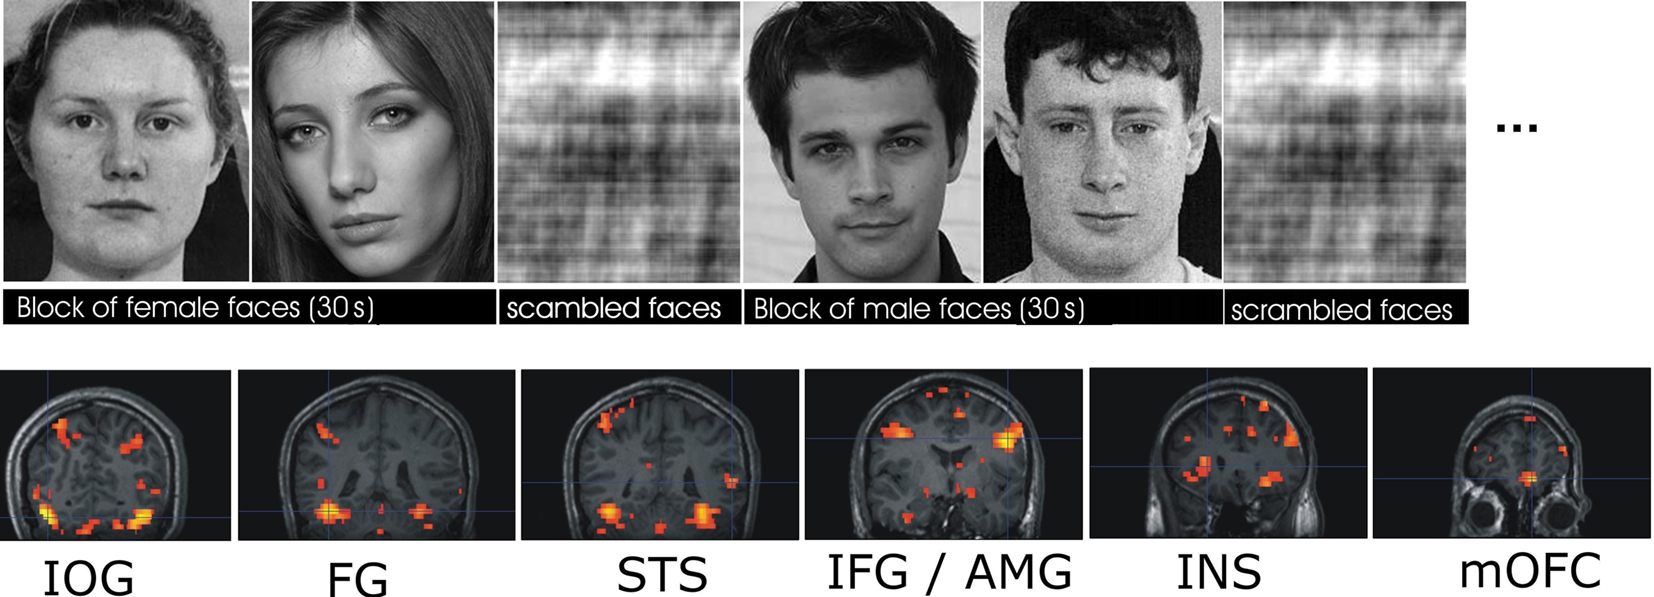
Figure 1. Top: Examples of face stimuli. Each face was presented for 3 s in alternating 30-s blocks of either male or female faces, which alternated with scrambled faces. Participants viewed the faces (three runs) or rated their attractiveness (five runs). For additional details see (Kranz and Ishai, 2006). Bottom: Face responsive ROIs from a representative subject. Sections show coronal slices, from posterior to anterior with bilateral activation in the IOG, FG, STS, IFG, AMG, and INS, and activation in medial OFC.
Data Acquisition
Participants laid supine in a 3T Philips Intera whole-body MR scanner (Philips Medical Systems, Best, The Netherlands) equipped with a transmit-receive body coil and a commercial eight-element head receiver array (MRI Devices Corporation, Waukesha, WI, USA). Changes in the blood oxygenation level dependent (BOLD) MRI signal were measured with the sensitivity-encoded gradient-echo echoplanar sequence (35 axial slices, TR = 3000 ms, TE = 35 ms, flip angle = 82°, field of view = 220 mm, acquisition matrix = 80 × 80, reconstructed voxel size = 1.72 mm × 1.72 mm × 4 mm, SENSE (Pruessmann et al., 1999) acceleration factor R = 2). High-resolution, spoiled gradient-recalled echo structural images were collected in the same session (180 axial slices, TR = 20 ms, TE = 2.3 ms, field of view = 220 mm, acquisition matrix = 224 × 224, reconstructed voxel size = 0.9 mm × 0.9 mm × 0.75 mm). These high-resolution anatomical images provided detailed anatomical information for the region of interest (ROI) analysis.
Data Analysis
Data preprocessing
The data were preprocessed using Statistical Parametric Mapping software (SPM8)2. The first five volumes of each fMRI scan were discarded to allow for magnetic saturation effects. The remaining functional images volumes were realigned to the first image, then the structural scan of each participant was co-registered to their functional data. Functional data were not spatially smoothed.
Time-Course Analysis, Univariate Analysis, and ROI Localization
To compute the percent signal change in the time-course analysis, we used the mean raw activation of the realigned time-course correcting only for slow signal drift typical in fMRI scanning by high-pass filtering (cut-off – 128 s). Each session was scaled by its mean activity. This linear transformation was repeated for each ROI and each participant separately. The resulting time series was then sorted in each ROI for activity during male and female face blocks and scrambled face blocks (Figure 2).
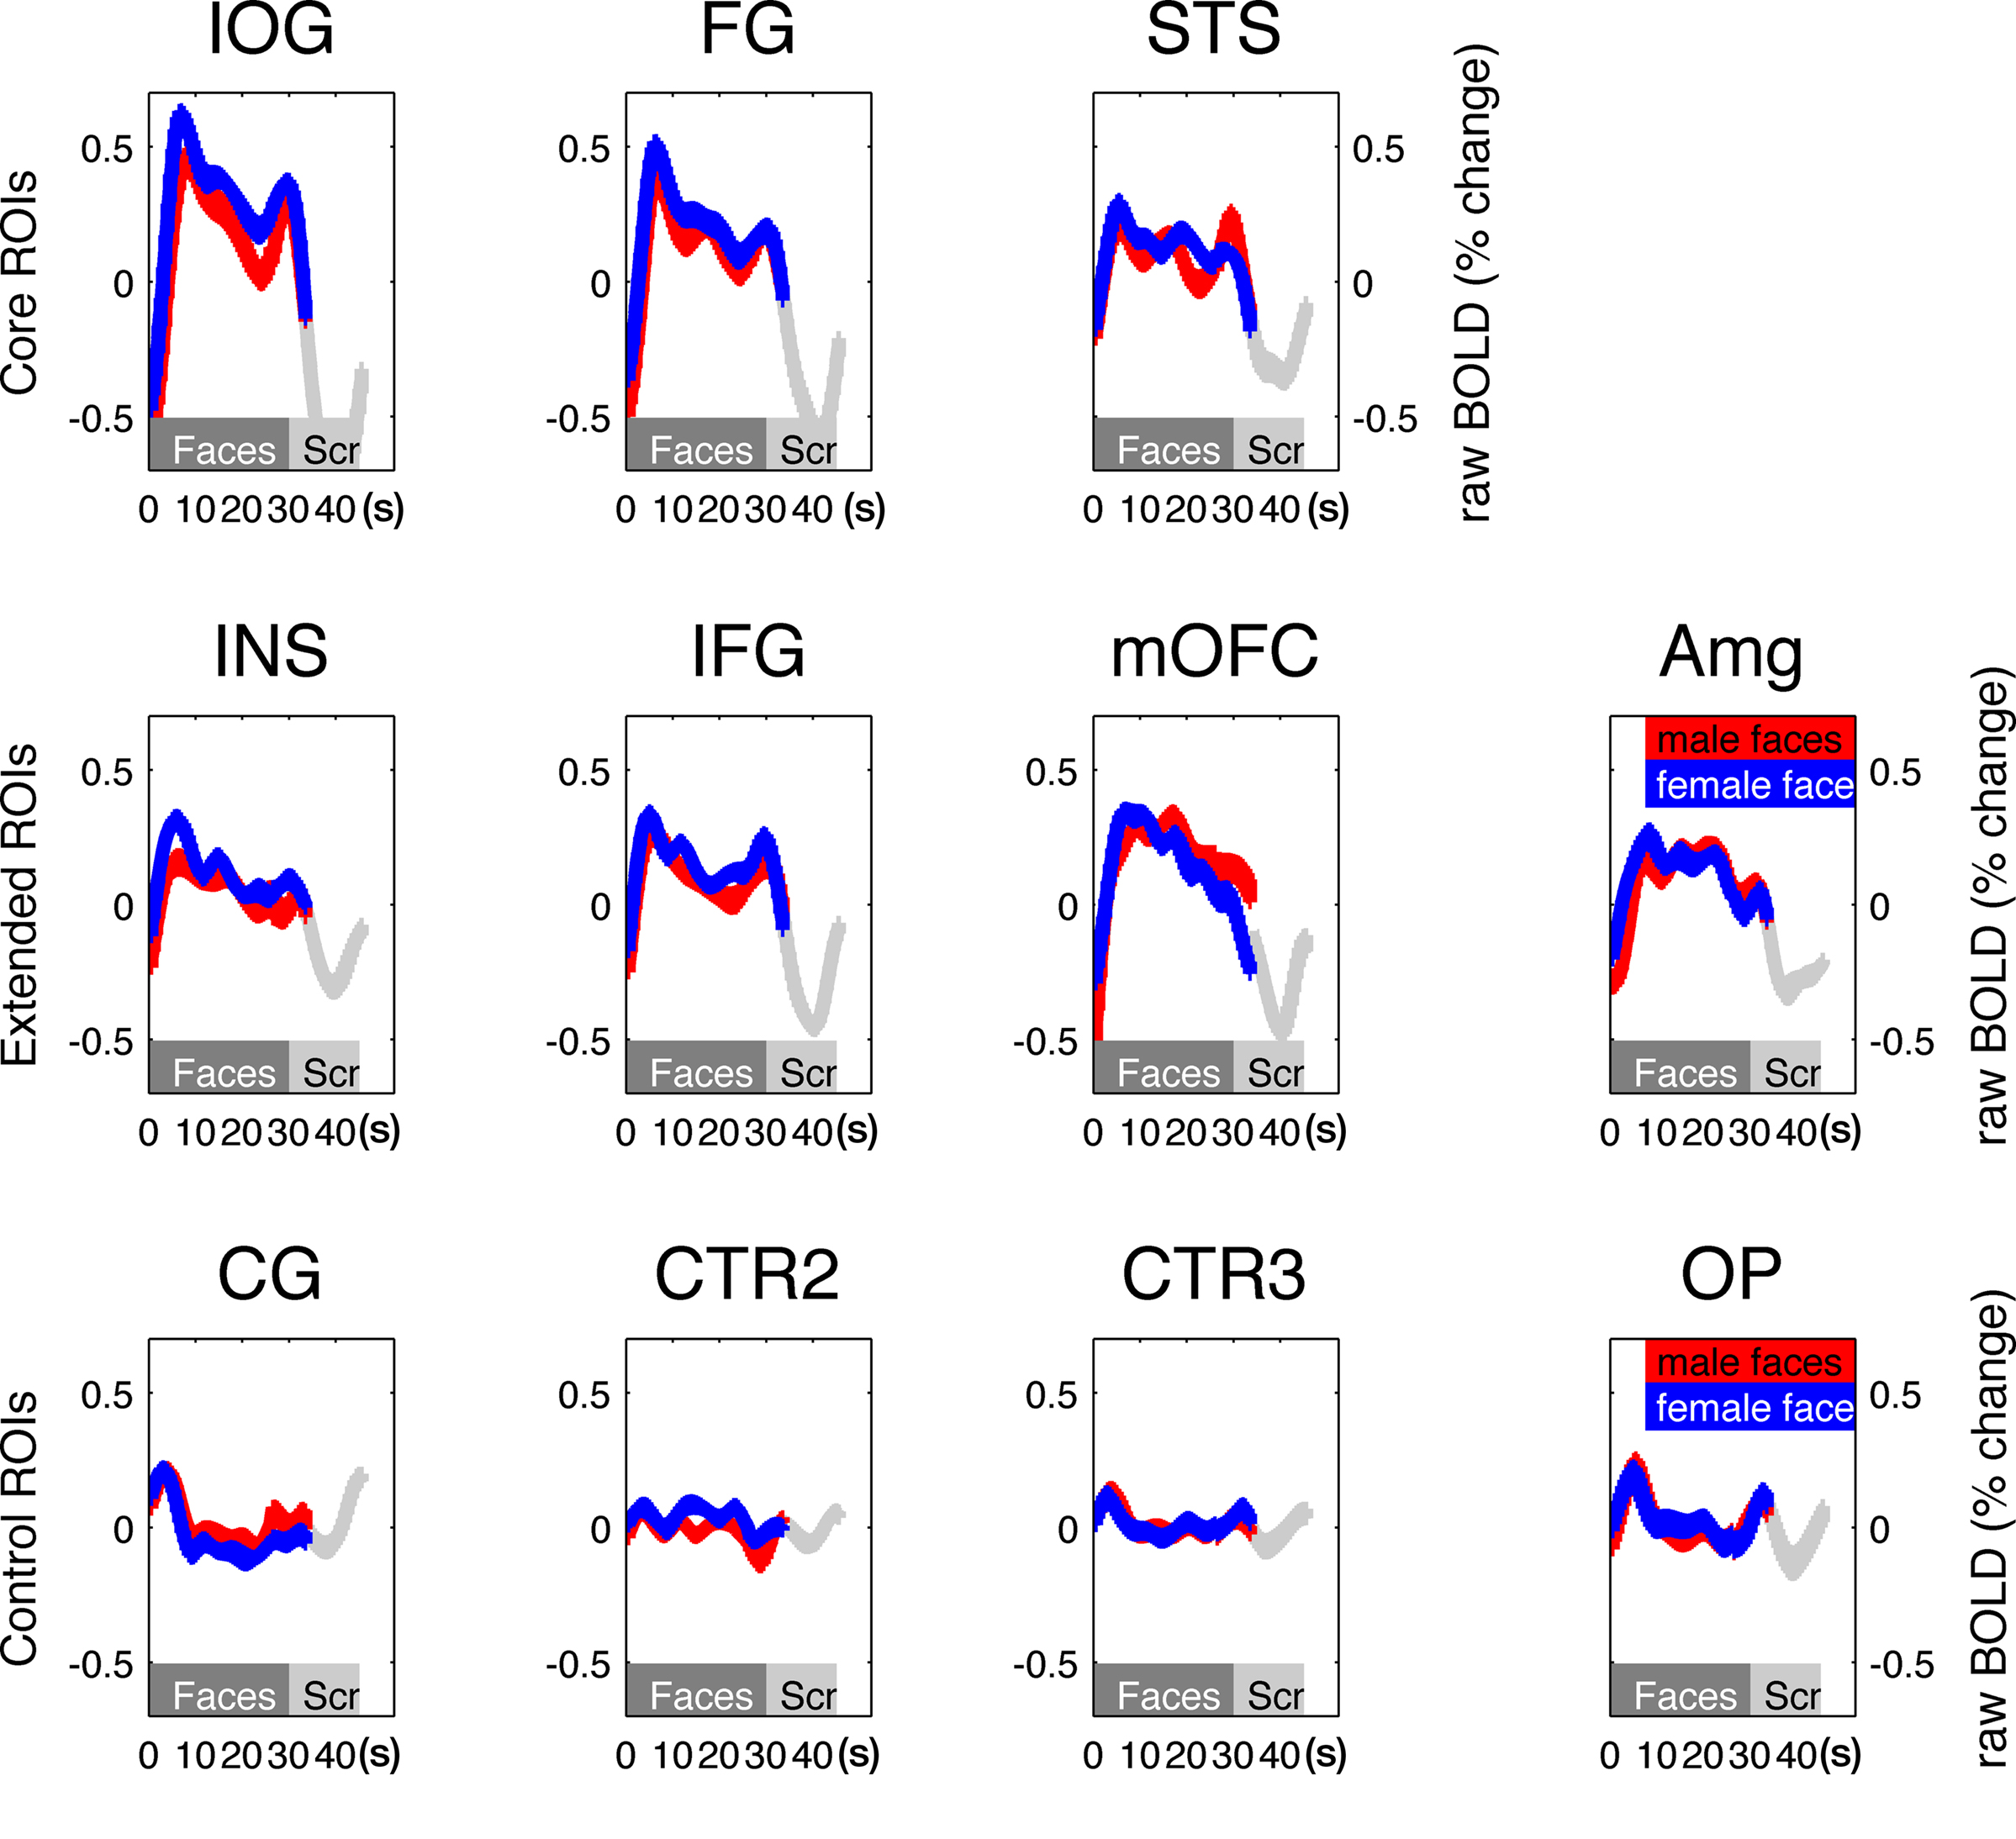
Figure 2. Time courses of the mean BOLD signal changes from all ROIs in the core (top row) and extended (middle row) face-responsive and control ROIs (bottom row). The y axis illustrates the percent signal change relative to the session mean, averaged over all 40 participants. The x axis depicts time in seconds. The gray bar indicates the duration of a 30-s stimulus block, shifted by 6 s to account for the hemodynamic delay. In comparison, control ROIs showed no increased activation in relation to the stimulus blocks. In all ROIs, the difference in response to male and female faces was insignificant (red vs. blue lines).
We used SPM82 to perform a within-participant analysis, with a voxel-wise general linear model (GLM) that comprised three delayed boxcar waveforms representing the three experimental conditions: male faces, female faces, and scrambled faces. The fMRI time series were high-pass filtered (cut-off – 128 s) and global changes in activity were removed by proportional scaling of each session. We then computed the contrast of all faces vs. all scrambled faces. Note that for each participant this contrast contains a balanced number of blocks with the same number of male and female faces and is thus orthogonal to the experimental question of this study.
To identify the different areas of the core and extended systems of the face network, we overlaid the contrast of all faces vs. all scrambled faces at a FWE-corrected level of significance of P < 0.05 onto each individual participants structural image (Figure 1). On the basis of this contrast, all seven regions of the core and extended network, namely the FG, IOG, posterior STS, AMG, INS, IFG, and medial OFC (mOFC) were identified. ROIs were only defined for those regions that displayed activity over the threshold at FWE-correction threshold of P < 0.05. The peak of the activation defined the center of the sphere-shaped ROI, and a sphere with 12-mm diameter was used for all ROIs. Given the similar patterns of activation in both hemispheres, all bilateral ROIs were collapsed across hemispheres resulting in one corresponding ROI per face-responsive region.
In addition to the face-responsive ROIs, size-matched, non-face-responsive control regions were anatomically defined. The first control region comprised gray matter of the medial mid-cingulate closely matching the definition of the cingulate gyrus (CG) from Ng et al. (2006). The second control region (CTR2) represented non-cortical white matter of the corpus callosum. The third control region (CTR3) was defined bilaterally on the dorsal surface of the parietal cortex, superior to the parieto-occipital fissure. Finally, we selected a fourth control region (occipital pole, OP) in early visual cortex that comprised a region slightly anterior of both OPs, medially, which covered the occipital medial sections of the calcarine sulcus of both hemispheres. We hypothesized that CG would only show significant classification of facial gender under the alternate hypothesis that the cingulate gyrus contains gender-specific information. CTR2 and CTR3 represented negative (white and gray matter) control regions that were not expected to show any classification accuracy for facial gender, therefore controlling for any non-specific artifacts (i.e., general increase of blood-flow). Finally, we included early visual cortex (OP) to investigate the possibility that successful discrimination of facial gender in higher visual areas might be due to different low-level image characteristics represented in early visual cortex.
Multivariate pattern classification
Unsmoothed, realigned fMRI data from the eight experimental runs were adjusted for the lag in hemodynamic response function by shifting all block-onset timings by three volumes. Then, data were transformed into “example vectors” for the classifier (Pereira et al., 2009). The 10 volumes of each block resulted in 10 example vectors, containing each voxel in the ROI. The resulting example vectors were concatenated to form a matrix whose rows and columns corresponded to category examples (male or female) and voxels in the ROI, respectively. Data from each voxel (i.e., each column of the matrix) were then z-normalized to have zero mean and unit variance. The resulting matrix, together with a label for each row indicating the stimulus condition was taken to the next stage.
To determine classification accuracy, only classification with unseen and independent test data was considered. Thus, test data sets in different iterations were always independent of the training data sets used. We used a leave-one-out cross-validation method to evaluate the classification accuracy (Mur et al., 2009; Pereira et al., 2009). Because the data were obtained in eight separate independent runs consisting of 20 volumes of each category, each test and training set consisted of 40 and 280 examples, respectively.
Pattern classification was performed using a SLR algorithm (Yamashita et al., 2008). SLR is a Bayesian extension of logistic regression that combines an innovative strategy for adaptive, yet unbiased voxel selection with the conventional linear discriminant analysis. Within every iteration of the cross-validation SLR carried out a number of nested cross-validations inside the training set: the training set was divided randomly in two sections of specified proportion; for a randomly selected subset of the voxels, the linear classifier was trained with one section of the data and tested with the other and the selected voxels were weighted proportional to the accuracy of this classification. This procedure was carried out 500 times and the voxels accumulated weights. At the end of the nested cross-validation, the assigned weight of each voxel was taken as a relevance factor indicating how informative the voxel was for classification. Voxels with the highest relevance were then selected for the actual classification. Table A3 in Appendix illustrates the number of voxels chosen for each ROI. Importantly, this voxel selection algorithm depended entirely on the training set and was completely ignorant about and independent of the test set. The training and test data from the selected voxels were then passed on to a conventional linear classifier (Yamashita et al., 2008).
Classification accuracies were averaged across the eight cross-validations for each ROI in each observer data assignments. Thus, for each observer this procedure yielded exactly one prediction accuracy per ROI, i.e., 40 observations per ROI. We tested for a significant difference from chance (two categories = 50% chance) with a Student’s one-sample t-test, applying Bonferroni correction for multiple comparisons across all ROIs examined (11 ROIs, Figures 3A,B, black and dark gray bars). Where Bonferroni-corrected P-values were greater than P = 0.05, they are simply reported as not significant (n.s.) except when trending toward significance. Second, we tested for a statistical significant difference against a second null hypothesis of chance performance as defined by the mean of the distribution of classification accuracy within control regions CTR2 and CTR3 with a paired-sample t-test, again Bonferroni correcting the result for multiple comparisons (seven ROIs, Figure 3B, medium gray bars). We also examined lateralization effects in FG and IOG, left and right hemisphere separately, again with a Student’s one-sample t-test against chance (Bonferroni corrected for four ROIs) and between left and right hemispheres with two paired t-tests (left vs. right × FG and IOG, Bonferroni corrected for four ROIs). Finally, we tested for statistically significant different classification results comparing face-network ROIs with a one-way analysis of variance (ANOVA).
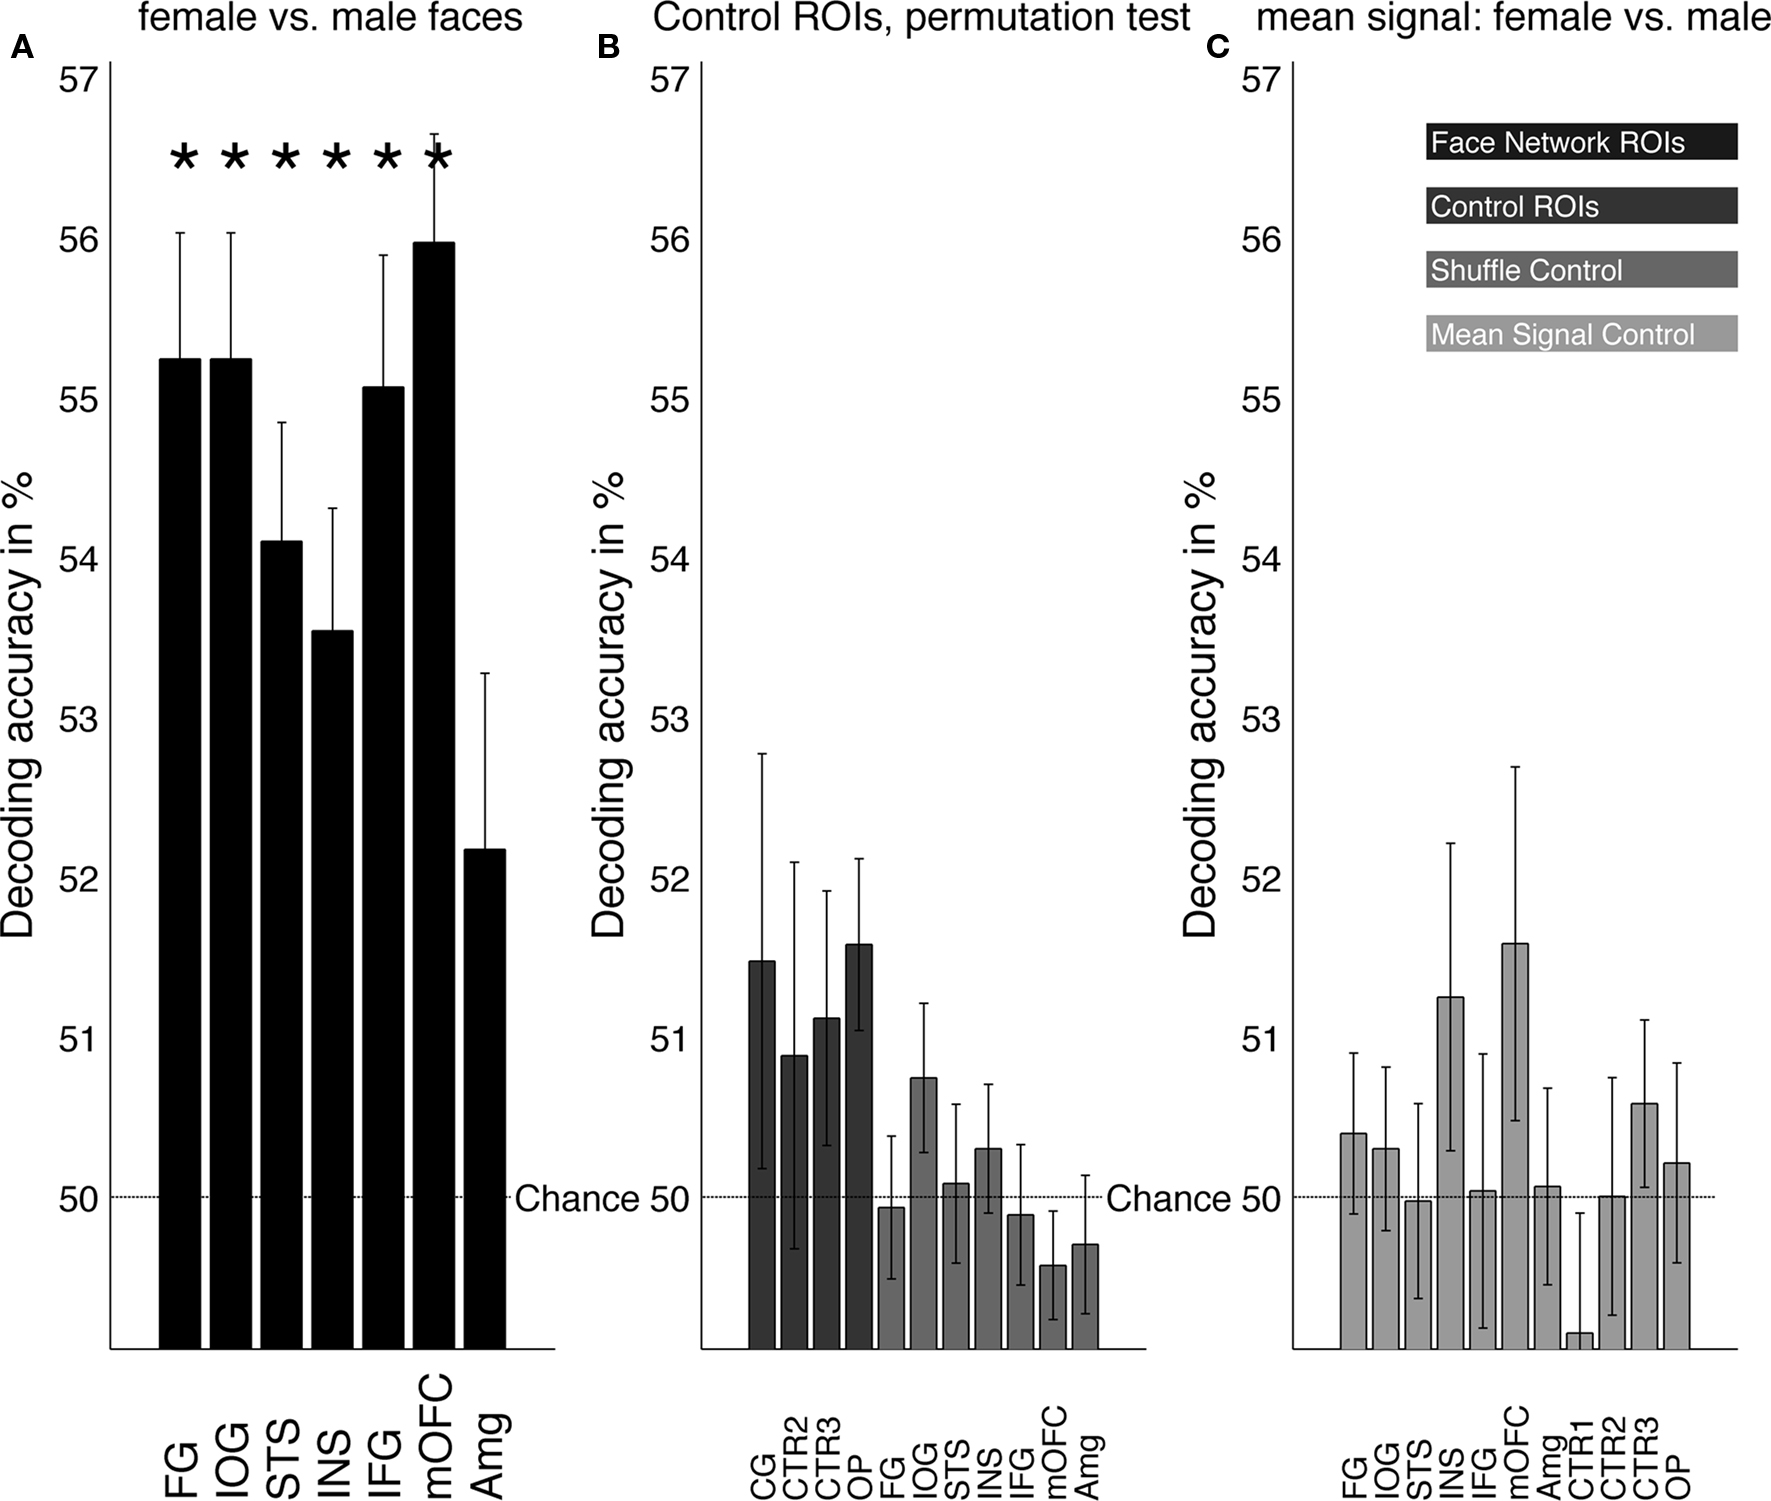
Figure 3. (A) Mean decoding performance for male vs. female faces in all ROIs. Regions of the core (FG, IOG, STS) and extended (INS, IFG, OFC) face network showed a significant (*P < 0.01) difference from chance performance in predicting the gender of the presented faces. In the amygdala, however, no significant gender classification performance was observed. (B) Control regions consisted of size-matched gray matter region in the cingulate gyrus, (CG), white matter (CTR2), gray matter in the parietal cortex (CTR3), and region around the occipital pole (OP). None of the control ROIs showed any above chance prediction (dark gray). Additionally, we performed a shuffle-control test (Mur et al., 2009) with randomly permuting labels for each set of test vectors in each cross-validation. Results of the permutation test were not significantly different from chance (medium gray). (C) Decoding analysis in all ROIs using the mean signal (one value per volume/ROI) instead of the pattern information within each ROI (light gray). Results were not significantly different from chance, suggesting that overall signal differences between blocks of male and female faces in individual participants cannot account for the decoding results.
In addition to the classification results in control ROIs, multiple control analyses were performed. First, for each ROI, we calculated the mean of each volume as an estimate of the average BOLD signal within a given ROI without its pattern information. We then repeated our multivariate analysis with these values, reasoning that classification should be successful if univariate activity differences between blocks of male and female faces contributed to the overall decoding result. As before, Bonferroni correction was applied for multiple comparisons across all ROIs examined (11 ROIs, Figure 3C, light gray bars).
Finally, in order to evaluate the probability that the classification was driven by over-fitting of arbitrary patterns of spatial correlations in the data, we carried out a shuffle-control test (Mur et al., 2009). If the assumption that classification is driven by chance were true, similar results should be obtained if labels indicating the experimental condition for each example vector were shuffled randomly. To test this, we ran a separate analysis where labels of the test examples were re-shuffled for each round of the cross-validation procedure. The resulting distribution of classification accuracy characterized the expected distribution of accuracy under null hypothesis.
Results
Univariate Analyses
We identified regions of the core and extended systems of the face network by overlaying the contrast of all faces vs. all scrambled faces at FWE = 0.05 onto the structural MRI of each individual participant. Figure 1 shows the location of all face-responsive regions in one representative individual. Additionally, we anatomically defined four size-matched control ROIs for each participant: CG comprised the gray matter of the medial mid-cingulate; CTR2 represented non-cortical white matter of the corpus callosum; and CTR3 a gray matter region in the parietal cortex. Finally, the fourth control region (OP) comprised the occipital medial sections of the calcarine sulcus of both hemispheres. Figure 2 shows the mean time-course for all ROIs relative to the mean response per session and averaged across all participants. Time zero marks the onset of the 30-s long blocks containing either male or female faces shifted by 6 s to adjust the timing of the hemodynamic response. We found increased activity to face stimuli within all face-responsive regions. In contrast, BOLD activity relative to the session mean in the control regions (CG, CTR2–3) did not show responses that corresponded with either the onset or duration of visual presentation. OP showed little activity difference when blocks of faces and scrambled faces were compared, likely because the stimuli in these conditions had similar low-level properties such as luminance or brightness and the data shown in Figure 2 are relative to the session mean. Consistent with previous studies (Ng et al., 2006), BOLD signals during the presentation of male and female faces were very similar in all ROIs (Figure 2). To quantify this observation, we performed a control analysis with these univariate results (see below).
Multivariate Analyses
Figure 3A shows the mean decoding accuracies, averaged across all 40 participants, for all face-responsive ROIs. Gender could be identified significantly better than chance from BOLD signals in all three regions of the core network: the highest accuracy was obtained from the IOG and the FG followed by the STS [FG: 55.2%, t(39) = 6.6, P < 0.001; IOG: 55.2%, t(39) = 6.5, P < 0.001; STS: 54.1%, t(31) = 4.9, P < 0.001]. In addition, gender-decoding from BOLD signals was significantly better than chance in three regions of the extended system: Activity patterns from the IFG, the insula and OFC showed above chance decoding of gender [INS: 53.5%, t(29) = 4, P < 0.01; IFG: 55.1%, t(34) = 5.7, P < 0.001; mOFC: 56%, t(25) = 7.1, P < 0.001]. In contrast, BOLD signals from the amygdala did not show above-chance classification of gender information [52.2%, t(21) = 2.7, n.s.]. An ANOVA revealed no significant differences within the seven face-responsive regions that showed above-chance gender-decoding [F(6,218) = 1.88, P = 0.084].
Data were evaluated collapsing across hemispheres, but it is well recognized that the ventral visual pathway shows a degree of functional asymmetry in its responses to faces (Kanwisher et al., 1997). To evaluate any possible differences in hemispheric classification accuracy, we repeated the analysis in the FG and IOG separately for each hemisphere. Right and left IOG and the left FG successfully predicted facial gender at similar levels to that seen when analyzed together [IOG right: 54.5%, t(39) = 5.5, P < 0.001; IOG left: 54.1%, t(37) = 5.5, P < 0.001; FG right: 52.6%, t(38) = 3.8, P < 0.01; FG left: 53.8%, t(38) = 6.7, P < 0.001]. Importantly, there were no significant differences comparing classification accuracies of left and right IOG and FG across all participants [paired t-test left vs. right: FG: t(37) = −1.3, n.s.; IOG: t(37) = 0.25, n.s.].
Control Analyses
A number of control analyses were performed. First, we attempted to classify facial gender from activity patterns in control ROIs (Figure 3B). Encouraged by an earlier study reporting weak facial gender adaptation effects in the cingulate gyrus (area CG, Ng et al., 2006) we tested male vs. female prediction accuracy in CG. However, this region did not show prediction significantly better than chance [CG: 51.5%, t(34) = 2, n.s.]. In CTR2 and CTR3 classification performance also did not differ from chance [CTR2: 50.9%, t(34) = 1.2, n.s.; CTR3: 51.1%, t(39) = 1.4, n.s.].
We further evaluated whether facial gender could be predicted from patterns of activity in early visual cortex. Classification performance was not significantly different from chance but showed a weak trend toward significance [Figure 3B; OP: 51.6%, t(39) = 2.9, P = 0.061]. To further evaluate this trend, we increased the size of the OP-ROI to a 15-mm diameter sphere and repeated the analysis. Using this much bigger ROI, classification was slightly more accurate and, importantly, significantly different from chance [15-mm-OP: 52.6%, t(39) = 3.9, P < 0.05]. This result suggests that, given a very large number of voxels from early visual cortex and secondary visual areas, pictures of male vs. female faces were sufficiently different to produce some differences in the local spatial pattern of brain activity within these areas (as mentioned above, the hair was not removed, see Figure 1). Yet, this size-dependent result suggests that successful classification accuracy in face-selective regions was not driven merely by low-level properties of the faces.
We also examined statistical significance against a second null hypothesis of chance performance as defined by the mean of the distribution of classification accuracy in control areas CTR2 and CTR3. This analysis strengthened the main result with the IOG, FG, STS, INS, IFG, and mOFC all significantly different from this second null hypothesis. As before, the amygdala did not show a significantly different decoding result [FG: t(39) = 4.7, P < 0.01; IOG: t(39) = 4.6, P < 0.01; STS: t(31) = 3.6, P < 0.01.; INS: t(29) = 3.1, P < 0.05; IFG: t(34) = 4.6, P < 0.01; mOFC: t(25) = 5.2, P < 0.01; AMG: t(21) = 1, n.s.]. With the exception of the INS, the significance pattern of this analysis was identical when, instead of CTR2 and CTR3, we tested the mean of the distribution of classification accuracy in all control ROIs (including OP) as a secondary null hypothesis.
To evaluate the probability that successful gender classification was driven by over-fitting of arbitrary patterns of spatial correlations in the data that were independent of the gender of the faces, we carried out a shuffle-control test (Mur et al., 2009). We repeated the classification from all face-responsive ROIs, but this time with shuffled labels for the test examples. Figure 3B depicts the results of this shuffle-control analysis. Training the classifier using the same training sets but with shuffled labels for example vectors confirmed the distribution of classification accuracy expected under null hypothesis [FG: 49.9%, t(39) = −0.15, n.s., IOG: 50.7%, t(39) = 1.6, n.s., STS: 49.6%, t(31) = −1.1, n.s., INS: 50.3%, t(29) = 0.65, n.s., IFG: 49.9%, t(34) = −0.24, n.s., mOFC: 49.7%, t(25) = −0.55, n.s., AMG: 50.1%, t(21) = 0.12, n.s.]. This control analysis strengthened the main findings, as it reconfirmed the validity of the result and the independence of the data used to obtain them.
Mean BOLD signals during the presentation of male and female faces were qualitatively very similar in all ROIs (see Figure 2). To quantify and compare individual differences in overall BOLD signal for blocks of male vs. female faces, we computed the mean BOLD within a given ROI (spatial mean of pattern information) for each volume, then repeated multivariate analysis with these one-voxel-ROIs. Figure 3C displays the result of this control analysis: No ROI showed significant, above-chance prediction based on the mean signal alone, suggesting that classification accuracy of the spatial pattern in any ROI is not due to univariate activity differences between blocks of male and female faces. [FG: 50.4%, t(39) = 0.79, n.s.; IOG: 50.3%, t(39) = 0.59, n.s.; STS: 50%, t(31) = −0.037, n.s.; INS: 51.2%, t(29) = 1.9, n.s.; IFG: 50%, t(34) = 0.064, n.s.; mOFC: 51.6%, t(25) = 2.1, n.s.; AMG: 50.1%, t(21) = 0.081, n.s.; CG: 49.1%, t(34) = −1.4, n.s.; CTR2: 50%, t(34) = 0.0053, n.s.; CTR3: 50.6%, t(34) = 1, n.s.; OP: 50.2%, t(39) = 0.34, n.s.].
Gender and Sexual Orientation
We then tested whether decoding the gender of face stimuli depended on the gender or sexual preference of the participants. Figure 4 displays the decoding results for each group (namely, heterosexual men, homosexual men, heterosexual women, and homosexual women). To test for differences between the groups, an ANOVA was performed for each ROI. However, even when uncorrected for multiple comparisons, all four groups of participants showed similar patterns of classification in all ROIs and results were not significantly different from chance in any ROI [group means in brackets (Heterosexual Men, Heterosexual Women, Homosexual Men, and Homosexual Women), IOG: n.s. (58.2, 53.9, 54.9, 53.6); FG: n.s. (58.2, 54, 55, 53.8); STS: n.s. (51.7, 53.8, 55.9, 54); INS: n.s. (53.1, 55.6, 51.3, 53.8); IFG: n.s. (56.8, 57.3, 54.4, 52.2); mOFC: n.s. (55.7, 57.9, 55.5, 55.2); AMG: n.s. (53.1, 52.5, 52.9, 51.6)]. For detailed statistical test values see Table A1 in Appendix.
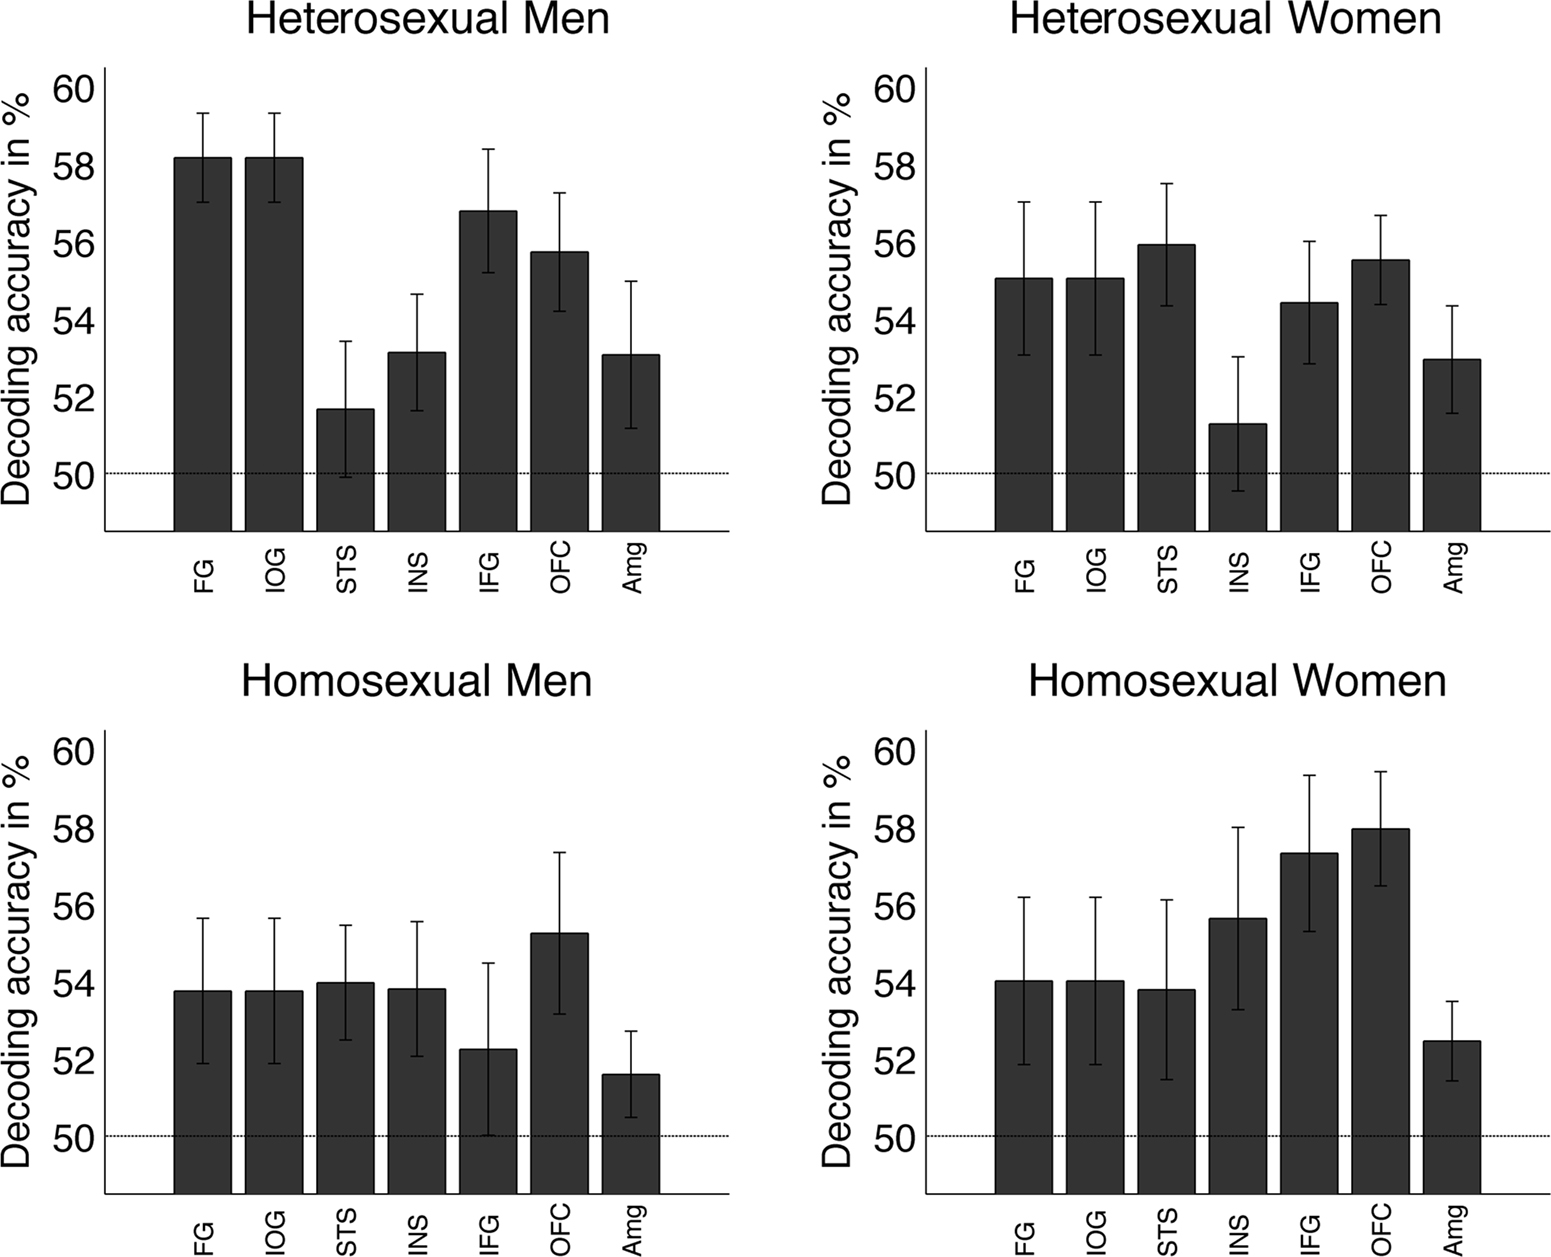
Figure 4. Mean decoding performance as a function of the subject’s sexual preference. The decoding profiles in each group were similar to the mean averaged across the 40 participants shown in Figure 3A. Testing for differences between the groups, an ANOVA conducted separately for each ROI, revealed no significant differences in any of these ROIs.
We also investigated whether the distribution of gender information in the face network varied according to the gender of participants (male vs. female participants), by gender-specific sexual preference (interested in men vs. interested in women), or by sexual orientation (hetero- vs. homosexual participants). We compared each pair of group-results within each ROI with a two-sample t-test (Bonferroni-corrected). As shown in Figure A2 in Appendix, we did not find significant differences for any group constellations in any ROI. For detailed statistical test values see Table A2 in Appendix.
Discussion
The goal of our study was to identify gender-specific patterns of activation in the human brain. Using data that were previously collected (Kranz and Ishai, 2006) while participants viewed or rated the attractiveness of male and female faces, we mapped face-responsive brain regions of the core (FG, IOG, and STS) and extended (AMG, INS, IFG, and OFC) systems of the face network (Ishai et al., 2005; Fairhall and Ishai, 2007). We demonstrated that the mean BOLD signals averaged from these ROIs in response to viewing either male or female faces were indistinguishable (Figures 2 and 3C), replicating previous work (Ino et al., 2010). Nevertheless, using multivariate pattern analysis, we showed that the local spatial pattern of BOLD signals from the FG, IOG, STS, INS, IFG, and medial OFC contained sufficient information to decode the gender of face stimuli significantly above chance (Figure 3A). Using size-matched ROIs, we could not detect significant gender classification performance in the amygdala, neither in control ROIs in early visual cortex, white matter, parietal cortex and cingulate gyrus. We further confirmed the specificity of our classification analyses using a shuffle-control test (Mur et al., 2009). Finally, we did not find any variability in the ability to classify facial gender based on the demographics of the participants, namely, their gender and sexual orientation (Figure 4 and Appendix). Our findings indicate that (i) we could not detect gender-specific increases in mean levels of brain activity in any single area of the face network, and (ii) rather than localized to a single region, information about the gender of a face is represented in multiple face-responsive regions.
Perception of faces elicits activation within a distributed cortical network that includes core and extended regions (Haxby et al., 2000; Ishai et al., 2005). One study reported fMRI adaptation effects for facial gender and race outside the face network, namely in the cingulate gyrus (Ng et al., 2006). We therefore probed an anatomically defined cingulate gyrus ROI, but did not find any significant gender-specific activation with conventional univariate analysis, or any decoding results that were significantly different from chance with multivariate pattern analysis. As Ng et al. (2006) indicated, spatial correlation of gender-specific adaptation effects and evoked activity during the face localizer were low in their study.
We evaluated whether facial gender could be predicted from patterns of activity in early visual cortex. While we recognize the advantages of defining early visual areas with retinotopic mapping, due to the lack of retinotopy functional scans in the current study, which was originally designed to test whether face perception was modulated by sexual preference (Kranz and Ishai, 2006), we defined the visual cortex anatomically based on the location of the calcarine sulcus/OP. In a size-matched ROI, classification performance did not significantly differ from chance, but trended toward significance (Figure 3). After increasing the size of the OP-ROI, decoding accuracy of facial gender classification from areas around the OP slightly increased and reached statistical significance. Given the large visual variance of face stimuli used in the study, these results suggest the BOLD signal in early visual cortex is likely influenced by low-level stimulus properties and/or top-down feedback loops. Biologically, it seems likely that some gender-specific features (e.g., hair-length, forehead size) are processed in earlier visual areas, posterior to the IOG and FG, and, thus, might be present in the pattern information sampled from around the calcarine sulcus. Our results suggest that although information about the gender of a face is distributed in multiple regions of the face network, gender discrimination may partially depend on low-level visual features.
The lateral FG plays a dominant role within the face network, as indicated by consistent and replicable patterns of activation within this region, irrespective of face formats, tasks, and experimental conditions (Kanwisher et al., 1997; Ishai et al., 2000; Grill-Spector et al., 2004; Kranz and Ishai, 2006). Analysis of effective connectivity has recently revealed that the FG is a major node in the face network (Fairhall and Ishai, 2007). As the FG provides the major causal input into the extended system, which processes emotional and social aspects of face stimuli, and given its pivotal role in face recognition, one might assume that gender-specific information is represented in the FG. Our results, however, suggest that information about facial gender is not represented in one region, but is distributed across multiple face-responsive regions.
Discriminating the gender of face stimuli is an automatic and effortless task. Our results suggest that information about facial gender is represented in almost all regions of the face network. Given the evolutionary importance of gender information and its fundamental nature in face processing, it is plausible that there is no “gender-detection region” in the human brain, but rather, gender information is a distributed attribute. Future studies will determine whether our results are carried by redundant calculations in each ROI or by information being fed forward and/or backward between regions. Support for a distributed representation of gender comes from prosopagnosic patients who, despite their profound inability to recognize faces, exhibit normal patterns of activation in the FG (Hasson et al., 2003; Rossion et al., 2003), suggesting that activation in the FG alone is insufficient for face recognition. Furthermore, it seems that despite their FG lesions, prosopagnosic patients can often classify a face as a face and determine its gender (e.g., Rossion et al., 2003). Taken collectively, it seems that multiple aspects of face perception, including gender discrimination, depend on integration of information across cortical regions.
Previous studies suggested that, across multiple sensory modalities, the amygdala is reactive to very simple cues of threat or danger (Wright et al., 2002; Vuilleumier et al., 2003; Whalen et al., 2004). It is perhaps not surprising that we did not observe above-chance gender-decoding in the amygdala. As gender discrimination may not be essential for the detection of threat or danger, it is reasonable to conclude that gender-specific information is represented in the amygdala to a lesser degree than in other regions of the face network. It is important to note that given the resolution of the fMRI technique, the potential presence of gender-specific information at the level of single neurons cannot be ruled out.
Event-related potential (ERP) studies suggest that gender-specific processing might occur as early as 45–85 ms after the presentation of faces as part of coarse visual categorization and boosted around 200 ms by attention-based gender categorization (Mouchetant-Rostaing et al., 2000). As source localization was not reported in this study, it is not possible to determine whether the cortical generators of the ERP effects correspond to any of the cortical loci we identified as encoding facial gender. Although the temporal limitation of fMRI data acquisition prevents us from effectively comparing the two studies, we cannot exclude the possibility that our gender-decoding findings within the face network were influenced by top-down feedback loops affecting the BOLD signal during the duration of a stimulus block.
In sum, in the present study, we maximized sensitivity to detect gender-specific differences within regions of the core and extended face network by defining spherical, size-matched ROIs based on the individual’s functional anatomy. Notably, this approach is different from multivariate analyses using a “searchlight” (Kriegeskorte et al., 2006) and from conventional whole-brain analyses that average brain activity across many participants. Despite the relatively low temporal and spatial resolution of our fMRI data, the large number of subjects (n = 40) and our individual ROI-approach were advantageous. Future studies will determine whether higher spatial resolution data acquisition sequences would enable greater classification accuracies in individual participants. For example, a recent study used multivoxel pattern analysis to compare the intensity of emotions perceived from face movements, body movements, or vocal intonations. Interestingly, supramodal representations of emotions were found in the STS and medial prefrontal cortex, suggesting that emotions are perceived at an abstract, modality-independent level (Peelen et al., 2010). Consistent with our findings, this study indicates that multivariate analysis is a complementary tool that can be used to understand how information is represented in multiple regions in the human brain.
Conflict of Interest Statement
The authors declare that the research was conducted in the absence of any commercial or financial relationships that could be construed as a potential conflict of interest.
Acknowledgments
Alumit Ishai is supported by the Swiss National Science Foundation grant 3200B0-105278 and by the Swiss National Center for Competence in Research: Neural Plasticity and Repair. Geraint Rees is supported by the Wellcome Trust. Christian Kaul is supported by the Brain Research Trust and by a Feodor-Lynen-Award from the Alexander von Humboldt Foundation.
Footnotes
References
Aharon, I., Etcoff, N., Ariely, D., Chabris, C. F., O’Connor, E., and Breiter, H. C. (2001). Beautiful faces have variable reward value: fMRI and behavioral evidence. Neuron 32, 537–551.
Fairhall, S. L., and Ishai, A. (2007). Effective connectivity within the distributed cortical network for face perception. Cereb. Cortex 17, 2400–2406.
Gauthier, I., Tarr, M. J., Anderson, A. W., Skudlarski, P., and Gore, J. C. (1999). Activation of the middle fusiform ‘face area’ increases with expertise in recognizing novel objects. Nat. Neurosci. 2, 568–573.
Grill-Spector, K., Knouf, N., and Kanwisher, N. (2004). The fusiform face area subserves face perception, not generic within-category identification. Nat. Neurosci. 7, 555–562.
Hasson, U., Avidan, G., Deouell, L. Y., Bentin, S., and Malach, R. (2003). Face-selective activation in a congenital prosopagnosic subject. J. Cogn. Neurosci. 15, 419–431.
Haxby, J. V., Hoffman, E. A., and Gobbini, M. I. (2000). The distributed human neural system for face perception. Trends Cogn. Sci. 4, 223–233.
Haynes, J. D., and Rees, G. (2005). Predicting the orientation of invisible stimuli from activity in human primary visual cortex. Nat. Neurosci. 8, 686–691.
Hoffman, E. A., and Haxby, J. V. (2000). Distinct representations of eye gaze and identity in the distributed human neural system for face perception. Nat. Neurosci. 3, 80–84.
Ino, T., Nakai, R., Azuma, T., Kimura, T., and Fukuyama, H. (2010). Gender differences in brain activation during encoding and recognition of male and female faces. Brain Imaging Behav. 4, 55–67.
Ishai, A., Haxby, J. V., and Ungerleider, L. G. (2002). Visual imagery of famous faces: effects of memory and attention revealed by fMRI. Neuroimage 17, 1729–1741.
Ishai, A., Pessoa, L., Bikle, P.C., and Ungerleider, L. G. (2004). Repetition suppression of faces is modulated by emotion. Proc. Natl. Acad. Sci. U.S.A. 101, 9827–9832.
Ishai, A., Schmidt, C. F., and Boesiger, P. (2005). Face perception is mediated by a distributed cortical network. Brain Res. Bull. 67, 87–93.
Ishai, A., Ungerleider, L. G., and Haxby, J. V. (2000). Distributed neural systems for the generation of visual images. Neuron 28, 979–90.
Ishai, A., Ungerleider, L. G., Martin, A., Schouten, J. L., and Haxby, J. V. (1999). Distributed representation of objects in the human ventral visual pathway. Proc. Natl. Acad. Sci. U.S.A. 96, 9379–9384.
Kamitani, Y., and Tong, F. (2005). Decoding the visual and subjective contents of the human brain. Nat. Neurosci. 8, 679–685.
Kanwisher, N., McDermott, J., and Chun, M. M. (1997). The fusiform face area: a module in human extrastriate cortex specialized for face perception. J. Neurosci. 17, 4302–4311.
Kranz, F., and Ishai, A. (2006). Face perception is modulated by sexual preference. Curr. Biol. 16, 63–68.
Kriegeskorte, N., Goebel, R., and Bandettini, P. (2006). Information-based functional brain mapping. Proc. Natl. Acad. Sci. U.S.A. 103, 3863–3868.
Leveroni, C. L., Seidenberg, M., Mayer, A. R., Mead, L. A., Binder, J. R., and Rao, S. M. (2000). Neural systems underlying the recognition of familiar and newly learned faces. J. Neurosci. 20, 878–886.
Mouchetant-Rostaing, Y., Giard, M. H., Bentin, S., Aguera, P. E., and Pernier, J. (2000). Neurophysiological correlates of face gender processing in humans. Eur. J. Neurosci. 12, 303–310.
Mur, M., Bandettini, P. A., and Kriegeskorte, N. (2009). Revealing representational content with pattern-information fMRI – an introductory guide. Soc. Cogn. Affect. Neurosci. 4, 101–109.
Ng, M., Ciaramitaro, V. M., Anstis, S., Boynton, G. M., and Fine, I. (2006). Selectivity for the configural cues that identify the gender, ethnicity, and identity of faces in human cortex. Proc. Natl. Acad. Sci. U.S.A. 103, 19552–19557.
O’Doherty, J., Winston, J., Critchley, H., Perrett, D., Burt, D. M., and Dolan, R. J. (2003). Beauty in a smile: the role of medial orbitofrontal cortex in facial attractiveness. Neuropsychologia 41, 147–155.
Peelen, M. V., Atkinson, A. P., and Vuilleumier, P. (2010). Supramodal representations of perceived emotions in the human brain. J. Neurosci. 30, 10127–10134.
Pereira, F., Mitchell, T., and Botvinick, M. (2009). Machine learning classifiers and fMRI: a tutorial overview. Neuroimage 45(Suppl.), S199–S209.
Phillips, M. L., Young, A. W., Senior, C., Brammer, M., Andrew, C., Calder, A. J., Bullmore, E. T., Perrett, D. I., Rowland, D., Williams, S. C., Gray, J. A., and David, A. S. (1997). A specific neural substrate for perceiving facial expressions of disgust. Nature 389, 495–498.
Pruessmann, K. P., Weiger, M., Scheidegger, M. B., and Boesiger, P. (1999). SENSE: sensitivity encoding for fast MRI. Magn. Reson. Med. 42, 952–962.
Puce, A., Allison, T., Bentin, S., Gore, J. C., and McCarthy, G. (1998). Temporal cortex activation in humans viewing eye and mouth movements. J. Neurosci. 18, 2188–2199.
Rossion, B., Caldara, R., Seghier, M., Schuller, A. M., Lazeyras, F., and Mayer, E. (2003). A network of occipito-temporal face-sensitive areas besides the right middle fusiform gyrus is necessary for normal face processing. Brain 126(Pt 11), 2381–2995.
Sell, R. L. (1996). The Sell assessment for sexual orientation: background and scoring. J. Gay Lesb. Polit. 1, 952–962.
Sergent, J., Ohta, S., and MacDonald, B. (1992). Functional neuroanatomy of face and object processing. A positron emission tomography study. Brain 115(Pt 1), 15–36.
Vuilleumier, P., Armony, J. L., Driver, J., and Dolan, R. J. (2003). Distinct spatial frequency sensitivities for processing faces and emotional expressions. Nat. Neurosci. 6, 624–631.
Vuilleumier, P., Sagiv, N., Hazeltine, E., Poldrack, R. A., Swick, D., Rafal, R. D., and Gabrieli, J. D. (2001). Neural fate of seen and unseen faces in visuospatial neglect: a combined event-related functional MRI and event-related potential study. Proc. Natl. Acad. Sci. U.S.A. 98, 3495–3500.
Whalen, P. J., Kagan, J., Cook, R. G., Davis, F. C., Kim, H., Polis, S., McLaren, D. G., Somerville, L. H., McLean, A. A., Maxwell, J. S., and Johnstone, T. (2004). Human amygdala responsivity to masked fearful eye whites. Science 306, 2061.
Wright, C. I., Martis, B., Shin, L. M., Fischer, H., and Rauch, S. L. (2002). Enhanced amygdala responses to emotional versus neutral schematic facial expressions. Neuroreport 13, 785–790.
Keywords: facial gender, fMRI, pattern decoding, amygdala, fusiform gyrus
Citation: Kaul C, Rees G and Ishai A (2011) The gender of face stimuli is represented in multiple regions in the human brain. Front. Hum. Neurosci. 4:238. doi: 10.3389/fnhum.2010.00238
Received: 30 August 2010;
Accepted: 22 December 2010;
Published online: 21 January 2011.
Edited by:
Hauke R. Heekeren, Max Planck Institute for Human Development, GermanyCopyright: © 2011 Kaul, Rees and Ishai. This is an open-access article subject to an exclusive license agreement between the authors and Frontiers Media SA, which permits unrestricted use, distribution, and reproduction in any medium, provided the original authors and source are credited.
*Correspondence: Alumit Ishai, Institute of Neuroradiology, University of Zurich, Raemistrasse 66, 8001 Zurich, Switzerland. e-mail:YWx1bWl0LklzaGFpQHV6aC5jaA==