 Hans-Peter Frey1*
 Kerstin Wirz1
 Verena Willenbockel1 Torsten Betz1 Cornell Schreiber1 Tomasz Troscianko2
 Peter König1
- 1 Department of Neurobiopsychology, Institute of Cognitive Science, University of Osnabrück, Osnabrück, Germany
- 2 Department of Experimental Psychology, University of Bristol, Bristol, UK
Recent research indicates a direct relationship between low-level color features and visual attention under natural conditions. However, the design of these studies allows only correlational observations and no inference about mechanisms. Here we go a step further to examine the nature of the influence of color features on overt attention in an environment in which trichromatic color vision is advantageous. We recorded eye-movements of color-normal and deuteranope human participants freely viewing original and modified rainforest images. Eliminating red–green color information dramatically alters fixation behavior in color-normal participants. Changes in feature correlations and variability over subjects and conditions provide evidence for a causal effect of red–green color-contrast. The effects of blue–yellow contrast are much smaller. However, globally rotating hue in color space in these images reveals a mechanism analyzing color-contrast invariant of a specific axis in color space. Surprisingly, in deuteranope participants we find significantly elevated red–green contrast at fixation points, comparable to color-normal participants. Temporal analysis indicates that this is due to compensatory mechanisms acting on a slower time scale. Taken together, our results suggest that under natural conditions red–green color information contributes to overt attention at a low-level (bottom-up). Nevertheless, the results of the image modifications and deuteranope participants indicate that evaluation of color information is done in a hue-invariant fashion.
Introduction
Visual attention is traditionally divided into overt and covert (e.g., von Helmholtz, 1867) processes. However, human psychophysical studies have shown that overt eye-movements and covert attention are closely correlated (Hoffman and Subramaniam, 1995; Maioli et al., 2001). Supporting this notion, neurophysiological studies in monkeys found cells in superior colliculus that are active both during saccade preparation and covert shifts of attention (Kustov and Robinson, 1996; Ignashchenkova et al., 2004), indicating that these may share a common neuronal source. Analyzing eye-movements therefore provides an objective measure of general attentional processes.
Overt visual attention can be influenced by task related aspects (expectations, experience, and the experimental task), spatial properties (central bias and geometrical constraints of saccades) as well as stimulus-dependent properties (feature contrasts; Kollmorgen et al., 2010). In visual search tasks, top-down control has been examined by making participants adopt certain strategies (task dependent), which proved to be resistant to stimulus-dependent (bottom-up) influences (Folk et al., 1992; Bacon and Egeth, 1994; Geyer et al., 2008). However, other researchers have shown that highly salient singleton features are able to override top-down control of attention (Yantis and Jonides, 1990; Theeuwes, 1994). Müller et al. (2009, 2010) therefore propose a theory between these two extremes, namely that stimulus-dependent selection is modifiable within certain limits. This idea is also supported by the finding that task instructions do not drastically change feature correlations at selected fixation points for a wide range of features from luminance- to color-contrasts (Betz et al., 2010). A dichotomy also exists in the relative timing of these two forms of attentional control: some researchers found low-level influences to operate at an earlier time-point than high-level influences (e.g., Müller and Rabbitt, 1989; Cheal and Lyon, 1991; Van Zoest et al., 2004), while other studies could not find such evidence (e.g., Tatler et al., 2005). Therefore the question of how low-level and high-level processes influence overt attention remains.
The ability to perceive colors, a specific type of low-level feature, is a decisive component of human vision (Mollon, 1982). It helps us to segment visual scenes, and to recognize and memorize objects. For over a century, researchers have examined the components and pathways of the color system. The human retina normally is trichromatic, i.e., it contains three different kinds of color photoreceptors (cones). These respond to different wavelengths of visible light: short (S, whose absorption spectrum has a maximum at 440 nm), middle (M, most sensitive to wavelengths around 535 nm), and long (L, 565 nm). Trichromats have a subsystem for comparing the outputs of M- and L-cones (Nathans, 1999), which are represented in color opponent mechanisms in the parvocellular layers of the lateral geniculate nucleus (LGN). Another subsystem compares the output of the S-cones with the combination of L- and M-cones (Derrington et al., 1984). This system of trichromacy evolved out of a dichromatic system of early mammals only 30–40 million years ago in the Old World primate lineage. Trichromacy is also observed in marsupials, which might be a relict of the rich color system in birds, fish, and reptiles (Arrese et al., 2002). There are several studies showing that the trichromatic visual system is optimally tuned to discriminate edible fruits (Sumner and Mollon, 2000; Regan et al., 2001) and young leaves (Sumner and Mollon, 2000; Lucas et al., 2003) from their natural background. These studies were conducted using spectral measurements either from the Kibale rainforest in Uganda or from French Guiana. In addition, the ecological validity of these stimuli makes them especially suited to study trichromatic color processing, so this study uses calibrated photographic images obtained in Kibale forest and described in Lovell et al. (2005).
In this paper, we investigate to what extent color processing interacts with visual attention. In the cortex, color processing takes place in cytochromoxidase-rich blobs of the primary visual cortex (V1), area V4 (Zeki, 1983), and area IT (Komatsu et al., 1992). A study by Mazer and Gallant (2003) of macaque monkeys viewing grayscale natural scenes indicates that ventral area V4 and IT are involved in the computation of saccade targets. In area V4 parallel and serial search mechanisms are present during visual search for color and/or shape defined targets (Bichot et al., 2005). These neurophysiological studies provide evidence for a close interaction of attentional mechanisms and color processing.
On the psychophysical side, there are several studies on the influence of color on visual attention. In visual search the influence of color on attention has been studied in great detail. Color singletons “pop-out” in large search displays, i.e., the reaction time does not depend on the size of the search display (Treisman and Gelade, 1980; Nagy and Sanchez, 1990; D’Zmura, 1991). Color singletons capture attention even irrespective of the observers’ attentional set (Theeuwes, 1994). However, if the difference in hue between distracters and target is small (e.g., green distracters and yellowish-green target), the reaction time will depend on the search display size (Nagy and Sanchez, 1990). This indicates a boundary for pop-out effects of color in visual search.
Another important line of research is concerned with local operators in the color domain that predict fixation locations in natural color images. It was shown that chromaticity is a predictive feature (Tatler et al., 2005), but its salience (ability to attract attention) differs between image categories like, e.g., City Scenes or Natural Landscapes (Parkhurst et al., 2002). However, we can describe color information by several physiologically plausible features, like saturation or color-contrast in the opponent color-channels. These features influence the firing of neurons in the retino-geniculate channels as well as parvocellular and koniocellular layers of LGN (Hendry and Reid, 2000; Gegenfurtner and Kiper, 2003). Using these color features, we have shown that different color features influence overt visual attention selectively in certain environments. While saturation is the local color operator that predicts best where we fixate in images of flowers and forests, color-contrasts are the best predictors in images of European or Northern American landscapes as well as rainforest (Frey et al., 2008). The category, in which we found the strongest influence of color-contrasts on overt attention, is rainforest. Therefore, this category is particularly suited to the present study.
In this study, we examine the nature of the reported relationship between color features and human overt attention in rainforest images. To this end, we employ two different experimental stimulus manipulations: reduction and manipulation of color information. In Experiment 1, we reduce the chromaticity along each of the two cardinal color axes. This yields images completely devoid of either R–G or B–Y color information, while not affecting the luminance axis and the remaining other color axis of the DKL space. In Experiment 2, we parametrically rotate the hue of each pixel in its isoluminant plane. The rotation of hues allows us to test two extreme hypotheses about the influence of color-contrasts on overt visual attention. If a color-contrast has a causal influence on overt attention then it should have a constantly high effect size irrespective of color rotation. However, if other features are salient or higher-level processes are involved, then the effect sizes should depend on the rotation angle. In the latter case the observed high effect size for R–G contrast in natural images would be due to a mere correlation with high-level features. In Experiment 3, the manipulated stimuli are presented to deuteranope participants. The altered cone sensitivities in deuteranopes mostly affect the R–G color opponent channel, i.e., they have difficulties discriminating yellowish red from green hues. Examining color features and fixation behavior in these two populations of participants allows us to assess the salience of color features beyond correlational analysis.
Materials and Methods
Color Representation
For all experiments we used the DKL color space (Derrington et al., 1984). It consists of three orthogonal axes: (1) “Constant blue” is given by the difference between L and M cone excitations (L–M). For the sake of simplicity we will refer to this axis as the red–green (R–G) axis. (2) “Tritanopic confusion” is defined by S − (L + M). We will refer to this axis as the blue–yellow (B–Y) axis. (3) “Luminance” is defined by (L + M). The azimuth in the plane of the two color axes defines a color’s hue (0° at R–G > 0, B–Y = 0). The projection of a pixel in DKL space onto this isoluminant color plane preserves the chromatic properties of the pixel and we refer to the result of this projection as the chromatic content of a pixel.
Stimuli
Photographs of Ugandan rainforest and color-modified versions thereof served as experimental stimuli. These images were all obtained from the Kibale Forest image dataset (Troscianko et al., 2003, Lovell et al., 2005). They were taken with a carefully color-calibrated digital camera (Nikon Coolpix 950). The photographs depicted mainly leaves, fruit, bushes, and trees of Kibale Forest in variable distance. No man-made objects were present in the scenes. All color-modifications were carried out in DKL color space.
We presented stimuli on a 21′ CRT monitor (SyncMaster 1100 DF, Samsung Electronics, Suwon, South Korea; CIE coordinates of the phosphors: red 0.628/0.328, green 0.28/0.598, blue 0.146/0.06) at 100 Hz vertical refresh rate. Gamma of the presentation monitor was corrected in order to achieve a linear mapping of DKL values to monitor output.
In Experiment 1 we presented 40 images in three different conditions. First, we used the unmodified DKL stimuli in which information of the full color spectrum was included. We will refer to these natural color stimuli as “NAT” condition. Second, we set the saturation of the B–Y axis to zero, thus creating stimuli in which there was only luminance and red–green color information present. This condition will be referred to as “NoBY” condition. Third, we eliminated the influence of the R–G axis by setting the saturation of this axis to zero. We will refer to these stimuli as “NoRG.” An example image in all three conditions is depicted in Figure 1. Participants were seated 60 cm from the monitor surface, which yielded approximately 37° × 28° of visual angle for our stimuli.
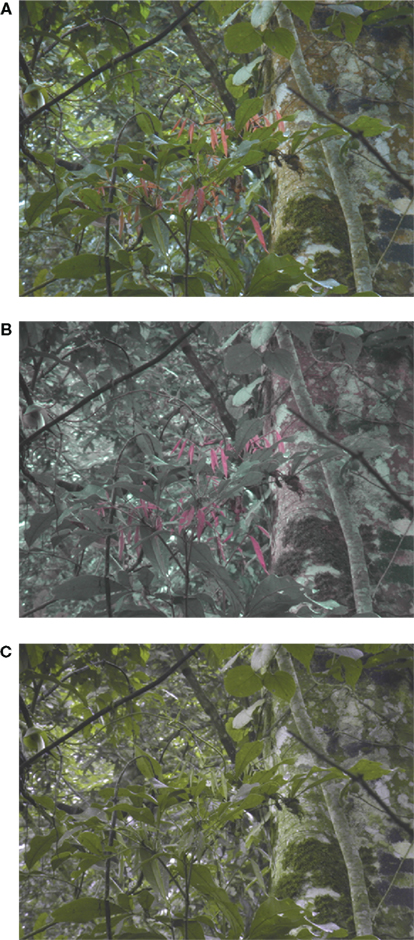
Figure 1. Experimental conditions. Example image in conditions NAT (A), NoBY (B), and NoRG (C).
In Experiment 2 we used 84 images. The images were presented to the participants in 12 different conditions. In each condition, the color of each pixel was rotated by a certain angle around the luminance axis. This caused changes in hue, for example a pixel that was red in the natural image would appear in a purplish blue if rotated by 90° clockwise, bluish green if rotated by 180°, and greenish yellow if rotated by 270°. Rotation angles were chosen with exponentially increasing angles between 0° and 90°. Intermediate values were calculated according to

These values were rounded to the next smaller integer. The first value (r1 = 2°) was omitted because no visible difference to the 0° condition could be detected. Since images were rotated both clockwise and counterclockwise this led to the following 12 conditions: 0°, 4°, 9°, 20°, 42°, 90°, 180°, 270°, 318°, 340°, 351°, 356°. After these modifications, the stimuli were converted to RGB images for presentation on the screen. Participants were seated 80 cm from the monitor surface which yielded approximately 28° × 21° of visual angle for our stimuli.
In Experiment 3, we presented the same 40 images as in Experiment 1. To increase the probability of assessing differences between deuteranope and color-normal participants, we presented these images in conditions with strong effects in Experiment 1 and 2. Therefore we employed the conditions NoRG and NoBY, as well as 90° and 270° color rotated. To obtain a baseline for effects without any color information available, we also presented these images in grayscale. Participants were seated 80 cm from the monitor surface, which yielded approximately 28° × 21° of visual angle for our stimuli.
Subjects
All experiments described in this article conformed to the Declaration of Helsinki. Each participant was tested for normal color vision using the Ishihara test for color deficiency (Kanehara Trading, Tokyo, Japan) and for normal visual acuity using a Snellen chart and Landolt rings. They had not seen the stimuli before and were naïve to our specific research questions. All participants gave written informed consent to participate in the experiment.
In Experiment 1 and 2, 15 and 36 undergraduate students from the University of Osnabrück participated, respectively. 12 volunteers, who responded to advertisements looking for color-blind individuals, took part in Experiment 3. In addition to the Ishihara plates (Kanehara Trading, Tokyo), the latter completed the Farnsworth-Munsell 100-Hue test under daylight conditions. Based on the scores and error patterns in both tests, we classified eight of these participants as deuteranope. We will only report the results for these participants. The four other participants were deuteranomalous and therefore not included in the study.
Experimental Design
In all experiments, participants’ eye positions were continuously recorded while they explored the images presented. In order to minimize any instruction-related bias, we instructed participants to “study the images carefully.” Each image was presented for 6 s. Between two consecutive stimuli, a fixation point was displayed at the center of the screen. The experimenter manually prompted presentation of the next stimulus after the participant had fixated this point. A “trial” refers to the fixations made by one participant on one image of a given category and condition. Between blocks, participants were asked to take a break.
In Experiment 1 and 3, stimuli were presented in two blocks of 60 and 120 images, respectively. The order of presentation was randomized for each participant, with the constraint that no image was presented in a row.
In Experiment 2, participants were not presented with all images in all conditions. Instead, each participant saw each of the 84 images in only one out of the 12 possible conditions. The order of presentation was randomized in a way that each condition was presented equally often across participants.
Eye-Tracking
Eye-movements were recorded using a head-mounted EyeLink II system (SR Research, Ontario, Canada) at a sampling rate of 250 Hz. Saccades and fixations were defined based on four parameters: a saccade was detected if the acceleration exceeded 8000°/s2, the velocity was higher than 30°/s, a distance of at least 0.1° was covered, and a minimum duration of 4 ms exceeded.
Before each block of stimuli, the eye-tracking system was calibrated using a nine-point calibration. We only started the next block if a mean calibration error below 0.4° of visual angle was reached, and the eye with lower error was then selected for monocular recording. Presentation computer and monitor, eye-tracker, and recording computer were positioned in the same darkened room. The experimenter was present in the room for the duration of the experiment.
Definition of Features
We analyzed the influence of three neurophysiologically relevant color features on the participants’ overt attention: saturation, R–G, and B–Y color-contrast. These features were defined analogous to Frey et al. (2008). Feature values were computed in a 2.3° square patch centered on a given pixel. Alternative patch sizes, ranging from 1.2° to 3.5°, were also used for all features but did not lead to any qualitative difference in the results.
Feature Analysis
In order to assess the influence of stimulus features on overt attention, we used the same procedure as in Frey et al. (2008). We defined “actual” values as median feature values at fixated locations (green crosses in Figure 2A) in a trial (MA). These “actual” values were compared to a corresponding baseline that took into account potential biases in the participants’ eye positions. These control fixations were defined by all fixations of the same participant on all other images in the same category and condition (red crosses in Figure 2A). The median feature values at these control locations were the “control” values (MC). The actual value would be different from the control value if the feature is correlated with overt attention. These values were not normally distributed (Figure 2B). Therefore we tested the significance of this difference using a non-parametric statistical test, the two-sided Kolmogorov–Smirnov test (KS-test). Since we did several comparisons for each feature we used Bonferroni correction of p-values for the test. Features for which actual and control distributions differed with p < 0.01 were termed salient.
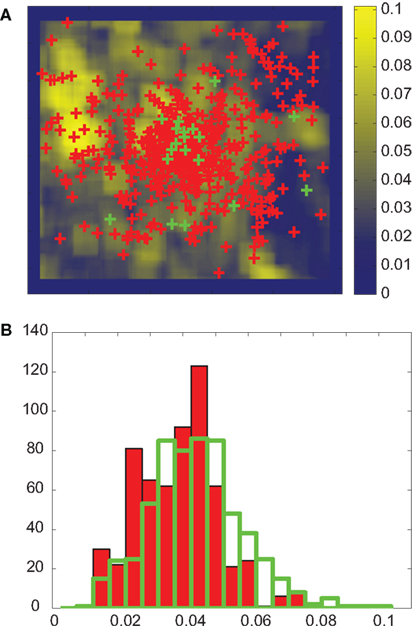
Figure 2. Feature analysis. (A) Measured fixation locations of one participant (green) and corresponding control locations (red, see text for details) plotted on the B–Y color-contrast map of the image in Figure 1A. For each image and participant, the actual value is defined as the median feature value over all fixations. Control values are defined in an analogous manner. (B) The distribution of actual (opaque bars with green edge) and control (red bars) B–Y color-contrast for all participants and images in the NAT condition. The KS-test indicates that these two distributions are significantly different with p < 0.01. The effect size is 0.19. For presentation only, the distributions are binned using 20 bins.
In order to compare the differences between actual and control values among different conditions we calculated a normalized effect size, defined as 
Congruency of Fixation Locations between Conditions and Observers
Changing the distribution or presence of salient image features influences the distribution of fixations made on a given stimulus. If fixations of a participant differ between the three conditions of the same image, then a certain aspect of color information influences overt attention. Examining the congruency between different observers allows us to further quantify this effect. To assess the congruency of fixations between conditions and observers, we use an information theoretic measure, the Kullback–Leibler divergence (KL-divergence, Kullback and Leibler, 1951), as described in detail by Frey et al. (2008).
In short, the KL-divergence between two fixation probability distributions P and Q is calculated by:
The probability distributions are calculated by convolving a unit impulse with a 2D Gaussian with half-width at half height of 1° visual angle. We divide this map by the sum of its entries to obtain the probability distribution.
Image Statistics
One critical assumption of stimulus-driven saliency is that singular peaks in one feature channel should contribute to saliency more than multiple peaks in another channel (Itti et al., 1998). In order to extend our analysis of color features we therefore assessed the peakiness of the different feature distributions. We defined the following measure of peakiness: we summed all feature values that are bigger than the mean by two SD or more. This sum of very high feature values was then divided by the number of image pixels taken into account. We applied this measure in Experiment 2.
Results
Experiment 1
This experiment is designed to assess the influence of the two cardinal color-channels on overt visual attention. If color features causally contribute to visual attention we expect that our experimental manipulation strongly influences selected fixation points. However, before looking at the actual eye-movements, we first analyze the salience of color features at fixated locations.
Color features
The effect sizes for R–G contrast in images which contain R–G color information are very high. For NAT we get a mean effect size of 0.65 and for NoBY 0.69 (Figure 3, upper panel). These values indicate that R–G contrast is 65 and 69% higher at fixated than at control locations, respectively. The effect sizes for B–Y contrast are significantly smaller than those for R–G contrast in natural images (p < 0.01; two-sided KS-test, n1 = 600, n2 = 600). The mean effect size is 0.16 in naturally colored and R–G reduced images. These results confirm our previous finding that R–G contrast is highly salient in rainforest images, whereas B–Y contrast is not.
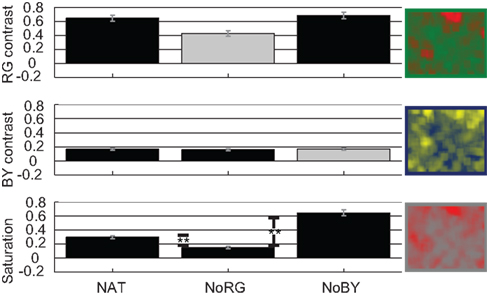
Figure 3. Color features Experiment 1. Effect sizes [with SE of mean (SEM)] for features R–G contrast, B–Y contrast, and saturation in all three conditions of images.
Virtual color-contrasts, e.g., calculating R–G contrast on an image that participants saw devoid of R–G color information, allow us to further elucidate the salience of color features. If a feature had a high effect size solely by a correlation with other truly salient features or objects, then its virtual effect size would be unchanged. This is exactly what we find for B–Y contrast (Figure 3, middle panel). However, we detect a significant drop of 0.2 in R–G contrast effect size in images devoid of R–G color information. The lack of R–G color information therefore seems to causally influence human eye-movements.
The last image feature we look at is saturation. In those conditions in which the R–G channel is reduced, the effect sizes for saturation are significantly smaller than in the other two conditions (Figure 3, lower panel). Interestingly saturation is even higher in images devoid of B–Y color information than in naturally colored images.
The reduced saturation and virtual color-contrast suggest that we look at different locations in R–G reduced images.
Fixation distributions
As a next step, we analyze the congruency between different observers looking at the same image (same condition). A high congruency between observers is an indicator that certain aspects of an image strongly and reliably attract attention. Furthermore, we analyze the congruency of fixation locations between different conditions of the same image for each participant. This allows us to examine whether participants tend to look at the same image regions irrespective of the type of stimulus modification. Taken together these measures allow us to assess, which aspect of color makes participants look at shared locations, i.e., is salient.
The mean KL-divergence between different observers is 16.65, 17.8, and 16.56 bits for NAT, NoRG, and NoBY, respectively (Figure 4A). In NoRG, the values are significantly higher than in both other conditions (p < 0.01; two-sided KS-test with Bonferroni correction, n1 = 600, n2 = 600). This indicates that when R–G color information is absent, participants tend to look at more dissimilar locations.
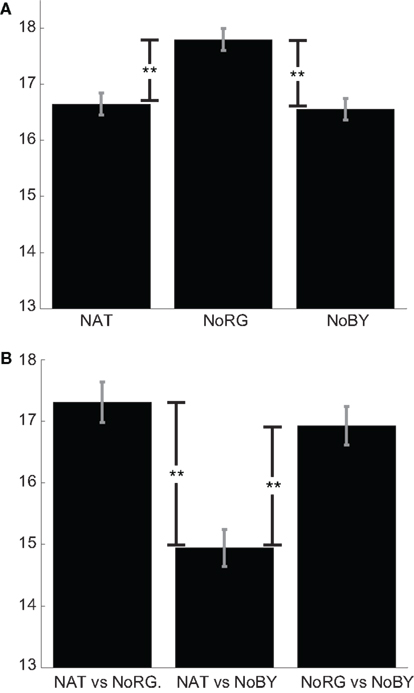
Figure 4. Congruency of fixation locations. (A) Mean KL-divergence (with SEM) between observers for NAT, NoRG, and NoBY. The divergence is significantly higher for NoRG compared to the other two conditions. In this condition the participants’ fixation patterns are more dissimilar. (B) Mean KL-divergence (with SEM) between conditions.
The mean KL-divergence of fixation maps of different conditions is 17.31 bits for the comparison between NAT and NoRG and 16.92 for the comparison of NoBY and NoRG. The divergence for both conditions, which contain R–G color information, is much smaller (14.95 bits; Figure 4B). The fixation locations of each participant on the same image are significantly less similar if R–G color information is missing. These results suggest that color information on the R–G axis causally attracts overt attention in rainforest images.
Experiment 2
Color-contrast
The parametric rotation of hues makes it possible to state two extreme hypotheses about the influence of color-contrasts on overt visual attention. If a specific color-contrast had a causal influence then it should have a constantly high effect size irrespective of color rotation. The second possibility is that color-contrasts defined along color axes are not salient. In that case we can assume that participants look at the same image locations, irrespective of color rotation defined by the two color axes. This would yield effect sizes following a sinusoid when plotted against rotation angle.
In naturally colored images (0° rotation), consistent with earlier studies, R–G contrast is more salient than B–Y contrast. With increasing rotation angle the R–G contrast first slightly increases, then reaches a minimum at 90° and a local maximum at 180°. B–Y contrast shows the inverse pattern (Figure 5). Analysis on 1.2° × 1.2° and 3.5° × 3.5° image patches showed slight variations in the absolute effect sizes (higher for smaller patches, lower for larger patches), but the global pattern remains completely unchanged. The obtained effect sizes almost perfectly match the second hypothesis.
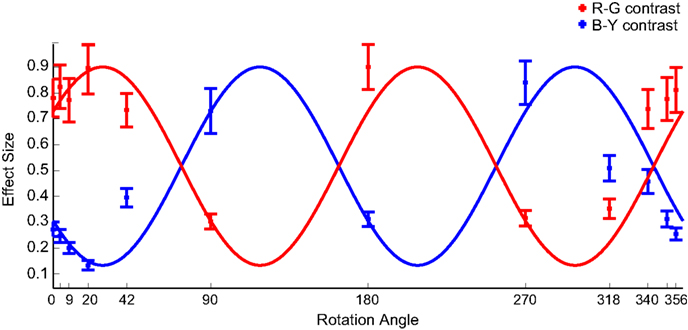
Figure 5. Color-contrasts Experiment 2. Mean effect sizes (with SEM) for R–G (red marks) and B–Y (blue marks) contrast, calculated on 81 × 81 pixel patches, in the different color rotation conditions. The cosines reflect the hypothesis that the same image locations are fixated in all conditions, irrespective of its color-contrast. Their maximum is fitted to the largest effect size found, and the amplitude is the difference between the largest and the smallest effect size. The cosines are shifted by 34.5° to the right to correct for the asymmetry in image statistics. The labeling of tick-marks at the 4° and 351° condition are omitted for better readability.
This shows that no color-contrast along a specific axis influences overt visual attention causally in rainforest images. Instead, the data suggest that color-contrast is evaluated in a hue-invariant way.
Peakiness measure
At this point we consider the influence of image statistics of the color features on fixation behavior. It is possible that participants are attracted by the feature with the highest variations in the image. These image statistics change along with the parametric rotation of the colors. Therefore we examined the peakiness of the color-contrasts in all images and conditions.
Indeed we find the pattern of peakiness matches the pattern of the color-contrast effect sizes very well (Figure 6). For both color-contrasts the correlation between mean effect size and mean peakiness over conditions is r = 0.93.
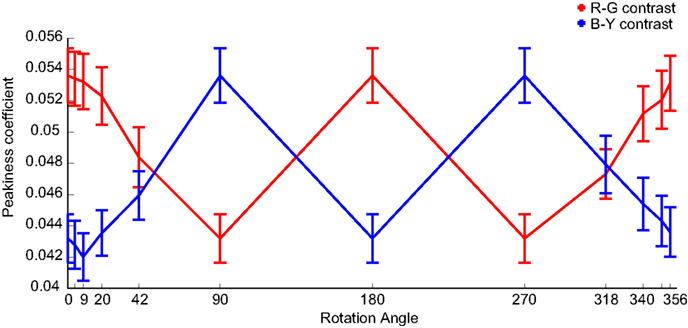
Figure 6. Peakiness of color-contrasts. Mean peakiness values (with SEM) for R–G (red line) and B–Y (blue line) color-contrasts, calculated for the same patch size as Figure 9. There is a correlation of 0.93 between the mean peakiness and mean effect sizes for both color-contrasts.
This indicates that higher peaks in the color feature maps make a feature more salient. This would constitute a mechanism that is not tied to a specific axis in color space, but interacts with global image statistics.
Fixation distributions
The results for the color-contrasts let us assume that participants fixated the same locations no matter how the images were color-rotated. Since we presented each image only once to each participant we cannot compare the fixation locations of the same participant between different conditions. However, we can do an inter-observer congruency analysis comparable to Experiment 1. Still, we have to bear in mind that it is not exactly identical, since the different participants did not always see the same condition of images.
Mean KL-divergence between participants is 15.54 bits. This value is lower than the divergence between observers in Experiment 1. This indicates that viewing behavior is rather constant when stimuli are rotated in color space and participants most probably fixate the same locations in color-rotated and naturally colored images.
Experiment 3
Color features
Deuteranopes have problems discriminating yellowish red from green based on their hue. These hues however are very prominent among the rainforest pictures we use in this study. Therefore we expect that color features influence deuteranope participants differently than color-normal participants.
The effect sizes in deuteranope participants for R–G contrast in images, which contain R–G color information, are very high. For NAT images we get a mean effect size of 0.6 and for NoBY 0.62 (Figure 7, upper panel). In the 90° and 270° color-rotated images, R–G contrast has an effect size of 0.21 and 0.18, respectively. The effect sizes for B–Y contrast are significantly smaller than those for R–G contrast in NAT and NoBY, while they are significantly higher in the color-rotated images.
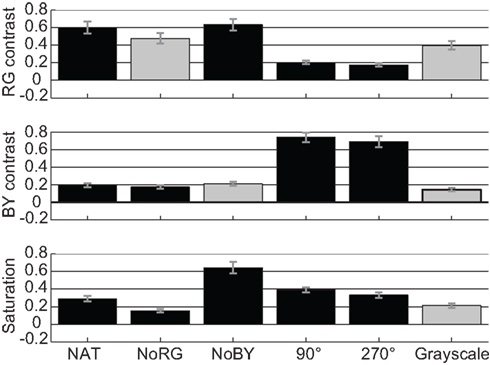
Figure 7. Color features in deuteranope observers. Effect sizes (with SEM) for features R–G contrast, B–Y contrast, and saturation in all conditions of images in deuteranope participants.
To our surprise, we find the same pattern of results across experimental conditions as for the color-normal participants. The only difference we find is with the virtual color-contrast. While the difference between the effect size for R–G contrast in NAT images and virtual contrast in NoRG images is only 0.12 for deuteranope participants (Figure 7, upper panel), this difference is 0.22 in color-normal participants (Figure 3, upper panel). This indicates that even in the absence of R–G color information deuteranope participants are more likely to look at locations that would have a high R–G contrast. This is a hint that color-blind participants employ a compensatory mechanism which is independent of R–G color information.
In order to refine our approach of averaging over all fixations in a trial we analyze the data time resolved at the level of single-fixations. Since fruits in front of foliage have a high R–G contrast, we exclude for this analysis all images with fruits within 2° of the initial fixation cross. This leaves us with 22 images.
For the color-normal participants from Experiment 1, the maximum peak of R–G contrast is reached within two fixations (Figure 8A). After this fixation the R–G contrast values decline continuously. In contrast, the deuteranope participants first look at patches with lower R–G contrast. They need four fixations to reach the patches with maximal R–G contrast effect size. This means that there is a delay of two fixations that deuteranope participants need to reach maximum R–G contrast. We find no such delay for the other color features B–Y contrast and saturation (Figures 8B,C). An example for the fixation patterns at fixations three and five for color-normal and deuteranope participants is depicted in Figure 9.
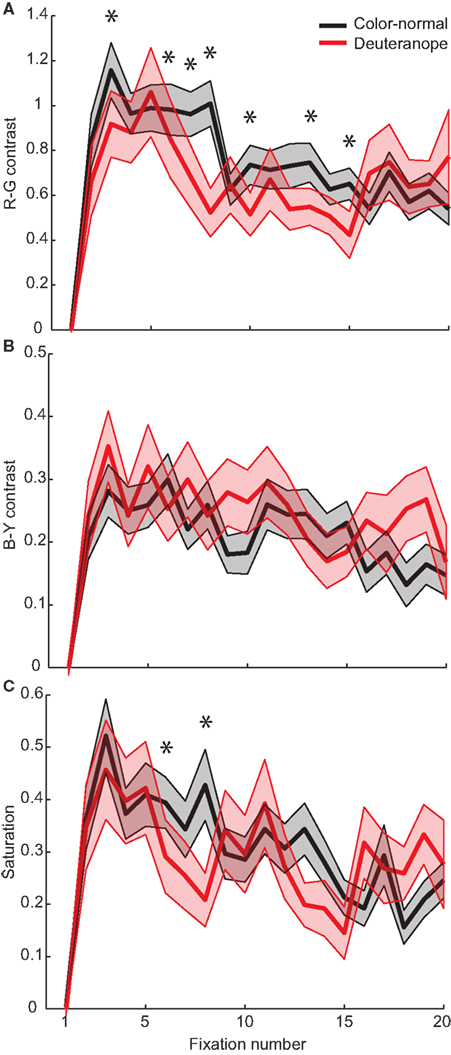
Figure 8. Color features for each fixation. Effect sizes for the features R–G contrast (A), B–Y contrast (B), and Saturation (C). The shaded areas represent the SEM. Asterisks indicate significant differences between color-normal and deuteranope participants, determined by a two-sided Kolmogorov–Smirnov test (n1 = 330, n2 = 176).
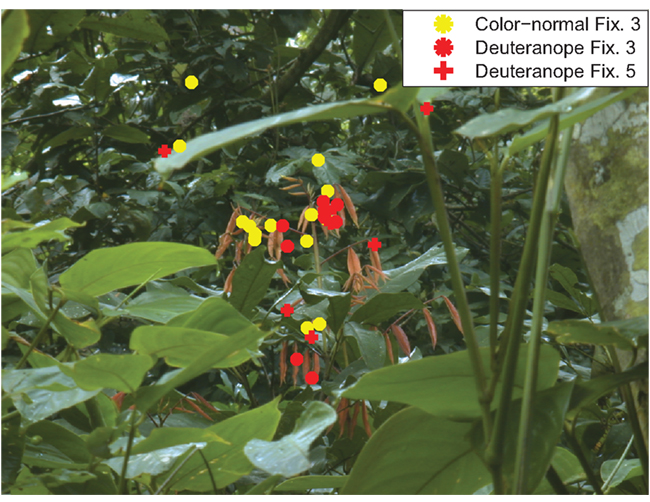
Figure 9. Example fixation distributions. The third fixations of color-normal (yellow) and deuteranope participants (red) are plotted as asterisks. The fifth fixations of the deuteranope participants are plotted as a red plus.
Summing up, we do not find differences in the averaged color feature effect sizes between color-normal and deuteranope participants. This demonstrates that deuteranope participants are able to compensate for their deficit in color discrimination in guiding eye-movements. However, the delay of maximal correlation with R–G contrast indicates that this process needs time and presumably involves a compensation process that requires at least 300–400 ms.
Fixation distributions
How does the different apperception of the visual environment influence the eye-movements of deuteranope participants? We first report the results on congruency of fixation locations between the different deuteranope participants, as well as the congruency between different conditions. Then we compare fixation locations between deuteranope and color-normal participants.
The mean KL-divergence between different deuteranope observers is 15.42, 16.41, and 15.66 bits for NAT, NoRG, and NoBY, respectively (Figure 10A). In NoRG the values are significantly higher than in the NAT condition (p < 0.05; two-sided KS-test, n1 = 320, n2 = 320), while there is no significant difference to the NoBY condition. Inter-observer congruency is highest (low KL-divergence) in images with color content rotated. The KL-divergence is 14.89 and 14.76 for the 90° and 270° conditions, respectively.
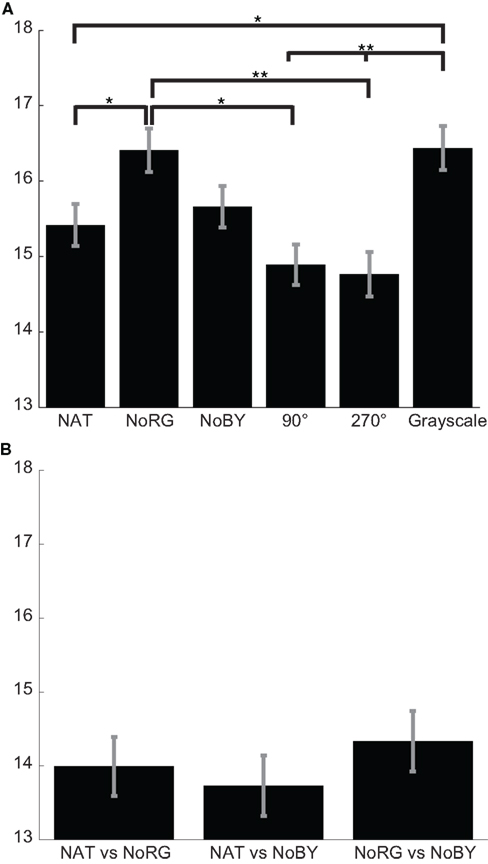
Figure 10. Congruency of fixation locations in deuteranope observers. (A) Mean KL-divergence (with SEM) between different deuteranope observers for NAT, NoRG, NoBY, 90 and 270 rotated, and Grayscale. The divergence for conditions devoid of R–G color information is significantly bigger than in all other conditions (except NoBY). (B) Mean KL-divergence (with SEM) between conditions.
For the congruency of fixation locations between conditions (within subjects), we only analyze the three conditions used in Experiment 1. None of the KL-divergences between two conditions differs significantly from other comparisons (Figure 10B).
In general, the deuteranope participants exhibit a higher inter-observer congruency and a higher congruency of fixations between conditions than the color-normal participants in Experiment 1. In both groups inter-observer congruency is lowest (highest KL-divergence) in images devoid of R–G color information. However, while this effect is highly significant in color-normal participants, it is much less so in the deuteranope participants. Another difference between the two groups of participants is the congruence between fixations in different conditions. The individual deuteranope observers fixate similar locations no matter whether the image contains R–G color information or not. This pattern of results implies that R–G color information has only a limited influence on overt attention in deuteranope observers and they employ compensation mechanisms.
Discussion
Different Levels of Attentional Control
The current study expands previous analyses of the salience of color features by parametrically changing image properties. This allows us to determine whether the relationship between these features and overt attention, observed in previous studies, holds under the modified conditions.
Removing the available R–G color information in Rainforest images significantly alters the subjects’ fixation behavior. No such effect can be observed for the B–Y axis. This supports the idea of a causal stimulus-dependent (bottom-up) influence of the R–G color channel on overt attention.
However, if we globally rotate colors in these images, there is no relationship between specifically the R–G color-contrast and overt attention anymore. Therefore, even though the R–G channel conveys evolutionarily important color information, the visual system of humans does not only rely on this color channel for detecting salient image regions. In fact, we find high effect sizes for the B–Y channel for images with color content rotated by 90° or 270°. This speaks in favor of only a correlative relation of color-contrasts with fixated image locations.
At first sight the results of Experiment 1 and 2 seem to contradict each other regarding the role of color-contrast in determining salient regions. However, taking into account higher-level cortical processes, these two conflicting sets of results can be explained. Recent research provided evidence for a strong influence of objects on overt attention (Einhäuser et al., 2008). Einhäuser et al. (2008) proposed that object recognition and stimulus-driven saliency are integrated in higher visual areas such as V4 or IT. In neurophysiological studies, these ventral stream areas have been found to compute saliency (Mazer and Gallant, 2003; Bichot et al., 2005). Such a model is compatible with the results of the present experiments: double opponent cells in primary visual cortex, which are also sensitive to luminance and orientation, suggest that color information feeds into visual form analysis early on (Johnson et al., 2001). In the NoRG condition (Experiment 1) processing is hindered by the lack of that contribution, leading to a significant change in distribution of the first fixations with reduced virtual R–G-contrast and increased inter-subject variability. This hypothesis is supported by the results of deuteranope subjects. These have considerable experience with processing visual information devoid of R–G information and we observe compensatory mechanisms and a paradox correlation of fixation points with R–G features in natural (NAT) as well as in reduced color information (NoRG) conditions. This surprising observation suggests that deuteranope subjects have developed compensatory mechanisms, which operate also in the special reduced color information (NoRG) condition. In Experiment 2, the full visual information is available in all rotation conditions, even though the contribution of the color axes to interesting objects varies as a function of rotation angle. Color-normal subjects are able to utilize the relevant information, although it is channeled via the B–Y system at early levels. Taken together, our results suggest that R–G-color information contributes to overt attention in Rainforest images already at low-level (in a bottom-up fashion) and is complemented by processes that draw on both color-channels.
Although the emerging view gives a parsimonious explanation of the available experimental data, another curious question is left open. What is the role of B–Y channel in the guidance of eye-movements? The blue cones, instrumental to establish BY-contrast, are distributed unevenly on the retina with a minimum in the fovea. This might lead to the speculation that it contributes less to scrutinized vision, but instead guides global processing. This, however, is at odds with the present results of low correlation of B–Y-contrast in normal subjects and the unchanged inter-subject variability in the NoBY condition. Yet the BY system is well developed and retained in evolution in the step from bird, fish, and reptiles to nocturnal mammals.
Other Image Features
This study was specifically designed to address the influence of color features on overt visual attention. There are several other luminance-defined stimulus features, which have been studied in recent experiments, but have been held constant across conditions in the current study. We will shortly discuss the findings of these experiments and their relation to the present study.
One of the first image features proposed to influence overt attention was luminance contrast. Several studies showed elevated luminance contrast at fixated compared to non-fixated regions (Reinagel and Zador, 1999; Parkhurst and Niebur, 2003). However, several studies (Einhäuser and König, 2003; Açik et al., 2009) showed that when luminance contrast is locally altered over a limited range there was no causal relation to selection of fixation points. In addition, two studies in our lab using the physiologically plausible DKL color space showed only weak or missing salience of luminance contrast in different categories (Frey et al., 2007, 2008). Therefore luminance contrast most likely is not a feature to compensate for altered color information.
The second-order contrast in the luminance channel is another possible candidate. Using a modified model of bottom-up attention, which incorporated this so-called texture contrast, Parkhurst and Niebur (2004) could replicate in a model the experimental results of Einhäuser and König (2003). However, we found texture contrast to be salient only in images of Landscape and Man-Made objects (Frey et al., 2007, 2008). Therefore the salience of this feature is definitely limited to certain image categories.
Other luminance-defined image features that could be possible candidates are edge density or more complex line elements. Mannan et al. (1996) analyzed several image features including luminance-defined edges, but showed that they do not really attract attention. More complex line elements like curved edges or junctions are more likely candidates. Using their definition of intrinsic dimensionality Krieger et al. (2000) showed that the bispectra of image regions selected by complex line elements (i2D operators; Zetzsche and Barth, 1990) are similar to the bispectra of image regions fixated by human observers. The i2D operators are comparable to stimuli that drive end-stopped cells found mainly in area V2 of visual cortex. Combining intrinsic dimensionality operators and self-information, Saal et al. (2006) generated saliency maps that predicted human fixations very well in different categories of images.
Timing of Stimulus-Driven Mechanisms
Several visual search studies have addressed the timing of bottom-up and top-down (high-level) attentional control. Attentional control is determined by stimulus-driven attention for a very early time window. Müller and Rabbitt (1989) showed that valid peripheral cues presented around 175 ms before the onset of a search display increased the probability of detecting the target. For valid central cues however, the stimulus-onset asynchrony needed to be about 400 ms. These results suggest that top-down control elicited by the central cue occurs later than bottom-up control elicited by the peripheral cue. In addition, these two processes seem to have a different time course of operation. A similar finding has been reported by Van Zoest et al. (2004). They asked participants to make a speeded saccade toward a target embedded in several non-targets. If a salient distracter was presented on a trial, the percentage of saccades to the target was low for fast saccades. Somewhat slower saccades with a latency of around 300 ms were aimed significantly more often toward the target. The authors propose that bottom-up control operates very early in each trial before top-down interactions set in. These results are in line with a timing account of visual attention (Van Zoest et al., 2004). According to this perspective, visual selection may be either bottom-up or top-down driven as a product of response time.
Whereas in the visual search study of Van Zoest et al. (2004) the first saccade was already susceptible to top-down influence, we see the maximum peak of the bottom-up feature effect sizes only at the target of the second saccade. An important difference to our study is that here subjects had the task to study the image carefully. This has the advantage of avoiding template search, however comes at the price of not knowing what kind of strategy the participants employed. Still, since we were interested in a baseline measure of the saliency of color features, we decided not to give a task that primed participants with a given strategy. Furthermore, since in our study the second saccade started on average around 630 ms after stimulus-onset, the peak stimulus-driven contribution is in the time-range of top-down control, as determined by visual search experiments. One possible explanation is the complexity of the stimuli used. The rainforest images used in this study typically contain several locations with very high values for color and luminance-defined features. Given the spatial constraints of selection of fixation points (Kollmorgen et al., 2010) it is plausible that participants first make short exploratory saccades. This difference between the natural scenes and visual search experiments could probably be further examined by using increasingly more crowded search displays.
Deuteranopic Participants
We have to be careful when trying to generalize the results from studies involving observers with color vision deficiencies. On the one hand, several studies revealed that dichromatic observers also exhibit other color deficits. For example, Regan et al. (1994) showed that protanope and deuteranope participants have higher tritan thresholds than color-normal observers. This indicates that color-channels that were assumed to be unaffected in dichromats, also showed impairments. On the other hand, there seems to be considerable heterogeneity among deuteranomalous observers for the wavelength of peak sensitivity (Shevell and He, 1997). Since we did no extended psychophysical testing on a Nagel anomaloscope and no genetical sequencing of their opsin gene arrays, we cannot classify our participants as deuteranopes with absolute certainty. However, we tried to obtain a homogenous group by selecting only those participants who had the highest deuteranope-score in the Ishihara test and exhibited the typical error pattern in the Farnsworth-Munsell 100-Hue test. Doing so ensured that these participants definitely had severe problems of color discrimination in the red–green color spectrum. This procedure is sufficient, since we only wanted to assess the effect of missing color discrimination in the R–G color channel.
At first the results for the deuteranope participants came as a surprise. We expected them to show significant differences in feature correlations. Our previous work had shown that R–G color-contrast is highest at fixated locations of color-normal observers in Rainforest images (Frey et al., 2008). Deuteranope observers usually are unable to discriminate a wide range of isoluminant hues from yellowish red to green, which are processed along the R–G axis. However, they are able to detect differences in luminance within this range, with low luminance levels perceived as brown and high luminance levels as orange. If the fruits and foliage (as well as other interesting elements of the scene) showed differences in luminance, then the deuteranope observers should be able to detect those.
However, the results of the single-fixation analysis revealed that it takes deuteranope compared to color-normal observers two more fixations (about 600 ms) in order to reach the peak R–G contrast effect size in images where fruits are not at the center of the image. This finding coincides with the observation that – in these images – color-normal observers fixate on fruits already on the second or third fixation, while it takes deuteranopes one or two fixations more. Therefore we assume that the compensation process observed in deuteranope observers is due to higher-level scene processing. They might first need to process the “gist” or configuration of other objects (like, e.g., branches and leaves) in the scene, in order to be able to find the fruits. However, further research is needed to answer this question.
Rainforest Images
The cones of trichromatic primates are optimally tuned to detect food sources in a rainforest environment (Sumner and Mollon, 2000). These food sources mostly include ripe fruit (Mollon, 1989; Regan et al., 2001; Sumner and Mollon, 2000) and edible young leaves (Sumner and Mollon, 2000; Dominy and Lucas, 2001), which have to be detected on a nearly equiluminant background of foliage. This advantage of trichromacy is also reflected in evolutionary selection. While in Caucasians the incidence of R–G color-blindness is around 8%, it is less than 0.1% in macaques (Onishi et al., 1999). Therefore it is very likely that rainforest images are one of the classes of stimuli, in which R–G color information has the most influence on overt attention. And indeed, we find R–G contrast to be much higher than B–Y contrast effect sizes in trichromats. In addition, removing R–G color information significantly alters fixation patterns. Deuteranope participants are able to compensate for their reduced perception of R–G color information by means of high-level strategies at the cost of additional processing time. Taken together, these results show that R–G color information has a considerable influence on attentional processing in this specific environment.
Another important reason for choosing rainforest images is based on our previous findings on stimulus features in different types of natural scenes (Frey et al., 2008). In this previous study we found color-contrasts to be highest at fixated locations in rainforest images compared to all other categories of natural scenes. Therefore this was the category in which we expected to find a causal influence of color features on overt attention. If we do not find a causal influence of color-contrast in the rainforest scenes, then it is very likely that we will not find it in any other type of natural scene.
In contrast to what might be expected, these images do not only present fruits in front of foliage. The images contain close and medium range shots of different flora in the Ugandan rainforest, which in about half of the images is some sort of fruit. Therefore these images are representative of the environment in the rainforest and represent an important type of natural scene, namely one in which primate color vision developed.
Conclusion
Our results provide evidence for more than a correlative influence of color-contrast on overt attention. The nature of the interaction with the image statistics is such that in rainforest images with the major variance along the R–G axis, the feature correlation is highest for this contrast. Nevertheless, evaluation of this color information is done in a hue-invariant fashion. In deuteranopes, mechanisms have developed that compensate for the absence of color information at the cost of a slight delay. As a consequence, in the absence of color information they perform more consistently than color-normal participants.
Conflict of Interest Statement
The authors declare that the research was conducted in the absence of any commercial or financial relationships that could be construed as a potential conflict of interest.
References
Açik, A., Onat, S., Schumann, F., Einhäuser, W., and König, P. (2009). Effects of luminance contrast and its modifications on fixation behavior during free viewing of images from different categories. Vision Res. 49, 1541–1553.
Arrese, C. A., Hart, N. S., Thomas, N., Beazley, L. D., and Shand, J. (2002). Trichromacy in Australian marsupials. Curr. Biol. 12, 657–660.
Bacon, W. F., and Egeth, H. E. (1994). Overriding stimulus-driven attentional capture. Percept. Psychophys. 55, 485–496.
Betz, T., Kietzmann, T. C., Wilming, N., and König, P. (2010). Investigating task-dependent top-down effects on overt visual attention. J. Vis. 10, 1–14.
Bichot, N. P., Rossi, A. F., and Desimone, R. (2005). Parallel and serial neural mechanisms for visual search in macaque area V4. Science 308, 529–534.
Cheal, M., and Lyon, D. R. (1991). Central and peripheral precuing of forced-choice discrimination. Q. J. Exp. Psychol. A 43, 859–880.
Derrington, A. M., Krauskopf, J., and Lennie, P. (1984). Chromatic mechanisms in lateral geniculate nucleus of macaque. J. Physiol. 357, 241–265.
Dominy, N. J., and Lucas, P. W. (2001). Ecological importance of trichromatic vision to primates. Nature 410, 363–366.
Einhäuser, W., and König, P. (2003). Does luminance-contrast contribute to a saliency map for overt visual attention? Eur. J. Neurosci. 17, 1089–1097.
Einhäuser, W., Spain, M., and Perona, P. (2008). Objects predict fixations better than early saliency. J. Vis. 8, 1–26.
Folk, C. L., Remington, R. W., and Johnston, J. C. (1992). Involuntary covert orienting is contingent on attentional control settings. J. Exp. Psychol. Hum. Percept. Perform. 18, 1030–1044.
Frey, H.-P., Honey, C., and König, P. (2008). What’s color got to do with it? The influence of color on overt visual attention in different categories. J. Vis. 8, 1–17.
Frey, H. P., König, P., and Einhäuser, W. (2007). The role of first- and second-order stimulus features for human overt attention. Percept. Psychophys. 69, 153–161.
Geyer, T., Krummenacher, J., and Müller, H. J. (2008). Expectancies modulate attentional capture by salient color singletons. Vision Res. 48, 1315–1326.
Hendry, S. H. C., and Reid, R. C. (2000). The koniocellular pathway in primate vision. Annu. Rev. Neurosci. 23, 127–153.
Hoffman, J. E., and Subramaniam, B. (1995). The role of visual attention in saccadic eye movements. Percept. Psychophys. 57, 787–795.
Ignashchenkova, A., Dicke, P. W., Haarmeier, T., and Thier, P. (2004). Neuron-specific contribution of the superior colliculus to overt and covert shifts of attention. Nat. Neurosci. 7, 56–64.
Itti, L., Koch, C., and Niebur, E. (1998). A model of saliency-based visual attention for rapid scene analysis. IEEE Trans. Pattern Anal. Mach. Intell. 20, 1254–1259.
Johnson, E. N., Hawken, M. J., and Shapley, R. (2001). The spatial transformation of color in the primary visual cortex of the macaque monkey. Nat. Neurosci. 4, 409–416.
Kollmorgen, S., Nortmann, N., Schröder, S., and König, P. (2010). Influence of low-level stimulus features, task dependent factors, and spatial biases on overt visual attention. PLoS Comput. Biol. 6, e1000791. doi: 10.1371/journal.pcbi.1000791
Komatsu, H., Ideura, Y., Kaji, S., and Yamane, S. (1992). Color selectivity of neurons in the inferior temporal cortex of the awake macaque monkey. J. Neurosci. 12, 408–424.
Krieger, G., Rentschler, I., Hauske, G., Schill, K., and Zetzsche, C. (2000). Object and scene analysis by saccadic eye-movements: an investigation with higher-order statistics. Spat. Vis. 13, 201–214.
Kullback, S., and Leibler, R. A. (1951). On information and sufficiency. Ann. Math. Stat. 22, 79–86.
Kustov, A. A., and Robinson, D. L. (1996). Shared neural control of attentional shifts and eye movements. Nature 384, 74–77.
Lovell, P. G., Tolhurst, D. J., Parraga, C. A., Baddeley, R., Leonards, U., Troscianko, J., and Troscianko, T. (2005). Stability of the color-opponent signals under changes of illuminant in natural scenes. J. Opt. Soc. Am. A 22, 2060–2071.
Lucas, P. W., Dominy, N. J., Riba-Hernandez, P., Stoner, K. E., Yamashita, N., Loría-Calderón, E., Petersen-Pereira, W., Rojas-Durán, Y., Salas-Pena, R., Solis-Madrigal, S., Osorio, D., and Darvell, B. W. (2003). Evolution and function of routine trichromatic vision in primates. Evolution 57, 2636–2643.
Maioli, C., Benaglio, I., Siri, S., Sosta, K., and Cappa, S. (2001). The integration of parallel and serial processing mechanisms in visual search: evidence from eye movement recording. Eur. J. Neurosci. 13, 364–372.
Mannan, S. K., Ruddock, K. H., and Wooding, D. S. (1996). The relationship between the locations of spatial features and those of fixations made during visual examination of briefly presented images. Spat. Vis. 10, 165–188.
Mazer, J. A., and Gallant, J. L. (2003). Goal-related activity in V4 during free viewing visual search. Evidence for a ventral stream visual salience map. Neuron 40, 1241–1250.
Mollon, J. D. (1989). “Tho’ she kneel’d in that place where they grew…” the uses and origins of primate colour vision. J. Exp. Biol. 146, 21–38.
Müller, H. J., Krummenacher, K., Geyer, T., and Zehetleitner, M. (2009). Attentional capture by salient color singleton distractors is modulated by top-down dimensional set. J. Exp. Psychol. Hum. Percept. Perform. 35, 1–16.
Müller, H. J., and Rabbitt, P. M. A. (1989). Reflexive and voluntary orienting of visual attention: time course of activation and resistance to interruption. J. Exp. Psychol. Hum. Percept. Perform. 15, 315–330.
Müller, H. J., Töllner, T., Zehetlleitner, M., Geyer, T., Rangelov, D., and Krummenacher, J. (2010). Dimension-based attention modulates feed-forward visual processing. Acta Psychol. 135, 117–122.
Nagy, A. L., and Sanchez, R. R. (1990). Critical color differences determined with a visual search task. J. Opt. Soc. Am. A 7, 1209–1217.
Nathans, J. (1999). The evolution and physiology of human color vision: insights from molecular genetic studies of visual pigments. Neuron 24, 299–312.
Onishi, A., Koike, S., Ida, M., Imai, H., Shichida, Y., Takenaka, O., Hanazawa, A., Komatsu, H., Mikami, A., Goto, S., Suryobroto, B., Kitahara, K., and Yamamori, T. (1999). Dichromatism in macaque monkeys. Nature 402, 139–140.
Parkhurst, D., Law, K., and Niebur, E. (2002). Modeling the role of salience in the allocation of overt visual attention. Vision Res. 42, 107–123.
Parkhurst, D. J., and Niebur, E. (2003). Scene content selected by active vision. Spat. Vis. 16, 125–154.
Parkhurst, D. J., and Niebur, E. (2004). Texture contrast attracts overt visual attention in natural scenes. Eur. J. Neurosci. 19, 783–789.
Regan, B. C., Julliot, C., Simmen, B., Vienot, F., Charles-Dominique, P., and Mollon, J. D. (2001). Fruits, foliage, and the evolution of primate colour vision. Philos. Trans. R. Soc. Lond. B Biol. Sci. 356, 229–283.
Regan, B. C., Reffin, J. P., and Mollon, J. D. (1994). Luminance noise and the rapid determination of discrimination ellipses in colour deficiency. Vision Res. 34, 1279–1299.
Reinagel, P., and Zador, A. M. (1999). Natural scene statistics at the centre of gaze. Network 10, 341–350.
Saal, H., Nortmann, N., Krüger, N., and König, P. (2006). “Salient image regions as a guide for useful visual features,” in Proceedings of IEEE Advances in Cybernetic Systems, Sheffield.
Shevell, S. K., and He, J. C. (1997). The visual photopigments of simple deuteranomalous trichromats inferred from color matching. Vision Res. 37, 1115–1127.
Sumner, P., and Mollon, J. D. (2000). Catarrhine photopigments are optimized for detecting targets against a foliage background. J. Exp. Biol. 203, 1963–1986.
Tatler, B. W., Baddeley, R. J., and Gilchrist, I. D. (2005). Visual correlates of fixation selection: effects of scale and time. Vision Res. 45, 643–659.
Theeuwes, J. (1994). Stimulus-driven capture and attentional set: selective search for color and visual abrupt onsets. J. Exp. Psychol. Hum. Percept. Perform. 20, 799–806.
Treisman, A. M., and Gelade, G. (1980). A feature integration theory of attention. Cogn. Psychol. 12, 97–136.
Troscianko, T., Párraga, C. A., Leonards, U., Baddeley, R. J., Troscianko, J., and Tolhurst, D. J. (2003). Leaves, fruit, shadows, and lighting in Kibale forest, Uganda. Perception 32, 51 (ECVP Abstract Supplement).
Van Zoest, W., Donk, M., and Theeuwes, J. (2004). The role of stimulus-driven and goal-driven control in saccadic visual selection. J. Exp. Psychol. Hum. Percept. Perform. 30, 746–759.
Yantis, S., and Jonides, J. (1990). Abrupt visual onsets and selective attention: voluntary versus automatic allocation. J. Exp. Psychol. Hum. Percept. Perform. 16, 121–134.
Zeki, S. (1983). The distribution of wavelength and orientation selective cells in different areas of monkey visual cortex. Philos. Trans. R. Soc. Lond. B Biol. Sci. 217, 449–470.
Keywords: attention, eye-movements, color
Citation: Frey H-P, Wirz K, Willenbockel V, Betz T, Schreiber C, Troscianko T and König P (2011) Beyond correlation: do color features influence attention in rainforest? Front. Hum. Neurosci. 5:36. doi: 10.3389/fnhum.2011.00036
Received: 07 December 2010;
Accepted: 24 March 2011;
Published online: 08 April 2011.
Edited by:
Leon Y. Deouell, The Hebrew University of Jerusalem, IsraelReviewed by:
Tom Foulsham, University of Essex, UKHermann Josef Mueller, University of Munich, Germany
Copyright: © 2011 Frey, Wirz, Willenbockel, Betz, Schreiber, Troscianko and König. This is an open-access article subject to a non-exclusive license between the authors and Frontiers Media SA, which permits use, distribution and reproduction in other forums, provided the original authors and source are credited and other Frontiers conditions are complied with.
*Correspondence: Hans-Peter Frey, Department of Pediatrics, Albert Einstein College of Medicine, 1225 Morris Park Avenue, Bronx, NY 10461, USA. e-mail:aGZyZXlAZWluc3RlaW4ueXUuZWR1