 Michael F. Neelon1*
 Justin Williams2 and P. Charles Garell3
- 1 Department of Psychology, University of North Carolina at Asheville, Asheville, NC, USA
- 2 Department of Biomedical Engineering, University of Wisconsin, Madison, WI, USA
- 3 Department of Neurosurgery, New York Medical College, Valhalla, NY, USA
A long debate in selective attention research is whether attention enhances sensory response or sharpens neural tuning by suppressing response to non-target input. In fact, both processes may occur as a function of load: an uncertain listener might use a broad attentional filter to enhance responses to all inputs (i.e., vigilance), yet employ sharpened tuning to focus on hard to discriminate targets. The present work used the greater signal gain, anatomical precision, and laterality separation of intracranial electrophysiological recordings (electrocorticograms) to investigate these competing effects. Data were recorded from acoustically-responsive cortex in the perisylvian region of a single hemisphere in five neurosurgery patients. Patients performed a dichotic listening task in which they alternately attended toward, away from, or completely ignored (silent reading) tones presented to designated ears at varying presentation rates. Comparisons between the grand-averaged event-related potential (ERP) waveforms show a striking change in the effect of selective auditory attention with attentional load. At slower presentation rates (low-load), ERPs were overall enhanced in response to both input channels and regardless of attended ear, including a significant enhancement of ipsilateral input. This result supports a broadly enhancing model of attention under low perceptual load conditions. At the fastest rate, however, only responses to attended inputs contralateral to grid location remained enhanced. This result supports an increasing suppression, or “sharpening,” of neural responses to non-targets with increasing attentional load. These data provide support for an elastic model of attention in which attentional scope narrows with increasing load.
Introduction
In the age of e-mail, smartphones, and continuous internet access, it has never been more critical to understand how humans can attend to important events in their environment while ignoring distractions. An enduring question over the last half century of psychophysiological research has been how selective attention modulates response to such sensory input. Two overarching models have emerged as a result of this work: one posits that attention generally enhances neural response (Maunsell and Cook, 2002), while another suggests it sharpens neural tuning, for example, by suppressing response to non-optimal input (Kastner, 2004; Fritz et al., 2007a). A combination of the two processes may further arise as a function of processing load (Kastner, 2004; Lavie, 2005). For example, an uncertain listener might use a broad attentional filter to enhance responses to inputs generally (i.e., vigilance), yet employ sharpened tuning to increase focus on demanding targets.
These questions have been explored extensively in humans using electroencephalography (EEG) and dichotic listening (DL) tasks. This work often focuses on attentional changes in peaks of the averaged event-related potential (ERP) waveform. Hillyard et al. (1973) provided one of the earliest reports that selectively attending to one channel of auditory input during DL enhanced the magnitude of the late-latency peak labeled “N1.” This “N1-effect” of attention is of interest to researchers because it supports: (1) an early intervention of attention in sensory processing given that some N1 subcomponents are exogenous (obligatory) and have sources in the supratemporal plane (STP; Picton et al., 1999; Godey et al., 2001); (2) an enhancing (“gain”) model of attention in which the attended channel’s response is increased by a scaling factor.
Models of asymmetric performance in DL tests assume that contralateral acoustic input dominates over ipsilateral input fundamentally due to denser afferent projections to contralateral auditory cortex (“structural model”; Hugdahl, 1995). Attentional modulation in a DL task is believed to further modulate this baseline contralateral dominance. Following the two models described earlier, attention in a DL task may thus either enhance contralaterally presented input, suppress ipsilaterally presented input, or both. These hypotheses may be addressed by comparing ERP responses to contralateral vs. ipsilateral monaural stimuli in a DL task. The electrophysiological effects of selective attention are often measured by contrasting the response of one target area when attending to a particular input with the same area’s response when attending away from that input. In EEG measures of DL, this is commonly manifested by comparing the responses from one recording site to, say, right ear input when the listener attends to the right ear vs. attends to the left ear (Hillyard et al., 1973).
However, as described above, one possible effect of attention may be to suppress concurrently presented to-be-ignored input. In the EEG scenario just described, this would mean contrasting concurrent responses to right ear vs. left ear input from the same site during a single attention condition (e.g., while attending to the right ear). From the perspective of auditory cortex in one hemisphere, this amounts to comparing contra- vs. ipsilateral responses during the same attention condition. While EEG can exhibit the general contralateral preference of auditory cortex (Woldorff and Hillyard, 1991; Woldorff et al., 1999), EEG studies have not consistently reported laterality effects due to selective attention (Alho et al., 1994). EEG may fail to accurately measure such effects because scalp recordings often superimpose responses from multiple sources, including from both hemispheres. This is especially true when measuring the tangential N1 subcomponent thought to arise from the STP (N1b), which is most prominently recorded from frontoparietal leads. On the other hand, recording from temporal areas, which might provide better laterality separation, often captures different generators (e.g., T-complex; Connolly, 1993; Hine and Debener, 2007). This contamination reduces the sensitivity of scalp EEG for measuring differences between contra- and ipsilateral responses and may obscure whether attention acts in an enhancing or suppressing manner.
Patients undergoing evaluation for the surgical treatment of medically intractable epilepsy provide a rare opportunity to measure the effects of selective attention directly from human cortex. As part of their treatment, intracranial recordings (electrocorticograms, ECoG) are used to identify the locus of seizure activity or map eloquent cortex. ECoG has certain advantages over EEG (Srinivasan, 1999; Schalk, 2010), including: greater signal-to-noise ratio; greater anatomical detail due to dense electrode coverage and less filtering from extra-cortical structures; and, most critically to the current work, clear separation of ipsi- and contralateral responses. The present work employed ECoG to assess whether auditory attention in a DL task enhances the attended signal or suppresses irrelevant input, and how such effects change as a function of load.
Materials and Methods
Participants and Recording Methods
Data are reported from five patient-volunteers implanted with 8 × 8 electrode arrays over the perisylvian region. All patients read and signed a consent form which had been approved by the University of Wisconsin-Madison Health Sciences Institutional Review Board. Four of these patients underwent surgical treatment for medically intractable epilepsy (P15, P42, P45, and P56), while one patient (P48) was treated for chronic facial pain using cortical electrical stimulation. Seizure onset locations for the four epilepsy patients were generally recorded from sites in the anterior and inferior temporal, inferior frontal, and parietal lobes. Seizure activity was not predominantly located over regions of interest in the current experiment (i.e., postero-superior temporal gyrus/Sylvian fissure).
ECoG was recorded using TDT amplifiers (Tucker-Davis Technologies, Alachua, FL, USA) at a sampling rate of 6 kHz, high-pass filtered (cutoff frequency ∼1.6 Hz) and notch-filtered at 60 Hz, then down-sampled by a factor of 6 before saving to hard disk. All recordings were filtered again off-line (2–35 Hz) using a phase-corrected FIR filter. This added filtering may attenuate slow-wave attention-related negativities such as the processing negativity (PN), but should better isolate relatively higher frequency exogenous responses, such as the N1 peak, which are of interest to the goals of this work. Recordings were made with reference to a ground tied to a single electrode placed in the extra-cranial sub-galeal space over the parietal or frontal lobe. In the present sample, all patients except for P42 had electrodes implanted on the right hemisphere.
The anatomic locations of the implanted electrode grids were schematized by co-registering both intraoperative photographs and pre-operative MRI with a post-implant CT scan (Stealth Station, Medtronic Sofamor Danek, Memphis, TN, USA). In one patient (P45), no pre-operative MRI was available, so photographs for this patient were localized onto a template MRI from a different patient (not analyzed here). Figure 1 presents subject MRIs with mean peak activity between 70 and 120 ms post-stimulus averaged across attend-toward (AT) 800 ms interstimulus-interval (ISI) trials (see below) superimposed on grid locations as contour plots. Stars denote max N90stg (see below) electrode locations used in all further analyses.
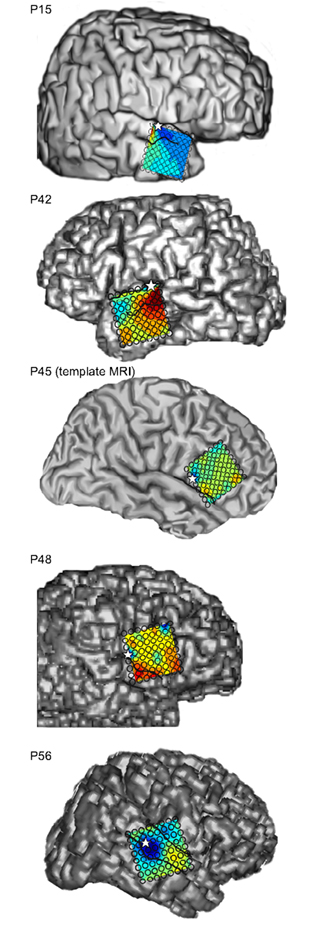
Figure 1. Patient MRIs with mean peak activity between 70 and 120 ms post-stimulus averaged across all attend-toward 800 ms ISI trials (smallest frequency deviants) superimposed on grid locations as contour plots. Color range for all contours was normalized between −15 (blue) and +10 (red) μV. Stars denote electrode locations of maximum negative peak in this time range.
Electrocorticograms were recorded to sequences of 30 ms tone pips presented at varying ISIs, and individual epochs were isolated 100 ms prior and 500 ms subsequent to recorded onset time of each pip. ERPs were then formed by averaging all epochs of the same stimulus/channel type, and across multiple sessions recorded under the same experimental conditions. Data were considered valid and incorporated in ERP averaging and display unless voltage values indicated amplifier blocking. Data from entire trials were also rejected if there was extreme noise in the ECoG or there were no responses to any deviants during attention trials (which may arise due to equipment failure, patient alertness, etc.).
Electrode Selection for Comparison Across Subjects
For comparisons across subjects, we focused our analysis on the single electrode exhibiting the maximum negative peak occurring between 70 and 120 ms post-stimulus in the perisylvian region. Only recordings from the perisylvian region were considered for candidate N90stg electrodes, since responses outside this region may not represent neural sources from known auditory cortical regions (Howard et al. 2000). This latency generally matches that of the traditional scalp N1 deflection, as well as a possible subcomponent of the scalp-recorded N1 which we have previously termed the N90stg (superior temporal gyrus), based on its polarity, latency, and anatomical location (Neelon et al., 2006a). The corresponding positive peak occurring between 120 and 220 ms post-stimulus was similarly labeled the P170stg. Peak latency values (in millisecond post-stimulus) and mean peak values averaged over 20 ms time windows centered on the peaks were used in all statistical analyses. For three of the five patients, the maximal N90stg electrode varied slightly in location across ISI. In order to keep comparisons consistent across ISI, a modal N90stg electrode was determined for each subject by selecting the electrode that most consistently exhibited the maximal N90stg at the three different ISIs for attend trials1.
To further ensure that comparisons across subjects involved similar waveforms, a step-wise k-means cluster analysis was conducted using ERPs averaged from all attend trials at 800 ms recorded from the modal N90stg electrodes from an original pool of seven patients. Eight hundred millisecond ISI trials were chosen because the largest number of trials was collected at this ISI and they may thus provide the most representative measure of auditory response. All patients had grids implanted in the perisylvian region. Samples between 0 and 220 ms post-stimulus (to encompass traditional late evoked-potential peaks) of the contralateral averaged ERPs from each subject’s modal N90stg electrode were run through 1000 iterations of a k-means clustering algorithm which sorted the ERPs into clusters based on Euclidean squared distance from the cluster centroids2. The step-wise grouping process started with a single cluster and incremented number of a priori clusters until there was no improvement in the residual error of the point-to-centroid distances for any clusters (average errors were taken for steps which produced two or more clusters). This process identified two patients whose recorded ERPs produced reliably singleton clusters (outliers), and these patients were excluded from further analysis.
Statistical Analysis
Effects of attention were assessed using a bootstrap statistical test on the grand-average ERP waveforms formed from pooling all epochs recorded from the maximal N90stg electrodes of all patients for each experimental condition at each ISI. Effects were assessed by making pair-wise comparisons between grand-average N90stg and P170stg mean peak values across experimental conditions (see Neelon et al., 2006a for more details on this procedure). Single asterisks denote differences at the p ≤ 0.05 level, and double asterisks denote p ≤ 0.01 level differences (asterisks in parenthesis indicate p ≤ 0.1 level). All tests were two-tailed and uncorrected for multiple comparisons. Similar procedures have been used successfully in previous ERP analyses (Hine and Debener, 2007).
Multiple blocks of data were often recorded on separate days for each patient (range 1–12 days after implant surgery). Depending upon patient willingness and condition, this resulted in unequal numbers of total trials across patients. Data averaging procedures were thus used to weight results equally across patients, rather than by number of epochs.
Stimuli and Experimental Procedure
The task was a standard DL task. Patients were asked to attend to a stream of 100–200 (depending on ISI) 30 ms tone pips presented to one ear over ER-6 insert earphones (Etymotic, Elk Grove Village, IL, USA) between nominal levels of 85 and 95 dB SPL while ignoring a concurrent tone pip stream in the other ear. Ninety percent of the tones in each ear were of a standard frequency, either 1500 Hz (right ear) or 2300 Hz (left ear), while 10% were target tones of between 2 and 10% Hz higher than standard tones, depending on patient performance. The subject’s task was to press a response button when they heard a target tone in the designated ear (see below). For some patients, deviant detection often improved over multiple recording sessions during the seizure monitoring period. In these cases, deviant frequency was reduced to equate performance and preserve attentional load (Lipschutz et al., 2002). All data used here are from trials using the smallest deviant pitch difference for those patients. Only responses to standard tones are analyzed.
Data are analyzed from three experimental conditions: attend-toward, attend-away (AA), and ignore. In AT conditions, ERPs were formed from responses to input to a specified ear while the patient attended to that same ear (e.g., contralateral AT ERPs were formed from inputs presented to the ear contralateral to grid location when the patient attended to that ear, etc.). In AA conditions, ERPs were formed from responses to a specified ear while the patient attended to the opposite ear input. In ignore conditions, ERPs were formed from either contra- or ipsilateral input while the patient read. Figure 2 presents a schematic of the recording arrangement and the labels used for ERP responses in the different experimental conditions.
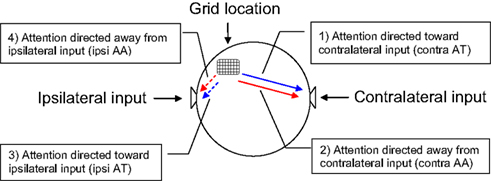
Figure 2. Depiction of the recording and listening arrangement used in the present experiment. “Contralateral” and “ipsilateral” are used relative to electrode array location (“grid”). Grid was located in right hemisphere in four of five patients. Labels for ERPs recorded in the different experimental conditions (clockwise from top right): (1) toward input contralateral to grid location (AT contra ear); (2) away from input contralateral to grid location (AA contra ear); (3) toward input ipsilateral to grid location (AT ipsi ear); and (4) away from input ipsilateral to grid location (AA ipsi ear). Note that conditions 1 and 4, and 2 and 3 are recorded during the same session, respectively. Line color and type used in following ERP plots will accord with the conditions depicted here.
Load was manipulated by increasing the density of the tone streams via decreasing ISIs of 2000, 800, and 400 ms (onset times were randomly jittered around mean ISI). Detecting deviants at a faster presentation rate is a more demanding task and is therefore assumed to increase attentional load (Alho et al., 1999; Jäncke et al., 1999; Lipschutz et al., 2002; Petkov et al., 2004; Rinne et al., 2005; Neelon et al., 2006b).
Performance in the attention task was assessed using percent correct and percent false alarms (FAs). The former measure was calculated by dividing the number of correct responses (a response occurring within 1.5 s after a deviant was presented in the attended ear) by the total number of deviants in the attended ear. A FA was defined as a response occurring outside the 1.5 s response window, and the percent FA rate was that number divided by the number of responses by the subject.
Results
Behavioral Performance
Mean (standard deviation) percent correct performances for the three ISIs averaged across all trials (including both AA and AT conditions) for each patient, and then averaged again across all patients, were as follows: 2000 ms ISI – μ = 66.8% (17.1); 800 ms ISI – μ = 58.7% (25.9); 400 ms ISI – μ = 57.9% (19.7). Mean FA rates were: 2000 ms ISI – μ = 26.2% (26); 800 ms ISI – μ = 23.1% (18.9); 400 ms ISI – μ = 17.3% (25.2). ANOVAs performed on these data were not significant. However, the declines in both percent correct and FA rate suggest that (1) the task became more difficult as presentation rate increased, yet (2) subjects were less susceptible to FAs at faster rates.
Regressing FA rate on the mean peak N90stg differences values (AT–AA peaks) averaged across all sessions at each ISI for all five patients resulted in a significant relationship (p < 0.03), indicating that as the effect of attention increased (reflected in larger AT vs. AA N90stg peak values), patients were better able to ignore distracter deviants and reduced their FAs. However, many sessions across patients resulted in no FAs, which may skew the analysis. A regression of d-prime values on peak N90stg differences, while not significant, produced a slightly negative slope (b = −0.9), suggesting that as d-prime values (perceptual sensitivity) increases, AT peaks become greater (more negative) than AA peaks. Since d-prime also takes into account hit rate, this lack of significance may indicate a complicated relationship between detecting deviants and a traditional measure of attentional effects.
ERP Results
Analyses will focus on the grand-average ERPs formed from all max N90stg electrodes from each patient for each attention condition. Figures 3 and 4 summarize these results in the following manner. Figure 3 presents nine subplots of the grand-averaged ERPs from the N90stg electrodes, averaged across pooled epochs from all experimental conditions from all five patients. Rows from top to bottom plot results for 2000, 800, and 400 ms ISI conditions, respectively; columns from left to right respectively plot results for the ignore conditions, responses to contralateral input under attention conditions, and responses to ipsilateral input under attention conditions. For all subplots in Figure 3: horizontal gray lines represent 99% confidence interval based on the 100 ms pre-stimulus baseline; solid vertical black lines indicate 0 ms; and dotted vertical black lines indicate 100 ms post-stimulus. The three solid horizontal black lines spanning across figure columns indicate contralateral ignore N90stg peaks for the three different ISIs, while dashed horizontal lines indicate ipsilateral ignore N90stg peaks. Stars indicate significant differences between N90stg and P170stg mean peak values only for the two ERPs displayed in each subplot. For simplification, Figure 4 presents in a similar layout only the mean peak N90stg values from the corresponding conditions presented in Figure 3, and compares the N90stg peak from each attention condition to the ignore N90stg peak values.
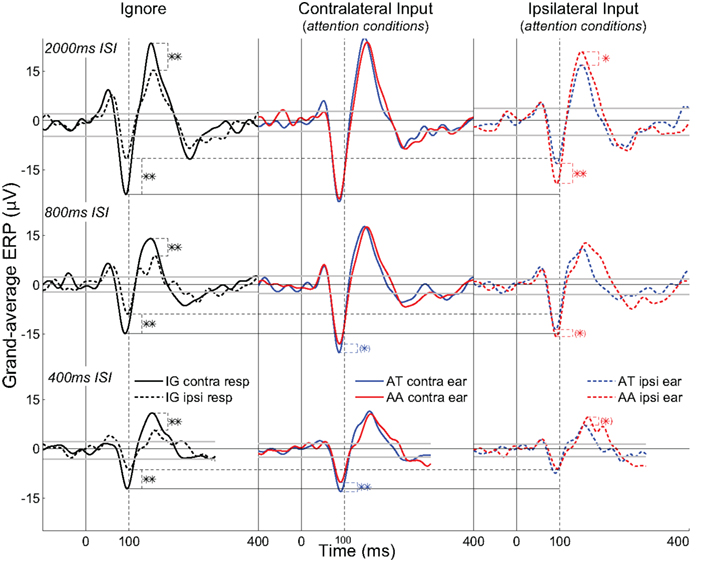
Figure 3. Subplots of the grand-averaged ERPs from the N90stg electrodes, averaged across pooled epochs from all experimental conditions from all five patients. Three rows from top to bottom plot results for 2000, 800, and 400 ms ISI conditions, respectively; three columns from left to right respectively plot results for the ignore conditions, responses to contralateral input under attention conditions, and responses to ipsilateral input under attention conditions. Gray lines represent 99% confidence interval based on the 100 ms pre-stimulus baseline. The three solid horizontal black lines spanning across figure columns indicate contralateral ignore N90stg peaks for the three different ISIs, while dashed horizontal lines indicate ipsilateral ignore N90stg peaks. Stars indicate significant differences between N90stg and P170stg mean peak values only for the two ERPs displayed in each subplot (parentheses: p ≤ 0.1; single: p ≤ 0.05; double: p ≤ 0.01; two-tailed, uncorrected for multiple comparisons).
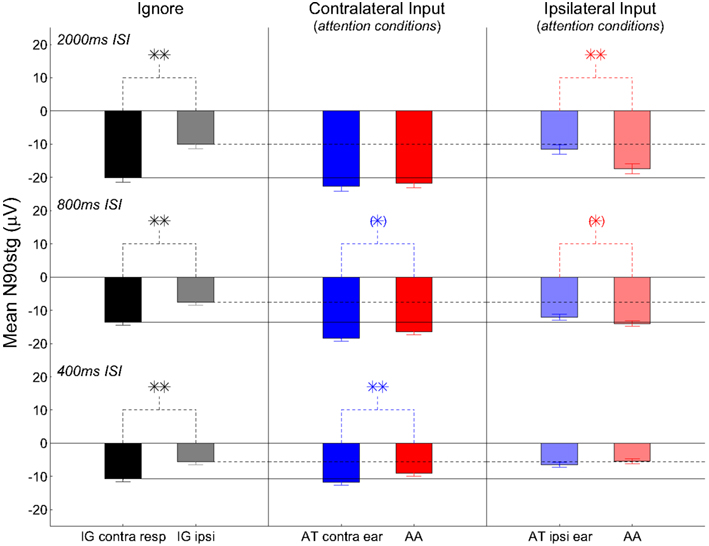
Figure 4. Bar plots of the mean N90stg values averaged across pooled epochs from all experimental conditions from all five patients. Figure layout, figure-spanning horizontal black lines (ignore N90stg values), and statistical values (stars) match those used in Figure 3. Stars above plots indicate significant differences between mean N90stg values only for the two ERPs displayed in each subplot. Any significant differences between attention conditions indicated by bar values and the ignore N90stg values indicated by the horizontal lines are not shown; see text for discussion of such differences.
Contra- vs. Ipsilateral Ignore ERPs
Column 1 of Figure 3 presents data from the ignore conditions and shows a general decrease in ERP magnitude at faster presentation rates, in line with the well-known refractoriness of the auditory ERP (Näätänen, 1992). The solid black curve is the ERP to the input contralateral to grid location, while the dashed black curve is the ipsilateral ERP. Significantly smaller and delayed peaks occur in the ipsilateral ERP starting at about 50 ms post-stimulus and continuing through the P170stg time window (for clarity, only differences in magnitudes of N90stg and P170stg peaks are denoted by asterisks). At first glance, these results appear consistent with a view that the earliest responses to auditory input (as embodied in mid-latency and earlier components) are mostly equivalent across hemispheres, regardless of ear of presentation, due to brainstem afferent pathways, while later differences indicate the possible contributions of callosal crossings (Lee et al., 1984). However, present differences in grand-average peak latencies across individual patients and experimental conditions (Table 1) are not as large as has been reported in previous EEG and MEG studies (Majkowski et al., 1971; Mäkelä, 1988; Gabriel et al., 2004; Hine and Debener, 2007). This discrepancy may be due to differences in recording methodologies, experimental conditions, stimuli used, and, perhaps most crucially, subject characteristics such as age (Aboitiz et al., 2003). Given that the purpose of this work is to assess the effects of selective attention, there will be no further discussion of baseline differences in the contra- vs. ipsilateral responses.
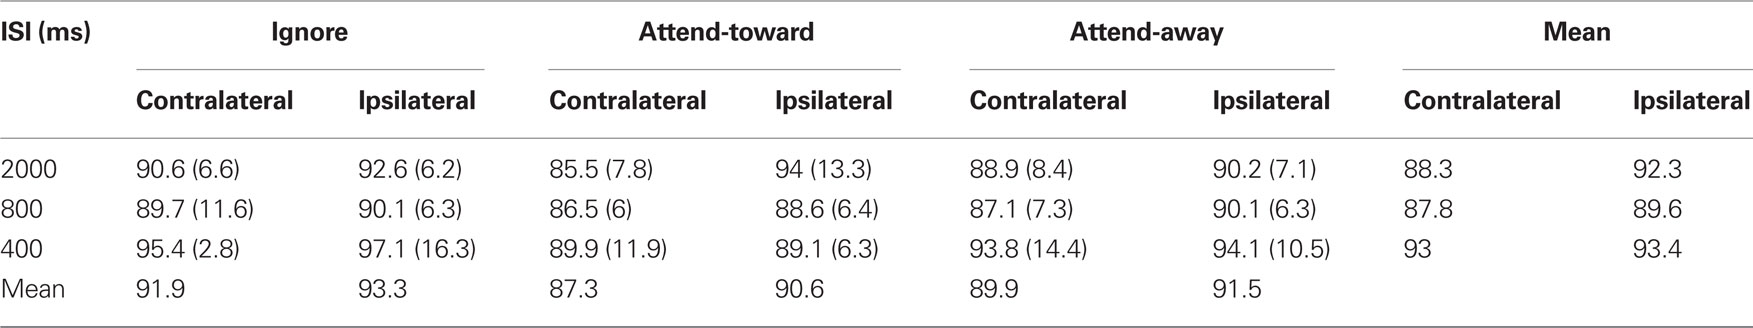
Table 1. Mean latencies (SD) in milliseconds of N90stg peaks averaged across channel and attention condition for all patients.
Contralateral Attend-Toward, Attend-Away, and Ignore ERPs
Column 2 of Figure 3 displays ERPs to inputs contralateral to grid location (hereafter, “contralateral”) for both AT (blue solid line) and AA (red solid line) conditions. As noted earlier, there are two ways to measure the effects of attention: as differences in responses measured from the same site under different attention conditions (e.g., attend toward then away from contralateral ear); or as concurrent responses from the same site to contra- and ipsilateral inputs during a single attention condition (i.e., during the same recording session). The former method constitutes the standard approach in selective attention ERP paradigms, while the latter may be measured by the improved lateral isolation of intracranial recordings.
Column 2 of Figure 3 displays the traditional measure of attentional effects. Of immediate note is the increasing difference between the N90stg of the two waveforms as ISI decreases. This finding is consistent with previously reported results that attentional effects on contralateral ERPs increase with increasing perceptual load as implemented via faster stimulus presentation rates and less discriminable stimuli (Schwent et al., 1976; Hackley et al., 1990; Alho et al., 1999; Lipschutz et al., 2002; Petkov et al., 2004; Rinne et al., 2005; Neelon et al., 2006b; Woods et al., 2009).
Statistical analyses show no consistent increase in the contralateral ERPs during attention (either AT or AA) over the contralateral ignore ERPs as indicated by the horizontal black lines spanning the figure columns (see Figure 4). Only at 800 ms ISI are both the contralateral AT and AA ERP peaks (both N90stg and P170stg) significantly larger than the respective contralateral ignore ERP peaks (all p ≤ 0.01, except contra AA N90stg – p ≤ 0.05). At 400 ms ISI, this significant enhancement over the contra ignore disappears, suggesting that selective attention to auditory channel only slightly enhances responses to contralateral input above baseline. These trends suggest that, for contralateral inputs, attention does not generally enhance inputs significantly over ignore conditions.
Ipsilateral Attend-Toward and Attend-Away ERPs
Column 3 of Figure 3 shows the ERPs to inputs ipsilateral to grid location (hereafter, “ipsilateral”) during the attention conditions. Note that the ipsilateral AA condition (red dashed line) was recorded during the same session as the contralateral AT condition (blue solid line), only the former is the response to concurrent input from the ear ipsilateral to the electrode array. The present intracranial recording method provides a rare opportunity to analyze what happens to concurrent distracters presented in the ipsilateral channel during a selective attention task.
The analysis above noted the small enhancement of contralateral responses during attention over ignore conditions. However, one striking result in the present data is the generally strong enhancement of the ipsilateral ERPs at slower ISIs over their ipsilateral ignore counterpart (2000 ms ISI: ipsilateral AA N90stg > ipsilateral ignore N90stg – p ≤ 0.01; 800 ms ISI: ipsilateral AT and AA N90stg > ipsilateral ignore N90stg – p ≤ 0.01). If there were no enhancement of responses to ipsilateral inputs due to auditory attention, both ipsilateral attend N90stg peaks should be equal to the black dashed line indicating the ipsilateral ignore N90stg peak value. In point of fact, the enhancement of the ipsilateral AA at 2000 and 800 ms ISI is so large that there is generally no significant difference in the magnitude between the ipsilateral attend N90stg peaks and the contralateral ignore peaks (only the 2000 ms ipsilateral AT N90stg is significantly smaller than the contralateral ignore N90stg). However, by 400 ms there appears to be a reversal in these attention effects: the ipsilateral ERPs are now on par with the ipsilateral ignore ERP, while the contralateral ERPs show the largest differences due to attention. There no longer appears to be any enhancement of ipsilateral N90stg responses, even when subjects are actively attending to ipsilateral signals. The effect of attention at this fast presentation rate appears to be mainly the suppression of non-target inputs.
It initially appears that the trends across ISI in the ERP differences between the ipsilateral attention conditions are exactly opposite of those seen in the contralateral attention conditions: at 2000 ms ISI, there is a “reverse” attention effect in which the ipsilateral N90stg AA peak is much larger than the ipsilateral AT peak, even as there is no difference between contralateral peaks; as ISI decreases, this difference disappears, while it simultaneously emerges in the contralateral ERPs. However, a more consistent explanation may be that at relatively slow presentation rates, attention appears to have a generally enhancing effect on auditory responses regardless of input channel or the focus of attention. It is possible that at these slow rates attention is exogenously drawn to input from both ears, resulting in enhanced responses to all input regardless of pathway. This overall enhancement appears most consistently at 800 ms ISI in which no ipsilateral N90stg peaks differ significantly from contralateral N90stg ignore peaks, and the contralateral AT and AA N90stg peaks are also their largest relative to the contralateral ignore N90stg. Only the 2000 ms ipsilateral AT ERP does not fit this trend; further data are needed to assess the consistency of this result. Despite this, the enhancement of the ipsilateral ERPs at slow rates suggests a broad, “vigilant” form of attention3.
Change in Enhancement vs. Suppression as a Function of Attentional Load
Figure 5 presents a scatterplot of changes across ISI (color saturation) in the log ratio of contralateral AT (y-axis) and ipsilateral AA (x-axis) N90stg peaks for each patient to both (1) their ignore (open blue squares) and attention (open red circles) N90stg counterparts (filled symbols are mean values across patients; lines are the maximal principal components for the two groups of scatter). For example, changes along the y-axis represent log values of contralateral AT N90stg peaks divided by both contralateral ignore N90stg values (blue) and contralateral AA N90stg peak values (red; x-axis values represent the respective values for the ipsilateral AA N90stg peaks). This figure is modeled on one from Boudreau et al. (2006) to analyze whether the effects of attention produce a general enhancement of neural responses, or, as task conditions become more demanding, suppress neural responses to non-target stimuli.
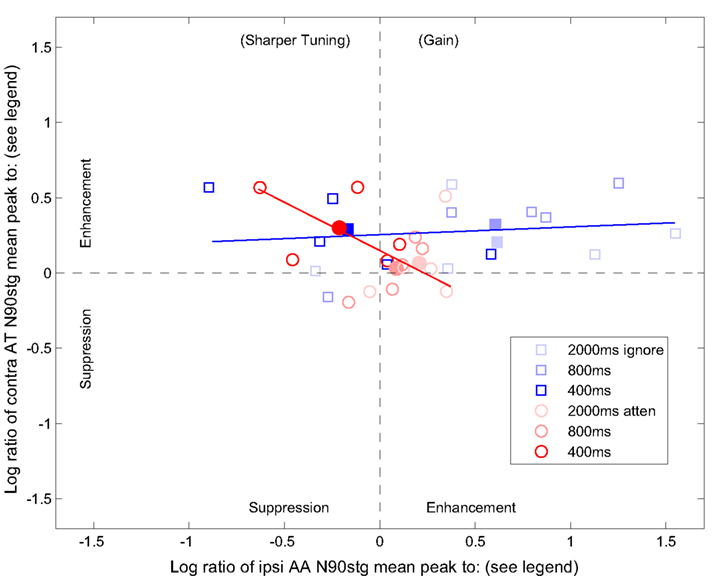
Figure 5. Changes across ISI (color saturation) in the log ratio of contralateral AT (y-axis) and ipsilateral AA (x-axis) N90stg peaks for each patient to both 1) their ignore (open blue squares) and attention (open red circles) N90stg counterparts. Filled symbols are mean values across patients; lines are the maximal principal components for the two groups of scatter. See text for more details on figure interpretation.
The axes can be divided in halves to represent the enhancing or suppressing effects of attention: values above 0 indicate the contralateral AT and ipsilateral AA N90stg are larger (enhancement) relative to their comparisons in the denominator, while values below 0 indicate they are smaller (suppression). The figure can be further divided into quadrants: the upper right quadrant represents enhancement of signals when attention is employed (e.g., target contralateral inputs or concurrent distracter ipsilateral inputs, both relative to ignore peaks, etc.), and is labeled “Gain” to represent a general enhancing (vigilance) effect of attention; the upper left quadrant represents enhancement of the contralateral target responses with simultaneous suppression of AA conditions and concurrent ipsilateral, non-target responses, which can result from narrower response profiles and is thus labeled “Sharper Tuning”; the lower left quadrant indicates suppression of all relevant ERP values to stimuli, which should only occur with gross changes in consciousness or pathological conditions; finally, large values in the lower right quadrant should only occur when target responses are suppressed and distracter responses are simultaneously enhanced, a situation only expected to occur if the listener disobeyed task instructions and always actively attended to the wrong ear (i.e., analogous to a negative d-prime value).
Considering first the comparisons to ignore values (blue), the flat slope and positive y-intercept of the principal component line indicate that most of the change relative to ignore N90stg peaks occurs in the ipsilateral response. This figure shows that much of the enhancement due to attention (at slow rates) occurs in responses to non-targets and provides further support of a general enhancement (vigilance) model of attention which monitors all inputs at low loads, regardless of channel. This enhancement diminishes relative to the ignore N90stg by 400 ms ISI, and even becomes suppressed for some patients (see Boudreau et al., 2006 for similar individual differences in amount and type of attentional effects). At the same time, the trend along the y-axis indicates some residual enhancement of the contralateral AT N90stg relative to the contralateral ignore N90stg at higher loads (400 ms ISI). Because the movement of both the circles and squares as ISI decreases (i.e., as datapoint color becomes more saturated) is toward the upper left quadrant, the goal of selective attention at high loads appears to be to preserve target signal enhancement (in contralateral AT peaks) while simultaneously maximizing suppression of distracter responses (in ipsilateral AA peaks). This pattern typifies sharpened tuning of neural responses to targets.
Another source of evidence for increased sharper tuning as load increases is seen in the red circles. Positive y-values (log ratio of contralateral AT to AA N90stg values) represent typical findings in dichotic listening EEG studies in which the ERP is enhanced when attending toward the target ear relative to the attending away to the other ear. These values replicate the general growth of the typical selective auditory attention effect seen in column 2 of Figure 3 as ISI decreases. In summary, at the highest levels of load, attention operates by maximizing differences between target and non-target responses, mostly through suppression of the latter.
Discussion
Effect of Low Load on Auditory Selective Attention
A continued debate in the literature on the physiological effects of selective attention argues whether responses to target inputs are enhanced over baseline or non-target levels, or if non-targets and distracters are suppressed by selective attention, possibly as a result of sharper tuning of physiological responses to targets. (Moran and Desimone, 1985; Rees et al., 1997; Jäncke et al., 1999; Treue and Martínez Trujillo, 1999; Maunsell and Cook, 2002; Kastner, 2004; Murray and Wojciulik, 2004; Lavie, 2005; Fritz et al., 2007a; Kauramäki et al., 2007; Okamoto et al., 2007). The present results support an “elastic” model of attention in which both effects can occur as a function of task demands and cognitive load.
Electrocorticograms recorded during a simple DL task in the present experiment show that the focus and outcome of selective auditory attention changes with different levels of attentional load. At putatively low-load levels in which stimuli are presented at slow rates (2000 ms and extending to 800 ms ISI), attention operates by generally enhancing responses to auditory input regardless of channel. The data generally show both targets and non-targets are enhanced during low-load attention conditions. For the present DL task, this takes the form of enhancing both contralateral target inputs and concurrent ipsilateral distracter inputs over control conditions in which all auditory stimuli were ignored (reading a book).
Selectively ignored channels (i.e., both contra- and ipsilateral “attend-away” responses) do not appear to be suppressed under low-load conditions most likely due to automatic bottom-up processing of inputs. Lavie (2001, 2005) argues that at slow stimulus rates, distracters are automatically processed but not acted on due to response inhibition. One prediction of this model is that listeners in long duration vigilance tasks who experience declines in behavioral performance (Parasuraman, 1998) should show increased FAs as they fail to inhibit responses to automatically processed non-targets. In support of this explanation, mean FAs responses during the target-detection DL task were largest at 2000 ms and decreased with decreasing ISI, suggesting that listeners were not tuning out the concurrent distracter channel in the former condition. Furthermore, as noted earlier, there was a significant relationship between FAs and the magnitude of the contralateral AT N90stg peak enhancement over the AA N90stg peak. This indicates that increased attention at high loads improved listeners’ ability to ignore distracters. Similar declines in FAs as task demands increase (i.e., at 400 ms ISI) have been previously reported in multimodal attention tasks (Weissman et al., 2004).
More importantly, listeners automatically processing both contra- and ipsilateral streams should produce an overall enhancement of both ERPs, even though the subject is only reporting targets to the contralateral ear. As Lavie (2005) notes, “…[A] significant neural response to irrelevant stimuli should be found despite the subject’s efforts to ignore them, provided the perceptual load of the relevant task is low.” The present general enhancement of auditory ERPs regardless of input channel conforms to this view of attention under low-load conditions (O’Leary et al., 1997; Voisin et al., 2006).
Effect of High Load on Auditory Selective Attention
In conditions of greater load (i.e., 400 ms ISI), the response to non-optimal input (here, ipsilateral inputs either attended to or away from) returns to baseline ignore levels, while the response enhancement to optimal (contralateral) targets is preserved. Recall that the contralateral AA responses are the concurrent distracter non-targets to the ipsilateral AT condition. Hence, if the patterns described above hold, then at high loads we might expect to see suppression of the contralateral AA responses below contralateral ignore responses. While the contralateral AA N90stg peak is not significantly different than the contralateral ignore N90stg peak, it is significantly suppressed relative to the contralateral AT N90stg peak at 400 ms ISI. Since the latter peak is no longer significantly enhanced over its ignore counterpart, the goal of attention may be to suppress all distracters (both concurrent and across different conditions) while attempting to maintain as strong a target input signal as occurs during low-load conditions.
These results describe an elastic model of attention in which general enhancement gives way to an increased sharpening of neural responses as load increases, and conform to previous models which postulate changes in attentional scope and magnitude with increasing effort (Rees et al., 1997; Kastner, 2004; Lavie, 2005). In a visual fMRI study, Pinsk et al. (2004) proposed a “push–pull” mechanism of attention to explain how target-related activity increased and distracter-related activity decreased as a function of attentional load in intermediate visual cortex (e.g., V4). Boudreau et al. (2006) reported single-cell data from behaving monkeys also supporting a similarly hierarchical and elastic form of attention. The authors further found that the sharpened response tuning at high loads (increased target with simultaneous decreased non-target responses) did not occur for all animals, indicating that behavioral strategy may determine when individuals exhibit vigilance vs. sharpened tuning effects. In a related, but slightly different account, Lavie (2001, 2005) argues that at high loads, target input fills perceptual/attentional “capacity,” leaving no resources left for processing of non-targets. Further evidence for such a flexible effect of attention as a function of load has been reported in the behavioral DL literature, in which difficult task conditions result in both suppression of distracters and enhancement of targets (Asbjørnsen and Hugdahl, 1995; Hugdahl, 1995).
Binaural and Callosal Mechanisms Underlying the Elastic Scope of Attention
As noted earlier, elastic effects of visual attention have been reported for intermediate rather than primary stages of visual cortex (Pinsk et al., 2004). Auditory regions (e.g., parabelt) moving laterally toward the surface of the superior temporal gyrus may represent analogous intermediate auditory processing stages (Kaas et al., 1999; Romanski et al., 1999). Given the grid locations in the present data, the enhanced ERP components reported here most likely reflect enhanced cortical activity outside of primary auditory cortex (A1), as has been reported in previous auditory attention studies (Woldorff et al., 1993; Tzourio et al., 1997; Hall et al., 2000; Petkov et al., 2004; Woods et al., 2009). In particular, the N90stg is a possible intracranial homolog of the main auditory N1 subcomponent, N1b, thought to arise from non-primary regions on the superior temporal plane (Picton et al., 1999; Godey et al., 2001); hence, the effects of attention on the N90stg reported here suggest changes in the scope of auditory attention can similarly occur in secondary auditory cortex. Nonetheless, the lack of recording sites in primary areas such as Heschl’s gyrus does not rule out the possibility that attention modulated earlier auditory cortical stages in the present task (Jäncke et al., 1999; Fritz et al., 2007b).
Two possible lines of (not mutually exclusive) evidence may provide physiological explanations of the elastic effects of attention reported here. One account is that, depending on task, attention differentially activates neural sub-populations in auditory cortex which vary in their spatial/channel response preferences. Recent evidence has shown that different auditory tasks (e.g., vigilance vs. discrimination) can result in changes in neural response profiles from overall enhancement to more selective tuning, demonstrating short-term plasticity of the auditory system to fit current task demands (Schnupp and Kacelnik, 2002; Ohl and Scheich, 2005; Fritz et al., 2007b). Most relevant is a report of cells in cat posterior auditory fields which narrow their spatial response tuning based on increased task demands (Lee et al., 2007). One explanation of the data reported here is that, for a listener in vigilance mode (e.g., at low-load levels), attention modulates a cortical population of auditory cells of varying binaural preferences (Clarey et al., 1992) to recruit more units to respond to both contra- and ipsilateral stimuli [e.g., cells with binaural response types of contralateral excitatory (EO), contra- and ipsilateral excitatory (EE), etc.]. This would result in overall enhanced responses to both contra- and ipsilateral inputs in low-load conditions. As task demands increased with faster presentation rate, attention would then dynamically shift the activity profile across the population to maximize responses to contralateral targets (preserve EO contribution; increase EI contribution, etc.) while minimizing responses to ipsilateral distracters (reduce EE or IE activity, etc.).
This explanation does not preclude the contribution of another process of auditory attention which has been proposed to explain laterality differences in traditional speech DL tasks. Hugdahl and colleagues (Hugdahl, 2003; Westerhausen et al., 2006; Westerhausen and Hugdahl, 2008) have argued that attention may influence DL by modulating interhemispheric transfer of signals across different fibers of the corpus callosum. In particular, larger and faster posterior fibers may be more involved in bottom-up signal transfer cross-callosally, while smaller, slower anterior fibers may modulate interhemispheric transfer as a function of cognitive demands such as attention. Generally, these models propose an enhancing rather than suppressive effect of callosal signal transfer in attention conditions, which would not explain the present asymmetry in attentional scope in which suppression of non-targets appears overall greater than enhancement of targets (i.e., Figure 5 shows the most change along the x-axis, not y-axis). However, a similar asymmetry of larger attentional modulations for ipsi- vs. contralateral stimuli has also been recently reported by Woods et al. (2009).
Nonetheless, there is evidence that callosal fibers may act as attention-gating mechanisms to inhibit input coming from the opposite ear. As evidence for this inhibitory callosal role of attention, callosal-lesioned or resected patients show elevated traditional ear advantages for speech, and no effects from attention directed to either ear in modulating this asymmetry (Pollmann et al., 2002; Westerhausen and Hugdahl, 2008). Epilepsy patients may also experience changes in auditory cortex curtailing normal, inhibitory processes used in suppressing irrelevant stimuli (Gramstad et al., 2006). In particular, Bougeard and Fischer (2002) reported increased ipsilateral N1s in epileptics after temporal lobectomy, suggesting a potentially inhibitory function of contralateral hemisphere on ipsilateral inputs. Callosal afferents are generally excitatory, but can terminate onto inhibitory contralateral interneurons (Saron et al., 2003; Bamiou et al., 2007), which may provide a mechanism for callosal inhibition. Finally, the corpus callosum also plays an important role in forming the aforementioned population of binaural response types in mammalian auditory cortex (Clarey et al., 1992).
Taken together, inhibitory callosal signals shaping the responses of binaural cells in opposing auditory cortex may explain how the responses to concurrent ipsilateral distracters becomes increasingly suppressed as attention becomes more focused at higher perceptual loads. These models provide a mechanism for increased inhibition of the opposite auditory cortex as attentional resources are marshaled toward one hemisphere in a demanding DL task4. In particular, as attention increases focus to contralateral targets via increased activation in contralateral auditory cortex, it suppresses ipsilateral inputs by a combination of: (1) increasing the effect of inhibitory interneurons synapsing with callosal afferents; (2) increasing the contribution of the smaller, anterior commissure fibers; and/or (3) suppressing activity of EE/IE cells (which may itself be achieved by increasing activity of the aforementioned inhibitory interneurons). Such a model could explain the “elastic” effect of attention in which there is a general enhancement of target and non-target signals in low-load vigilance modes, transforming to suppression of both unattended contralateral and all ipsilateral ERPs relative to target contralateral ERPs as attentional load increases.
Caveats of Testing a Clinical Population
Due to the clinical nature of the participants in this study, comparisons between the present results and those from traditional EEG attention studies must always be viewed with caution. The fundamental dilemma posed by studying epilepsy surgery patients is that they provide a rare opportunity to measure responses directly from human cortex, yet the very reason that such recordings are possible question whether they are comparable to a normal population. We believe that these data can be reliably compared to previous scalp EEG in healthy subjects for several reasons. First, during seizure monitoring, patients were weaned off common anti-convulsant medications for clinical purposes, and this weaning, coupled with testing over multiple days, should result in more typical cortical responses. Second, out of respect for patient comfort, we did not test patients during periods of distracting pain and/or after heavy pain medication. We also have no record of seizures occurring immediately after testing, and made an attempt to avoid testing for several hours (or the next day, depending upon patient wishes) after seizure events.
Finally, we described in some detail in the Methods section the criteria for data inclusion in the study. Many patients who originally participated in these procedures for us did not produce measurable or reliable ERP responses to acoustic input, and thus were excluded from further analyses. We also employed a non-parametric clustering algorithm to further exclude patients with measurable but anomalous ERPs. We believe that these excluded patients are the least representative subjects and that our inclusion criteria resulted in data which are comparable to scalp EEG recordings in similar tasks.
Conflict of Interest Statement
The authors declare that the research was conducted in the absence of any commercial or financial relationships that could be construed as a potential conflict of interest.
Footnotes
- ^P48 400 ms ISI ERP did not exhibit two peaks between 70 and 220 ms post-stimulus above the 99% confidence interval formed from the pre-stimulus baseline; hence, an adjacent electrode (6) that did meet this criterion was substituted for P48’s 400 ms ISI data.
- ^Due to the random, iterative nature of the k-means algorithm, variations in cluster membership and final distance errors can vary based upon initial conditions. Multiple replications were thus used to find the clusters with the smallest total summed error of each exemplar from the cluster centroid over multiple re-starts of the algorithm.
- ^Many of the trends reported in the N90stg peaks also hold for the P170stg peaks, which will not be discussed further.
- ^This presumes a “fixed-resource” model of attention (Boudreau et al., 2006).
References
Aboitiz, F., Ide, A., and Olivares, R. (2003). “Corpus callosum morphology in relation to cerebral asymmetries in the postmortem human,” in The Parallel Brain: The Cognitive Neuroscience of the Corpus Callosum, eds E. Zaidel and M. Iacoboni (Cambridge, MA: The MIT Press), 33–46.
Alho, K., Medvedev, S. V., Pakhomov, S. V., Roudas, M. S., Tervaniemi, M., Reinikainen, K., Zeffiro, T., and Näätänen, R. (1999). Selective tuning of the left and right auditory cortices during spatially directed attention. Cogn. Brain Res. 7, 335–341.
Alho, K., Teder, W., Lavikainen, J., and Näätänen, R. (1994). Strongly focused attention and auditory event-related potentials. Biol. Psychol. 38, 73–90.
Asbjørnsen, A. E., and Hugdahl, K. (1995). Attentional effects in dichotic listening. Brain Lang. 49, 189–201.
Bamiou, D. E., Sisodiya, S., Musiek, F. E., and Luxon, L. M. (2007). The role of the interhemispheric pathway in hearing. Brain Res. Rev. 56, 170–182.
Boudreau, C. E., Williford, T. H., and Maunsell, J. H. R. (2006). Effects of task difficulty and target likelihood in area V4 of macaque monkeys. J. Neurophysiol. 96, 2377–2387.
Bougeard, R., and Fischer, C. (2002). The role of the temporal lobe in auditory processing. Epileptic Disord. 4, 29–32.
Clarey, J. C., Barone, P., and Imig, T. J. (1992). “Physiology of thalamus and cortex,” in The Mammalian Auditory Pathway: Neurophysiology, eds A. N. Popperand and R. R. Fay (New York: Springer-Verlag), 232–334.
Connolly, J. F. (1993). The influence of stimulus intensity, contralateral masking and handedness on the temporal N1 and the T complex components of the auditory N1 wave. Electroencephalogr. Clin. Neurophysiol. 86, 58–68.
Fritz, J. B., Elhilali, M., David, S. V., and Shamma, S. A. (2007a). Auditory attention – focusing the searchlight on sound. Curr. Opin. Neurobiol. 17, 437–455.
Fritz, J. B., Elhilali, M., David, S. V., and Shamma, S. A. (2007b). Does attention play a role in dynamic receptive field adaptation to changing acoustic salience in A1? Hear. Res. 229, 186–203.
Gabriel, D., Veuillet, E., Ragot, R., Schwartz, D., Ducorps, A., Norena, A., Durrant, J. D., Bonmartin, A., Cotton, F., and Collet, L. (2004). Effect of stimulus frequency and stimulation site on the N1m response of the human auditory cortex. Hear. Res. 197, 55–64.
Godey, B., Schwartz, D., de Graaf, J. B., Chauvel, P., and Liégeois-Chauvel, C. (2001). Neuromagnetic source localization of auditory evoked fields and intracerebral evoked potentials: a comparison of data in the same patients. Clin. Neurophysiol. 112, 1850–1859.
Gramstad, A., Engelsen, B. A., and Hugdahl, K. (2006). Dichotic listening with forced attention in patients with temporal lobe epilepsy: significance of left hemisphere cognitive dysfunction. Scand. J. Psychol. 47, 163–170.
Hackley, S. A., Woldorff, M., and Hillyard, S. A. (1990). Cross-modal selective attention effects on retinal, myogenic, brainstem, and cerebral evoked potentials. Psychophysiology 27, 195–208.
Hall, D. A., Haggard, M. P., Akeroyd, M. A., Summerfield, A. Q., Palmer, A. R., Elliott, M. R., and Bowtell, R. W. (2000). Modulation and task effects in auditory processing measured using fMRI. Hum. Brain Mapp. 10, 107–119.
Hillyard, S. A., Hink, R. F., Schwent, V. L., and Picton, T. W. (1973). Electrical signs of selective attention in the human brain. Science 182, 177–180.
Hine, J., and Debener, S. (2007). Late auditory evoked potentials asymmetry revisited. Clin. Neurophysiol. 118, 1274–1285.
Howard, M. A., Volkov, I. O., Mirsky, R., Garell, P. C., Noh, M. D., Granner, M., Damasio, H., Steinschneider, M., Reale, R. A., Hind, J. E., and Brugge, J. F. (2000). Auditory cortex on the human posterior superior temporal gyrus. J. Comp. Neurol. 416, 79–92.
Hugdahl, K. (1995). “Dichotic listening: probing temporal lobe functional integrity,” in Brain Asymmetry, eds R. J. Davidson and K. Hugdahl (Cambridge, MA: The MIT Press), 123–156.
Hugdahl, K. (2003). “Attentional modulation of interhemispheric transfer: a two-channel threshold model,” in The Parallel Brain: The Cognitive Neuroscience of the Corpus Callosum, eds E. Zaidel and M. Iacoboni (Cambridge, MA: The MIT Press), 307–318.
Jäncke, L., Mirzazade, S., and Shah, N. J. (1999). Attention modulates activity in the primary and the secondary auditory cortex: a functional magnetic resonance imaging study in human subjects. Neurosci. Lett. 266, 125–128.
Kaas, J. H., Hackett, T. A., and Tramo, M. J. (1999). Auditory processing in primate cerebral cortex. Curr. Opin. Neurobiol. 9, 164–170.
Kastner, S. (2004). “Towards a neural basis of human visual attention: evidence from functional brain imaging,” in Attention and Performance, Vol. XX: Functional Neuroimaging of Visual Cognition, eds N. Kanwisher and J. Duncan (New York: Oxford University Press), 301–320.
Kauramäki, J., Jääskeläinen, I. P., and Sams, M. (2007). Selective attention increases both gain and feature selectivity of the human auditory cortex. PLoS ONE 9, 1–10. doi: 10.1371/journal.pone.0000909
Lavie, N. (2001). “Capacity limits in selective attention: behavioral evidence and implications for neural activity,” in Visual Attention and Cortical Circuits, eds J. Braun and C. Koch (Cambridge, MA: The MIT Press), 49–68.
Lavie, N. (2005). Distracted and confused?: selective attention under load. Trends Cogn. Sci. 9, 75–82.
Lee, C. C., Macpherson, E., Harrington, I., and Middlebrooks, J. (2007). Task-dependence of spatial sensitivity in the dorsal zone (area DZ) of cat auditory cortex. Soc. Neuorsci. Abstr. #873.
Lee, Y. S., Lueders, H., Dinner, D. S., Lesser, R. P., Hahn, J., and Klem, G. (1984). Recording of auditory evoked potentials from man using chronic subdural electrodes. Brain 107, 115–131.
Lipschutz, B., Kolinsky, R., Damhaut, P., Wikler, D., and Goldman, S. (2002). Attention-dependent changes of activation and connectivity in dichotic listening. Neuroimage 17, 643–656.
Majkowski, J., Bochenek, Z., Bochenek, W., Knapik-Faulkowska, D., and Kopec, J. (1971). Latency of averaged evoked potentials to contralateral and ipsilateral auditory stimulation in normal subjects. Brain Res. 25, 416–419.
Mäkelä, J. P. (1988). Contra- and ipsilateral auditory stimuli produce different activation patterns at the human auditory cortex: a neuromagnetic study. Eur. J. Physiol. 412, 12–16.
Maunsell, J. H. R., and Cook, E. P. (2002). The role of attention in visual processing. Philos. Trans. R. Soc. Lond. B Biol. Sci. 357, 1063–1072.
Moran, J., and Desimone, R. (1985). Selective attention gates visual processing in the extrastriate cortex. Science 229, 782–784.
Murray, S. O., and Wojciulik, E. (2004). Attention increases neural selectivity in the human lateral occipital complex. Nat. Neurosci. 7, 70–74.
Neelon, M. F., Williams, J., and Garell, P. C. (2006a). The effects of auditory attention measured from human electrocorticograms. Clin. Neurophysiol. 117, 504–521.
Neelon, M. F., Williams, J., and Garell, P. C. (2006b). The effects of attentional load on auditory ERPs recorded from human cortex. Brain Res. 1118, 94–105.
Ohl, F. W., and Scheich, H. (2005). Learning-induced plasticity in animal and human auditory cortex. Curr. Opin. Neurobiol. 15, 470–477.
Okamoto, H., Stracke, H., Wolters, C. H., Schmael, F., and Pantev, C. (2007). Attention improves population-level frequency tuning in human auditory cortex. J. Neurosci. 27, 10383–10390.
O’Leary, D. S., Andreasen, N. C., Hurtig, R. R., Torres, I. J., Flashman, L. A., Kesler, M. L., Arndt, S. V., Cizadlo, T. J., Ponto, L. L. B., Watkins, G. L., and Hichwa, R. D. (1997). Auditory and visual attention assessed with PET. Hum. Brain Mapp. 5, 422–436.
Parasuraman, R. (1998). “The attentive brain: issues and prospects,” in The Attentive Brain, ed. R. Parasuraman (Cambridge, MA: The MIT Press), 3–17.
Petkov, C., Kang, X., Alho, K., Bertrand, O., Yund, E. W., and Woods, D. (2004). Attentional modulation of human auditory cortex. Nat. Neurosci. 7, 658–663.
Picton, T. W., Alain, C., Woods, D. L., John, M. S., Scherg, M., Valdes-Sosa, P., Bosch-Bayard, J., and Trujilo, N. J. (1999). Intracerebral sources of human auditory-evoked potentials. Audiol. Neurootol. 4, 64–79.
Pinsk, M. A., Doniger, G. M., and Kastner, S. (2004). Push–pull mechanism of selective attention in human extrastriate cortex. J. Neurophysiol. 92, 622–629.
Pollmann, S., Maertens, M., Yves von Cramon, D., Lepsien, J., and Hugdahl, K. (2002). Dichotic listening in patients with splenial and nonsplenial callosal lesions. Neuropsychology 16, 56–64.
Rees, G., Frith, C. D., and Lavie, N. (1997). Modulating irrelevant motion perception by varying attentional load in an unrelated task. Science 278, 1616–1619.
Rinne, T., Pekkola, J., Degerman, A., Autti, T., Jääskeläinen, I. P., Sams, M., and Alho, K. (2005). Modulation of auditory cortex activation by sound presentation rate and attention. Hum. Brain Mapp. 26, 94–99.
Romanski, L. M., Tian, B., Fritz, J. B., Mishkin, M., Goldman-Rakic, P. S., and Rauschecker, J. P. (1999). Dual streams of auditory afferents target multiple domains in the primate prefrontal cortex. Nat. Neurosci. 2, 1131–1136.
Saron, C. D., Foxe, J. J., Simpson, G. V., and Vaughan, Jr., H. G. (2003). “Interhemispheric visuomotor activation: spatiotemporal electrophysiology related to reaction time”, in The Parallel Brain: The Cognitive Neuroscience of the Corpus Callosum, eds E. Zaidel and M. Iacoboni (Cambridge, MA: The MIT Press), 171–218.
Schalk, G. (2010). Can electrocorticography (ECoG) support robust and powerful brain–computer interfaces? Front. Neuroeng. 3:9. doi: 10.3389/fneng.2010.00009
Schnupp, J. W. H., and Kacelnik, O. (2002). Cortical plasticity: learning from cortical reorganization. Curr. Biol. 12, R144–R146.
Schwent, V. L., Hillyard, S. A., and Galambos, R. (1976). Selective attention and the auditory vertex potential. I. Effects of stimulus delivery rate. Electroencephalogr. Clin. Neurophysiol. 40, 604–614.
Srinivasan, R. (1999). Methods to improve the spatial resolution of EEG. Int. J. Bioelectromagn. 1, 102–111.
Treue, S., and Martínez Trujillo, J. C. (1999). Feature-based attention influences motion processing gain in macaque visual cortex. Nature 399, 575–579.
Tzourio, N., El Massioui, F., Crivello, F., Joliot, M., Renault, B., and Mazoyer, B. (1997). Functional anatomy of human auditory attention studied with PET. Neuroimage 5, 63–77.
Voisin, J., Bidet-Caulet, A., Bertrand, O., and Fonlupt, P. (2006). Listening in silence activates auditory areas: a functional magnetic resonance imaging study. J. Neurosci. 26, 273–278.
Weissman, D. H., Warner, L. M., and Woldorff, M. G. (2004). The neural mechanisms for minimizing cross-modal distraction. J. Neurosci. 24, 10941–10949.
Westerhausen, R., and Hugdahl, K. (2008). The corpus callosum in dichotic listening studies of hemispheric asymmetry: a review of clinical and experimental evidence. Neurosci. Biobehav. Rev. 32, 1044–1054.
Westerhausen, R., Woerner, W., Kreuder, F., Schweiger, E., Hugdahl, K., and Wittling, W. (2006). The role of the corpus callosum in dichotic listening: a combined morphological and diffusion tensor imaging study. Neuropsychology 20, 272–279.
Woldorff, M. G., Gallen, C., Hampson, S. A., Hillyard, S. A., Pantev, C., Sobel, D., and Bloom, F. E. (1993). Modulation of early sensory processing in human auditory cortex during auditory selective attention. Proc. Natl. Acad. Sci. U.S.A. 18, 8722–8726.
Woldorff, M. G., and Hillyard, S. A. (1991). Modulation of early auditory processing during selective listening to rapidly presented tones. Electroencephalogr. Clin. Neurophysiol. 79, 170–191.
Woldorff, M. G., Tempelmann, C., Fell, J., Tegeler, C., Gaschler-Markefski, B., Hinrichs, H., Heinz, H. J., and Scheich, H. (1999). Lateralized auditory spatial perception and the contralaterality of cortical processing as studied with functional magnetic resonance imaging and magnetoencephalography. Hum. Brain Mapp. 7, 49–66.
Keywords: attention, ECoG, ERP, auditory cortex
Citation: Neelon MF, Williams J and Garell PC (2011) Elastic attention: enhanced, then sharpened response to auditory input as attentional load increases. Front. Hum. Neurosci. 5:41. doi: 10.3389/fnhum.2011.00041
Received: 09 January 2011;
Accepted: 30 March 2011;
Published online: 27 April 2011.
Edited by:
Kenneth Hugdahl, University of Bergen, NorwayReviewed by:
Maria Stylianou Korsnes, Oslo University Hospital, NorwayArne Gramstad, Haukeland University Hospital, Norway
Copyright: © 2011 Neelon, Williams and Garell. This is an open-access article subject to a non-exclusive license between the authors and Frontiers Media SA, which permits use, distribution and reproduction in other forums, provided the original authors and source are credited and other Frontiers conditions are complied with.
*Correspondence: Michael F. Neelon, Department of Psychology, University of North Carolina at Asheville, CH206F CPO #1630, One University Heights, Asheville, NC 28804-8511, USA. e-mail:bW5lZWxvbkB1bmNhLmVkdQ==