 Ariel Rokem1*
 Jong H. Yoon2
 Renata E. Ooms2
 Richard J. Maddock2
 Michael J. Minzenberg2
 Michael A. Silver1,3
- 1 Helen Wills Neuroscience Institute, University of California, Berkeley, CA, USA
- 2 Department of Psychiatry and Imaging Research Center, University of California, Davis, CA, USA
- 3 School of Optometry, University of California, Berkeley, CA, USA
Reduced gamma-aminobutyric acid (GABA) levels in cerebral cortex are thought to contribute to information processing deficits in patients with schizophrenia (SZ), and we have previously reported lower in vivo GABA levels in the visual cortex of patients with SZ. GABA-mediated inhibition plays a role in sharpening orientation tuning of visual cortical neurons. Therefore, we predicted that tuning for visual stimulus orientation would be wider in SZ. We measured orientation tuning with a psychophysical procedure in which subjects performed a target detection task of a low-contrast oriented grating, following adaptation to a high-contrast grating. Contrast detection thresholds were determined for a range of adapter–target orientation offsets. For both SZ and healthy controls, contrast thresholds decreased as orientation offset increased, suggesting that this tuning curve reflects the selectivity of visual cortical neurons for stimulus orientation. After accounting for generalized deficits in task performance in SZ, there was no difference between patients and controls for detection of target stimuli having either the same orientation as the adapter or orientations far from the adapter. However, patients’ thresholds were significantly higher for intermediate adapter–target offsets. In addition, the mean width parameter of a Gaussian fit to the psychophysical orientation tuning curves was significantly larger for the patient group. We also present preliminary data relating visual cortical GABA levels, as measured with magnetic resonance spectroscopy, and orientation tuning width. These results suggest that our finding of broader orientation tuning in SZ may be due to diminished visual cortical GABA levels.
Introduction
Schizophrenia (SZ) is a mental disorder that affects approximately 1% of the population and carries significant disability for affected individuals. It is now recognized that cognitive deficits are a major source of this disability, and unlike positive symptoms (e.g., hallucinations and delusions), cognitive deficits in SZ (Green, 1996) are at best only modestly affected by currently available pharmacological treatments (Goldberg et al., 2007; Keefe et al., 2007). Therefore, a deeper understanding of the biological mechanisms underlying cognitive and information processing deficits in this disease could lead to the identification of new treatment targets and have significant public health benefits. In particular, the study of perceptual deficits in SZ (Butler et al., 2008) offers insight regarding specific neural circuit abnormalities, as the neuroanatomical and neurophysiological substrates of perceptual processes are often better understood than those of higher cognitive functions such as memory or attention.
Gamma-amino butyric acid (GABA) is the main inhibitory neurotransmitter in the central nervous system, and previous research suggests that reduced GABA transmission may underlie cognitive impairment in SZ (Lewis et al., 2004, 2008; Cho et al., 2006). However, until recently, estimates of GABA levels in patients with SZ were only available from postmortem brain tissue and relied on measurement of the expression levels of molecular markers of GABA synthesis. Using these methods, several studies have reported reduced transcription of the 67-kDa isoform of the GABA metabolic enzyme glutamic acid decarboxylase in cortical neurons of patients with SZ (Akbarian et al., 1995; Volk et al., 2000; Hashimoto et al., 2008), which may result in decreased synthesis of GABA (Asada et al., 1997). Similarly, levels of transcription of the GABAergic neuronal markers somatostatin (SOM) and parvalbumin (PV) are reduced in many cortical regions in SZ, including the calcarine sulcus in the occipital lobe (Hashimoto et al., 2008), consistent with a widespread GABA deficit in cortex. In a recent study, we used proton magnetic resonance spectroscopy (1H-MRS) to non-invasively and directly measure GABA levels in vivo in patients with SZ and found that patients had reduced visual cortical GABA levels relative to healthy controls (Yoon et al., 2010).
Sensory systems provide an attractive experimental model for studying GABA deficits in SZ. GABA-mediated inhibition has been shown to modulate neuronal selectivity in a variety of mammalian sensory systems, including somatosensory (Swadlow, 2003), olfactory (Suzuki and Bekkers, 2007), auditory (Razak and Fuzessery, 2010), and visual (Alitto and Dan, 2010) systems. In studies of the visual system, behavioral experimental designs can draw on the extensive knowledge provided by many years of basic physiological research on the role of GABA in modulating visual responses. In particular, physiologically informed visual psychophysics allows precise control of the stimulus parameters that determine neuronal responses, and quantitative methods are available to model these responses and their effects on perception and behavior. For example, surround suppression, the decrease in perceived contrast and discriminability of a low-contrast stimulus by a high-contrast surround stimulus, is reduced in SZ (Dakin et al., 2005; Tadin et al., 2006; Yoon et al., 2009). Physiological correlates of surround suppression in visual cortical neuronal responses are thought to depend on GABAergic inhibition (Angelucci and Bressloff, 2006), and we have demonstrated that human visual cortical GABA levels are correlated with the magnitude of surround suppression, as measured psychophysically (Yoon et al., 2010).
Whereas the previous surround suppression studies provide important information regarding impaired spatial contextual interactions in SZ and their neurochemical correlates, the present study focused on stimulus selectivity in SZ. Selectivity is a fundamental property of neuronal responses, and one of the best understood examples of stimulus selectivity is the tuning of visual cortical neurons to stimulus orientation, first described by Hubel and Wiesel (1959). At least some of the tuning for stimulus orientation in neurons in early visual cortex is due to GABA-mediated modulation of their responses. Application of GABA antagonists to visual cortex results in a widening of orientation tuning curves (Sillito, 1975, 1979; Katzner et al., 2011), while local administration of GABA itself sharpens tuning curves (Li et al., 2008). In addition, analysis of the temporal characteristics of tuned responses in V1 neurons demonstrates the importance of inhibition in generating orientation selectivity (Ringach et al., 2003; Shapley et al., 2003). Finally, a recent study using MRS reported a positive correlation between a psychophysical measure of visual orientation discrimination and GABA levels in human visual cortex (Edden et al., 2009). Importantly, orientation tuning may rely on different physiological mechanisms than surround suppression (Ma et al., 2010). Therefore, a finding of increased orientation tuning width in patients with SZ would provide evidence for a generalized cortical GABA deficit in this disease.
We employed a psychophysical adaptation procedure (Fang et al., 2005) to measure orientation tuning in patients with SZ and matched control subjects. Based on existing evidence for GABAergic cortical deficits in SZ and for a critical role of GABA in generating orientation-selective responses in visual cortical neurons, we hypothesized that patients with SZ would exhibit broader orientation tuning, as measured psychophysically. In a subset of participants, we also made preliminary measurements on the relationship between this behavioral index of orientation tuning and visual cortical levels of GABA, as measured with MRS. These findings have significant implications for SZ research, because orientation tuning can be readily studied at the local cortical circuit level in animal models of this disease.
Methods
Subjects
We studied 24 patients and 23 controls, matched on basic demographic factors (Table 1). Following exclusion based on the behavioral criteria mentioned below, psychophysical measurements were analyzed for 20 controls and 16 patients. Spectroscopy measurements were obtained for a subset of these participants (seven patients and seven controls). All patients were clinically stable and were recruited as outpatients at the time of study. Diagnosis was made by master or doctoral-level clinicians using SCID-I and confirmed by consensus conference. Exclusion criteria were the following: IQ <70, drug or alcohol dependence or abuse within 3 months of testing, a positive urine drug screen on day of testing, major medical illness affecting brain function, or history of significant head trauma. Exclusion criteria for controls were lifetime diagnosis of a psychotic disorder or first-degree relative with a psychotic disorder. Subscores from the Brief Psychiatric Rating Scale, Scale for the Assessment of Negative Symptoms and Scale for the Assessment of Positive Symptoms were used to derive indices for the following three major domains of symptoms: reality distortion, disorganization and negative symptoms (Barch et al., 2003). This study was approved by the IRB at the University of California, Davis, and all subjects provided written informed consent for all study procedures.
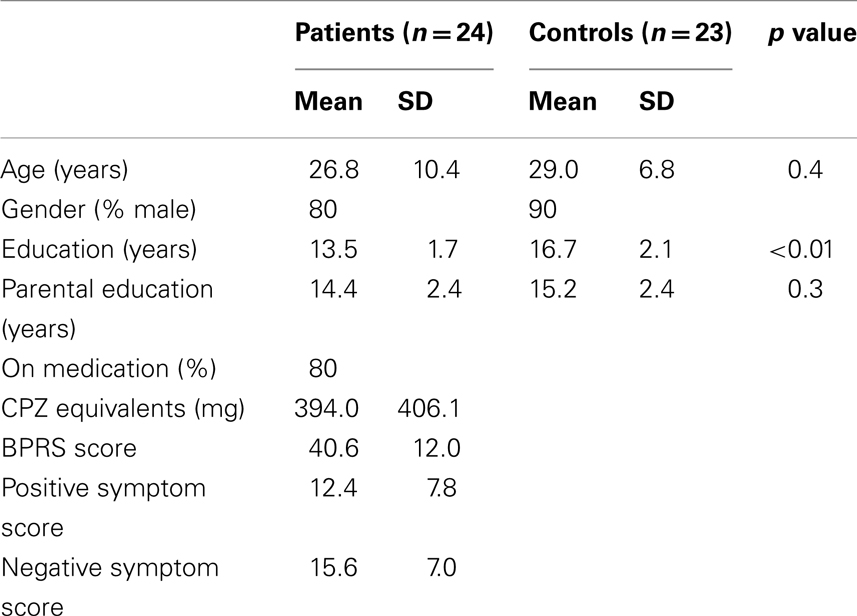
Table 1. Subject demographic and patient clinical characteristics.
Task
Subjects performed a visual target detection task (Figure 1; Fang et al., 2005). The display contained two rectangular placeholders that were slightly brighter than background luminance and centered at 5° of eccentricity to the left and right of a central fixation cross. Each block of trials began with an adapter stimulus consisting of two Gabor patches (100% contrast, spatial frequency of 3 cycles/degree, Gaussian envelope SD of 4°, tilted 45° clockwise relative to vertical), with one patch presented in the center of each of the placeholders. The initial adaptation period lasted for 20 s. Then, the adapter stimuli were presented at the beginning of each subsequent trial for a top-up adaptation period of 5 s. Following a 500-ms interval, a low-contrast target stimulus was presented for 200 ms at either the left or right adapted location. The target was a Gabor patch with the same spatial frequency and phase as the adapter stimulus, but smaller in size (SD of the Gaussian envelope was 2.4°) and lower in contrast. In addition, the target stimulus had one of five orientation offsets (0°, ±5°, ±10°, ±15°, or ±45°, relative to the 45° adapter).
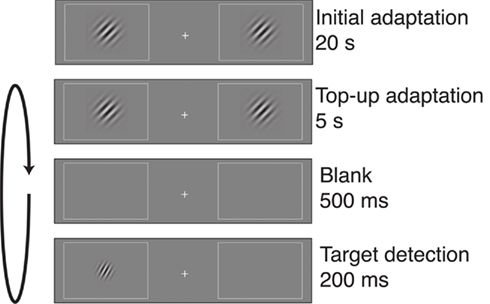
Figure 1. Post-adaptation contrast detection task. Each block of trials began with a 20-s adaptation period, in which two gratings were displayed on either side of a central fixation cross. Each trial began with 5 s of top-up adaptation, followed by a 500-ms interval and then presentation of a target on one side of fixation. The target could appear in one of several orientation offsets relative to the 45° adapter. Participants indicated whether the target appeared on the left or right of fixation, and target contrast was adjusted separately for each adapter–target orientation offset to maintain 82% correct performance for each offset. Contrast, size, and spatial frequency of the gratings have been altered in this figure to increase visibility.
Subjects were asked to respond with a button press to indicate which of the two placeholders contained the target (spatial two-alternative forced choice). An auditory stimulus (a brief click) was presented at the time of target onset. Targets were rotated either clockwise or counterclockwise relative to the adapter, with clockwise and counterclockwise targets occurring randomly with equal probability, thereby reducing the ability of participants to use an off-orientation looking strategy to perform the target detection task (Blake and Holopigian, 1985).
For each orientation offset, a Quest staircase was used to determine the threshold target contrast corresponding to 82% correct detection performance (Watson and Pelli, 1983). This percentage correct value was used because it is the point in the psychometric function at which the threshold was assessed. Therefore, trials at target contrast corresponding to 82% correct yield the most precise estimate of detection threshold (Watson and Pelli, 1983). This adaptive staircase procedure adjusts target contrast based on the subject’s performance in order to generate stimuli that are near the subject’s psychophysical threshold for a given condition. In order to separately account for differential effects of adaptation in the two groups (SZ and control) and for potential group differences in psychophysical performance due to the generalized deficit confound (Knight and Silverstein, 2001), each subject was tested on the same task without adaptation, thereby providing a baseline measurement of target detection performance. Since the effects of orientation-selective adaptation may last for extended periods of time (Blakemore et al., 1970), testing in the no-adaptation condition always preceded testing in the adaptation condition.
In addition to providing an estimate of the threshold, the Quest algorithm also generates a measure of error of the threshold estimation, based on the reliability of the convergence of the psychophysical staircase. We therefore computed a 90% confidence interval (CI) for the threshold for each subject to assess reliability of performance, independent of the absolute threshold value for each orientation offset. One of the main concerns when testing patients is that a generalized deficit could reduce response reliability. Therefore, before data collection, each participant was trained on the target detection task until he or she was able to perform the task at a pre-determined level of reliability (90% CI less than 30% contrast for all orientation offsets, both with and without adaptation). This exclusion criterion was approximately 10% larger than the largest CI produced by an experienced psychophysical observer, based on data from pilot studies. Two patients and no controls were excluded based on this response reliability criterion. In addition, of the participants who met the reliability criterion during practice blocks, four patients and three controls subsequently had a 90% CI that was greater than 30% contrast in the 0° offset condition during testing, and these subjects were also excluded from the study.
Procedure
The experiments were conducted in a dimly lit room. Subjects were seated with their eyes 50 cm from the display. A chin rest was used in order to maintain this distance and to stabilize the head. The stimuli were displayed on an LCD monitor, and luminance levels were gamma-corrected. Screen resolution was 1280 by 1024 pixels, monitor refresh rate was 60 Hz, and mean luminance was 37 cd/m2. Visual stimuli were created using the Psychophysics Toolbox (Brainard, 1997; Pelli, 1997) for Matlab.
Eye Position Monitoring
Although subjects were instructed to fixate on a central point, patients with SZ can have difficulty controlling eye movements (Lipton et al., 1983). We therefore monitored eye position with an infrared camera placed in front of the participants’ eyes during task performance. Auditory feedback was provided at the end of every trial in which fixation was not maintained. In addition, the psychophysical staircase was not updated following trials containing deviations from fixation, so these trials had no effect on the estimates of the psychophysical thresholds. In addition, we verified that differences in eye position patterns could not account for the group differences in target detection thresholds. In general, participants infrequently failed to maintain fixation in the adapted condition (patients: 2.8% of trials, SD: 1.3%; controls: 0.6%, SD: 0.3%), and the group difference did not reach statistical significance (t34 = 1.84, p = 0.07). The mean number of trials with deviation from fixation was greater for patients than controls in the no-adapt condition (patients: 2.0%, SD 3.3%; controls: 0.5%, SD 0.6%; t34 = 1.94, p = 0.05). Importantly, this difference was driven mainly by two patients who had 12.8 and 13.5% trials with deviations from fixation. However, since our main results are consistent whether or not the data from these two participants are excluded, we chose to include their data. Moreover, because the adaptation measured here is specific to visual field location (Fang et al., 2005), a higher rate of deviations from fixation would be predicted to weaken the effects of adaptation. However, we found increased levels of orientation-specific adaptation in the patients (Results). Finally, there was no significant difference in the proportion of trials with deviations from fixation between the adapted condition and the no-adaptation condition in either group.
Spectroscopy Methods
A subset of the participants (seven controls and seven patients) participated in a previous study in which GABA levels were measured using proton MRS (Yoon et al., 2010), and the MRS methods are therefore only summarized here. Proton MRS was measured using a Siemens Trio 3 Tesla MRI system. Paired surface coils (Nova Medical, Wilmington, MA, USA) were positioned under the occiput, and a 35 mm × 30 mm × 25 mm voxel was centered on the calcarine sulci bilaterally. A single voxel MEGA-PRESS J-difference spectral editing sequence measured total GABA (Mescher et al., 1998). Using jMRUI software (Stefan et al., 2009), all spectra were phase-aligned with reference to water, zero-filled from 1024 to 4096, apodized with a 4-Hz Gaussian filter, and frequency aligned to creatine at 3.02 ppm. Peak integration was used to quantify total GABA (2.99 ± 0.12 ppm) in the difference spectra and creatine (3.02 ± 0.09 ppm) in the summed spectra. The ratio of total GABA and total creatine signals was used for hypothesis testing (Bogner et al., 2010).
Analysis
Statistical analysis
For each participant, two target detection thresholds were measured for each orientation offset: one following adaptation and one without adaptation. In order to account for between-subject differences in detection threshold unrelated to the adaptation process, we subtracted the no-adapter threshold from the adapter threshold for each orientation offset. Statistical significance was assessed with two-way ANOVAs, with adapter–target orientation offset as a within-subject factor (five levels) and group (patients vs. controls) as a between-subject factor. An ANOVA with these factors was conducted separately for the adapt thresholds, for the no-adapt thresholds, and for the differences in threshold (adapt minus no-adapt).
Tuning curve analysis
In order to compare orientation tuning width between the groups, each participant’s differences in threshold (adapt minus no-adapt) were normalized to that participant’s difference in threshold for the 0° adapter–target offset. A bell-shaped Gaussian function is often used to model orientation tuning curves in visual cortical neurons and provides a good description of these curves (Swindale, 1998). For each subject, we fit the normalized thresholds with a simplified Gaussian tuning curve of the form:

where e is the natural base of the logarithm, x are the different orientation offsets, and σ is the single free parameter that determines the width of the tuning curve. In addition, we fit a two-parameter model that includes a vertical offset parameter (A):

Parameter fitting was done using the “leastsq” function from the “optimize” module of SciPy (Jones et al., 2001-), version 0.8. This function uses a modified Levenberg–Marquardt algorithm to find the minimum of the sum of squares of a function. In this case, the function to be minimized was the difference between the Gaussian curve for a given parameter setting and the recorded normalized detection threshold data. In both models, the value of the width parameter was constrained to be less than the largest orientation offset used in the experiment (45°). This criterion was met for all participants except two patients. These two subjects displayed very high psychophysical thresholds for all adapter–target offsets, indicating that their responses were not selective for orientation and suggesting that they may have been performing the task in a fundamentally different manner from the other participants. We therefore excluded data from these two participants from the comparison of orientation tuning between the groups. However, our conclusions hold if we include these two participants and assign them a tuning width of 45° (the largest orientation offset we studied).
As the one- (tuning width) and two- (tuning width and vertical offset) parameter models are nested, we compared them using an F-test, measuring the decrease in error in the fit of the two-parameter model while taking into account the loss in degrees of freedom when this second parameter is added (Glatting et al., 2007). In addition, we compared the two models using the Akaike information criterion (AIC), corrected for sample size (Glatting et al., 2007). The AIC estimates the amount of information lost with the addition of parameters, relative to the gain in information due to reduction of error. Therefore, smaller values correspond to models that provide a better account of the data.
Results
We used a combination of visual adaptation and a target detection task (Fang et al., 2005; Figure 1) to psychophysically measure width of tuning for stimulus orientation in patients with SZ and matched controls. In each trial, adapting stimuli (oriented Gabor patches) were presented on either side of fixation for 5 s, followed by presentation of a Gabor target in one of the adapted locations (left or right). Target orientation differed from adapter orientation by one of five offsets: 0° (no difference between adapter and target), 5°, 10°, 15°, or 45°. Threshold contrasts for target detection were measured for each adapter–target offset.
For both patients and controls, contrast detection thresholds decreased as the orientation offset between the adapter and the target was increased, indicating tuning for stimulus orientation (main effect of adapter–target offset in the ANOVA of the adapt condition thresholds, F1,150 = 272.94, p < 0.01, Figure 2A). In addition, patients had higher overall target detection thresholds than controls (F1,36 = 5.14, p < 0.05). To assess whether this group difference was driven by any particular orientation offset, we compared thresholds between groups for each orientation offset using two-tailed t-tests. We found significant group differences for all orientation offsets except 0° (0°: t36 = 1.13, p = 0.26, 5°: t36 = 2.4, p < 0.05, 10°: t36 = 1.99, p = 0.05, 15°: t36 = 2.15, p < 0.05, 45°: t36 = 2.6, p < 0.05). Due to generalized deficits in cognition, attention, motivation, and other factors, patients with SZ are impaired in performance of most behavioral tasks. These generalized deficits typically limit the attribution of impairment on a particular task to a specific cognitive or perceptual process (Knight and Silverstein, 2001). In order to measure orientation tuning while controlling for the generalized deficit confound (in this case, worse overall target detection performance in patients with SZ across all orientation offsets), we measured thresholds for each participant without adaptation. No-adaptation thresholds capture group differences in performance that are not due to differences in the adaptation process and/or the width of orientation tuning.
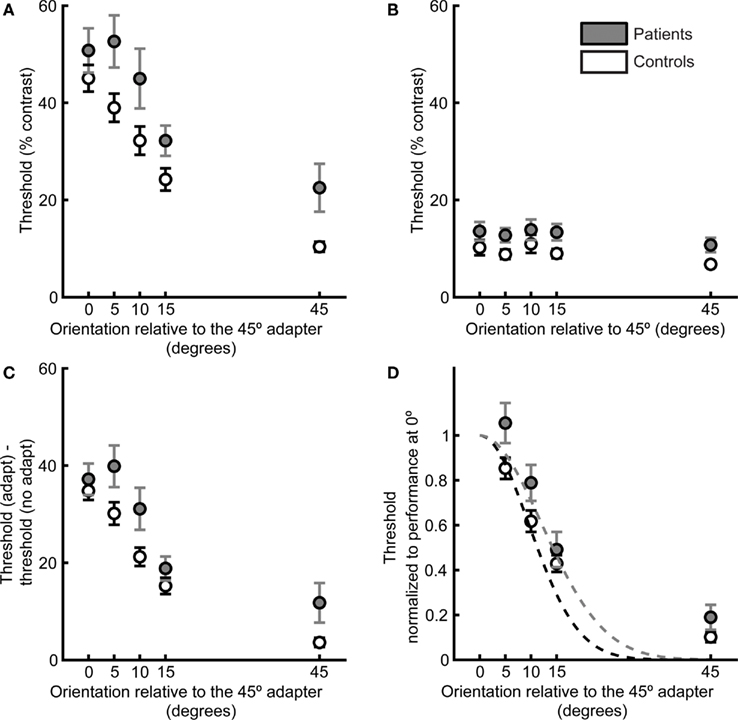
Figure 2. Target detection thresholds as a function of adapter–target orientation offset define psychophysical orientation tuning curves. Data are plotted for patients (gray) and controls (white). (A) Contrast thresholds for detection of the post-adaptation target, as a function of adapter–target orientation offset. (B) Detection thresholds when no adapter was presented. (C) Difference in thresholds in the adaptation and no-adaptation condition. (D) For each participant, thresholds were normalized to performance at 0° adapter–target orientation offset, and a Gaussian tuning curve was fit to each participant’s data. Dashed lines indicate the means of the Gaussian fits for each subject group. Error bars indicate SEM for each group and condition.
As expected from the generalized deficit, there was a nearly significant group difference in no-adaptation thresholds across all orientations (F1,36 = 4.00, p = 0.05, Figure 2B), with patients exhibiting worse performance. Following subtraction of no-adaptation thresholds for each orientation offset (Figure 2C), there was still a group difference (ANOVA of adapt minus no-adapt thresholds: F1,36 = 4.36, p < 0.05). Two-tailed t-tests revealed that this group difference was mostly driven by differences at 5° (t36 = 2.1, p < 0.05), 10° (t36 = 2.2, p < 0.05), and 45° (t36 = 2.1, p < 0.05) offsets. The two groups had very similar difference of threshold (adapt minus no-adapt) values in the 0° offset condition (patients: 37 ± 3%; controls: 35 ± 2%, t36 = 0.66, p = 0.51). Because the groups did not differ for 0° offset following subtraction of no-adaptation thresholds, we divided each participant’s difference of threshold values (adapt minus no-adapt) in the other offsets by the difference between adapt and no-adapt thresholds in the 0° offset condition (Figure 2D). This normalization step allowed us to focus on individual differences in the width of the orientation tuning curve while controlling for variability across participants in the height of the tuning curve at the origin.
Normalized thresholds were higher overall in the patient group (ANOVA of normalized thresholds: F1,34 = 5.44, p < 0.05). Two-tailed t-tests for each orientation offset indicated that this group difference was driven by a significant difference at an orientation offset of 5° (t34 = 2.16, p < 0.05) and a nearly significant difference at the orientation offset of 10° (t34 = 1.98, p = 0.056). There were no significant group differences for the other orientation offsets (15°: t34 = 0.78, p = 0.43; 45°: t34 = 1.63, p = 0.11). Normalizing to the 0° offset also allowed us to quantify orientation selectivity for each participant by fitting a single-parameter Gaussian model (see Methods and Figure 2D). The mean width of the individual Gaussian fits was significantly larger in patients than controls (two-tailed t-test: t34 = 2.14, p < 0.05, Figure 3).
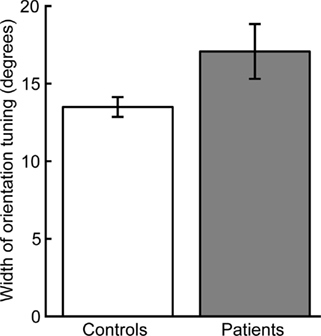
Figure 3. Width of orientation tuning as estimated by Gaussian fit. Patients had broader mean orientation tuning than controls (p < 0.05). Error bars indicate SEM for each group.
We also fit a two-parameter model to the data that included a vertical offset parameter. Since the models are nested (the single-parameter model is contained within the two-parameter model), the reduction in error (difference between the model estimate and the actual data) resulting from the addition of a parameter can be quantified with an F-test (Glatting et al., 2007). We found that the F value was smaller than 1 (F = 0.11), indicating that when the loss of degrees of freedom resulting from the additional parameter is taken into account, the two-parameter model does not describe the data more accurately than the one-parameter model. In addition, we compared the two models using the Akaike information criterion (AIC), corrected for small sample size (AICc; Glatting et al., 2007). This criterion was smaller for the single-parameter model, also supporting the choice of this model for analysis of these data. We therefore conclude that the two-parameter model failed to produce a significant improvement in the fit to the data, and we present results from the more parsimonious single-parameter model.
Many physiological results suggest that orientation tuning of individual neurons in the visual cortex is sharpened by GABA-mediated inhibition (Sillito, 1975, 1979; Shapley et al., 2003; Li et al., 2008). Therefore, we predicted that GABA levels in visual cortex would negatively correlate with orientation tuning width. To assess this prediction, we related the width of tuning obtained from the Gaussian model fit to 1H-MRS measurements of visual cortical GABA levels in 14 of the participants (seven patients and seven controls). Note that this is only a small subset of the subjects in the study and that these results therefore represent only preliminary measurements. As expected, the correlation between these two variables was negative (higher GABA levels were associated with narrower tuning for stimulus orientation), but this result did not reach statistical significance (r = −0.4, pone-tailed = 0.076; Figure 4).
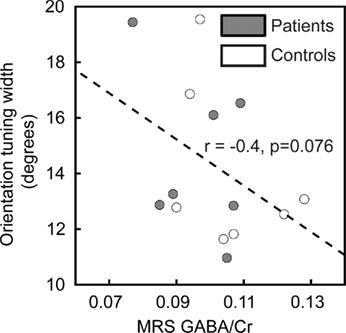
Figure 4. Correlation of orientation tuning with visual cortical GABA levels. Orientation tuning curve widths for individual subjects are plotted as a function of visual cortical GABA concentration (normalized to creatine levels, GABA/Cr). There is a trend in the data toward a negative correlation between orientation tuning width and the GABA/Cr ratio.
Finally, to assess possible effects of antipsychotic medications on orientation tuning, we correlated chlorpromazine (CPZ) equivalents with the estimates of orientation tuning width obtained from the Gaussian model fit. This correlation accounted for only 1% of the variance in the patient group (ptwo-tailed = 0.75), suggesting that the width of orientation tuning is not significantly influenced by the patients’ drug treatments. In addition, we found no correlation between orientation tuning width and the scores on any of the major domains of symptoms (reality distortion: r = −0.21, ptwo-tailed = 0.43; disorganization: r = −0.28, ptwo-tailed = 0.29; negative symptoms: r = −0.22, ptwo-tailed = 0.41).
Discussion
Using behavioral methods, we demonstrated that patients with SZ have broader orientation tuning curves than healthy controls. We measured orientation tuning with an adaptation paradigm (Fang et al., 2005). Many physiological studies have shown that the contrast sensitivity of neurons in visual cortex decreases with adaptation. Furthermore, this reduction in sensitivity is most pronounced in neurons that are most responsive to the adapting stimulus (reviewed in Kohn, 2007). At the perceptual level, adaptation to oriented stimuli increases detection thresholds for low-contrast targets that have the same orientation as the adapter (Blakemore and Nachmias, 1971). In addition, the orientation tuning of adaptation of visual responses measured with fMRI in primary visual cortex matches the behavioral tuning of adaptation (Fang et al., 2005). Taken together, these physiological and behavioral results suggest that our psychophysical measurements of orientation tuning of contrast detection threshold (lower thresholds with increasing adapter–target orientation offsets) reflect the tuning of orientation-selective neurons in early visual cortex.
We determined detection thresholds for each subject in a no-adaptation version of the target detection task, and this provided a means of controlling for a number of confounds, including a generalized deficit in performance of cognitive tasks in the patients (Knight and Silverstein, 2001). After subtracting these no-adaptation thresholds from thresholds in the adaptation condition and then normalizing to 0° adapter–target offset, we found no significant group differences in normalized threshold for offsets of 15° and 45°. However, patients had elevated normalized thresholds for offsets of 5° and 10°, corresponding to the flanks of the orientation tuning curve. This finding is important because group differences in threshold at intermediate adapter–target offsets, but not at the peak or tail of the orientation tuning curve, indicate broader tuning for stimulus orientation in visual cortical neurons in patients with SZ. To quantitatively assess this, we fit the behavioral orientation tuning curve for each subject with a Gaussian function, a model function that is commonly used to characterize orientation tuning of visual cortical neurons (Swindale, 1998). This model has only one free parameter, corresponding to the width of the tuning curve. Comparing the fit of a two-parameter model, in which another parameter quantifies the amount of vertical offset in the curve, indicated that the single-parameter model best accounts for the data. Controlling for the generalized deficit provides confidence that the increase in orientation tuning width in the patients is not due to group differences in extraneous factors such as attention or motivation but is instead specific to the orientation-selective adaptation process.
Previous studies have shown that in vivo GABA levels in the brain are lower in patients with SZ (Goto et al., 2009; Yoon et al., 2010) and that orientation tuning of visual cortical neurons is shaped by GABA-mediated inhibition (Sillito, 1975, 1979; Shapley et al., 2003; Li et al., 2008; Katzner et al., 2011). These findings suggest that the broader orientation tuning we observed in patients with SZ may be due to reduced visual cortical GABA levels. We measured visual cortical GABA levels and found that, as predicted, they were negatively correlated with our behavioral measure of orientation tuning width. However, these results should be viewed as preliminary, because our sample size in this analysis was limited to a small subset of seven patients and seven control subjects. Furthermore, though the correlation was in the predicted direction, it was not statistically significant and must therefore be interpreted with caution. Future studies with larger samples will be required in order to more completely investigate the role of GABA in orientation tuning.
Recent results show that distinct subclasses of GABAergic neurons differ in a number of response properties and may therefore differentially affect receptive field properties of excitatory neurons in visual cortex. Somatostatin (SOM)-expressing GABAergic neurons typically have slow and orientation-specific responses to visual stimulation (Ma et al., 2010). These response features suggest that they may contribute to orientation-specific surround suppression, which is thought to arise through orientation-specific feedback projections to primary visual cortex from higher order visual regions (Angelucci and Bressloff, 2006). On the other hand, parvalbumin (PV)-expressing GABAergic neurons respond more rapidly and do not exhibit selectivity for stimulus orientation (Ma et al., 2010). Models of orientation selectivity in primary visual cortical neurons suggest that some of the tuning results from an interaction between tuned feedforward excitatory connections and short-latency untuned inhibition (Shapley et al., 2003). Therefore, the response properties of PV-expressing inhibitory neurons are consistent with them playing a role in shaping orientation tuning in early visual cortex.
Postmortem analysis of brain tissue has revealed reduced mRNA expression of both SOM and PV in visual cortex of patients with SZ (Hashimoto et al., 2008), consistent with reduced orientation-specific surround suppression in SZ, as measured behaviorally (Yoon et al., 2009, 2010), and broader orientation tuning, as shown in the present study. However, orientation tuning and surround suppression interact in a complex manner (Xing et al., 2005; Okamoto et al., 2009), and recent findings suggest that orientation tuning of visual cortical neurons may also be mediated by tuned inhibition (Katzner et al., 2011).
The neurophysiological and pharmacological results on orientation tuning in visual cortical neurons summarized above were obtained from non-human animal models, while our behavioral measures of orientation selectivity were collected from human subjects. However, orientation tuning bandwidth values are highly conserved in early visual cortex across mammalian species as different as mice and macaque monkeys, despite dramatic interspecies differences in other neuronal response properties such as receptive field size, spatial and temporal frequency tuning, and contrast sensitivity (Van den Bergh et al., 2010). This suggests that the mechanisms underlying orientation tuning may be highly conserved across many mammalian species, including humans. Our results are therefore consistent with previous physiological reports (Sillito, 1975, 1979; Li et al., 2008; Katzner et al., 2011) showing that GABA-mediated inhibition plays an important role in generating orientation selectivity in the visual system.
Although the correlations between orientation tuning and GABA levels are in the expected direction, they are preliminary in nature, as discussed above. Therefore, we consider other biological mechanisms that could account for diminished orientation tuning in patients with SZ. Based on the similarity between symptoms of SZ and the psychological effects of NMDA receptor blockers such as phencyclidine, some researchers have suggested that patients with SZ may have a deficit in glutamatergic transmission through NMDA receptors (Butler and Javitt, 2005; Javitt, 2007). Pharmacological blockade of NMDA receptors reduces response gain in cat visual cortical neurons, while administration of NMDA increases response gain (Fox et al., 1990). A decrease in neuronal response gain could manifest as an increase in the width of orientation tuning (Katzner et al., 2011), and patients with SZ exhibit a response gain deficit in steady-state visual cortical evoked potentials (Butler et al., 2005).
In conclusion, we have shown that tuning for visual stimulus orientation is broader in patients with SZ, as predicted based on reduced visual cortical GABA levels in these patients (Yoon et al., 2010). Our analysis controlled for generalized performance deficits and therefore demonstrates a specific perceptual deficit in SZ that cannot be explained by higher-level cognitive factors such as attention and memory. However, tuning to stimuli, categories (Schwarzlose et al., 2008), and even abstract concepts (Piazza et al., 2004; Gotts et al., 2011) has been described in many human brain regions, suggesting that our results from orientation tuning may generalize to other parts of the brain and to higher level abstract representations.
Conflict of Interest Statement
Richard J. Maddock has been a paid consultant for Pfizer. Michael J. Minzenberg is contracted to GSK for a multisite clinical trial of an agent unrelated to the present study.
References
Akbarian, S., Kim, J. J., Potkin, S. G., Hagman, J. O., Tafazzoli, A., Bunney, W. E., and Jones, E. G. (1995). Gene expression for glutamic acid decarboxylase is reduced without loss of neurons in prefrontal cortex of schizophrenics. Arch. Gen. Psychiatry 52, 258–266.
Alitto, H. J., and Dan, Y. (2010). Function of inhibition in visual cortical processing. Curr. Opin. Neurobiol. 20, 340–346.
Angelucci, A., and Bressloff, P. C. (2006). Contribution of feedforward, lateral and feedback connections to the classical receptive field center and extra-classical receptive field surround of primate V1 neurons. Prog. Brain Res. 154, 93–120.
Asada, H., Kawamura, Y., Maruyama, K., Kume, H., Ding, R. G., Kanbara, N., Kuzume, H., Sanbo, M., Yagi, T., and Obata, K. (1997). Cleft palate and decreased brain gamma-aminobutyric acid in mice lacking the 67-kDa isoform of glutamic acid decarboxylase. Proc. Natl. Acad. Sci. U.S.A. 94, 6496–6499.
Barch, D. M., Carter, C. S., MacDonald, A. W. 3rd., Braver, T. S., and Cohen, J. D. (2003). Context-processing deficits in schizophrenia: diagnostic specificity, 4-week course, and relationships to clinical symptoms. J. Abnorm. Psychol. 112, 132–143.
Blake, R., and Holopigian, K. (1985). Orientation selectivity in cats and humans assessed by masking. Vis. Res. 25, 1459–1467.
Blakemore, C., and Nachmias, J. (1971). The orientation specificity of two visual after-effects. J. Physiol. (Lond.) 213, 157–174.
Blakemore, C., Nachmias, J., and Sutton, P. (1970). The perceived spatial frequency shift: evidence for frequency-selective neurones in the human brain. J. Physiol. (Lond.) 210, 727–750.
Bogner, W., Gruber, S., Doelken, M., Stadlbauer, A., Ganslandt, O., Boettcher, U., Trattnig, S., Doerfler, A., Stefan, H., and Hammen, T. (2010). In vivo quantification of intracerebral GABA by single-voxel (1)H-MRS. How reproducible are the results? Eur. J. Radiol. 73, 526–531.
Butler, P. D., Silverstein, S. M., and Dakin, S. C. (2008). Visual perception and its impairment in schizophrenia. Biol. Psychiatry 64, 40–47.
Butler, P. D., and Javitt, D. C. (2005). Early-stage visual processing deficits in schizophrenia. Curr. Opin. Psychiatry 18, 151–157.
Butler, P. D., Zemon, V., Schechter, I., Saperstein, A. M., Hoptman, M. J., Lim, K. O., Revheim, N., Silipo, G., and Javitt, D. C. (2005). Early-stage visual processing and cortical amplification deficits in schizophrenia. Arch. Gen. Psychiatry 62, 495–504.
Cho, R. Y., Konecky, R. O., and Carter, C. S. (2006). Impairments in frontal cortical gamma synchrony and cognitive control in schizophrenia. Proc. Natl. Acad. Sci. U.S.A. 103, 19878–19883.
Dakin, S., Carlin, P., and Hemsley, D. (2005). Weak suppression of visual context in chronic schizophrenia. Curr. Biol. 15, R822–R824.
Edden, R. A. E., Muthukumaraswamy, S. D., Freeman, T. C. A., and Singh, K. D. (2009). Orientation discrimination performance is predicted by GABA concentration and gamma oscillation frequency in human primary visual cortex. J. Neurosci. 29, 15721–15726.
Fang, F., Murray, S. O., Kersten, D., and He, S. (2005). Orientation-tuned fMRI adaptation in human visual cortex. J. Neurophysiol. 94, 4188–4195.
Fox, K., Sato, H., and Daw, N. (1990). The effect of varying stimulus intensity on NMDA-receptor activity in cat visual cortex. J. Neurophysiol. 64, 1413–1428.
Glatting, G., Kletting, P., Reske, S. N., Hohl, K., and Ring, C. (2007). Choosing the optimal fit function: comparison of the Akaike information criterion and the F-test. Med. Phys. 34, 4285–4292.
Goldberg, T. E., Goldman, R. S., Burdick, K. E., Malhotra, A. K., Lencz, T., Patel, R. C., Woerner, M. G., Schooler, N. R., Kane, J. M., and Robinson, D. G. (2007). Cognitive improvement after treatment with second-generation antipsychotic medications in first-episode schizophrenia: is it a practice effect? Arch. Gen. Psychiatry 64, 1115–1122.
Goto, N., Yoshimura, R., Moriya, J., Kakeda, S., Ueda, N., Ikenouchi-Sugita, A., Umene-Nakano, W., Hayashi, K., Oonari, N., Korogi, Y., and Nakamura, J. (2009). Reduction of brain gamma-aminobutyric acid (GABA) concentrations in early-stage schizophrenia patients: 3T proton MRS study. Schizophr. Res. 112, 192–193.
Gotts, S. J., Milleville, S. C., Bellgowan, P. S., and Martin, A. (2011). Broad and narrow conceptual tuning in the human frontal lobes. Cereb. Cortex 21, 477–491.
Green, M. F. (1996). What are the functional consequences of neurocognitive deficits in schizophrenia? Am. J. Psychiatry 153, 321–330.
Hashimoto, T., Bazmi, H. H., Mirnics, K., Wu, Q., Sampson, A. R., and Lewis, D. A. (2008). Conserved regional patterns of GABA-related transcript expression in the neocortex of subjects with schizophrenia. Am. J. Psychiatry 165, 479–489.
Hubel, D. H., and Wiesel, T. N. (1959). Receptive fields of single neurones in the cat’s striate cortex. J. Physiol. (Lond.) 148, 574–591.
Javitt, D. C. (2007). Glutamate and schizophrenia: phencyclidine, N-methyl-D-aspartate receptors, and dopamine-glutamate interactions. Int. Rev. Neurobiol. 78, 69–108.
Jones, E., Oliphant, T., and Peterson, P. (2001-). SciPy: Open Source Scientific Tools for Python [Online]. Available at: http://www.scipy.org [accessed April 13, 2011].
Katzner, S., Busse, L., and Carandini, M. (2011). GABAA inhibition controls response gain in visual cortex. J. Neurosci. 31, 5931–5941.
Keefe, R. S. E., Bilder, R. M., Davis, S. M., Harvey, P. D., Palmer, B. W., Gold, J. M., Meltzer, H. Y., Green, M. F., Capuano, G., Stroup, T. S., McEvoy, J. P., Swartz, M. S., Rosenheck, R. A., Perkins, D. O., Davis, C. E., Hsiao, J. K., and Lieberman, J. A., for the CATIE Investigators and the Neurocognitive Working Group. (2007). Neurocognitive effects of antipsychotic medications in patients with chronic schizophrenia in the CATIE trial. Arch. Gen. Psychiatry 64, 633–647.
Knight, R. A., and Silverstein, S. M. (2001). A process-oriented approach for averting confounds resulting from general performance deficiencies in schizophrenia. J. Abnorm. Psychol. 110, 15–30.
Kohn, A. (2007). Visual adaptation: physiology, mechanisms, and functional benefits. J. Neurophysiol. 97, 3155–3164.
Lewis, D. A., Cho, R. Y., Carter, C. S., Eklund, K., Forster, S., Kelly, M. A., and Montrose, D. (2008). Subunit-selective modulation of GABA type A receptor neurotransmission and cognition in schizophrenia. Am. J. Psychiatry 165, 1585–1593.
Lewis, D. A., Volk, D. W., and Hashimoto, T. (2004). Selective alterations in prefrontal cortical GABA neurotransmission in schizophrenia: a novel target for the treatment of working memory dysfunction. Psychopharmacology (Berl.) 174, 143–150.
Li, G., Yang, Y., Liang, Z., Xia, J., Yang, Y., and Zhou, Y. (2008). GABA-mediated inhibition correlates with orientation selectivity in primary visual cortex of cat. Neuroscience 155, 914–922.
Lipton, R. B., Levy, D. L., Holzman, P. S., and Levin, S. (1983). Eye movement dysfunctions in psychiatric patients: a review. Schizophr. Bull. 9, 13–32.
Ma, W. P., Liu, B. H., Li, Y. T., Huang, Z. J., Zhang, L. I., and Tao, H. W. (2010). Visual representations by cortical somatostatin inhibitory neurons-selective but with weak and delayed responses. J. Neurosci. 30, 14371–14379.
Mescher, M., Merkle, H., Kirsch, J., Garwood, M., and Gruetter, R. (1998). Simultaneous in vivo spectral editing and water suppression. NMR Biomed. 11, 266–272.
Okamoto, M., Naito, T., Sadakane, O., Osaki, H., and Sato, H. (2009). Surround suppression sharpens orientation tuning in the cat primary visual cortex. Eur. J. Neurosci. 29, 1035–1046.
Pelli, D. G. (1997). The VideoToolbox software for visual psychophsyics: transforming numbers into movies. Spat. Vis. 10, 437–442.
Piazza, M., Izard, V., Pinel, P., Le Bihan, D., and Dehaene, S. (2004). Tuning curves for approximate numerosity in the human intraparietal sulcus. Neuron 44, 547–555.
Razak, K. A., and Fuzessery, Z. M. (2010). GABA shapes a systematic map of binaural sensitivity in the auditory cortex. J. Neurophysiol. 104, 517–528.
Ringach, D. L., Hawken, M. J., and Shapley, R. (2003). Dynamics of orientation tuning in macaque V1: the role of global and tuned suppression. J. Neurophysiol. 90, 342–352.
Schwarzlose, R. F., Swisher, J. D., Dang, S., and Kanwisher, N. (2008). The distribution of category and location information across object-selective regions in human visual cortex. Proc. Natl. Acad. Sci. U.S.A. 105, 4447–4452.
Shapley, R., Hawken, M., and Ringach, D. L. (2003). Dynamics of orientation selectivity in the primary visual cortex and the importance of cortical inhibition. Neuron 38, 689–699.
Sillito, A. M. (1975). The contribution of inhibitory mechanisms to the receptive field properties of neurones in the striate cortex of the cat. J. Physiol. (Lond.) 250, 305–329.
Sillito, A. M. (1979). Inhibitory mechanisms influencing complex cell orientation selectivity and their modification at high resting discharge levels. J. Physiol. (Lond.) 289, 33–53.
Stefan, D., Di Cesare, F., Andrasescu, A., Popa, E., Lazariev, A., Vescovo, E., Strbak, O., Williams, S., Starcuk, Z., Cabanas, M., van Ormondt, D., and Graveron-Demilly, D. (2009). Quantitation of magnetic resonance spectroscopy signals: the jMRUI software package. Meas. Sci. Technol. 20, 104035.
Suzuki, N., and Bekkers, J. M. (2007). Inhibitory interneurons in the piriform cortex. Clin. Exp. Pharmacol. Physiol. 34, 1064–1069.
Swadlow, H. A. (2003). Fast-spike interneurons and feedforward inhibition in awake sensory neocortex. Cereb. Cortex 13, 25–32.
Swindale, N. V. (1998). Orientation tuning curves: empirical description and estimation of parameters. Biol. Cybern. 78, 45–56.
Tadin, D., Kim, J., Doop, M. L., Gibson, C., Lappin, J. S., Blake, R., and Park, S. (2006). Weakened center-surround interactions in visual motion processing in schizophrenia. J. Neurosci. 26, 11403–11412.
Van den Bergh, G., Zhang, B., Arckens, L., and Chino, Y. M. (2010). Receptive-field properties of V1 and V2 neurons in mice and macaque monkeys. J. Comp. Neurol. 518, 2051–2070.
Volk, D. W., Austin, M. C., Pierri, J. N., Sampson, A. R., and Lewis, D. A. (2000). Decreased glutamic acid decarboxylase67 messenger RNA expression in a subset of prefrontal cortical gamma-aminobutyric acid neurons in subjects with schizophrenia. Arch. Gen. Psychiatry 57, 237–245.
Watson, A. B., and Pelli, D. G. (1983). QUEST: a Bayesian adaptive psychometric method. Percept. Psychophys. 33, 113–120.
Xing, D., Shapley, R. M., Hawken, M. J., and Ringach, D. L. (2005). Effect of stimulus size on the dynamics of orientation selectivity in Macaque V1. J. Neurophysiol. 94, 799–812.
Yoon, J. H., Maddock, R. J., Rokem, A., Silver, M. A., Minzenberg, M. J., Ragland, J. D., and Carter, C. S. (2010). GABA concentration is reduced in visual cortex in schizophrenia and correlates with orientation-specific surround suppression. J. Neurosci. 30, 3777–3781.
Keywords: schizophrenia, visual perception, GABA, MRS, psychophysics, tuning
Citation: Rokem A, Yoon JH, Ooms RE, Maddock RJ, Minzenberg MJ and Silver MA (2011) Broader visual orientation tuning in patients with schizophrenia. Front. Hum. Neurosci. 5:127. doi: 10.3389/fnhum.2011.00127
Received: 15 June 2011; Accepted: 14 October 2011;
Published online: 04 November 2011.
Edited by:
Srikantan S. Nagarajan, University of California San Francisco, USAReviewed by:
Alex R. Wade, Smith-Kettlewell Eye Research Institute, USAKaruna Subramaniam, University of California San Francisco, USA
Copyright: © 2011 Rokem, Yoon, Ooms, Maddock, Minzenberg and Silver. This is an open-access article subject to a non-exclusive license between the authors and Frontiers Media SA, which permits use, distribution and reproduction in other forums, provided the original authors and source are credited and other Frontiers conditions are complied with.
*Correspondence: Ariel Rokem, Department of Psychology, Stanford University, 450 Serra Mall, Stanford, CA 94305, USA. e-mail:YXJva2VtQGdtYWlsLmNvbQ==