


- 1 Department of Experimental Psychology, University of Oxford, Oxford, UK
- 2 Department of Cognitive Neuroscience, Maastricht University, Maastricht, Netherlands
Practice and training usually lead to performance increase in a given task. In addition, a shift from intentional toward more automatic processing mechanisms is often observed. It is currently debated whether automatic and intentional processing is subserved by the same or by different mechanism(s), and whether the same or different regions in the brain are recruited. Previous correlational evidence provided by behavioral, neuroimaging, modeling, and neuropsychological studies addressing this question yielded conflicting results. Here we used transcranial magnetic stimulation (TMS) to compare the causal influence of disrupting either left or right parietal cortex during automatic and intentional numerical processing, as reflected by the size congruity effect and the numerical distance effect, respectively. We found a functional hemispheric asymmetry within parietal cortex with only the TMS-induced right parietal disruption impairing both automatic and intentional numerical processing. In contrast, disrupting the left parietal lobe with TMS, or applying sham stimulation, did not affect performance during automatic or intentional numerical processing. The current results provide causal evidence for the functional relevance of right, but not left, parietal cortex for intentional, and automatic numerical processing, implying that at least within the parietal cortices, automatic, and intentional numerical processing rely on the same underlying hemispheric lateralization.
Introduction
Extensive practice of a new perceptual, cognitive, or manual skill usually leads to faster processing speed, higher accuracy, and eventually to automatic processing of the practiced material (Logan, 1988; Vanlehn, 1996; Rickard, 1997). For example, during development, children show a increased processing speed and lower accuracy during numerical quantity processing (Sekular and Mierkiewicz, 1977; Girelli et al., 2000; Rubinsten et al., 2002). At the same time, practice leads to an increased interference of the numerical value of a presented digit when children are required to ignore its numerical value during the performance of another task, such as physical size comparison (Girelli et al., 2000; Rubinsten et al., 2002). Similarly, after extensive training with new numerical symbols, adult participants become faster, more accurate with intentional processing of these numerical symbols, and more automatic at processing the newly acquired numerical values (Tzelgov et al., 2000; Cohen Kadosh et al., 2010).
Previous studies have suggested that intentional and automatic processing are only quantitatively different, and stem from the same underlying mechanism (Tzelgov and Ganor-Stern, 2005; Cohen Kadosh and Walsh, 2009; Reis et al., 2009). Others have suggested that intentional and automatic processing are qualitatively different and stem from different mechanisms (Logan, 1985; Lewis and Miall, 2003; Rossetti et al., 2003; Bugden and Ansari, 2011). This dispute is important not only for our understanding of the relationship between automatic and intentional processes. It has also theoretical implications for several other domains, such as neuropsychological studies and rehabilitation (Reis et al., 2009; Rubinsten and Henik, 2009), as well as for cognitive and neuroimaging studies which prefer using automatic processing, rather than intentional processing, to infer about the mental representation of a cognitive or perceptual entity independent of subject’s strategies (Barsalou, 1999; Tzelgov and Ganor-Stern, 2005; Cohen Kadosh and Walsh, 2009).
In the field of numerical cognition, automatic numerical processing can be assessed by the numerical Stroop task (or as referred to by others, the size congruity task) and intentional processing can be assessed by a numerical comparison task (Tzelgov and Ganor-Stern, 2005).
In the numerical Stroop paradigm, subjects are presented with two numerical stimuli on a computer screen and required to compare these stimuli according to their physical size. The stimuli can be incongruent (the physically larger digit is numerically smaller, e.g., 2 4), neutral (the stimuli differ only in the relevant dimension, e.g., 2 2), or congruent (the physically larger digit is also numerically larger, e.g., 2 4). Even when instructed to ignore the numerical value, healthy adult subjects show a strong congruity effect (longer reaction times for incongruent trials compared to congruent trials) because the numerical value is processed automatically. This congruity effect, which is termed size congruity effect, has been considered for almost 20 years as a marker of automatic numerical processing (Henik and Tzelgov, 1982; Tzelgov et al., 1992; Schwarz and Heinze, 1998; Schwarz and Ischebeck, 2003; Szucs et al., 2007; Cohen Kadosh et al., 2008b, 2011; Van Opstal et al., 2008b; Gebuis et al., 2009; Rubinsten and Henik, 2009; Santens and Verguts, 2011). It has been shown that those who have better numerical abilities exhibit a greater level of automaticity as reflected by a larger size congruity effect (Girelli et al., 2000; Rubinsten et al., 2002; Rubinsten and Henik, 2005, 2006; Cohen Kadosh et al., 2007b; Mussolin and Noël, 2008).
In a numerical comparison task, which assesses intentional numerical processing (Tzelgov and Ganor-Stern, 2005), subjects are asked to attend to the numerical dimension and to compare stimuli according to their numerical value. One of the most used effects to assess the efficiency of intentional numerical processing is the numerical distance effect (Moyer and Landauer, 1967). As the name implies, the difference in numerical value influences the time needed to compare stimuli; the larger the numerical distance (e.g., 2–8 vs. 2–3), the easier it is to decide which of the numbers has the greater (or smaller) numerical value, as indicated by a shorter reaction time (RT) for pairs with a larger numerical distance. It has been shown that the better the numerical abilities are, the smaller the numerical distance effect (Sekular and Mierkiewicz, 1977; Price et al., 2007; Holloway and Ansari, 2009; Mussolin et al., 2010; Bugden and Ansari, 2011). However, it must be noted that a smaller numerical distance effect does not indicate necessarily better numerical abilities. For example, the numerical distance effect can be smaller due to slower processing time of the larger distance, which clearly reflects an impairment in the intentional processing of numerical information (for a review see Sandrini and Rusconi, 2009).
The current knowledge in the field of numerical cognition does not allow us to settle on whether automatic and intentional processing are parts of the same mechanism or not. Previous behavioral, neuroimaging, modeling, and neuropsychological studies have yielded mixed results. For example, a recent behavioral study has shown that intentional processing of numerical information is correlated with mathematical achievement scores, while no such correlation has been obtained for automatic numerical processing (Bugden and Ansari, 2011). In contrast, others have found that highly automatic numerical processing is associated with intact intentional numerical processing such as mathematical abilities, while impaired automatic numerical processing is associated with low mathematical abilities (i.e., developmental dyscalculia; Rubinsten and Henik, 2009). Similarly, some neuroimaging studies have suggested that different brain areas are associated with intentional vs. automatic numerical processing (Kaufmann et al., 2005; Tang et al., 2006), while others have challenged these findings (Schwarz and Heinze, 1998; Szucs et al., 2007). Furthermore, one of the assumptions of a recent computational model is that the size congruity effect, which signals automatic numerical processing, and the numerical distance effect, related to intentional numerical processing, originate from different mechanisms (Santens and Verguts, 2011), see also (Cohen Kadosh et al., 2008a; Van Opstal et al., 2008a). In contrast, another work has suggested that both effects stem from the same source (Schwarz and Ischebeck, 2003). However, all the aforementioned studies have examined the relationship between brain and behavior in a correlative fashion, and hence do not allow for causal inference.
In the current study, we used transcranial magnetic stimulation (TMS), a non-invasive brain stimulation method, to examine and compare the causal relationship between automatic and intentional numerical processing and the parietal lobes. At the brain level, the intraparietal sulcus (IPS), a brain structure in the parietal lobe, has been shown to be involved in numerical representation in a variety of tasks (for meta-analyses see Cohen Kadosh et al., 2008c; Arsalidou and Taylor, 2011)). In a previous study we have shown that after stimulation to the right IPS, participants showed impairment in automatic processing of numbers, as reflected by a reduced size congruity effect. In contrast, stimulation of the left IPS, or sham stimulation did not affect automatic numerical processing (Cohen Kadosh et al., 2007b). In the current study we used the data that we reported at Cohen Kadosh et al. (2007b) to examine whether this observed impairment in automatic numerical processing will be associated with impairment in intentional numerical processing, as reflected by the numerical distance effect. The predictions are clear: if the same parietal functional asymmetry underlies both automatic and intentional numerical processing, disruption of right IPS, but not left IPS or sham stimulation, will affect both the size congruity effect and the numerical distance effect. Contrarily, if automatic and intentional numerical processing are subserved by a different or no parietal functional asymmetry, a dissociation between the two processes and/or the stimulation sites can be expected. For example, right IPS stimulation could only impair automatic numerical processing as shown previously but not intentional numerical processing, while left IPS stimulation could only impair intentional numerical processing but not automatic numerical processing (double dissociation). Alternatively, both left and right IPS stimulation could impair intentional numerical processing but only right IPS stimulation would impair automatic numerical processing (single dissociation). Any of such result patterns would therefore indicate different brain mechanisms underlying intentional and automatic numerical processing.
Materials and Methods
Determination of Optimal Sample Size
The current study is a conceptual follow-up of our previous work on automatic number processing where we used the identical numerical Stroop task and applied TMS to disrupt left or right IPS activation to induce dyscalculia-like behavior in healthy volunteers (Cohen Kadosh et al., 2007b). In a methodological follow-up, we then (i) quantified the exact behavioral effects induced by TMS using different coil positioning approaches, (ii) calculated the standardized experimental effect sizes, and (iii) conducted a statistical power analysis in order to determine the optimal sample size required to reveal statistical significance. These power analyses revealed that when using fMRI-guided TMS neuronavigation, five participants are sufficient to reveal the revealed, or any greater, behavioral effect of parietal TMS on automatic numerical processing as statistically significant (Sack et al., 2009). In the current study, we now aimed to examine whether this observed impairment in automatic numerical processing is also associated with impairment in intentional numerical processing, as reflected by the numerical distance effect. In the context of the current research question, we determined the optimal sample size based on our previous studies (Cohen Kadosh et al., 2007b; Sack et al., 2009) using the following procedure and parameters: first, alpha was conventionally defined to be statistically at an α-error-probability of 5% and beta to be at an β-error-probability of 20%, resulting in a test power of (1-beta) = 80%. The expected experimental effect size was estimated based on the effect size on the SCE as revealed in Sack et al., 2009; where fMRI-guided TMS over PPC resulted in an effect size of Cohen’s d = 1.13 for the difference in SCE between sham and TMS; and of f2 = 1.23 for the interaction between TMS and congruency as shown by the two-way repeated measures analysis of variance (ANOVA) with TMS (sham or TMS) and congruency (incongruent, neutral, or congruent) as within-subject factors. The significance level (α), the test power (1-β), the experimental effect (Cohen’s d or f2), and the optimal sample size (opt n) are interdependent, and thus, after determining any three of these parameters, it is possible to calculate the fourth. Using the aforementioned procedure and parameters, we calculated an optimal sample size of n = 5 for our current study, now aiming to reveal whether under these conditions, fMRI-guided TMS over PPC would likewise statistically impair intentional numerical processing based on the same sample size.
Note that using a small sample size may lead to underpowered analyses, thus the likelihood of making a type I error is the primary concern. However, as the results below indicate, this has not been the case as the highest order interaction has been observed.
Participants
Five participants (four males, mean age = 28.6 years, SD = 4.5), with normal or corrected-to-normal vision and no history of neurological or psychiatric disorders, participated in this study and gave their inform consent. None of the participants had taken part in a TMS experiment before. Ethical approval was given by the local medical ethical committee in Maastricht University, The Netherlands. All the participants were recruited from an academic environment.
Stimuli and paradigm
The participants were asked to decide which of two visually presented digits had a larger physical size or numerical value. These conditions were presented in separate blocks. The stimuli, 0.8° or 1.1° vertical visual angles in size, appeared at the center of a screen, and were separated center-to-center by 4° horizontal visual angles. In the small numerical distance condition the numerical difference between the two digits was one unit (the pairs 1–2, 3–4, and 8–9). In the large numerical distance condition the numerical difference between the two digits was six units (the pairs 1–7, 2–8, and 3–9).
Each trial began with an asterisk as a fixation point, presented for 500 ms at the center of a computer screen. Five hundred millisecond after the fixation point disappeared, a pair of visual digits appeared for 1 s. The inter-trial interval was 6 s, and the inter-block interval was at least 15 s.
Procedure
Participants were instructed to decide which one of two digit stimuli in a given display was either physically or numerically larger (Figure 1). They had to indicate their choice by pressing the key corresponding to the side of the display with the selected digit (right hand if the right stimulus was larger, and left hand if the left stimulus was larger). Participants were encouraged to respond as quickly as possible while avoiding mistakes, and to attend only to the relevant dimension in each task (i.e., physical or numerical size). Presentation software (Neurobehavioral Systems, San Francisco, CA, USA) was used to present the stimuli and record the speed and accuracy of the behavioral responses. The experiment was preceded by a training session.
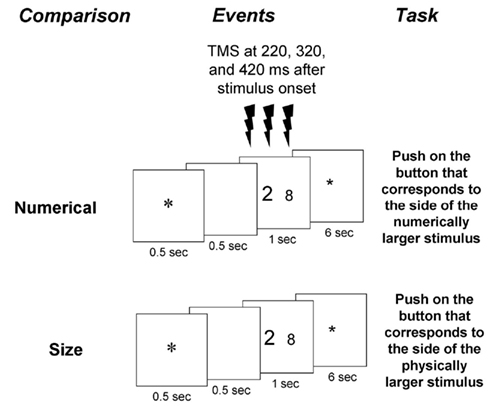
Figure 1. Experimental paradigm. Two tasks were presented in separate blocks: a physical size comparison task and a numerical comparison task. The numerical values appeared in these tasks can affect automatic and intentional numerical processing, respectively. Each pair of stimuli was preceded by a fixation point and a blank of 500 ms each, and remained visible for 1 s. After an inter-trial interval of 6 s a new trial began with the presentation of a fixation point. Responses were indicated by a button press on the side corresponding to the larger relevant dimension. Triple-pulse TMS at 60% of the maximum stimulator output was applied at 220, 320, and 420 ms after stimulus onset.
TMS experiment
Each volunteer underwent four TMS sessions spread over two different days. The order of numerical and physical blocks was counterbalanced in an ABBA design for three participants and in a BAAB design for the rest. The order of real and sham stimulation to the left IPS and right IPS (four sessions) was also counterbalanced. On each day two sessions took place. Per day, participants received real TMS to one hemisphere and sham TMS to the other hemisphere. The stimulation order for the fifth participant was randomly chosen. Participants underwent event-related triple-pulse TMS while comparing two-digits with regards to either numerical value or physical size. Triple-pulse TMS (Medtronic Functional Diagnostics A/S, Skovlunde, Denmark; maximum stimulator output, 2 T) was applied at 220, 320, and 420 ms after stimulus onset at 60% of maximum stimulator output. We chose the timing of the pulses based on previous ERP studies that found modulation of the different ERP components by the numerical distance and size congruity (e.g., Cohen Kadosh et al., 2007a; Libertus et al., 2007; Szucs et al., 2007).
Small and large numerical distances were randomly sampled with an equal sampling for each condition. A total of 576 trials were presented to each participant [36 trials × 4 sessions (right TMS, left TMS, right sham, left sham) × 2 numerical distances (small, large) × 2 tasks (physical/numerical), for the numerical distance effect analysis; 24 trials × 4 sessions (right TMS, left TMS, right sham, left sham) × 3 congruity (congruent, neutral, incongruent) × 2 tasks (physical/numerical), for the size congruity effect analysis]. Correct responses had to be made equally often with the left and right hand. Please note that the analysis of the numerical distance effect and congruity effect has been made based on the same behavioral data. That is based on for calculating the congruity effect we included the congruity conditions (across numerical distances), and for the numerical distance effect we included the different numerical distance conditions (across congruity conditions).
Mean RTs for each participant in each condition were calculated for correct trials only. RTs that were 2.5 SDs from the mean of each condition for each individual were excluded (less than 2%).
fMRI localizer
The exact TMS target site within left and right IPS was determined individually using an fMRI localizer session (Cohen Kadosh et al., 2007b). Hence, prior to the TMS study, each participant underwent an fMRI session consisting of three runs, with each run being composed of eight blocks of numerical comparisons and eight blocks of physical size comparisons. Whole brain fMRI data were acquired with a Siemens 3 T scanner (“Allegra,” Siemens, Erlangen, Germany). Functional images were acquired using a gradient-echo echo planar imaging sequence (16 axial slices; repetition time/echo time = 2500/30 ms; flip angle = 90°, field of view = 192 mm × 192 mm, voxel size: 3 mm × 3 mm × 5 mm). Stimulus presentation was synchronized with the fMRI sequence at the beginning of each trial. Each scanning session included the acquisition of a high-resolution T1-weighted 3-D volume using MPRAGE sequence (echo time 4 ms, 256 × 256 × 192 matrix, voxel dimensions = 1 mm × 1 mm × 1 mm) for co-registration and anatomical localization of functional data. Data were pre-processed and analyzed using the BrainVoyager QX 1.4 software package (BrainInnovation, Maastricht, The Netherlands). The first two volumes of each run were discarded to allow for T1 equilibration. The remaining functional data sets were co-registered to Talairach-transformed anatomical data (Talairach and Tournoux, 1988) and 3-D motion-corrected for each participant. The 3-D functional data set was re-sampled to a voxel size of 3 mm × 3 mm × 3 mm. Further preprocessing included spatial smoothing with a Gaussian kernel (full-width at half-maximum = 8 mm, for the group analysis, and 3 mm for the individual analysis), linear trend removal, temporal high pass filtering (high pass: 0.00647 Hz), and autocorrelation removal. The predictor time courses (box-car functions) were convolved with a gamma distribution to account for the shape and delay of the hemodynamic response (Boynton et al., 1996).
The main purpose of these fMRI measurements was to individually map the exact activation network underlying the comparison tasks (Cohen Kadosh et al., 2007b), and to localize the individual activation hot spot underlying the size congruity and numerical distance effect using frameless stereotaxic TMS Neuronavigation (BrainVoyager TMS Neuronavigator).
fMRI-guided TMS neuronavigation
By superimposing the functional data on the anatomical reconstruction of the brain, the TMS coil can be neuronavigated to a specific anatomical and/or functional activation area of every participant, thus increasing the statistical power by optimizing the functional accuracy of TMS and significantly reducing the number of subjects needed to obtain statistical significance of a given effect size, as recently quantified using power analysis on different TMS localization approaches (Sack et al., 2009).
Individual imaging-guided TMS neuronavigation was performed using BrainVoyager TMS Neuronavigator. This system consists of several miniature ultrasound transmitters which are attached to the participant’s head as well as to the TMS coil. These ultrasound markers continuously transmit ultrasonic pulses to a receiving sensor device. The measurement of the relative spatial position of these transmitters in 3-D space is based on the travel time of the transmitted ultrasonic pulses to three microphones built into the receiving sensor. In the next step, local spatial coordinate systems are created by linking the relative raw spatial position of the ultrasound senders to a set of fixed additional landmarks on the participant’s head. The specification of these fixed landmarks is achieved via a digitizing pen that also hosts two transmitting ultrasound markers in order to measure its relative position in 3-D space. The nasion and the two incisurae intertragicae were used as the three anatomical landmarks in order to define the local coordinate system. After this stage, the system provides topographic information of the head ultrasound transmitters relative to a participant-based coordinate frame. Similarly, the TMS coil also hosts a set of ultrasound transmitters whose relative spatial positions are linked to fixed landmarks specified on the coil in order to calculate another local coordinate system. Once the local spatial coordinate system is defined for the participant’s head and the TMS coil in real 3-D space, these coordinate systems have to be co-registered with the coordinate system of the MR space. For TMS–fMRI co-registration, the same digitized landmarks on the participant’s head are specified on the head representation (mesh) of the participant in the fMRI software. Hence, using the BrainVoyager software, the anatomical landmarks were identified in the MRI scan of the participant’s head and co-registered with the coordinates from the digitizer. After the landmarks specified on the real head are co-registered with those on the mesh head, movements of the TMS coil relative to the head of the participant in real space are registered online and visualized in real-time at correct positions relative to the participant’s anatomical reconstruction of the brain. By superimposing the functional data on the anatomical reconstruction of the brain, the TMS coil can be neuronavigated to a specific anatomical and/or functional activation area of every participant. In contrast to the fMRI group analysis, TMS neuronavigation was based on data in AC–PC space (rotating the cerebrum into the anterior commissure–posterior commissure plane). This was done in order to avoid any additional transformations that could distort the correspondence between MRI and stereotaxic points.
Using this system, we online navigated the TMS coil to the individual activation hot spot as revealed by fMRI for the congruity effect only, and monitored its position accuracy throughout the TMS measurements. This has been done, as we had to choose a single hot spot for stimulation during the behavioral task, in which both size congruity effect and numerical distance effect been computed from. Otherwise, targeting the TMS coil to different foci that showed congruity effect and numerical distance effect would have not allowed examining if both effects derived from the same stimulated area. The same threshold has been used for all participants to identify the activation hotspots [automatic FDR threshold (q = 0.05)].
Results
Size Congruity Effect
As described elsewhere (Cohen Kadosh et al., 2007b), the size congruity effect interacted with TMS. In brief, we observed an interaction between TMS (right, left, or sham) and congruity (congruent, neutral, and incongruent) [F(4,16) = 4.17, MSE = 415, p < 0.05,  = 0.51]. As illustrated in Figure 2A, the size congruity effect decreased after stimulation to the right IPS [56 ms, F(1,4) = 13.88, MSE = 1,129, p < 0.05,
  = 0.78], as compared to no observed effect under the left IPS stimulation [109 ms, F(1,4) = 12.64, MSE = 4,654, p < 0.05,
  = 0.76], or under sham stimulation [90 ms, F(1,4) = 20.61, MSE = 1,942, p < 0.01,
  = 0.84, for a more in depth analysis see (Cohen Kadosh et al., 2007b)]. Here, we focused on a new analysis, comparing the previously established TMS-effects on automatic size congruity performance, with the intentional numerical distance effect calculated on the same data. Please note that the data on the numerical distance effect is independent of the data used to calculate the size congruity effect. That is, albeit the calculation of both effects is based on the same data from the same participants, the calculation of the numerical distance effect is orthogonal to the one used for the size congruity effect. That is, the numerical distance effect includes the comparison between small and large numerical distances across congruity conditions, while the size congruity effect includes the comparison of congruity conditions across small and large numerical distances.
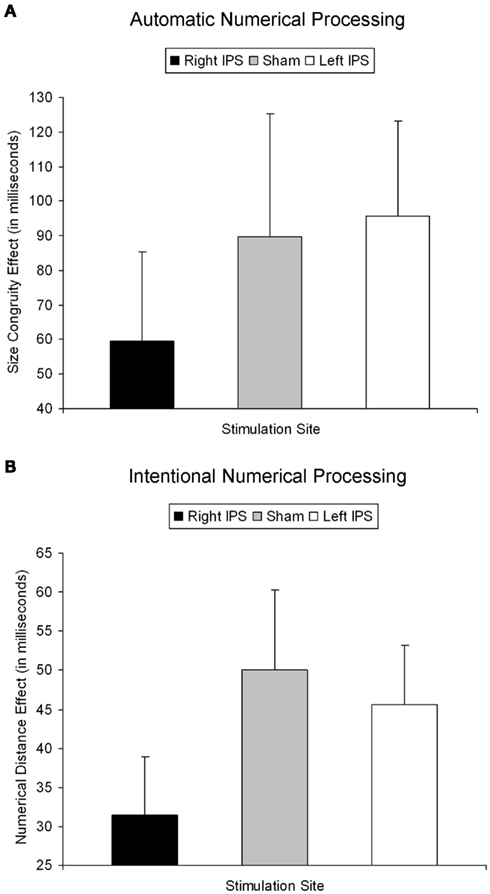
Figure 2. Behavioral effect for automatic and intentional numerical processing [(A,B) respectively]. (A) The size congruity effect for the right IPS, sham, and left IPS stimulation. Only TMS over the right IPS decreased automatic numerical processing as indicated by a significantly reduced size congruity effect. (B) The numerical distance effect for the right IPS, sham, and left IPS stimulation. Only TMS over right IPS decreased intentional numerical processing as indicated by a significantly reduced numerical distance effect. Hence, the same functional parietal asymmetry seems to underlie automatic and intentional numerical processing. Error bar reflects one SE of mean.
Numerical distance effect: Reaction time
The mean RTs were subjected to a three-way ANOVA with TMS (left IPS, right IPS, or sham), task (physical or numerical comparison), and numerical distance (1-unit or 6-units) as within-subject factors. The main effects for task (physical, 456 ms; numerical, 527 ms) [F(1,4) = 51.61, MSE = 1,442, p = 0.001,  = 0.93], and numerical distance (1-unit, 501 ms; 6-units, 482 ms) [F(1,4) = 35.71, MSE = 153, p < 0.005,
  = 0.9] were significant. In addition, the interaction between task and numerical distance [F(1,4) = 33.35, MSE = 244, p < 0.005,
  = 0.9], and most importantly, the triple interaction between TMS, task, and numerical distance [F(2,8) = 8.12, MSE = 46 p = 0.01,
  = 0.67, Table 1 and Figure 2B] were significant. The triple interaction was due to a smaller numerical distance effect in the numerical comparison task when the participants received TMS over right IPS (31 ms) compared to TMS over left IPS or sham stimulation (46 and 50 ms, respectively). In contrast, no differences with regard to numerical distance were found for the physical size comparison. We used interaction contrasts analysis (Boik, 1979), a post hoc analysis of the individual cells of the significant interaction, by giving weights simultaneously to all the relevant variables. In this case one can compare at least two levels in each of the variables at the same time. The interaction contrasts analysis yielded a partial eta square of 0.81 for right IPS TMS vs. left IPS TMS and sham (−2, 1, 1) and the two-way interaction between task and numerical distance [F(1,4) = 16.87, MSE = 41, p = 0.01]. In contrast, the same analysis of left IPS TMS vs. sham (−1, 1) and the two-way interaction between task and numerical distance yielded a partial eta square of only 0.19 (F < 1).
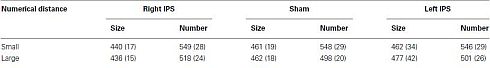
Table 1. Reaction time (in milliseconds) a function of TMS, task, and numerical distance.
Previous studies have shown that congruity and numerical distance might interact (Schwarz and Ischebeck, 2003; Szucs and Soltesz, 2007; Cohen Kadosh et al., 2008b; Gebuis et al., 2010). When examining whether congruity modulated the triple interaction between TMS, task, and numerical distance, the effect was not significant [F(4,16) = 1.41, MSE = 904, p = 0.27, for the four-way interaction between TMS, task, congruity, and numerical distance]. Nevertheless, to test whether the current effect was only due to non-neutral trials, we further examined whether the same pattern of the numerical distance effect, as has been obtained for different stimulation sites, was also found for the neutral condition, when no variation in physical size occurred, thus mimicking the more traditional numerical distance effect (Moyer and Landauer, 1967; Holloway and Ansari, 2009). When taking only the neutral trials the same pattern of numerical distance effect has been obtained (including a three-way interaction between TMS, task, distance [F(2,8) = 3.77, MSE = 284, p = 0.07,  = 0.49]. Namely, the distance effect for right TMS was not significant [14 ms, t(4) = 0.79, p = 0.47], while it was significant for the sham condition [46 ms, t(4) = 2.54, p = 0.03, one-tailed, Cohen’s d = 1.18], and left TMS [54 ms, t(4) = 5.03, p = 0.004, one-tailed, Cohen’s d = 0.94].
As described in the introduction, smaller numerical distances have been associated with better intentional processing. We examined whether this was the case in the current experiment. If the smaller numerical distance effect would have stemmed from a decrease in RTs for the 1-unit numerical distance, this would indicate a better intentional processing. However, if the current effect was due to an increase in RTs for the 6-units numerical distance, this would indicate that the current effect originates from impairment in intentional numerical processing. The current results supported the latter possibility. Namely, interaction contrasts analysis yielded a partial eta square of 0.67 for right IPS TMS vs. left IPS TMS and sham (−2, 1, 1) and the contrast between 6-units numerical distance in the numerical task and the physical task (with the latter serving as a baseline of general processing time, as numerical distance did not play any role in physical task (all p’s > 0.2; see Table 1) [F(1,4) = 8.16, MSE = 543, p < 0.05]. In contrast, the same analysis of right IPS TMS vs. left IPS TMS and sham (−2, 1, 1) and the contrast between 1-unit numerical distance between the numerical task and the physical task was not significant and yielded a partial eta square of only 0.27 [F(1,4) = 1.47, MSE = 584, p > 0.29].
These analyses show that TMS over right IPS impaired intentional numerical processing by decreasing the numerical distance effect when participants compared numerical values, as opposed to sham stimulation or stimulation over left IPS, which had no significant effects on behavioral performance.
Numerical distance effect: Error rates
The average error rate was 4.3%. In contrast to the significant triple interaction found when comparing RTs, this pattern was not found with regard to behavioral accuracy [F(2,8) = 0.09, MSE = 0.002, p > 0.91]. In addition, the correlation between RTs and error rates was not significant, but followed the positive trend, thus excluding any speed-accuracy tradeoff explanation [t(4) = 1.8, r = 0.49, p > 0.1, two-tailed].
Comparing Individual Activation Hot Spots for the Size Congruity Effect and the Numerical Distance Effect
To assess whether the current results showed a right IPS, but not left IPS necessity for the size congruity effect and whether the numerical distance effect was due to a larger variability of activation in the left IPS vs. the right IPS, we co-registered the activations for the size congruity effect and the numerical distance effect to Talairach-transformed anatomical data (Talairach and Tournoux, 1988, see Materials and Methods), and projected the individual activation onto a population-averaged human brain using Caret1 (Van Essen et al., 2001) and SumDB2 (Van Essen, 2002). The spatial distribution of the size congruity effect and the numerical distance effect in the IPS is presented in Figure 3 and gives a strong impression against a systematic difference between the right and left IPS. We further examined this issue by using inferential statistics. We entered all activations in the IPS into a three-way ANOVA, with effect (size congruity, numerical distance), hemisphere (left, right), and Talairach coordinates (TCs; X, Y, Z), as within-subjects factors. As indicated from Figure 3 the main effect for effect, as well as its interaction with other factors including the critical three-way interaction between effect, hemisphere, and TCs [F(2,8) = 0.15, MSE = 81.4, p > 0.85] was not significant.
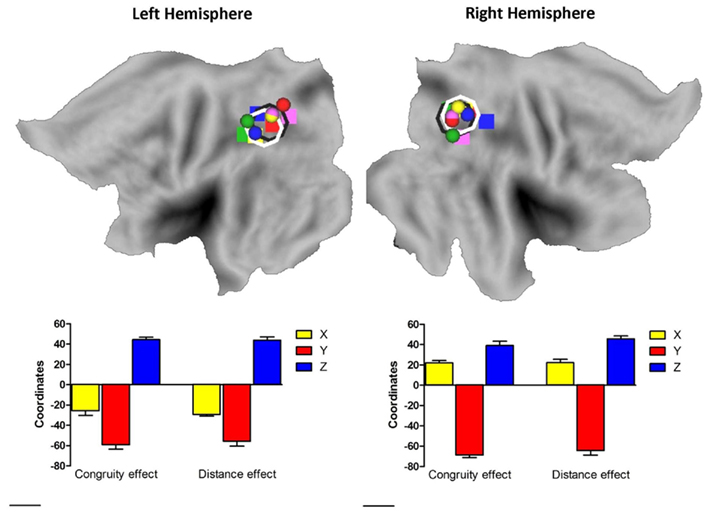
Figure 3. Plotting individual activation hot spot for the size congruity effect and the numerical distance effect. Individual activation hot spot for the size congruity effect (sphere) and the numerical distance effect (rectangular) as used for the TMS neuronavigation study plotted on a flat brain using Caret (Van Essen et al., 2001; Van Essen, 2002). Different colors represent different individuals. As can be seen, the average coordinates for the size congruity effect and the numerical distance effect in each hemisphere show a substantial overlap. This is indicated by the black and white rings in each hemisphere (size congruity and numerical distance, respectively) and by the bottom graphs (each graph depicts the average coordinates from the hemisphere above it).
Discussion
The current study examined whether automatic and intentional numerical processing rely on the same hemispheric asymmetry in the parietal cortex. More concretely, we disrupted either left or right parietal cortex functioning in the same subject sample during automatic and intentional numerical processing to compare the lateralized effects of these TMS-induced parietal “lesions” on both processes. We assessed whether automatic and intentional numerical processing, reflected by the size congruity effect and the numerical distance effect, respectively, are equally or differentially affected by unilateral TMS over the left or right IPS, a key region for numerical cognition (Ansari, 2008; Cohen Kadosh et al., 2008c; Willmes, 2008; Cohen Kadosh and Walsh, 2009; Cappelletti and Cipolotti, 2010; Houde et al., 2010). As previously shown, automatic numerical processing is impaired by right IPS disruption, in contrast to left IPS and sham stimulation which have no effect. If the same pattern would be observed with regard to intentional processing, this would imply similar brain mechanisms or a similar parietal functional asymmetry underlying both functions.
After stimulation over the right IPS we observed impairment in automatic as well as intentional numerical processing. In contrast, sham stimulation and stimulation over the left IPS affected neither automatic, nor intentional numerical processing. This result provides causal evidence for the idea that automatic and intentional processing are based on a shared mechanism, at least within the parietal cortices and in the case of numerical cognition. Note that when discussed mechanism in the current context, we refer to the anatomical level, rather than neuronal level, as it might be that different neuronal populations subserved different processes at the same anatomical level (cf. Cohen Kadosh and Walsh, 2009).
A possible limitation to the current study might have been the small number of subjects, which is not a rare scenario in the case of TMS–fMRI studies (Chambers et al., 2004; Ruff et al., 2006; Sack et al., 2006), as the addition of fMRI, while been more complicated, and expensive, allows to reduce irrelevant variance, and increase to increase the statistical power (Sack et al., 2009). One might argue that ANOVA is not the suitable methods for analysis, due to a possible violation of normality. While some have suggested that violation of normality even with small sample can still lead to meaningful results (Glass et al., 1972), one might suggest to use non-parametric tests, which are less powerful, and those might lead to a type II error. Nevertheless, we also examined whether the current effects can be observed when one use a non-parametric tests. Indeed, in all the cases the numerical distance and effect and the size congruity effect under right TMS did not reach the level of significant, while they were still significant under sham and left TMS. This, together with the fact that the current interactions and pattern of results were obtained for two different effects, increase the validity of the current findings, and reduce the likelihood of a Type I error.
While the coordinates over the left and right IPS were indistinguishable for both automatic and international processing, descriptively, the activation on the right parietal was more diffuse than the left parietal (size congruity effect: left parietal, 1271 voxels, right parietal, 1454 voxels; distance: left parietal, 11499 voxels; right parietal, 14215 voxels). However, these differences were small, and could have biased toward a greater effect over the left hemisphere, as the activation there was more focus, and therefore more amenable to TMS than the more diffuse activation on the right hemisphere. However, at this stage there is no knowledge how (and if) the size of activation correlates with the effect of TMS, and this should be a goal of future methodological studies.
The current results challenge previous findings which reported dissociations between intentional and automatic processing (Kaufmann et al., 2005; Tang et al., 2006; Bugden and Ansari, 2011; Santens and Verguts, 2011). However, it is known that the mere finding of a dissociation does not necessarily imply different underlying mechanisms (e.g., Shallice, 2003). Similarly, neuroimaging studies which reported differential brain activation during intentional and automatic processing provided only correlational evidence. In recent years, neuropsychological studies as well as “virtual” lesion studies using non-invasive functional brain stimulation have shown that brain activation during task execution does not necessarily imply that this brain area is necessary for the given psychological function (Price and Friston, 2002; Walsh and Pascual-Leone, 2003; Bien et al., 2009; Sack, 2009). In contrast, the current study provides strong evidence for a causal relationship between the right, but not left, IPS and the mechanism, which processes numbers both automatically and intentionally.
It must be noted that these results do not rule out the possibility that automatic and intentional processing show a double dissociation in other parts of the brain (e.g., the prefrontal cortex, Cohen Kadosh and Walsh, 2009) or at different time windows than the ones used here, or that automatic and intentional processing of other dimensions (e.g., reading, time perception) might be subserved by different mechanisms. However, what can be concluded here is that the same parietal functional asymmetry seems to underlie both, automatic and intentional numerical processing with only the right, but not left, IPS being causally relevant for successful performance during both tasks. We hope that future studies will take this question further, also in the context of other brain regions or for other cognitive domains, thereby advancing our understanding of the relationship between intentional and automatic processing and various cognitive mechanisms per se (Palmeri, 2002; Tzelgov and Ganor-Stern, 2005). Such studies will reveal important insights also for the neural, developmental, and educational bases of automatic vs. intentional processing (Girelli et al., 2000; Rubinsten et al., 2002; Cohen Kadosh and Walsh, 2009; Reis et al., 2009; Rubinsten and Henik, 2009; Bugden and Ansari, 2011).
Conflict of Interest Statement
The authors declare that the research was conducted in the absence of any commercial or financial relationships that could be construed as a potential conflict of interest.
Acknowledgments
Roi Cohen Kadosh is supported by the Wellcome Trust (WT88378), Alexander T. Sack, and Nina Bien are supported by a grant to Alexander T. Sack from the Dutch Organization for Scientific Research (NWO 452-06-003). We thank our medical supervisor Cees van Leeuwen, and our independent physician Martin van Boxtel.
Footnotes
References
Ansari, D. (2008). Effects of development and enculturation on number representation in the brain. Nat. Rev. Neurosci. 9, 278–291.
Arsalidou, M., and Taylor, M. (2011). Is 2 + 2 = 4? Meta-analyses of brain areas needed for numbers and calculations. Neuroimage 54, 2382–2393.
Bien, N., Roebroeck, A., Goebel, R., and Sack, A. T. (2009). The brain’s intention to imitate: the neurobiology of intentional versus automatic imitation. Cereb. Cortex 19, 2338–2351.
Boik, R. J. (1979). Interactions, partial interactions, and interaction contrasts in the analysis of variance. Psychol. Bull. 86, 1084–1089.
Boynton, G. M., Engel, S. A., Glover, G. H., and Heeger, D. J. (1996). Linear systems analysis of functional magnetic resonance imaging in human V1. J. Neurosci. 16, 4207–4221
Bugden, S., and Ansari, D. (2011). Individual differences in children’s mathematical competence are related to the intentional but not automatic processing of Arabic numerals. Cognition 118, 35–47.
Cappelletti, M., and Cipolotti, L. (2010). “The neuropsychology of acquired calculation disorders,” in Handbook of Clinical Neuropsychology, 2nd Edn, eds P. Halligan, U. Kischka, and J. C. Marshall (New York: Oxford University Press), 401–417.
Chambers, C. D., Payne, J. M., Stokes, M. G., and Mattingley, J. B. (2004). Fast and slow parietal pathways mediate spatial attention. Nat. Neurosci. 7, 217–218.
Cohen Kadosh, R., Brodsky, W., Levin, M., and Henik, A. (2008a). Mental representation: what can pitch tell us about the distance effect? Cortex 44, 470–477.
Cohen Kadosh, R., Henik, A., and Rubinsten, O. (2008b). Are Arabic and verbal numbers processed in different ways? J. Exp. Psychol. Learn. Mem. Cogn. 34, 1377–1391.
Cohen Kadosh, R., Lammertyn, J., and Izard, V. (2008c). Are numbers special? An overview of chronometric, neuroimaging, developmental and comparative studies of magnitude representation. Prog. Neurobiol. 84, 132–147.
Cohen Kadosh, R., Cohen Kadosh, K., Linden, D. E. J., Gevers, W., Berger, A., and Henik, A. (2007a). The brain locus of interaction between number and size: a combined functional magnetic resonance imaging and event-related potential study. J. Cogn. Neurosci. 19, 957–970.
Cohen Kadosh, R., Cohen Kadosh, K., Schuhmann, T., Kaas, A., Goebel, R., Henik, A., and Sack, A. T. (2007b). Virtual dyscalculia induced by parietal-lobe TMS impairs automatic magnitude processing. Curr. Biol. 17, 689–693.
Cohen Kadosh, R., Gevers, W., and Notebaert, W. (2011). Sequential analysis of the numerical Stroop effect reveals response suppression. J. Exp. Psychol. Learn. Mem. Cogn. 37, 1243–1249.
Cohen Kadosh, R., Soskic, S., Iuculano, T., Kanai, R., and Walsh, V. (2010). Modulating neuronal activity produces specific and long lasting changes in numerical competence. Curr. Biol. 20, 2016–2020.
Cohen Kadosh, R., and Walsh, V. (2009). Numerical representation in the parietal lobes: abstract or not abstract? Behav. Brain Sci. 32, 313–373.
Gebuis, T., Cohen Kadosh, R., De Haan, E., and Henik, A. (2009). Automatic quantity processing in 5-year olds and adults. Cogn. Process. 10, 133–142.
Gebuis, T., Leon Kenemans, J., De Haan, E. H. F., and Van Der Smagt, M. J. (2010). Conflict processing of symbolic and non-symbolic numerosity. Neuropsychologia 48, 394–401.
Girelli, L., Lucangeli, D., and Butterworth, B. (2000). The development of automaticity in accessing number magnitude. J. Exp. Child. Psychol. 76, 104–122.
Glass, G. V., Peckham, P. D., and Sanders, J. R. (1972). Effects analyses of variance and covariance consequences of failure to meet assumptions underlying the fixed effects analyses of variance and covariance. Rev. Educ. Res. 42, 237–288.
Henik, A., and Tzelgov, J. (1982). Is three greater than five: the relation between physical and semantic size in comparison tasks. Mem. Cognit. 10, 389–395.
Holloway, I. D., and Ansari, D. (2009). Mapping numerical magnitudes onto symbols: the numerical distance effect and individual differences in children’s mathematics achievement. J. Exp. Child. Psychol. 103, 19–27.
Houde, O., Rossi, S., Lubin, A., and Joliot, M. (2010). Mapping numerical processing, reading, and executive functions in the developing brain: an fMRI meta-analysis of 52 studies including 842 children. Dev. Sci. 13, 876–885.
Kaufmann, L., Koppelstaetter, F., Delazer, M., Siedentopf, C., Rhomberg, P., Golaszewski, S., Felber, S., and Ischebeck, A. (2005). Neural correlates of distance and congruity effects in a numerical Stroop task: an event-related fMRI study. Neuroimage 25, 888–898.
Lewis, P. A., and Miall, R. C. (2003). Distinct systems for automatic and cognitively controlled time measurement: evidence from neuroimaging. Curr. Opin. Neurobiol. 13, 250–255.
Libertus, M. E., Woldorff, M. G., and Brannon, E. M. (2007). Electrophysiological evidence for notation independence in numerical processing. Behav. Brain Funct. 3, 1.
Logan, G. D. (1985). Skill and automaticity: relations, implications, and future directions. Can. J. Psychol. 39, 367–386.
Moyer, R. S., and Landauer, T. K. (1967). Time required for judgment of numerical inequality. Nature 215, 1519–1520.
Mussolin, C., Mejias, S., and Noel, M. P. (2010). Symbolic and nonsymbolic number comparison in children with and without dyscalculia. Cognition 115, 10–25.
Mussolin, C., and Noël, M.-P. (2008). Automaticity for numerical magnitude of two-digit Arabic numbers in children. Acta Psychol. (Amst) 129, 264–272.
Palmeri, T. J. (2002). “Automaticity,” in Encyclopedia of Cognitive Science, ed. L. Nadel (London: Nature Publishing Group), 390–401.
Price, C. J., and Friston, K. J. (2002). Degeneracy and cognitive anatomy. Trends Cogn. Sci. (Regul. Ed.) 6, 416–421.
Price, G., Holloway, I., Rasanen, P., Vesterinen, M., and Ansari, D. (2007). Impaired parietal magnitude processing in developmental dyscalculia. Curr. Biol. 17, R1042–R1043.
Reis, J., Schambra, H. M., Cohen, L. G., Buch, E. R., Fritsch, B., Zarahn, E., Celnik, P., and Krakauer, J. W. (2009). Noninvasive cortical stimulation enhances motor skill acquisition over multiple days through an effect on consolidation. Proc. Natl. Acad. Sci. U.S.A. 106, 1590–1595.
Rickard, T. C. (1997). Bending the power law: a CMPL theory of strategy shifts and the automatization of cognitive skills. J. Exp. Psychol. Gen. 126, 288–311.
Rossetti, Y., Pisella, L., and Vighetto, A. (2003). Optic ataxia revisited: visually guided action versus immediate visuomotor control. Exp. Brain Res. 153, 171–179.
Rubinsten, O., and Henik, A. (2005). Automatic activation of internal magnitudes: a study of developmental dyscalculia. Neuropsychology 19, 641–648.
Rubinsten, O., and Henik, A. (2006). Double dissociation of functions in developmental dyslexia and dyscalculia. J. Educ. Psychol. 98, 854–867.
Rubinsten, O., and Henik, A. (2009). Developmental dyscalculia: heterogeneity may not mean different mechanisms. Trends Cogn. Sci. (Regul. Ed.) 13, 92–99.
Rubinsten, O., Henik, A., Berger, A., and Shahar-Shalev, S. (2002). The development of internal representations of magnitude and their association with Arabic numerals. J. Exp. Child. Psychol. 81, 74–92.
Ruff, C. C., Blankenburg, F., Bjoertomt, O., Bestmann, S., Freeman, E., Haynes, J.-D., Rees, G., Josephs, O., Deichmann, R., and Driver, J. (2006). Concurrent TMS-fMRI and psychophysics reveal frontal influences on human retinotopic visual cortex. Curr. Biol. 16, 1479–1488.
Sack, A. T., Cohen Kadosh, R., Schuhmann, T., Moerel, M., Walsh, V., and Goebel, R. (2009). Optimizing functional accuracy of TMS in cognitive studies: a comparison of methods. J. Cogn. Neurosci. 21, 207–221.
Sack, A. T., Kohler, A., Linden, D. E. J., Goebel, R., and Muckli, L. (2006). The temporal characteristics of motion processing in hMT/V5+: combining fMRI and neuronavigated TMS. Neuroimage 29, 1326–1335.
Santens, S., and Verguts, T. (2011). The size congruity effect: is bigger always more? Cognition 118, 94–110.
Schwarz, W., and Heinze, H. J. (1998). On the interaction of numerical and size information in digit comparison: a behavioral and event-related potential study. Neuropsychologia 36, 1167–1179.
Schwarz, W., and Ischebeck, A. (2003). On the relative speed account of the number-size interference in comparative judgment of numerals. J. Exp. Psychol. Hum. Percept. Perform. 29, 507–522.
Sekular, R., and Mierkiewicz, D. (1977). Children’s judgement of numerical inequality. Child Dev. 48, 630–633.
Shallice, T. (2003). Functional imaging and neuropsychology findings: how can they be linked? Neuroimage 20, S146–S154.
Szucs, D., and Soltesz, F. (2007). Event-related potentials dissociate facilitation and interference effects in the numerical Stroop paradigm. Neuropsychologia 45, 3190–3202.
Szucs, D., Soltesz, F., Jarmi, E., and Csepe, V. (2007). The speed of magnitude processing and executive functions in controlled and automatic number comparison in children: an electro-encephalography study. Behav. Brain Funct. 3, 23.
Talairach, J., and Tournoux, P. (1988). Co-Planar Stereotaxic Atlas of the Human Brain. New York: Thieme.
Tang, J., Critchley, H. D., Glaser, D., Dolan, R. J., and Butterworth, B. (2006). Imaging informational conflict: a functional magnetic resonance imaging study of numerical Stroop. J. Cogn. Neurosci. 18, 2049–2062.
Tzelgov, J., and Ganor-Stern, D. (2005). “Automaticity in processing ordinal information,” in Handbook of Mathematical Cognition, ed J. I. D. Campbell (New York: Psychology Press), 55–67.
Tzelgov, J., Meyer, J., and Henik, A. (1992). Automatic and intentional processing of numerical information. J. Exp. Psychol. Learn. Mem. Cogn. 18, 166–179.
Tzelgov, J., Yehene, V., Kotler, L., and Alon, A. (2000). Automatic comparisons of artificial digits never compared: learning linear ordering relations. J. Exp. Psychol. Learn. Mem. Cogn. 26, 103–120.
Van Essen, D. C. (2002). Windows on the brain. The emerging role of atlases and databases in neuroscience. Curr. Opin. Neurobiol. 12, 574–579.
Van Essen, D. C., Dickson, J., Harwell, J., Hanlon, D., Anderson, C. H., and Drury, H. A. (2001). An integrated software system for surface-based analyses of cerebral cortex. J. Am. Med. Inform. Assoc. 8, 443–459.
Van Opstal, F., Gevers, W., De Moor, W., and Verguts, T. (2008a). Dissecting the symbolic distance effect: comparison and priming effects in numerical and non-numerical orders. Psychon. Bull. Rev. 15, 419–425.
Van Opstal, F., Moors, A., Fias, W., and Verguts, T. (2008b). Offline and online automatic number comparison. Psychol. Res. 72, 347–352.
Walsh, V., and Pascual-Leone, A. (2003). Transcranial Magnetic Stimulation: A Neurochronometric of Mind. Cambridge, MA: MIT Press.
Keywords: automaticity, congruity effect, distance effect, intentional processing, lateralization, numerical cognition, parietal lobe, brain stimulation
Citation: Cohen Kadosh R, Bien N and Sack AT (2012) Automatic and intentional number processing both rely on intact right parietal cortex: a combined fMRI and neuronavigated TMS study. Front. Hum. Neurosci. 6:2. doi: 10.3389/fnhum.2012.00002
Received: 26 July 2011; Accepted: 06 January 2012;
Published online: 01 February 2012.
Edited by:
Daniel Ansari, University of Western Ontario, CanadaReviewed by:
Roland Grabner, Swiss Federal Institute of Technology Zurich, SwitzerlandMarco Sandrini, National Institute of Health, USA
Copyright: © 2012 Cohen Kadosh, Bien and Sack. This is an open-access article distributed under the terms of the Creative Commons Attribution Non Commercial License, which permits non-commercial use, distribution, and reproduction in other forums, provided the original authors and source are credited.
*Correspondence: Roi Cohen Kadosh, University of Oxford, Oxford OX1 3UD, UK. e-mail:cm9pLmNvaGVua2Fkb3NoQHBzeS5veC5hYy51aw==