 Keren Rosenberg-Katz1,4
 Shahar Jamshy1,5
 Neomi Singer1,6 Ilana Podlipsky1 Svetlana Kipervasser2,4 Fani Andelman3 Miri Y. Neufeld2,4
 Nathan Intrator5 Itzhak Fried3,4,7 Talma Hendler1,4,6*
- 1Tel Aviv Sourasky Medical Center, Functional Brain Imaging Unit, Israel
- 2EEG and Epilepsy Unit, Department of Neurology, Tel-Aviv Medical Center, Israel
- 3Functional Neurosurgery Unit, Tel-Aviv Medical Center, Israel
- 4Sackler School of Medicine, Tel-Aviv University, Israel
- 5School of Computer Science, Tel-Aviv University, Israel
- 6Department of Psychology, Tel-Aviv University, Israel
- 7Department of Neurosurgery, David Geffen School of Medicine and Semel Institute for Neuroscience and Human Behavior, University of California, Los Angeles, CA, USA
Actions are often internally guided, reflecting our covert will and intentions. The dorsomedial prefrontal cortex, including the pre-Supplementary Motor Area (pre-SMA), has been implicated in the internally generated aspects of action planning, such as choice and intention. Yet, the mechanism by which this area interacts with other cognitive brain regions such as the dorsolateral prefrontal cortex, a central node in decision-making, is still unclear. To shed light on this mechanism, brain activity was measured via fMRI and intracranial EEG in two studies during the performance of visually cued repeated finger tapping in which the choice of finger was guided by either a presented number (external) or self-choice (internal). A functional-MRI (fMRI) study in 15 healthy participants demonstrated that the pre-SMA, compared to the SMA proper, was more active and also more functionally correlated with the dorsolateral prefrontal cortex during internally compared to externally guided action planning (p < 0.05, random effect). In a similar manner, an intracranial-EEG study in five epilepsy patients showed greater inter-regional gamma-related connectivity between electrodes situated in medial and lateral aspects of the prefrontal cortex for internally compared to externally guided actions. Although this finding was observed for groups of electrodes situated both in the pre-SMA and SMA-proper, increased intra-cluster gamma-related connectivity was only observed for the pre-SMA (sign-test, p < 0.0001). Overall our findings provide multi-scale indications for the involvement of the dorsomedial prefrontal cortex, and especially the pre-SMA, in generating internally guided motor planning. Our intracranial-EEG results further point to enhanced functional connectivity between decision-making- and motor planning aspects of the PFC, as a possible neural mechanism for internally generated action planning.
Introduction
In everyday life, our actions are guided by either external sources, for example typing a dictated sentence, or internal sources, for example typing a sentence generated in one's head. Although in both instances the sequence of motor actions involved in writing remains the same, there is a fundamental difference between the planning processes of these actions. While externally guided action planning (EGAP) complies with environmental demands and usually includes adaptation to circumstances, internally guided action planning (IGAP) fulfills one's own choice and relies more on self initiation (Prinz, 1997). The relatedness of these planning modes is illustrated in pathological states such as Parkinson's disease, where difficulty in initiating an internally driven action can be overcome by an externally guided sensory cue (Glickstein and Stein, 1991).
Studying the neural correlates of IGAP is not trivial as its mental occurrence is covert, therefore, making reliable experimental probing difficult. Nevertheless, it was shown in monkeys that lesions in the Supplementary Motor Area (SMA), a dorsal aspect of the Medial Prefrontal Cortex (MPFC), resulted in inability to select appropriate movements without the guidance of an external cue (Halsband and Passingham, 1982; Chen et al., 1995). Functional-MRI (fMRI) studies in humans have provided further evidence for an anterior-posterior functional subdivision within the DMPFC, showing that the pre-SMA compared to the SMA proper, is more involved in IGAP than EGAP (Halsband et al., 1994; Deiber et al., 1999; Jenkins et al., 2000; Crosson et al., 2001; Debaere et al., 2003; Tremblay and Gracco, 2006; Mueller et al., 2007).
It is yet unclear whether the SMA subregions interact differently with other brain regions to generate actions, and which mechanism governs such communication. Based on anatomical studies in monkeys (Luppino et al., 1993), as well as Diffusion Tensor Imaging (DTI) study in humans (Johansen-Berg et al., 2004), the pre-SMA, but not the SMA proper, was shown to have anatomical connections with the DLPFC, an area involved in executive functions including decision-making. In accordance, in a resting-state fMRI study, it was shown that the pre-SMA is more functionally connected with cognitive aspects of the lateral-PFC (such as the superior and inferior frontal gyri), while the SMA proper is more connected with motor aspects of the frontal cortex (such as the precentral gyrus) (Kim et al., 2009). Altogether these studies point to a possible mechanism of communication between motor and decision-making related nodes in the generation of human action planning, corresponding to the rostral part of the medial PFC and the lateral PFC, respectively.
In the current study we examined whether connectivity patterns between motor and decision-making nodes could be probed by manipulating the source of action planning; i.e., internal versus external. Specifically we focused on the choice aspect involved in planning finger tapping, by manipulating the source of guidance for selection of one finger out of a possible three to be either visually presented (i.e., externally guided) or self-decided (internally guided). Framed in terms of information theory, actions emanating from internal guidance have a greater degree of freedom and often rely on past experience, thus requiring more information than those derived from external guidance, and are thus likely to be associated with longer response times (Ratcliff, 1978; Brown and Heathcote, 2008). We used a simple motor task of repeated finger tapping that overcomes a common confounder related to the link between the complexity and source of action planning. Indeed our paradigm elicited equal response times to actions performed in both IGAP and EGAP conditions.
To unveil the functional relationship between motor and decision-making aspects of the dorsal PFC we applied both fMRI and Intracranial EEG (iEEG), allowing for high spatial and temporal resolutions of the mapping. By using fMRI we expected to reveal the fine-grained spatial specificity for source of action-planning, with IGAP compared to EGAP evoking greater activation in the pre-SMA than SMA-proper, and enhanced functional connectivity between the pre-SMA and DLPFC. The iEEG study aimed to detect patterns of connectivity between the lateral and medial aspects of the PFC. We used two band indices to detect inter- and intra-region connectivity: phase synchronization and co-activation. We calculated gamma band phase-synchronization as a reflection of distant neuronal communications (Engel and Singer, 2001; Fries, 2005). In contrast, we evaluated amplitude co-activation which is more related to changes within a local neural population (Tass, 2003).
We specifically focused on gamma activity as it was found to be related to both cognitive and motor tasks. Previously, oscillatory synchronization in the gamma band was thought to reflect a binding mechanism that specifically serves perceptual functions (Singer and Gray, 1995; Roelfsema et al., 1997; Tallon-Baudry and Bertrand, 1999). More recently, the concept of synchronization in the gamma band has expanded, with evidence that it is related to cognitive tasks including directing attention (Brovelli et al., 2005; Lachaux et al., 2008; Ray et al., 2008), decision-making (Womelsdorf et al., 2006; Donner et al., 2009), and outcome evaluation (Jung et al., 2010). Additionally, synchronized activity in the gamma band was found to be impaired in Parkinson's disease, in which there are difficulties in movement initiation (Cassidy et al., 2002; Fogelson et al., 2005; Trottenberg et al., 2006; Kuhn et al., 2009). Several studies point to a possible mediating role of gamma synchronization between motor related nodes and cognitive nodes. For example, in an EEG study an association between fronto-parietal induced gamma band activity and reaction time was reported (Gonzalez Andino et al., 2005). This finding may suggest that anticipatory gamma band activity reflects a control mechanism mediating the speed of motor responses. In a subsequent MEG study, gamma activity was found to be enhanced both in the primary somatosensory and motor cortices during fast performance compared to slow performance (Tecchio et al., 2008). Based on these studies, we aim to explore how gamma band synchronization is involved in the interaction between motor and decision-making processes, which are both essential for motor planning, and more so to internally generated action. Specifically, using iEEG we expected to unveil a temporal aspect of such connectivity with IGAP evoking gamma synchronization between electrodes situated in the medial and lateral aspects of the PFC.
Materials and Methods
Study 1: fMRI Experiment in Healthy Participants
Participants
Fifteen healthy right-handed volunteers (seven females; mean age: 26.5, age range: 21–38 years) participated in the fMRI experiment. Participants reported no history of psychiatric or neurological disorders, and no current use of any psychoactive medications. One participant was excluded from the final fMRI analysis due to excessive head movements during the scanning. The research protocol was approved by the Tel Aviv Sourasky Medical Center institutional review board (IRB). All participants provided written informed consent before the experiment.
Finger tapping paradigm
Participants were visually instructed to perform sequences of three button presses with each hand separately using a response box, as illustrated in Figure 1. In the EGAP condition, the presented stimulus comprised of a sequence of displayed images, each containing three identical digits (e.g., 1, 1, 1 or 2, 2, 2) instructing the participants which finger to tap. In the IGAP condition, participants were presented with three identical non-numeric symbols to which they were instructed to tap three times using the same finger. In this condition, participants were explicitly told to respond as randomly and as variably as possible, avoiding using the same finger in each trial of the internally guided condition.
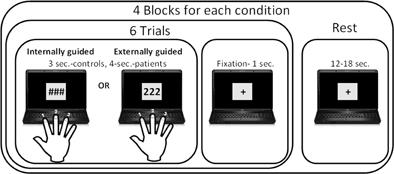
Figure 1. Finger tapping paradigm. Participants were instructed to tap a finger three times according to the visual stimuli: in the externally guided condition they selected a finger according to the number presented, while in the internally guided condition they had free choice of which finger to tap in each trial.
The paradigm was part of a larger study which additionally attempted to differentiate between complexity levels, however, as the current study included data of patients undergoing iEEG, we will focus only on the simple conditions in this paper. The additional two conditions that were also included in the paradigm were either sequences of three different numbers (e.g., 1,2,3 or 2,3,2) cuing for tapping via 2 or 3 different fingers, or three different non-numerical symbols.
There were a total of four blocks for each of the two conditions; i.e., IGAP and EGAP. Each block started with an instruction regarding the hand that should be active for the entire block, followed by presentation of six stimuli belonging to one of the experimental conditions, with a display of either three numbers or symbols, lasting for 2 s followed by 1 s of dot-fixation. Participants were instructed to tap immediately on seeing the image. The task blocks were separated by 15 rest blocks of 12 or 18 s. The entire session lasted 369 s and was performed twice by participants in counterbalanced order. Stimuli delivery and response acquisition were controlled using Presentation software (Neurobehavioral Systems). Stimuli were projected with an LCD projector (NEC, VT660K) onto a screen positioned in front of the participant's forehead and viewed through a tilted mirror. Responses were gathered with an MRI-compatible response box (HH-1 × 4L, Current Designs). The finger tapping behavioral data of response time and accuracy was analyzed using STATISTICA data analysis software [StatSoft, Inc. (2001), version 6].
fMRI acquisition procedure
Imaging was performed on a GE 3T Signa Horizon echo speed scanner with a resonant gradient echoplanar imaging system. Functional images were acquired using a single-shot echo-planar T2*-weighted sequence. The following parameters were used: 96 × 96 matrix; field of view of 20 × 20 cm; 40 slices with 3 mm thickness and no gap. TR=3000 ms, TE=35 ms; flip angle 90°, acquisition orientation was of the AC-PC plane. In addition, each functional scan was accompanied by a three-dimensional (3D) anatomical scan using T1-SPGR sequence (1 × 1 × 1 mm).
fMRI analysis
BrainVoyager QX version 2.1 (Brain Innovation, Maastricht, The Netherlands) was used to analyze the recorded fMRI data (Goebel et al., 2006). The first six functional volumes, before signal stabilization, were excluded from analysis. Preprocessing included the following operations: 3D motion correction using trilinear interpolation, linear trend removal and high-pass filtering. A 4 mm full width at half maximum Gaussian smoothing was used to overcome differences in inter-subject localization. Functional 2D data were manually aligned and coregistered with 3D anatomical data which were normalized into Talairach space. To account for a hemodynamic response, predictors were convolved with standard hemodynamic response filter for all participants. Whole brain analysis was performed using voxel-based general linear model (GLM) in which the various activation blocks were defined as district predictors.
Verification of pre-SMA selectivity for IGAP. At a second level analysis, a random-effect GLM was applied on the individual parameter estimates obtained from the first-level analysis. Direct contrast between IGAP and EGAP was applied in order to validate selective pre-SMA activation for IGAP. In addition, we analyzed this activation change in three regions of interest: SMA-proper, pre-SMA, and DLPFC. These regions were defined functionally as a box-shaped volume of 11 voxels diameter around the peak of activation in all conditions vs. rest contrast. The sub-regions within the SMA were defined according to commonly used markers of AC-PC and its vertical plane through AC (VCA) (Zilles et al., 1995). Hence, the SMA proper box was bordered anteriorly by the VCA line, medially by the midline, and inferiorly by the cingulate gyrus. The pre-SMA was bordered posteriorly by the VCA line, medially by the midline, and inferiorly by the cingulate gyrus. For the DLPFC, the box included the bilateral middle frontal gyrus (MFG) that corresponds to Brodmann area 9. Beta weights were extracted for each of the conditions from each region and submitted to a summary statistical analysis of average and mean.
Functional connectivity analysis. Whole brain functional connectivity analysis was performed using BrainVoyager Granger Causality Mapping (GCM) toolbox (Goebel et al., 2003). The reference seed regions for this analysis were the bilateral pre-SMA and SMA proper. These regions included a margin of nine voxels diameter around the peak of activation. We applied this analysis separately for the IGAP and EGAP conditions performed by the dominant right hand, to describe the functional network for each condition. Contrasts between the resulting whole brain maps were performed via BV using a random effect GLM analysis. Statistical significance thresholds for the functional connectivity maps were computed by bootstrapping and applying a conservative false discovery rate (FDR) with a significance threshold of p < 0.05 for a multiple comparison correction.
Study 2: fMRI/iEEG experiment in patients with epilepsy
Patients
Five patients with epilepsy (three females; mean age: 25, S.D: 9.48) participated in the iEEG experiment. Patients were recruited from the neurosurgery department at the Tel-Aviv Sourasky Medical Center following clinical referral for subdural electrode implantation as part of their pre-surgical evaluation (Dewar et al., 1996). Each patient had a grid and/or strips of electrodes covering the medial and lateral PFC to varying extent.
As part of their pre-surgical evaluation, all patients underwent a standard neuropsychological assessment, which included the Hebrew version of the Wechsler Adult Intelligence and Memory Scales (WAIS-III) (Corporation, 1997). The 12-year-old patient completed the children's intelligence scale (see Table 1 for patients' demographics). The research protocol was approved by the Tel Aviv Sourasky Medical Center IRB. All participants provided written informed consent before the experiment.
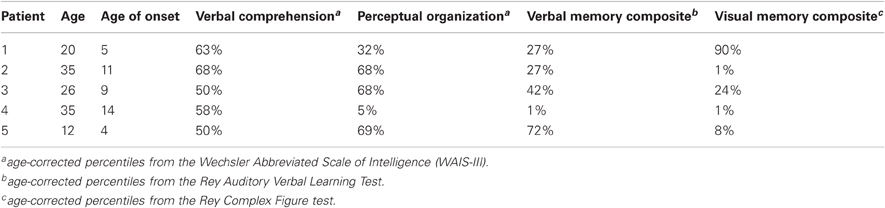
Table 1. Patients demographics and performance during pre-operative neuropsychological assesment.
iEEG experiment. Experiments were conducted on the ward, using a laptop placed in front of the patient sitting in the bed. The finger tapping paradigm was slightly modified for the iEEG experiment consisting of the same conditions; though, each trial was presented for 4 s instead of 3 s (Figure 1). This adjustment was made to enable longer response time for the patients. Overall, each patient performed the paradigm twice, with a total of 48 trials for each of the conditions using only the hand contralateral to the main side of implanted electrodes. To allow for exact timing between the stimulus onset and iEEG recordings, triggers were recorded along with the stimuli. Sampling rate of the EEG was of 200 Hz. The effect of an epileptic attack was minimized by maintaining at least a 3 h interval between a recorded epileptic attack and the experiment. In addition, electrodes which showed local activity during epileptic seizures were excluded.
iEEG Data Acquistion and Analysis
A. Electrode Localization.
Electrode implantation. The electrodes (Adtech, Racine, WI), arranged in one-dimensional strips or 2-dimensional grids, were of 2 mm diameter, separated by an 8 mm gap (Figure 2A1). A total of 281 electrodes were recorded. The locations of electrodes varied between patients and were based solely on clinical considerations. Inclusion in the study was based on presence of electrodes in the medial as well as lateral aspects of the prefrontal cortex. Monopolar recordings referenced to an extra-cranial electrode were used.
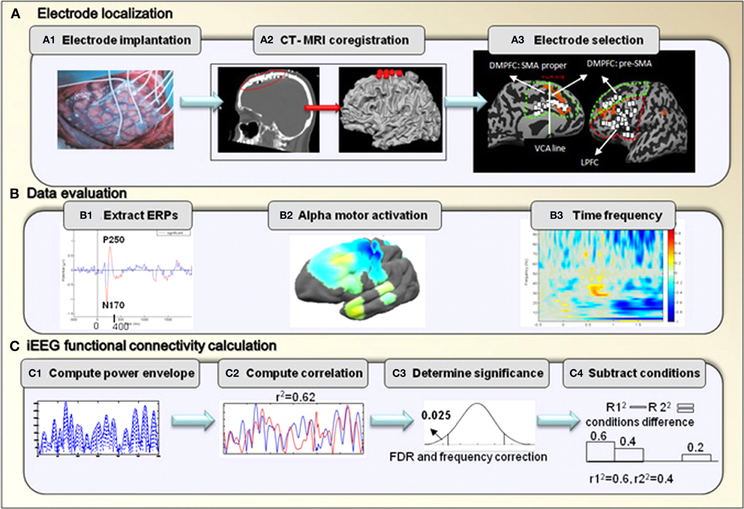
Figure 2. iEEG analysis.(A) Electrode localization. After implantation of electrodes, CT scan was performed to verify electrode location, and was coregistered with pre-operative MRI T1-SPGR images. Data was then evaluated for visual response in posterior temporal electrodes, an example is shown of ERPs response from one patient (#2) (B1). Motor Mu de-synchronization response in the primary motor area is shown using brain power plot maps averaged across all patients (B2). Mean time frequency analysis was used to select the band of gamma frequency (B3). (C) Illustration of the steps included in the iEEG co-activation analysis.
CT-MRI coregistration. In order to determine the location of electrodes, for each patient, a post-implantation computed tomographic (CT) scan was coregistered with preoperative T1-SPGR MRI scan. This was done using BrainVoyager software 1.10.4 (Brain Innovation, Maastricht, Netherlands). Localization was additionally constrained by the requirement of location on the cortical surface. This was performed manually in order to overcome brain shift following electrode implantation (Hermes et al., 2010). The three-dimensional brain image including the electrode locations was rendered as a surface mesh, enabling precise localization of the electrodes with relation to the subject's anatomical MRI. In addition, images were normalized to Talairach coordinates enabling the localization of all the electrodes in standard coordinate space. For joint presentation of all subjects' electrodes, electrode locations were projected onto a cortical reconstruction of a specific healthy subject (Figure 2A2).
Electrode selection. The electrodes for each of the regions were selected based on their anatomical location: the DMPFC included electrodes in the medial wall that were bordered posteriorly by the primary motor area, laterally by the MFG and inferiorly by the cingulate gyrus. Electrodes in this area were divided into the pre-SMA and the SMA proper based on the VCA line definition which was previously described. The LPFC included electrodes in the middle and inferior frontal gyri that were bordered posteriorly by the primary motor area, medially by the superior frontal gyrus and inferiorly by the lateral sulcus. A total of 34 and 33 electrodes were selected for the LPFC and for the DMPFC, respectively (see details in Table 2). Figure 2A3 demonstrates electrode locations in relation to the predefined boundaries as derived from CT scans and superimposed on anatomical reconstructed SPGR sequence.
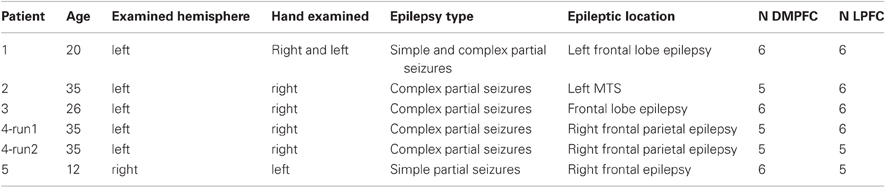
Table 2. Details of epilepsy type and electrode location.
The iEEG analysis was performed using in-house software developed with MATLAB (The MathWorks., Natick, MA) and the public license EEGLAB toolbox (Delorme and Makeig, 2004) in two steps: first, data was validated and then functional multivariate analyses were performed.
B. Data Evaluation.
First, in order to determine the quality of the EEG signal, event-related potentials (ERPs) were calculated starting from the stimulus onset, with a window of two seconds. Figure 2B1 presents representative ERPs obtained from one electrode for one patient pointing to significant inflection peaks around 170 and 250 ms as expected (Schendan and Lucia, 2010). Using EEGLAB toolbox, peaks significantly different from 0 were marked in red based on a two-tailed t-test at each time point. P value was set to p < 0.05 for this test (Figure 2B1).
In addition, we examined the alpha motor activation to verify Mu rhythm (de)synchronization in relation to motor response in the primary motor area (Pfurtscheller and Neuper, 1994; Pineda, 2005; Miller, 2007). Frequency analysis was averaged across the alpha frequency (8–12 Hz), in relation to the patient's first button press. To better visualize the frequency response in the alpha frequency band, the results of time frequency analysis were averaged across the alpha frequency band and time (–200–0 ms prior to the response) for all electrodes of a single patient. Results were then plotted on an average brain surface calculated from all patients using BrainVoyager software. This was done by interpolating the average value of each electrode using an exponential decay weight function with radius of 8 mm around the location of each electrode. The results of this analysis obtained from one representative patient are presented in Figure 2B2.
Lastly, time-frequency analysis was performed in order to determine the selection range of gamma frequency. Time-frequency analysis was calculated for the pre-SMA electrodes and was averaged across all electrodes. We used event-related spectral perturbation (ERSP), which measures the modulation of amplitude induced by a specific event, relative to baseline (Delorme and Makeig, 2004). This analysis was evoked by stimulus onset within a window of 2 s. ERSP was calculated from the power spectrum over a sliding latency window and averaged across data trials. The window was calculated using the Stockwell Transform (Poh and Marziliano, 2007). The mean baseline log power spectrum was subtracted from each spectral estimate. Significance of deviations from baseline power was assessed using a bootstrap method (Delorme and Makeig, 2004). Briefly, a surrogate data distribution was constructed by selecting spectral estimates for each trial from randomly selected latency windows in the specified epoch baseline (–200–0 ms, prior to stimulus onset). Spectral estimates were then averaged across trials. This process was applied 200 times producing a surrogate “baseline” amplitude distribution. 0.01 percentile from this distribution was then taken as the significance threshold. Only ERSP values above this threshold were considered for further analysis (Figure 2B3). Based on this analysis, our further analysis of gamma was based on the band of 31–60 Hz. This selection is in line with other studies showing that transient gamma oscillations shortly before movement-onset were detected in the 40 Hz frequency (Pfurtscheller et al., 1993).
The following pre-processing steps aimed to extract the signal from its combination with other signals and possibly broadband noise (Pereda et al., 2005): first, a narrowband notch at 50 Hz was used in order to exclude line noise. Second, the data was band-passed in order to extract alpha and gamma frequencies. We extracted the gamma frequency band at 31–60 Hz as previously described. In order to control for Mu rhythm (de)synchronization, we additionally performed the same analysis for the alpha frequency band (8–12 Hz). Filtering was performed using an elliptic infinite impulse response filter. Data was then epoched 0–400 ms following each sequence presentation. This time was chosen to represent the pre-response window as no responses were present during this time; the minimum response time for the first press was 490 ms.
C. iEEG functional connectivity calculation.
We used two common methods to estimate functional connectivity between the signals recorded: co-activation and synchronization. The linear co-activation function is one of the most commonly used measures to reveal temporal coherence in the firing of cortical neurons (Brazier and Casby, 1952; Gevins and Schaffer, 1980; Brody, 1999). This measure was used to detect more local changes in gamma coherence between the internally and externally guided conditions.
Phase synchronization became increasingly popular following the availability of the fast Fourier transform (FFT) algorithm and is commonly used to measure neurophysiologic signals between more distant neuronal populations (Tass, 2003; Womelsdorf et al., 2006; Miller, 2007; Lachaux et al., 2008). This method was employed to detect synchronized activity between the lateral and medial PFC, which reflects a physiological process of communication between them. The analysis steps of both methods were based on Pereda et al. (2005).
Functional co-activation analysis
Compute power envelope. For each electrode, the power envelope Ax(t) was calculated by applying the Hilbert transform  on the preprocessed data in each frequency band x(t), deriving the analytic signal
  and taking the absolute value of the result |Zx(t)| = A(t) (Le Van Quyen et al., 2001) (Figure 2C1).
Compute correlation. In order to assess the differences in co-activation between the IGAP and EGAP conditions, the linear cross-correlation between electrode pairs was calculated for each condition:  , where μ and σ denote mean and variance (Figure 2C2).
Determine significance. The significance and direction of the difference between the correlation coefficient cxy for the two conditions was assessed using the Fisher transformation, taking into account the relative bandwidth of the signal, and corrected for multiple comparison using the FDR correction (Benjamini and Hochberg, 1995; Hemmelmann et al., 2004) (Figure 2C3).
Functional synchronization analysis
For each electrode, the instantaneous phase ϕx(t) in each band was estimated using the analytic signal Zx(t) defined above by calculating Im[log (Zx (t))] = ϕx(t). Synchronization between the instantaneous phase of electrode pairs was estimated using the phase locking value  , where ϕxy(t) = ϕx (t) − ϕy (t) (Lachaux et al., 1999), and the difference between the values of γxy for the two conditions was calculated. The statistical significance of the differences was assessed using surrogate data and corrected for multiple comparison using FDR. Surrogate data were computed by calculating the phase locking value on randomly selected time-shifted data of the same length (400 ms) (Quian Quiroga et al., 2002).
Subtract conditions. For both connectivity results, in order to estimate the total difference between the conditions for all electrode pairs, we compared the number of significant connections in one direction (IGAP > EGAP) to those in the opposite direction (EGAP > IGAP) and assessed the significance using sign test (Figure 2C4).
Results
Study 1: fMRI Experiment in Healthy Participants
Behavior
Both the IGAP and EGAP for simple finger tapping sequence elicited similar average response times [Mean IGPA = 323 ms, Mean EGAP = 347 ms, t(1,26) = 1.3, p = 0.74]. As movement rate is know to be a potentially confounding variable in fMRI studies comparing self paced and externally paced stimuli [e.g., (Jahanshahi et al., 1995)], the speed of responses was measured as the time between stimuli presentation and the first response, the time between the first and second press, and the time between the second and third press. As can be seen in Figure 3, there was no significant difference between IGAP and EGAP response rate for the first, second, and third button presses (t = −1.73, p = 0.1, t = −0.65, p = 0.52; t = −0.35, p = 0.72, respectively).
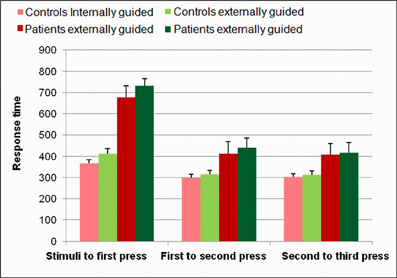
Figure 3. Response time analysis. Behavioral analysis of response time in healthy participants and in patients showed an overall longer response time for the patients (p < 0.005). No significant difference was present between internally and externally guided action planning for the first, second, and third presses.
Brain
Following our hypothesis regarding the spatial selectivity of the DMPFC, we first investigated differential activity in the a-priori defined regions of interest; the pre-SMA and SMA-proper, and the DLPFC as a comparison. Figure 4 shows 3D maps of activation overlay of two main contrasts: EGAP vs. rest and IGAP vs. rest, demonstrating that the pre-SMA and DLPFC, but not the SMA proper, show distinct activation during IGAP (pink colored regions). Beta weights estimated from the designated ROIs show that while the pre-SMA and DLPFC were sensitive to the source of planning, showing greater activation during the IGAP than EGAP, the SMA-proper was not sensitive to the source and was equally activated by IGAP and EGAP. An additional whole brain GLM analysis with direct contrast between IGAP and EGAP showed that the pre-SMA, but not the SMA proper, exhibited selective activation for source of planning; i.e., IGAP more than EGAP (p < 0.00005 uncorrected, random effect, N = 14) (see Table 3 for detailed mapping results).
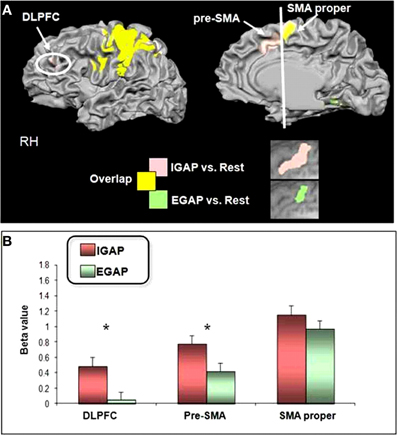
Figure 4. Effects of source of action planning on fMRI activations.(A) 3D overlay of group activation map (N = 14) onto a standardized T1-weighted MRI. (IGAP vs. rest in pink, EGAP vs. rest in green). (B) Estimated effect of source of planning as indicated by regional beta weights. The pre-SMA and the dorsolateral PFC (DLPFC) showed greater activation for the internally compared to externally guided conditions. *Indicates statistically significant difference at p < 0.005.
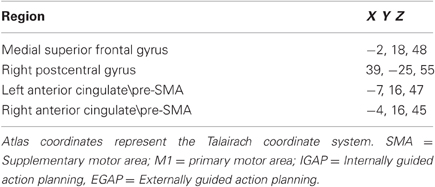
Table 3. Regions related to the different levels of source of planning (IGAP vs. EGAP).
Following our second hypothesis regarding selective functional connectivity of the DMPFC, we performed functional connectivity using sub-regions in the DMPFC (i.e., pre-SMA and SMA-proper) as seed regions for time-course activation obtained during IGAP or EGAP periods (see Methods). Overlaid probability maps show that the pre-SMA but not the SMA proper was functionally more connected with the MFG and with the premotor cortex during periods of the IGAP than the EGAP. Of note, a significant overlap between the two connectivity maps was mainly present in occipital lobe areas (Figure 5A, p < 0.05, FDR corrected for each connectivity map). Direct comparison between the functional connectivity maps showed that only the pre-SMA was significantly more connected with the DLPFC during the IGAP relative to EGAP conditions, (p < 0.05, uncorrected, random effect) (Table 4, Figure 5B).
Figure 5. Group functional connectivity networks presented on inflated brain.(A) Probability maps of the results driven by SMA proper (green network) and pre-SMA (red network) during internally (A-left panel)—or externally (A-right panel) guided planning (p < 0.05). (B) Direct contrast between the pre-SMA and the SMA proper maps for the internally guided vs. externally guided contrast (p < 0.05, uncorrected, random effect).
Table 4. Functional connectivity analysis.
Study 2: iEEG Experiment in Patients with Epilepsy
Behavior
Response time for the task performed during the iEEG recordings yielded a similar pattern of results to those of the healthy participants although of a different magnitude; the response time of patients across all conditions was longer than that of healthy participants (F = 12.02, p < 0.005) (Figure 3). As in healthy participants, response rates for the first, second, and third press were not significantly different between IGAP and EGAP conditions (t = 0.85, p = 0.41, t = 0.41, p = 0.68; t = 0.13, p = 0.80, respectively).
Brain
We first validated that the electrodes elicited the expected evoked potentials following visual instructions to perform simple sequences of either IGAP or EGAP. A total of 48 trials for each condition were included. For all patients N170 and P250 wave-peaks were recognized in response to stimulus presentation (Figure 6). We then examined the distributed time-frequency, averaged across the alpha band, which was assumed to be evoked by the patient's finger tapping on the response box (see Methods). Power plots of this analysis revealed alpha de-synchronization in the primary motor area of all patients who had electrodes in the vicinity of primary motor areas (Figure 7).
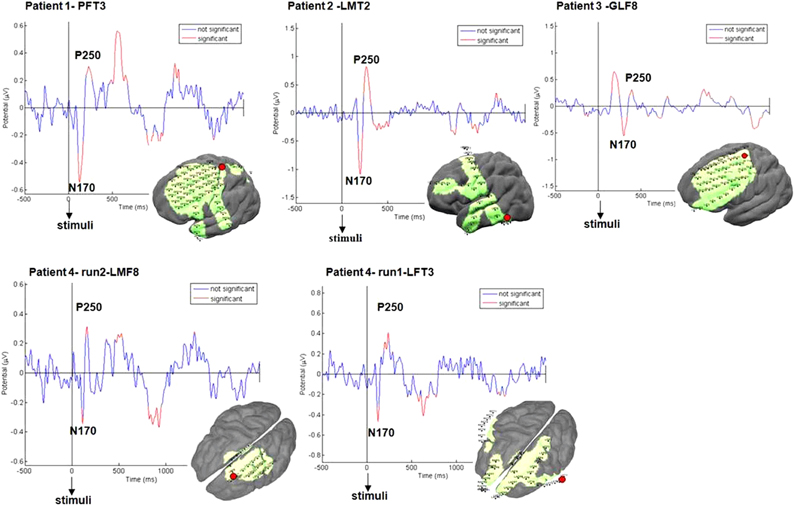
Figure 6. ERPs validation. ERPs evoked by stimulus showed typical N170, P250 peaks. Significant peaks are marked in red (p < 0.05). Examples are shown for each patient for one representative electrode in fronto-parietal regions (marked in red) for all conditions.
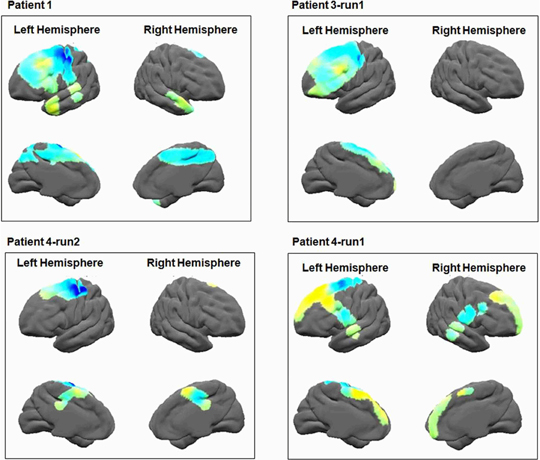
Figure 7. Alpha brain power plots. The results of time frequency analysis, averaged across the alpha band (8–12 Hz), show alpha de-synchronization in the primary motor area.
Using time frequency analysis via ERSP (see Methods) we found that the mean of all electrodes in the vicinity of pre-SMA showed a significant increase in synchronization in the range of 30–50 Hz, peaking at around 600 ms following stimulus presentations (Figure 2B3). Based on this finding, our further analysis of gamma was based on the 31–60 Hz band. As a comparison we used the alpha band as typically defined by others (Pfurtscheller and Neuper, 1994).
iEEG functional connectivity
To test our first hypothesis regarding the role of the gamma band in enhanced connectivity between MPFC and LPFC, we applied iEEG amplitude co-activation and phase synchronization analyses (see Methods). Figure 8 presents the distribution of electrodes obtained from a total of 67 electrodes (n = 5). This map was overlaid on an fMRI activation map of the 14 healthy participants using direct contrast between internally and externally guided conditions. Of note, as the electrodes in the lateral aspect of the prefrontal cortex were more distributed than the anatomical margins of the DLPFC, we more broadly defined this area as the LPFC for the iEEG study.
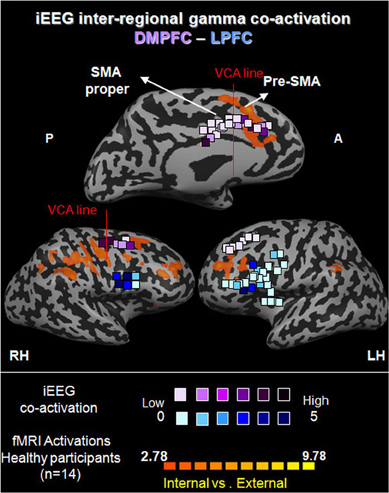
Figure 8. Functional iEEG co-activation in epileptic patients (67 electrodes) in gamma (31–60 Hz). Electrodes are shown on healthy participants' fMRI activation maps of the direct contrast between internally and externally generated action planning (n = 15, P < 0.015, random effect, uncorrected). The marked electrodes in the DMPFC and LPFC (purple and blue, respectively) show significantly increased inter-regional gamma co-activation for internally compared to externally guided simple finger tapping. The color of each electrode indicates the number of significant connections it has with electrodes from the other set.
iEEG co-activation. We first calculated the strength of co-activation in the gamma band between electrodes in the DMPFC and those in the LPFC, with respect to IGAP and EGAP conditions. While 15.62% of the 192 possible connections showed a significant increase for IGAP compared to EGAP (p < 0.05, FDR corrected), only 1.05% of the connections showed an increase for EGAP compared to IGAP (p < 0.05, FDR corrected). This difference was significant by a sign-test (p < 2.477e−7) (Figure 9A1). In order to illustrate the distribution of electrodes showing increased gamma co-activation, the electrodes were color coded by their number of significant connections with the corresponding region (Figure 8).
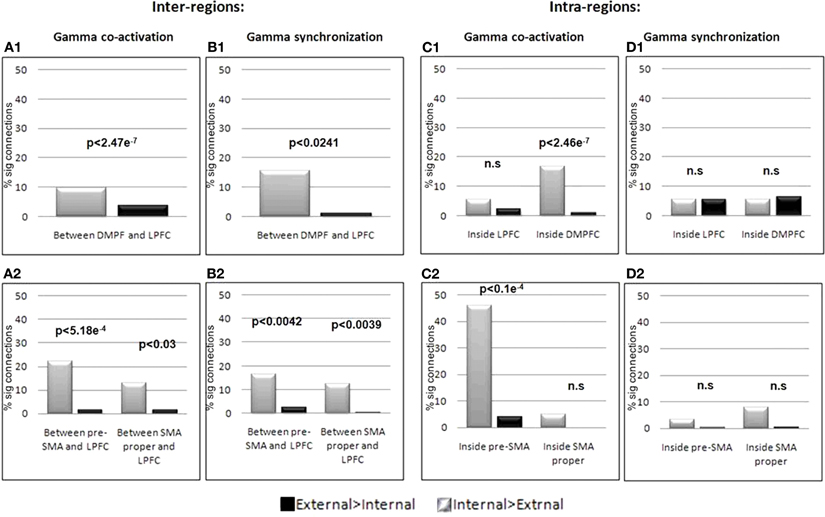
Figure 9. Inter and Intra regions gamma synchronization and co-activation. Co-activation (A1) and synchronization (B1) in the gamma band between DMPFC and LPFC and between each of the DMPFC sub regions; pre-SMA, and SMA proper with the LPFC (A2, B2) was significantly stronger for internally guided action planning. Within regions analysis showed increased co-activation for internally guided action planning within the DMPFC but not within the LPFC (C1). Such an increase was also present for the pre-SMA, but not the SMA proper (C2). Within regions synchronization revealed no difference between the conditions (D1–2). Significant difference between the conditions was tested using sign-test.
The electrodes situated within the DMPFC region were then separated into those closer to the pre-SMA or the SMA-proper. Co-activation was calculated again for electrodes confined to each region with respect to electrodes in the LPFC. Figure 9A2 shows that 22.05% of the possible connections between the pre-SMA and the LPFC showed increased co-activation for the IGAP compared to the EGAP conditions (p < 0.05, FDR corrected), while only 1.47% showed an increase for EGAP compared to IGAP (p < 0.05, FDR corrected). This difference was significant per a sign test (p < 5.18e−4). Electrodes in the SMA proper also showed a similar effect, though to a lesser degree of significance as shown by a sign test (p < 0.03).
Figure 9C shows quantitative estimations of the difference in such gamma co-activation between IGAP and EGAP within each region of interest. A significant increase for IGAP was found for co-activation inside the DMPFC (p < 2.46e−7, sign-test) with 16.85% of the connections showing increase compared to only 1.16% for EGAP (Figure 9C1). Such an increase was also found when examined for electrodes in vicinity to the pre-SMA alone (p < 1.05e−5, sign-test) with 46.15% of the connections showing a significant increase for IGAP while only 3.84% of the connections showed increase for EGAP. In contrast, electrodes confined to the SMA-proper did not show a significant difference in co-activation with the LPFC between IGAP and EGAP (p = 0.5, p = 0.125, sign-test, respectively). (Figure 9C2). Similarly, iEEG co-activation analysis for intra- and inter-regions was performed for the alpha band, however, no significant differences were found when comparing IGAP and EGAP conditions, in both directions. In addition, the percent of significant connections for each of the comparisons was very low (Mean % significant connections: 0.87, SD = 0.695).
iEEG phase synchronization. To further elucidate the underlying physiological occurrence of the observed regional co-activation we performed a phase synchronization analysis on electrodes within the DMPFC with relation to electrodes in the LPFC. A significant increase in synchronization between the DMPFC and the LPFC was detected for the IGAP vs. EGAP conditions (p < 0.0241, sign-test); 9.72% of the possible connections showed greater increase for IGAP compared to EGAP (p < 0.05, FDR corrected), while only 3.7% of the connections showed increase for the EGAP compared to IGAP (p < 0.05, FDR corrected) (Figure 9B1). We then repeated these analyses for electrodes located within the DMPFC subregions; pre-SMA and SMA proper, and found a similarly increased synchronization with the LPFC in the IGAP condition (p < 0.0042, p < 0.0039, respectively) (Figure 9B2). Synchronization was also tested within each of the regions, however, this analysis revealed no increase in synchronization for either condition or region (Figure 9D). Synchronization analysis was also performed for the alpha band, but no significant differences were found when comparing IGAP and EGAP conditions. The percent of significant connections detected for each of the comparisons was in fact very low (Mean% significant connections: 1.77, SD = 2.03).
To summarize, increased iEEG gamma co-activation and synchronization during IGAP was found between electrodes situated in the medial- and lateral aspects of the DPFC. Furthermore, although both electrodes in the pre-SMA and SMA-proper showed this effect, the increased gamma co-activation with the DLPFC was more robust for electrodes confined to the pre-SMA than to those in the SMA-proper. Importantly, increased intra-regional gamma co-activation (and not synchronization) was evident only during IGAP for electrodes in the pre-SMA but neither for those in SMA proper nor the DLPFC.
Discussion
Using a multi-modal approach of fMRI and iEEG in two separate studies, we showed that increased functional connectivity between the medial and lateral aspects of the PFC underlies internally-guided action planning. This is in line with our hypothesis of communication between motor regions and decision making related regions in the emergence of IGAP.
The fMRI uniquely showed that functional connectivity between DMPFC and DLPFC grows in a spatial gradient from posterior to anterior aspects of the DMPFC corresponding to the SMA-proper and pre-SMA, respectively. The iEEG further revealed that this functional connectivity is mediated temporally by increased gamma oscillations as demonstrated by amplitude co-activation as well as phase synchronization between electrodes situated in the DMPFC and LPFC areas. Finally, in correspondence with the activation gradient found by the fMRI analysis, electrodes confined to the pre-SMA, but not the SMA proper, also showed enhanced intra-regional co-activation during internally guided action planning, supporting a central role of this area in the emergence of internally generated motor behaviors.
In line with our hypothesis, the fMRI functional connectivity analysis suggests that the involvement of the pre-SMA in internally guided planning is related to enhanced connectivity with the DLPFC. While it is known that there are anatomical connections between the pre-SMA and the lateral PFC (Johansen-Berg et al., 2004; Kim et al., 2009), we uniquely demonstrated a task related increase between these regions in IGAP.
The increase in gamma oscillations between signals recorded from electrodes in the DMPFC and those in the LPFC (Figure 9) may offer a mechanism of neuronal communication for motor planning tasks, guided internally by one's own choice (i.e., selecting the finger used for tapping) rather than by external stimulus. EEG gamma-band activity recorded from intracranial electrodes was previously shown to increase during cognitive processing such as attention related to reading, memory formation, and recall, compared to a resting baseline (Fell et al., 2001; Sederberg et al., 2003; Mainy et al., 2007; Lachaux et al., 2008; Ray et al., 2008). The critical role of gamma oscillations for internally initiated movements was previously demonstrated in Parkinson's disease patients who often suffer from reduced ability to self-initiate movements (van Hilten et al., 1998). In these patients, effective treatment with Levodopa was followed by increased co-activation in the gamma band during voluntary movement (Cassidy et al., 2002; Fogelson et al., 2005; Trottenberg et al., 2006; Kuhn et al., 2009). As far as we know this study is the first to show direct electrical evidence for selective increase in gamma oscillations between motor and cognitive aspects of PFC related to planning, particularly when it is internally guided.
This increased connectivity between the DMPFC and LPFC remained significant when separating the DMPFC into SMA proper and pre-SMA. However, it should be noted that in both synchronization and a co-activation analysis, this effect was smaller for the SMA-proper than for the pre-SMA, hinting at different recruitment of such process by these regions. We suggest that the connectivity in the gamma band found between the SMA-proper and LPFC putatively results from the vicinity of the electrodes within the DMPFC, and not from direct connection between these regions, as such anatomical connection was not found in previous studies (Johansen-Berg et al., 2004; Lehericy et al., 2004). This assumption is in accordance with our fMRI finding showing greater functional connectivity between the pre-SMA and DLPFC than between SMA-proper and DLPFC during IGAP (Figure 5).
It is important to note that the increase in co-activation and synchronization cannot be accounted for by an overall increase in synchronization in the brain as there was no increase in co-activation and synchronization within the LPFC. We assert that the converging results, showing increased inter-regional gamma oscillations via both co-activation and phase synchronization measures during IGAP, strengthen the validity of our findings. In addition, while gamma oscillations recorded by scalp EEG may reflect miniature saccades instead of cognitive processes, iEEG is immune to this influence (Yuval-Greenberg et al., 2008; Kovach et al., 2011).
The increased gamma co-activation found for internally-guided action planning within the pre-SMA, but not the SMA proper, points to an essential role of this area in the mechanism underlying internally generated action planning. This discovery corresponds with our fMRI finding of a spatial gradient showing greater selective activation for internally guided planning in the pre-SMA than in the SMA-proper (see Figure 4). Other studies also argued that while the pre-SMA is more selective to internally guided motor and language planning, the SMA-proper is more involved in the execution of planned actions rather than in their initial planning (Lee et al., 1999; Jenkins et al., 2000; Crosson et al., 2001; Tremblay and Gracco, 2006; Gowen and Miall, 2007). Electrophysiological recording studies in monkeys further point to the criticality of the pre-SMA to the selection of movements without the guidance of an external cue (Halsband et al., 1994). The association between increased regional gamma and fMRI activation was previously demonstrated in both animal and human studies (Logothetis et al., 2001; Nir et al., 2007).
The finding of enhanced local co-activation but not synchronization within the pre-SMA is not surprising. Phase synchronization measures global, distributed changes; that is, between two or more neural populations (Daffertshofer and van Wijk, 2011), and this might be masked by a significant volume conduction among closely located electrodes (Wennberg and Lozano, 2003). In contrast, increased activity within a neural population results in increased amplitude, which is better reflected in the co-activation measure.
Most studies have failed to account for the tendency of performance to slow down as it becomes more internally based. In the current study we controlled for this using a simple tapping task for both internally and EGAP, resulting in similar response times and rates for both conditions (Figure 3). The similarity between response times in both conditions also confirms that the gamma activity was not related to attentional control mechanisms which have been shown in a previous EEG study to be related to response time (Gonzalez Andino et al., 2005).
In summary, using both fMRI and iEEG we demonstrated that self-generated motor behavior involves connectivity between motor and decision-making related nodes, specifically via gamma oscillations. Both fMRI and iEEG results point to greater recruitment of the pre-SMA relative to the SMA-proper in execution of actions guided by self choice compared to external instructions, suggesting that these subregions dissociate from one another when internally generated action planning takes place. Future studies will test the generality of such selectivity to internally driven processes in other cognitive modes such as language.
Conflict of Interest Statement
The authors declare that the research was conducted in the absence of any commercial or financial relationships that could be construed as a potential conflict of interest.
Acknowledgments
We are grateful to all patients for participating in this study. We gratefully acknowledge David Yossef, and the EEG technicians from the EEG and Epilepsy Unit for their on-going assistance in running the experiments on the ward. We thank several people from the Functional Brain Center, Wohl Institute for Advanced Imaging including Oren Levin for technical support, Dr. Yifat Glikmann-Johnston and Vicki Myers for proofreading. A special thank to Dr. David Papo for insightful theoretical input on the analysis approach. This research was supported by a graduate fellowship from the Levi-Edersheim Gitter institute for human brainimaging (Keren Rosenberg-Katz), and by the European Union ACTIVE grant (FP7-ICT-2009-270460) (Talma Hendler).
References
Benjamini, Y., and Hochberg, Y. (1995). Controlling the false discovery rate: a practical and powerful approach to multiple testing. J. R. Stat. Soc. 57, 289–300.
Brazier, M. A., and Casby, J. U. (1952). Cross-correlation and autocorrelation studies of electroencephalographic potentials. Electroencephalogr. Clin. Neurophysiol. 4, 201–211.
Brovelli, A., Lachaux, J. P., Kahane, P., and Boussaoud, D. (2005). High gamma frequency oscillatory activity dissociates attention from intention in the human premotor cortex. Neuroimage 28, 154–164.
Brown, S. D., and Heathcote, A. (2008). The simplest complete model of choice response time: linear ballistic accumulation. Cogn. Psychol. 57, 153–178.
Cassidy, M., Mazzone, P., Oliviero, A., Insola, A., Tonali, P., Di Lazzaro, V., and Brown, P. (2002). Movement-related changes in synchronization in the human basal ganglia. Brain 125, 1235–1246.
Chen, Y. C., Thaler, D., Nixon, P. D., Stern, C. E., and Passingham, R. E. (1995). The functions of the medial premotor cortex. II. The timing and selection of learned movements. Exp. Brain Res. 102, 461–473.
Crosson, B., Sadek, J. R., Maron, L., Gokcay, D., Mohr, C. M., Auerbach, E. J., Freeman, A. J., Leonard, C. M., and Briggs, R. W. (2001). Relative shift in activity from medial to lateral frontal cortex during internally versus externally guided word generation. J. Cogn. Neurosci. 13, 272–283.
Daffertshofer, A., and van Wijk, B. C. (2011). On the influence of amplitude on the connectivity between phases. Front. Neuroinform. 5:6. doi: 10.3389/fninf.2011.00006
Debaere, F., Wenderoth, N., Sunaert, S., van Hecke, P., and Swinnen, S. P. (2003). Internal vs external generation of movements: differential neural pathways involved in bimanual coordination performed in the presence or absence of augmented visual feedback. Neuroimage 19, 764–776.
Deiber, M. P., Honda, M., Ibanez, V., Sadato, N., and Hallett, M. (1999). Mesial motor areas in self-initiated versus externally triggered movements examined with fMRI: effect of movement type and rate. J. Neurophysiol. 81, 3065–3077.
Delorme, A., and Makeig, S. (2004). EEGLAB: an open source toolbox for analysis of single-trial EEG dynamics including independent component analysis. J. Neurosci. Methods 134, 9–21.
Dewar, S., Passaro, E., Fried, I., and Engel, J. Jr. (1996). Intracranial electrode monitoring for seizure localization: indications, methods and the prevention of complications. J. Neurosci. Nurs. 28, 280–284, 289–292.
Donner, T. H., Siegel, M., Fries, P., and Engel, A. K. (2009). Buildup of choice-predictive activity in human motor cortex during perceptual decision making. Curr. Biol. 19, 1581–1585.
Engel, A. K., and Singer, W. (2001). Temporal binding and the neural correlates of sensory awareness. Trends Cogn. Sci. 5, 16–25.
Fell, J., Klaver, P., Lehnertz, K., Grunwald, T., Schaller, C., Elger, C. E., and Fernandez, G. (2001). Human memory formation is accompanied by rhinal-hippocampal coupling and decoupling. Nat. Neurosci. 4, 1259–1264.
Fogelson, N., Pogosyan, A., Kuhn, A. A., Kupsch, A., van Bruggen, G., Speelman, H., Tijssen, M., Quartarone, A., Insola, A., Mazzone, P., Di Lazzaro, V., Limousin, P., and Brown, P. (2005). Reciprocal interactions between oscillatory activities of different frequencies in the subthalamic region of patients with Parkinson's disease. Eur. J. Neurosci. 22, 257–266.
Fries, P. (2005). A mechanism for cognitive dynamics: neuronal communication through neuronal coherence. Trends Cogn. Sci. 9, 474–480.
Gevins, A. S., and Schaffer, R. E. (1980). A critical review of electroencephalographic (EEG) correlates of higher cortical functions. Crit. Rev. Bioeng. 4, 113–164.
Glickstein, M., and Stein, J. (1991). Paradoxical movement in Parkinson's disease. Trends Neurosci. 14, 480–482.
Goebel, R., Esposito, F., and Formisano, E. (2006). Analysis of functional image analysis contest (FIAC) data with brainvoyager QX: from single-subject to cortically aligned group general linear model analysis and self-organizing group independent component analysis. Hum. Brain Mapp. 27, 392–401.
Goebel, R., Roebroeck, A., Kim, D. S., and Formisano, E. (2003). Investigating directed cortical interactions in time-resolved fMRI data using vector autoregressive modeling and Granger causality mapping. Magn. Reson. Imaging 21, 1251–1261.
Gonzalez Andino, S. L., Michel, C. M., Thut, G., Landis, T., and Grave De Peralta, R. (2005). Prediction of response speed by anticipatory high-frequency (gamma band) oscillations in the human brain. Hum. Brain Mapp. 24, 50–58.
Gowen, E., and Miall, R. C. (2007). Differentiation between external and internal cuing: an fMRI study comparing tracing with drawing. Neuroimage 36, 396–410.
Halsband, U., Matsuzaka, Y., and Tanji, J. (1994). Neuronal activity in the primate supplementary, pre-supplementary and premotor cortex during externally and internally instructed sequential movements. Neurosci. Res. 20, 149–155.
Halsband, U., and Passingham, R. (1982). The role of premotor and parietal cortex in the direction of action. Brain Res. 240, 368–372.
Hemmelmann, C., Horn, M., Reiterer, S., Schack, B., Susse, T., and Weiss, S. (2004). Multivariate tests for the evaluation of high-dimensional EEG data. J. Neurosci. Methods 139, 111–120.
Hermes, D., Miller, K. J., Noordmans, H. J., Vansteensel, M. J., and Ramsey, N. F. (2010). Automated electrocorticographic electrode localization on individually rendered brain surfaces. J. Neurosci. Methods 185, 293–298.
Jahanshahi, M., Jenkins, I. H., Brown, R. G., Marsden, C. D., Passingham, R. E., and Brooks, D. J. (1995). Self-initiated versus externally triggered movements. I. An investigation using measurement of regional cerebral blood flow with PET and movement-related potentials in normal and Parkinson's disease subjects. Brain 118(Pt 4), 913–933.
Jenkins, I. H., Jahanshahi, M., Jueptner, M., Passingham, R. E., and Brooks, D. J. (2000). Self-initiated versus externally triggered movements. II. The effect of movement predictability on regional cerebral blood flow. Brain 123(Pt 6), 1216–1228.
Johansen-Berg, H., Behrens, T. E., Robson, M. D., Drobnjak, I., Rushworth, M. F., Brady, J. M., Smith, S. M., Higham, D. J., and Matthews, P. M. (2004). Changes in connectivity profiles define functionally distinct regions in human medial frontal cortex. Proc. Natl. Acad. Sci. U.S.A. 101, 13335–13340.
Jung, J., Jerbi, K., Ossandon, T., Ryvlin, P., Isnard, J., Bertrand, O., Guenot, M., Mauguiere, F., and Lachaux, J. P. (2010). Brain responses to success and failure: direct recordings from human cerebral cortex. Hum. Brain Mapp. 31, 1217–1232.
Kim, J. H., Lee, J. M., Jo, H. J., Kim, S. H., Lee, J. H., Kim, S. T., Seo, S. W., Cox, R. W., Na, D. L., Kim, S. I., and Saad, Z. S. (2009). Defining functional SMA and pre-SMA subregions in human MFC using resting state fMRI: functional connectivity-based parcellation method. Neuroimage. 49, 2375–2386.
Kovach, C. K., Tsuchiya, N., Kawasaki, H., Oya, H., Howard, M. A. 3rd, and Adolphs, R. (2011). Manifestation of ocular-muscle EMG contamination in human intracranial recordings. Neuroimage 54, 213–233.
Kuhn, A. A., Fogelson, N., Limousin, P. D., Hariz, M. I., Kupsch, A., and Brown, P. (2009). Frequency-specific effects of stimulation of the subthalamic area in treated Parkinson's disease patients. Neuroreport 20, 975–978.
Lachaux, J. P., Jung, J., Mainy, N., Dreher, J. C., Bertrand, O., Baciu, M., Minotti, L., Hoffmann, D., and Kahane, P. (2008). Silence is golden: transient neural deactivation in the prefrontal cortex during attentive reading. Cereb. Cortex 18, 443–450.
Lachaux, J. P., Rodriguez, E., Martinerie, J., and Varela, F. J. (1999). Measuring phase synchrony in brain signals. Hum. Brain Mapp. 8, 194–208.
Le van Quyen, M., Martinerie, J., Navarro, V., Boon, P., D'Have, M., Adam, C., Renault, B., Varela, F., and Baulac, M. (2001). Anticipation of epileptic seizures from standard EEG recordings. Lancet 357, 183–188.
Lee, K. M., Chang, K. H., and Roh, J. K. (1999). Subregions within the supplementary motor area activated at different stages of movement preparation and execution. Neuroimage 9, 117–123.
Lehericy, S., Ducros, M., Krainik, A., Francois, C., van de Moortele, P. F., Ugurbil, K., and Kim, D. S. (2004). 3-D diffusion tensor axonal tracking shows distinct SMA and pre-SMA projections to the human striatum. Cereb. Cortex 14, 1302–1309.
Logothetis, N. K., Pauls, J., Augath, M., Trinath, T., and Oeltermann, A. (2001). Neurophysiological investigation of the basis of the fMRI signal. Nature 412, 150–157.
Luppino, G., Matelli, M., Camarda, R., and Rizzolatti, G. (1993). Corticocortical connections of area F3 (SMA-proper) and area F6 (pre-SMA) in the macaque monkey. J. Comp. Neurol. 338, 114–140.
Mainy, N., Kahane, P., Minotti, L., Hoffmann, D., Bertrand, O., and Lachaux, J. P. (2007). Neural correlates of consolidation in working memory. Hum. Brain Mapp. 28, 183–193.
Miller, R. (2007). Theory of the normal waking EEG: from single neurones to waveforms in the alpha, beta and gamma frequency ranges. Int. J. Psychophysiol. 64, 18–23.
Mueller, V. A., Brass, M., Waszak, F., and Prinz, W. (2007). The role of the preSMA and the rostral cingulate zone in internally selected actions. Neuroimage 37, 1354–1361.
Nir, Y., Fisch, L., Mukamel, R., Gelbard-Sagiv, H., Arieli, A., Fried, I., and Malach, R. (2007). Coupling between neuronal firing rate, gamma LFP, and BOLD fMRI is related to interneuronal correlations. Curr. Biol. 17, 1275–1285.
Pereda, E., Quiroga, R. Q., and Bhattacharya, J. (2005). Nonlinear multivariate analysis of neurophysiological signals. Prog. Neurobiol. 77, 1–37.
Pfurtscheller, G., and Neuper, C. (1994). Event-related synchronization of mu rhythm in the EEG over the cortical hand area in man. Neurosci. Lett. 174, 93–96.
Pfurtscheller, G., Neuper, C., and Kalcher, J. (1993). 40-Hz oscillations during motor behavior in man. Neurosci. Lett. 164, 179–182.
Pineda, J. A. (2005). The functional significance of mu rhythms: translating “seeing” and “hearing” into “doing”. Brain Res. Brain Res. Rev. 50, 57–68.
Poh, K. K., and Marziliano, P. (2007). Analysis of neonatal EEG signals using Stockwell transform. Conf. Proc. IEEE Eng. Med. Biol. Soc. 2007, 594–597.
Quian Quiroga, R., Kraskov, A., Kreuz, T., and Grassberger, P. (2002). Performance of different synchronization measures in real data: a case study on EEG signals. Phys. Rev. 65, 1–32.
Ray, S., Niebur, E., Hsiao, S. S., Sinai, A., and Crone, N. E. (2008). High-frequency gamma activity (80-150Hz) is increased in human cortex during selective attention. Clin. Neurophysiol. 119, 116–133.
Roelfsema, P. R., Engel, A. K., Konig, P., and Singer, W. (1997). Visuomotor integration is associated with zero time-lag synchronization among cortical areas. Nature 385, 157–161.
Schendan, H. E., and Lucia, L. C. (2010). Object-sensitive activity reflects earlier perceptual and later cognitive processing of visual objects between 95 and 500ms. Brain Res. 1329, 124–141.
Sederberg, P. B., Kahana, M. J., Howard, M. W., Donner, E. J., and Madsen, J. R. (2003). Theta and gamma oscillations during encoding predict subsequent recall. J. Neurosci. 23, 10809–10814.
Singer, W., and Gray, C. M. (1995). Visual feature integration and the temporal correlation hypothesis. Annu. Rev. Neurosci. 18, 555–586.
Tallon-Baudry, C., and Bertrand, O. (1999). Oscillatory gamma activity in humans and its role in object representation. Trends Cogn. Sci. 3, 151–162.
Tass, P. A. (2003). A model of desynchronizing deep brain stimulation with a demand-controlled coordinated reset of neural subpopulations. Biol. Cybern. 89, 81–88.
Tecchio, F., Zappasodi, F., Porcaro, C., Barbati, G., Assenza, G., Salustri, C., and Rossini, P. M. (2008). High-gamma band activity of primary hand cortical areas: a sensorimotor feedback efficiency index. Neuroimage 40, 256–264.
Tremblay, P., and Gracco, V. L. (2006). Contribution of the frontal lobe to externally and internally specified verbal responses: fMRI evidence. Neuroimage 33, 947–957.
Trottenberg, T., Fogelson, N., Kuhn, A. A., Kivi, A., Kupsch, A., Schneider, G. H., and Brown, P. (2006). Subthalamic gamma activity in patients with Parkinson's disease. Exp. Neurol. 200, 56–65.
van Hilten, J. J., van Eerd, A. A., Wagemans, E. A., Middelkoop, H. A., and Roos, R. A. (1998). Bradykinesia and hypokinesia in Parkinson's disease: what's in a name? J. Neural Transm. 105, 229–237.
Wennberg, R. A., and Lozano, A. M. (2003). Intracranial volume conduction of cortical spikes and sleep potentials recorded with deep brain stimulating electrodes. Clin. Neurophysiol. 114, 1403–1418.
Womelsdorf, T., Fries, P., Mitra, P. P., and Desimone, R. (2006). Gamma-band synchronization in visual cortex predicts speed of change detection. Nature 439, 733–736.
Yuval-Greenberg, S., Tomer, O., Keren, A. S., Nelken, I., and Deouell, L. Y. (2008). Transient induced gamma-band response in EEG as a manifestation of miniature saccades. Neuron 58, 429–441.
Keywords: fMRI, iEEG, gamma band, internally guided, prefrontal cortex, finger tapping
Citation: Rosenberg-Katz K, Jamshy S, Singer N, Podlipsky I, Kipervasser S, Andelman F, Neufeld MY, Intrator N, Fried I and Hendler T (2012) Enhanced functional synchronization of medial and lateral PFC underlies internally-guided action planning. Front. Hum. Neurosci. 6:79. doi: 10.3389/fnhum.2012.00079
Received: 27 December 2011; Paper pending published: 31 January 2012;
Accepted: 21 March 2012; Published online: 12 April 2012.
Edited by:
Hans-Jochen Heinze, University of Magdeburg, GermanyReviewed by:
Douglas O. Cheyne, Hospital for Sick Children, CanadaAndreas Keil, University of Florida, USA
Copyright: © 2012 Rosenberg-Katz, Jamshy, Singer, Podlipsky, Kipervasser, Andelman, Neufeld, Intrator, Fried and Hendler. This is an open-access article distributed under the terms of the Creative Commons Attribution Non Commercial License, which permits non-commercial use, distribution, and reproduction in other forums, provided the original authors and source are credited.
*Correspondence: Talma Hendler, Functional Brain Center, Wohl Institute for Advanced Imaging, Tel-Aviv Sourasky Medical Center, 6 Weizman Street, Tel Aviv 64239, Israel. e-mail:aGVuZGxlcnRAZ21haWwuY29t