
 Serena K. Thompson2
- 1Department of Ophthalmology, Vision Discovery Institute, Brain and Behavior Discovery Institute, Georgia Health Sciences University, Augusta, GA, USA
- 2Department of Psychology, University of Minnesota, Minneapolis, MN, USA
- 3Pattern Recognition Systems, Johnston, RI, USA
- 4Department of Brain and Cognitive Engineering, Korea University, Seoul, South Korea
Theoretical studies suggest that the visual system uses prior knowledge of visual objects to recognize them in visual clutter, and posit that the strategies for recognizing objects in clutter may differ depending on whether or not the object was learned in clutter to begin with. We tested this hypothesis using functional magnetic resonance imaging (fMRI) of human subjects. We trained subjects to recognize naturalistic, yet novel objects in strong or weak clutter. We then tested subjects' recognition performance for both sets of objects in strong clutter. We found many brain regions that were differentially responsive to objects during object recognition depending on whether they were learned in strong or weak clutter. In particular, the responses of the left fusiform gyrus (FG) reliably reflected, on a trial-to-trial basis, subjects' object recognition performance for objects learned in the presence of strong clutter. These results indicate that the visual system does not use a single, general-purpose mechanism to cope with clutter. Instead, there are two distinct spatial patterns of activation whose responses are attributable not to the visual context in which the objects were seen, but to the context in which the objects were learned.
Introduction
The visual system has a remarkable ability to recognize an object, despite the fact that we rarely see the same view of it twice (Figure 1A). This ability rests on incompletely understood brain mechanisms that discount sources of variation in the images of an object and background. Discounting is necessary because images of a single object will vary due to changes in viewpoint, lighting, material reflectance, occlusion, articulation, and background (Kersten et al., 2004).
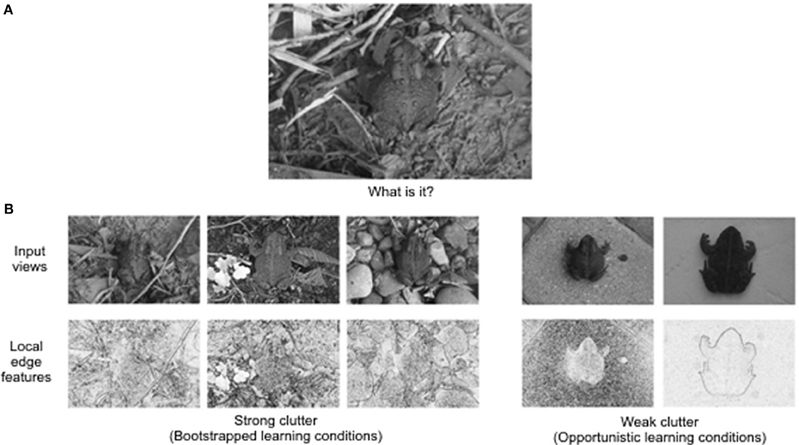
Figure 1. Effect of prior knowledge on object recognition in clutter. (A) A novel image, i.e., a pattern of intensities whose pixel representation the reader has never seen before. Yet, the toad is easily detected and recognized as a familiar object. Local input information, such as might be extracted by oriented spatial filters in V1 (simple or complex cells) used for signaling local oriented edges, provide highly ambiguous information. In typical natural images, there is no local information that uniquely distinguishes which edges belong to the boundary of an object, and which do not. (B) Different images of the same toad result in very different feature patterns. For example, it can be impossible to learn to distinguish which edge measurements near the boundary are from the toad vs. from the background, because most are ambiguous and change drastically from image to image. This variation illustrates the bootstrap learning dilemma. If detection, recognition, and segmentation rely on prior knowledge, how can this knowledge be acquired? Some images produce less ambiguous local edge features than others (bottom right two images), suggesting that object models may be learned given occasional low ambiguity conditions (although toads are not comfortable with such backgrounds). However, learning can also occur given views that are individually highly ambiguous (represented by the kinds of image input in the bottom right three images), but as a collection provide information to construct an object model.
Background clutter can be particularly challenging to discount, because object features (e.g., local texture patch, or boundary curve segments) can be confusable with background features, and they may not repeat in subsequent images of the same object (Figure 1B). Recognizing an object in the presence of background objects is also made harder by crowding effects that arise when the objects are spaced too closely for a given eccentricity (for overviews, see Motter and Simoni, 2007; Levi, 2008; Pelli and Tillman, 2008). In principle, ambiguity from background clutter can be resolved through bottom-up processes that use intermediate-level prior knowledge about how similar local image measurements (e.g., texture, color, edge orientation, and motion) tend to group (Stringer and Rolls, 2000, 2008), or by learning to use diagnostic fragments (such as an “eye”; cf. Ullman et al., 2002; Hegdé et al., 2008a). However, such bottom-up components for recognition seem to be inadequate to deal with the full range of image variation (Cavanagh, 1991; Yuille and Kersten, 2006). Accurate and versatile recognition seems to require analysis-by-synthesis, in which object knowledge in memory is used in a top-down fashion to resolve residual ambiguities regarding which features belong to the object and which do not (Figure 1B; also see Yuille and Kersten, 2006; Epshtein et al., 2008).
The requirement for prior object knowledge for versatile recognition and segmentation, however, brings an important computational problem, referred to as the bootstrap learning dilemma (Brady and Kersten, 2003)—how does the visual system learn an object in the first place if the object to be learned is itself ambiguous?
One possible solution is that the visual system takes advantage of opportunities in which bottom-up cues are not ambiguous, such as a view of the object in motion relative to the background, at a different stereoscopic depth, or seen against a different color—all conditions of weak clutter. In this case, a representation of the whole object could be stored from a single view, or as needed, a representative collection of views, to allow for lighting or viewpoint changes. This is referred to as “opportunistic learning,” because of how it may arise in natural conditions (Figure 1B; Brady and Kersten, 2003).
What if low ambiguity opportunities are scarce, as in the case of camouflage, occlusion, or in the absence of motion parallax, i.e., conditions of strong clutter, where there may be insufficient information in a given view to even localize the object? In the absence of opportunities to see an object clearly, learning would require accumulating object knowledge piecemeal over repeated and possibly infrequent exposures. Delays between views result in enormous image variations, as well as exposures to other objects in between views. Thus, learning an object given large variations would require mechanisms capable of holding candidate object features in memory obtained in one exposure for later comparison with features in other views of the same or different objects (for reviews, see Grill-Spector, 2003; Grill-Spector and Malach, 2004; Bussey and Saksida, 2007; Seger and Miller, 2010; Ungerleider and Bell, 2011; Vann and Albasser, 2011). Some features would need to be accepted and some rejected, until an increasingly complete description of the object model (i.e., an internal representation of an object) is assembled. Learning under such conditions of ambiguous fragmentation is referred to as bootstrapped learning (Brady and Kersten, 2003).
These computational considerations suggest the hypothesis that substrates of object recognition in clutter may involve different sets of brain regions depending on the type of learning, i.e., on whether the object was learned in strong or weak clutter. To test this hypothesis, we designed an imaging experiment in which individual novel objects were learned under either conditions of strong or weak clutter, but the recognition of both sets of objects was tested under conditions of strong clutter.
Materials and Methods
Experimental Design
We designed our experiment with the following considerations:
- In a study such as ours that tests object recognition as a function of the type of learning, it is important to isolate the effects of learning from the potentially confounding effects of testing. For this reason, we tested all objects under the same task paradigm (i.e., object recognition in strong clutter), regardless of whether the object was learned in strong or weak clutter. (The amount of clutter, as measured by the average number of objects, remained constant. For clarity, we use the terms “weak clutter” and “strong clutter” to distinguish between weak and strong effects of clutter on figure-ground separation).
- For stimuli used in training in strong clutter, we used texture mapping to mimic the natural fragmentation effects of lighting and pigment variation on both object boundaries and internal regions. The texture patterns of the target object had the same distribution of local features as the background clutter, thus encouraging the building of object models to solve the segmentation problem. The consequence was that there was insufficient information in any individual image for recognition or segmentation even with scrutiny. Preliminary measurements confirmed that observers were at chance performance prior to training (data not shown). In other words, learning to recognize an object in strong clutter required the visual system to integrate the object model information over multiple exposures to the object.
- To reflect natural object properties, we synthesized 3D stimulus forms (“digital embryos”) using virtual morphogenesis to capture realistic part relations, shading, and occlusion (Brady and Kersten, 2003; Hegdé et al., 2008a; see Figure 2A).
- Because of the potential for broadly different brain functions to be involved in the two types of learning, we measured the activity of the whole brain, and not just the visual areas.
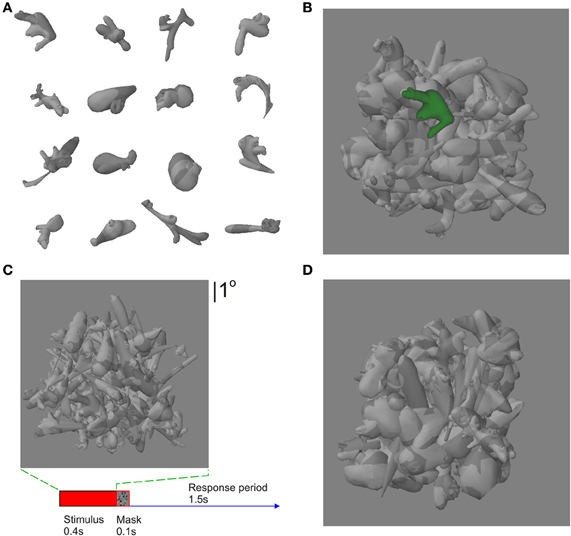
Figure 2. Stimuli and task. (A) Some exemplar novel objects (“digital embryos”). (B) A weak-clutter stimulus, with the target object highlighted in color so as to minimize the effect of clutter. (C) A strong-clutter stimulus, with the target (same as the leftmost object in second row from top in panel A) camouflaged against the background. A given subject learned a given object in strong clutter or in weak clutter, but not both. Learned objects were counterbalanced among subjects. (D) The recognition task performed by the subjects during fMRI scans. The target object was always presented in the presence of clutter during the scans, regardless of whether a given object was learned with or without clutter during training. Subjects were required to report whether the stimulus contained a learned target or not, regardless of the location of the target. The panels in this figure are not drawn to the same scale.
This experimental design was aimed at ruling out stimulus conditions that could otherwise lead to differential cortical responses between objects learned under conditions of strong vs. weak clutter. Systematic differences in the images, including average luminance, the level and nature of clutter, color used to highlight the target object in the sample images during training, and subject-to-subject differences in training parameters can be ruled out, since these effects were either averaged out during the experiment and/or factored out during the data analysis (see below for details). Also, the target objects were counterbalanced among subjects, so as to average out the effects of the shape variations across individual objects.
Subjects
Eight adult right-handed subjects (four females and four males) participated in this study. The data from one female subject were excluded because of excessive head movement in the scanner. It must be noted that this is a relatively small sample, and is therefore more subject to Type I and II errors (Cohen, 1988; Ellis, 2010). Each subject had normal or corrected-to-normal vision, and had no known neurological or visual disorders. Subjects gave informed consent prior to participating in the study. All protocols used in the study were approved in advance by the Institutional Review Board of the University of Minnesota.
Stimuli
Digital embryos were generated by starting with a uniform icosahedron, and simulating three embryonic processes in an iterative fashion: hormone-mediated cell growth, cell division and cell movement (www.hegde.us/DigitalEmbryos). Because of random variations in the underlying developmental processes, each run of these processes generates a different shape. Figure 2A shows several examples. We generated >5000 different digital embryos from which to select target objects and produce background clutter. Each embryo was textured independently using a randomly chosen two-tone grayscale bitmap of untextured digital embryo scenes as texture maps. This process produces misleading occlusion and shading cues, similar to that employed by some animals (e.g., cuttlefish; Hanlon et al., 2007). Digital embryo scenes were created by compositing 81 different randomly drawn embryos in 9 × 9 jittered rows and columns and at random depths (see Figures 2B,C). This constituted the background. All stimulus parameters, including the texture used for texture mapping and the number of background embryos, were chosen so as to yield asymptotic learning within a few hundred trials, as determined in pilot experiments (data not shown).
For scenes with a target, a new digital embryo was placed in front of the background, so that the target was in “plain view.” The embryos that were used as targets in any image never occurred in the background in any image, and vice versa. The scene was top lit and rendered using the OpenGL graphics toolkit (www.opengl.org).
Four types of visual stimuli were generated. (1) For stimuli with strong clutter, the target object was set against a background of other digital embryos, so that the texture patterns of the individual embryos created a camouflage effect (Figure 2C). That is, the target object blended with the background, making it difficult to perceptually segment the target from the background. Note that this type of clutter is distinct from the type of clutter used in many previous studies, where the various objects in the image did not blend with each other, so that each object could be readily segmented from each other and from the background (see, e.g., Kourtzi et al., 2005). The position of the target in the frontal plane, and the identity and position of the background embryos, varied randomly from one stimulus to the next. (2) The stimuli with weak clutter were created using an identical procedure, except that the target embryo was highlighted in monochromatic color (green or blue, depending on the subject) so as to be easily seen (Figure 2C). (3) The no-target stimuli were similar to the stimuli with strong/weak clutter, except that the target was absent. Note that the generative process for producing the backgrounds for the aforementioned three conditions was identical—statistically, the three conditions differed only in terms of the target object. (4) In order to contrast responses to objects learned in strong/weak clutter vs. a textured background, we also created a set of scrambled control stimuli by sampling small rectangular image patches from individual stimuli chosen randomly in equal proportions from the first three conditions.
Training Phase
During this phase of the experiment, subjects learned the target objects off-scanner, using viewing conditions that mimicked those in the scanner as closely as possible. Each subject learned five different objects presented in strong clutter, and five additional objects presented in weak clutter. The learned objects were counterbalanced across subjects. Each subject learned objects in strong or weak clutter in separate, alternating blocks of trials. Within each block, matching vs. non-matching trials (see below) occurred with equal probability in a randomly interleaved fashion.
To learn the embryos, subjects performed a delayed match-to-sample detection task with feedback, in which they reported whether or not the foreground object in the sample stimulus was found in the ensuing test stimulus (not shown). Briefly, each trial lasted 2 s, and began with a 400 ms presentation of the sample stimulus. Each sample stimulus was a visual scene described above and always contained a target object in the foreground. Depending on the trial block, the sample stimulus was a strong- or weak-clutter stimulus.
The sample stimulus was followed by a 100 ms mask drawn at random from a pool of 100 pattern mask stimuli that were created by scrambling a separate, dedicated set of strong-clutter and weak-clutter stimuli (Grill-Spector et al., 2001; Op de Beeck et al., 2007).
Following a 100 ms mask, the test stimulus was presented for 400 ms. The test stimulus was always a strong-clutter stimulus, regardless of whether the preceding sample stimulus was a weak-clutter stimulus or a strong-clutter stimulus. In a random 50% of the trials (matching trials), the test stimulus had the same target embryo as the sample stimulus, always at the same size and orientation, but at a randomly varying location. In another 50% of the trials, the test stimulus was a no-target stimulus. In either type of trial, the background of the test stimulus was always different from the background of the sample stimulus, so that the target, if present, was the only object common between the given test stimulus and the preceding sample stimulus.
Following a 100 ms mask, a blank screen was presented for the remainder of the trial (1000 ms). The subject had to report, using a corresponding button press, whether or not the foreground object in the sample stimulus was present in the test stimulus regardless of the object's position in either stimulus. Eye movements were allowed, so as to mimic natural viewing conditions as closely as possible. An audio feedback was provided.
The strong-clutter and weak-clutter blocks were repeated until the subject learned the corresponding class of objects to a criterion level (at least 75% correct for all objects in the block for at least four successive blocks). For some subjects, the learning occurred over multiple days. Although individual subjects tended to learn some objects faster than others, the asymptotic level of performance, measured as the percentage of correct responses, was comparable between objects learned in strong vs. weak clutter (Table 1, top). Note that it is possible that there were systematic differences in eye movement and fixation patterns among the various conditions, and that these differences contributed to the differences in learning. Immediately before the scan, each subject performed additional “top-off” training sessions outside the scanner, so as to ensure that the subject's learning remained at asymptotic levels entering the scanning phase of the experiment.
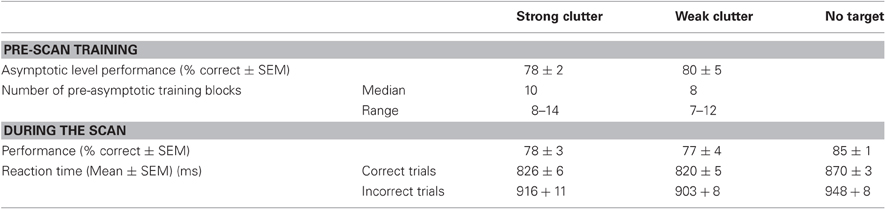
Table 1. Behavioral data.
Testing Phase: MRI Scans
Subjects were scanned while performing an object detection task under conditions of strong clutter, regardless of whether they had learned the object under conditions of strong or weak clutter.
During the scan, each trial lasted for 2 s, and began with a 400 ms presentation of a single cluttered visual scene, followed by a 100 ms mask and a subsequent blank gray screen for the last 1500 ms of the trial (Figure 2D). Stimuli (9° × 9°) were back-projected via a video projector (refresh rate, 60 Hz) onto a translucent screen placed inside the scanner bore. Subjects viewed the stimuli through a mirror located above their eyes, and used a button press to report whether or not the visual scene contained an object they had learned. No feedback was provided. Eye movements were allowed.
Functional MRI data were obtained using a 3T Siemens Trio scanner with an eight-channel head array coil using a rapid event-related design. Blood oxygenation level-dependent (BOLD) signals were measured with an EPI sequence (TE: 30 ms, TR: 1000 ms, FOV: 220 × 220 mm2, matrix: 64 × 64, flip angle: 60°, slice thickness: 5 mm, inter-slice gap: 1 mm, number of slices: 14, slice orientation: axial). The bottom slice was positioned just below the temporal lobes, so that the slices spanned all of the brain except the crown of the motor cortex at the dorsal end. A high-resolution 3D structural data set (3D MPRAGE; 1 × 1 × 1 mm3 resolution) was also collected in the same session before the functional runs.
Each scan consisted of 125 trials, representing four different conditions. (1) Twenty-five trials, referred to as “strong clutter” trials, featured an object learned under strong clutter. The objects were repeated five trials each in a randomly interleaved fashion (5 objects × 5 trials each = 25 trials). (2) The 25 “weak clutter” trials featured an object learned under weak clutter. The strong clutter and weak clutter trials were identical in all respects, including the pattern of background, except for the way the target object had been learned. (3) Two sets of 25 trials each (“no target” trials), one each corresponding to strong clutter and weak clutter conditions, featured a no-target stimulus. This ensured that the stimulus in any given trial had a 50% chance of containing a target. The two sets of no-target trials (defined for m-sequence purposes, see below) were otherwise identical. (4) The remaining 25 trials featured scrambled stimulus (“scrambled control” trials), during which subjects were expected to press either button.
The order of the various trials was determined using an m-sequence (Buracas and Boynton, 2002), so that each condition was preceded and followed by each of the other conditions an equal number of times. The m-sequence was varied one scan to the next within a subject. Each subject was scanned eight times. The recognition performance did not change systematically over the scan for any subject, indicating that the subjects did not learn (or forget) during the scan (rank correlation analysis, p > 0.05 for each subject; not shown).
Data Analyses
The data were analyzed using the SPM5 (www.fil.ion.ucl.ac.uk/spm; Friston, 2007) and BrainVoyager (brainvoyager.com) utilities, along with custom-written software. The EPI data were corrected for slice time and head movement, normalized to the MNI/ICBM coordinate space (www.loni.ucla.edu/ICBM; Evans et al., 1993) and smoothed using a Gaussian kernel with a full width at half maximum of 8 mm.
Statistical maps were generated in two stages. The first stage was a within-subject analysis, during which statistical maps were generated for each subject individually using 13 different regressors. The effects of interest were modeled using one regressor for each of the four trial conditions (strong clutter, weak clutter, no target, scrambled control). The model also included the following nine effects of no interest (i.e., “nuisance” factors): translations and rotations of the subject's head along the three Cartesian axes (six regressors), the reaction times during the scan, the number of trials needed to reach the asymptotic level during the training phase prior to the scan, and the asymptotic level of learning achieved during the training phase. The last two regressors, which related to the off-scanner learning history rather than in-scanner parameters, were included to factor out the effects, if any, of the corresponding differences in off-scanner learning. In general, including nuisance factors as regressors in the model helps remove systematic, confounding contributions from them. Removing such contributions from the data is desirable, even if the contribution of any given factor may not have been statistically significant by itself (Friston, 2007).
The second stage of analysis consisted of an across-subject random effects analysis, in which a group level statistical map was generated using the statistical maps from individual subjects.
Foci of activation that consisted of ≥20 contiguous voxels at a p < 0.05 (corrected for multiple comparisons) in the across-subject map were identified as regions of interest (ROIs). A separate analysis (not shown) revealed no clusters of significant activation for the nuisance factors. Activation maps were graphically displayed, and the Brodmann area assignments for the activation foci were identified, using SPM5 and the Caret utility (brainmap.wustl.edu/caret; Van Essen et al., 2001). Data from individual ROIs were analyzed using the MarsBaR utility (marsbar.sourceforge.net; Brett et al., 2002) and custom-written software.
Estimating the Bold Responses
BOLD responses used as inputs to various analyses were estimated using one of the following two methods, depending on the requirements of the given analysis.
Method 1 (Condition-wise method) estimated the response to each of the four conditions during each individual scan using a general linear model (GLM). To avoid potential selection biases, only half of the scans from each subject was used as input to GLM (Kriegeskorte et al., 2009; also see Baker et al., 2007a,b; Hegdé et al., 2008b). The other half of the data for each subject was used to redefine the ROI for each subject individually. To do this, we determined significant voxels (at p < 10−4, uncorrected) in each subject that were within a 16 mm diameter spherical volume centered on the peak voxel for the given ROI in the aforementioned second level analysis. The responses of these voxels (but in the other half of the data) were used as input to the GLM. The GLM estimated the response to the given condition across all repetitions (i.e., trials) of the condition during a given scan. The response time courses were estimated using either the canonical hemodynamic response function (HRF) or finite impulse response function (FIR). FIR makes no assumptions about the shape of the time course and essentially models each time point of the scan individually (Friston, 2007).
Method 2 (Trial-wise method) was carried out in the same fashion as Method 1, except that the response to each given trial was estimated individually using deconvolution (Ollinger et al., 2001a,b; Serences, 2004).
Logistic Regression
Two binary logistic models were constructed, one for objects learned in strong clutter and the other for objects learned in weak clutter. The aim was to determine the extent to which the BOLD responses of given region could reliably signal the presence of a learned target. The BOLD responses used as inputs to the model were estimated using the Condition-wise method (Method 1) described above.
The model for objects learned in strong clutter compared the responses during the strong clutter trials with the responses during the corresponding no-target trials (i.e., no-target conditions designated as paired with strong-clutter trials in the m-sequence; see above) across all subjects. The probability that a given trial j featured stimulus S = g given the BOLD response Xi from the brain region i is specified by the model:
where g ∈ {strong clutter, no target}, α is the offset and βi is the regression coefficient for brain region i. The modeling was implemented using the Design library (Harrell, 2001) in the R software package (www.r-project.org) and custom-written R software. The full model was then refined to retain only those regressors (i.e., regions) that contributed significantly to the model fit at p < 0.05 (Hosmer and Lemeshow, 2000; Harrell, 2001; Kleinbaum et al., 2002).
The model for objects learned in weak clutter was similarly constructed, using the data from weak clutter conditions and the corresponding paired no-target conditions.
ROC Analysis
Receiver operating characteristic (ROC) analysis was carried out separately for strong clutter vs. weak clutter conditions and for each subject essentially as described by Murray et al. (2002). The goal of this analysis was to determine the extent to which the BOLD responses in a given region were diagnostic of the subject's response during either clutter condition. For analyses of this sort where the diagnosticity of a given marker (or classifier) is of greater interest than the nature of the marker itself, ROC analysis is a principled, although by no means the only available, choice (Reddy et al., 2006; Zhang et al., 2008; Diana et al., 2010; Sela et al., 2011; Wee et al., 2012).
To determine if the BOLD responses during strong clutter trials reflect the subject's behavioral response, the FIR estimates of BOLD responses during individual trials (Method 2 above) for the strong clutter condition were pooled across the relevant scans within each subject. The BOLD response during each given strong clutter trial was classified as a hit or false alarm using a simple decision rule. The rule tested whether BOLD responses within a 4–10 s time window (where 0 s is the trial onset) were all above a given criterion level. If the decision rule correctly reflected the subject's behavioral response during that trial, the trial was considered a hit. If the rule did not, the trial was considered a false alarm. The ROC curve was determined using 100 criterion values spaced uniformly within the range of observed BOLD values. The area under the ROC curve, AUC, was determined using numerical integration. The p-value of AUC was determined using 1000 rounds of randomization. The ROC analysis was carried out similarly for the weak clutter condition.
Results
Our experiment essentially consisted of training the subjects off-scanner under conditions of strong or weak clutter depending on the object, and scanning the BOLD responses to all objects presented under the same condition, i.e., of strong clutter (Figure 2D; Materials and Methods for details). Thus, the clutter designations (i.e., strong clutter or weak clutter) refer to the level of clutter in which a given object was seen during the training phase, and not to the level of clutter in which it was seen during the testing phase.
Behavioral Performance During Training and Testing
As expected, without learning, object recognition performance was at chance levels (not shown). After learning, the asymptotic level of learning varied significantly across subjects (Two-Way ANOVA, object type × subject; p < 0.05; not shown). However, the asymptotic level of learning for objects learned in strong vs. weak clutter was statistically indistinguishable from each other within each subject (Table 1, top; binomial proportions tests, p > 0.05). The number of blocks needed to reach asymptotic level of learning was also statistically indistinguishable between the two conditions (p > 0.05).
During the testing phase, the recognition performance for the objects learned in strong vs. weak clutter (Table 1, bottom) was statistically indistinguishable from each other and from the asymptotic performance during training (Mantel–Haenszel test of independence, p > 0.05). The reaction times did not differ significantly between objects learned in strong vs. weak clutter (Two-Way ANOVA, learning type × reaction time; p > 0.05 for learning type and interaction factors), indicating that any systematic eye movement differences between the conditions were unlikely. However, the reaction times were faster for correct responses than for incorrect responses (p < 0.05 for reaction time factor).
Brain Regions Differentially Active During the Detection of Objects Learned in Strong vs. Weak Clutter
Our analyses revealed brain regions that responded differentially to objects learned in strong vs. weak clutter across all subjects regardless of the trial outcome (“Materials and Methods”). Since all objects were seen under the same conditions of clutter during the scanning itself, these differential responses are attributable to how the objects were learned.
Twelve regions in either hemisphere showed significant activation differences. Of these, five regions were more responsive to objects learned in strong clutter than to objects learned in weak clutter, and seven regions were more responsive to objects learned in weak clutter than to objects learned in strong clutter (p < 0.05, corrected; Figure 3 and Table 2).
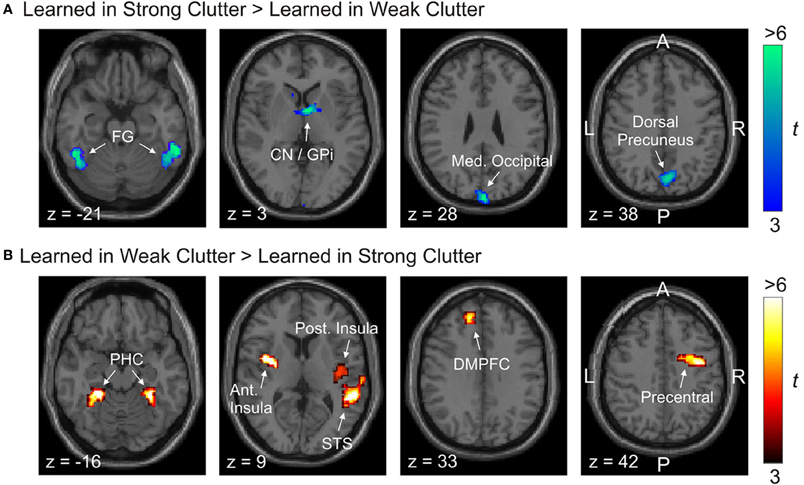
Figure 3. Brain regions differentially responsive to visual objects learned with vs. without clutter. Activations are shown superimposed on axial slices of a standard individual brain template. (A) Regions more responsive to objects learned in strong clutter than to objects learned in weak clutter. (B) Regions more responsive to objects learned in weak clutter than to objects learned in strong clutter. BOLD responses to both classes of objects were measured in the presence of visual clutter. Abbreviations: Ant/post. Insula, anterior/posterior insular cortex; CN, caudate nucleus; DMPFC, dorsomedial prefrontal cortex; GPi, internal segment of globus pallidus; FG, fusiform gyrus; Med. Occipital, medial occipital; PHC, parahippocampal cortex; ST, superior temporal.
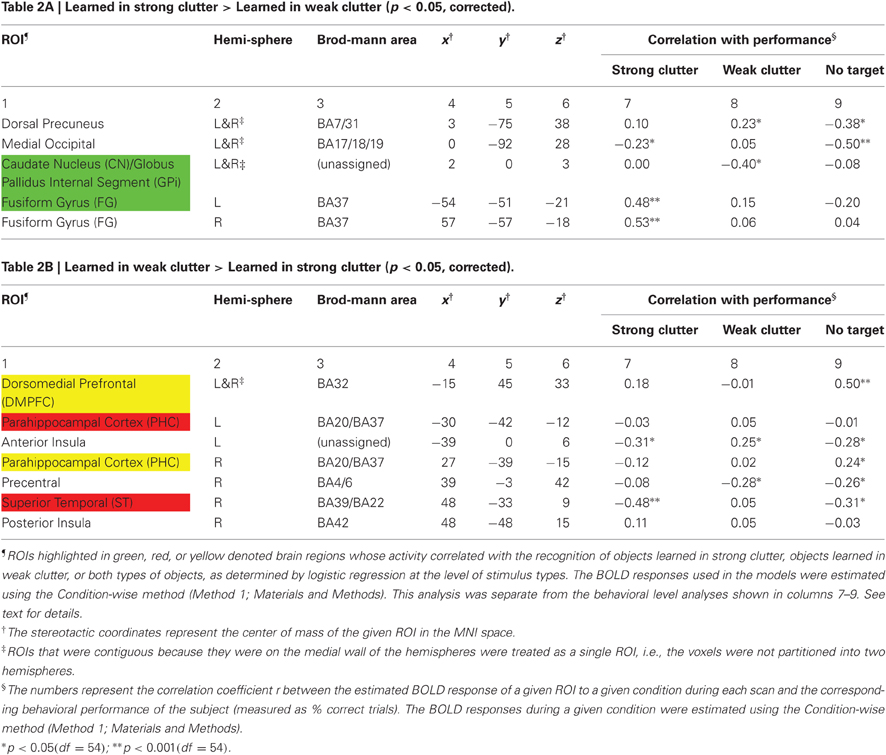
Table 2. Brain regions involved in object recognition in clutter.
Regions significantly more responsive to objects learned in strong clutter than to objects learned in weak clutter were found in the fusiform cortex, dorsal precuneus, medial occipital cortex, and basal ganglia [especially the posterior aspect of the head of the caudate nucleus (CN), and the medial aspect of the internal segment of globus pallidus (GPi)] (Figure 3A; also see Table 2A). Regions with the opposite response pattern (i.e., weak clutter > strong clutter) were found in the bilateral parahippocampal cortex (PHC), bilateral dorsomedial frontal cortex (DMPFC), right precentral, right superior temporal (ST), and insular cortices (Figure 3B and Table 2B). CN, GPi, and the fusiform gyrus (FG) are part of a memory subsystem called the corticostriatal loop. PHC is part of another memory subsystem based in the medial temporal lobe (MTL). Both of these memory subsystems are known to be involved in object category learning and object recognition (Poldrack et al., 2001; Seger, 2006; Murray et al., 2007; Poldrack and Foerde, 2008; Baxter, 2009; Suzuki and Baxter, 2009; Seger and Miller, 2010). We will discuss later the plausible roles of these subsystems in recognizing objects learned in strong vs. weak clutter.
Note that ROIs identified by either of the above contrasts showed some hemispheric asymmetry. A previous study of learning in clutter did not find any differences between the two hemispheres [(Kourtzi et al., 2005), p. 1324]. Additional analyses in our case indicated that even ROIs in seemingly symmetrical locations in the two hemispheres sometimes had substantially different response patterns (e.g., the right and left FG; also see below). The only exception to this were the four ROIs located on or near the hemispheric midline (DMPFC, dorsal precuneus, medial occipital cortex, and CN/GPi; Figure 3 and Table 2), which failed to show significant variations across the two hemispheres and therefore were not split according to hemisphere.
The differential activation in the retinotopic medial occipital cortex is somewhat surprising, since our paradigm allowed free eye movements. The time course of the BOLD response in this ROI indicates that the visual stimulation reduced responses in this ROI below background levels, such that at their most suppressed, the responses showed a no target < strong clutter < weak clutter < scrambled control pattern (see Figure A1). Response suppression in the occipito-temporal visual areas is believed to reflect the fine-tuning (i.e., sharpening) of the responses induced by prior object knowledge although there is some debate about the precise mechanisms (Murray et al., 2002; Ganel et al., 2006; Schacter et al., 2007; Yotsumoto et al., 2008).
Involvement of retinotopic visual areas and of fusiform cortex in learning objects in visual clutter has been reported previously (Kourtzi et al., 2005; Zhang and Kourtzi, 2010). The anatomical location of the PHC activation in this study roughly corresponded to that of the parahippocampal place area that has been previously reported to play an important role in scene perception, although not in the context of visual clutter (Epstein and Kanwisher, 1998; Epstein et al., 1999; also see Grill-Spector and Malach, 2004). None of the remaining regions identified in the present study have been previously reported to play a role in object recognition in clutter (see below).
Role of the ROIs in Recognizing Objects Learned in Strong vs. Weak Clutter
The fact that a given brain region is more responsive to objects learned in strong clutter does not, by itself, mean that it plays no role in representing objects learned in weak clutter (or vice versa). For instance, it is possible that the two classes of objects are represented in a distributed fashion, with one or more regions contributing significantly to recognizing both classes of objects in clutter.
We examined this possibility using logistic regression modeling to compare the BOLD responses to strong/weak clutter conditions with the responses to the no target conditions (“Materials and Methods”). For the strong clutter vs. no target comparison, the slope of the fitted logistic function is a measure of the extent to which a given region is more responsive to a stimulus that contained an object learned in strong clutter than to a comparable stimulus that contained no target (Hosmer and Lemeshow, 2000; Harrell, 2001; Kleinbaum et al., 2002). By this measure, DMPFC, right PHC, CN/GPi, and left FG reliably signaled the presence in a cluttered background of an object learned in strong clutter (green and yellow rows in Table 2; see footnotes for additional details). Similarly, DMPFC, left and right PHC, and STS reliably signaled the presence of an object learned in weak clutter (red and yellow rows). Two regions, DMPFC and the right PHC, signaled the presence of a target object in cluttered background regardless of whether the object was learned in strong or weak clutter (yellow rows). Taken together, these results indicate that the two sets of objects are represented in two partially overlapping, distributed sets of brain regions.
To determine the extent to which the different brain regions reflect the subject's behavioral responses, we correlated the BOLD response of a given ROI to the strong clutter, weak clutter and no target conditions with the subject's overall behavioral performance during the given condition. The resulting correlation coefficient values are shown in Table 2 (columns 7–9; see footnotes for additional details). The time courses of the BOLD responses for the six ROIs in Table 2 with significant correlations (i.e., ROIs highlighted in color) are shown in Figure A2.
Three aspects of these two analyses are particularly noteworthy. First, many ROIs (e.g., ST, FG) showed significant correlation with performance either for objects learned in strong clutter or in weak clutter, but not for both, indicating that these ROIs process the two types of stimuli in a qualitatively different manner. This is particularly important, because it indicates that the responses are not entirely attributable to the internal object model (or representation) being more detailed or better segmented for the two types of objects because in that case, the responses would be expected to vary systematically between the two conditions. Second, note that the BOLD response was anticorrelated with performance for many regions (e.g., anterior insula, precentral, medial occipital), indicating that the BOLD response of these regions to a given condition decreased with an increase in performance. Third, although the response to the no-target condition played no part in ROI selection in either analysis (and the subjects did not explicitly learn no-target stimuli during training; see “Materials and Methods”), the response to no-target stimuli showed significant correlation with performance for many ROIs. This suggests that these ROIs carry information about the presence or absence of a target in a given cluttered scene. Together, the above results suggest that objects seen in clutter are processed by the visual system in a distributed fashion.
Responses of Left FG is Diagnostic of Correct Detection of Objects Learned in Strong Clutter on a Trial-to-Trial Basis
The above analyses reveal many regions for which the average magnitude of the BOLD response during a given condition was correlated with the average behavioral performance of the subject on a scan-to-scan basis. We further examined all regions, regardless of whether they showed significant correlation in the above scan-level analysis, individually using an ROC analysis to determine the accuracy with which the BOLD response estimated the subject's response on a trial-to-trial basis (“Materials and Methods”). By this analysis, the responses in one ROI, left FG, reflected a given subject's behavioral response during individual trials featuring an object learned in strong clutter (see below).
Figure 4 shows the results of this analysis for one representative subject. The extent to which the ROC curve (blue line) deviated from the chance level performance (diagonal) is a measure of the accuracy with which the BOLD response successfully estimated the subject's response. Greater overall deviations, i.e., the extent to which the area under the ROC curve (AUC) deviates from 0.5, signify correspondingly greater accuracy. The AUC values were statistically significant in subjects 1–6 (AUC range, 0.57–0.63; p < 0.05). In the remaining subject (Subject 7), the p-value was 0.058 (AUC, 0.5812; not shown). Together, these results indicate that, in general, the BOLD response during a given trial in left FG reliably estimates the subject's behavioral response for that trial.
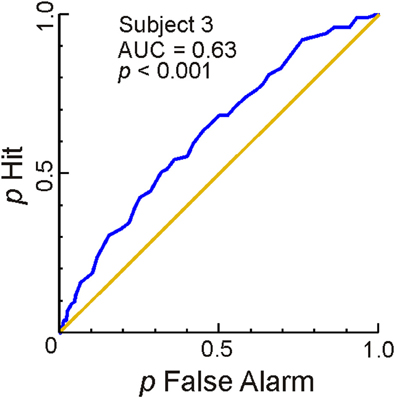
Figure 4. Responses in left FG estimate the subject's response on a trial-by-trial basis. ROC analyses of trial-by-trial responses were carried out using the BOLD responses to individual trials estimated using FIR modeling in Method 2 (see “Materials and Methods” for details). This figure shows the ROC curve (blue), the area under the ROC curve (AUC) and the p-value of AUC for one subject. The diagonal represents chance level performance (AUC = 0.5). The data from the remaining subjects are reported in the text. The average time course of the responses in FG across all sessions and subjects are shown in Figure A2.
However, the responses in left FG failed to estimate the subject's response during the weak clutter condition, consistently across all subjects. Furthermore, no other ROI consistently estimated the behavioral response of the subjects during strong-clutter or weak clutter conditions on a trial-to-trial basis by this measure. This may mean that the processing of the objects learned in weak clutter is even more distributed than the processing of objects learned in strong clutter.
Additional Evidence for Overlapping Streams of Processing: Brain Regions Responsive to Both Types of Object
The ROIs in Figure 3 were specifically identified by their differential responses to strong- vs. weak-clutter conditions. However, it is also useful to identify ROIs that distinguish both conditions from the scrambled control regardless of whether they distinguish between the strong- vs. weak-clutter condition. To do this, we identified those regions in which the responses to both strong clutter and weak clutter conditions were greater than to the scrambled control condition using a conjunction analysis (strong clutter > scrambled control and weak clutter > scrambled control; Figure 5 (Joseph et al., 2002; Friston, 2007). We used the scrambled control condition, rather than the no target condition, as the reference condition because our aim was to identify regions that play a role in the processing of cluttered scenes, and not just the target object.
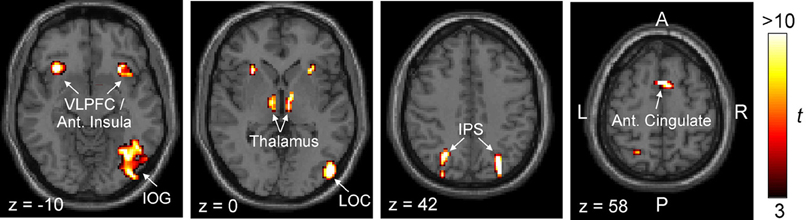
Figure 5. Brain regions that are more responsive to objects in cluttered scenes than to their scrambled counterparts. Two separate statistical maps were generated, one using the strong clutter condition > scrambled control condition, and the other using the weak clutter condition > scrambled control condition, each at p < 0.05 (corrected). This figure shows the regions that were significantly activated in both statistical maps by a conjunction analysis (p < 0.05). Activations are shown superimposed on axial slices of a standard individual brain template. Abbreviations: IOG, inferior occipital gyrus; IPS, intraparietal sulcus; LOC, lateral occipital complex; VLPFC, ventrolateral prefrontal cortex.
The regions revealed by this analysis were largely symmetrical between the two hemispheres, although significant activation of lateral occipital complex (LOC) and inferior occipital gyrus (IOG) was evident only in the right hemisphere. In the left hemisphere, the activation of these regions was not extensive enough to be identified as an ROI by our criteria (data not shown). Both LOC and IOG, especially in the right hemisphere, are known to play key roles in object recognition (Grill-Spector and Malach, 2004). Two other regions in this map, anterior insula and dorsomedial cingulate, have been previously reported to play important roles in executive control (Stuss and Knight, 2002; Koechlin and Hyafil, 2007). Thalamus is known to play a generic role in many forms of perceptual learning (Seger, 2006).
Discussion
Functional Specialization in the Substrates for Object Recognition in Clutter
Our results reveal that recognition of visual objects in clutter involves distinct, albeit overlapping, sets of brain regions. Moreover, the differences in the two sets of regions were not attributable to differences in object category, since these objects were randomly drawn from the same object category and counter-rotated across subjects. Rather, the differences were a function of whether or not the objects were learned in clutter. Thus, our results confirm the hypothesis that the differences in the underlying substrates can arise as a function of the type of learning.
These findings are consistent with the computational notion that learning an object in strong vs. weak clutter results in different processing mechanisms possibly involving different learned object representations. As noted above, object features that are useful for detecting an object differ when the object is learned in strong clutter vs. weak clutter. Modeling studies show that neural networks learn different properties of the image when the input images contain background clutter vs. when they do not (Stringer and Rolls, 2000; Rolls et al., 2008). Psychophysical studies using dot patterns have shown that training on shapes in isolation did not later facilitate segmentation of the same shapes in noisy backgrounds (Yi et al., 2006). Thus, it is plausible that two different corresponding sets of “task-relevant” features come to be represented, and the brain regions that help represent these features will be correspondingly different. The differential activations revealed by our study may reflect these differences in how the two sets of features come to be represented after training in strong vs. weak clutter.
Our results identify left FG as a brain region that plays a key role in the recognition of objects learned in strong clutter, in that activity of this one region by itself is a reasonably good indicator of the outcome of the recognition process on a trial-to-trial basis. On the other hand, our results also indicate that the mechanisms for recognizing objects learned in weak clutter may be more distributed. Previous monkey neurophysiological studies have reported neurons in the inferotemporal cortex that show considerable tolerance to clutter (Zoccolan et al., 2007; Li et al., 2009; also see Levi, 2008; Nandy and Tjan, 2008), although the extent to which type of learning, or learning per se, affects the responses of these neurons remains unclear.
Three caveats about our results are especially worth noting. First, while our results reveal many brain regions that show differential learning type-dependent effects, it is possible that our study missed additional brain regions that play key roles in this process, because of the relatively low spatial resolution of fMRI and/or the relatively small size of our sample. Second, while our results generally designate each given brain region as being selective to one condition or the other (e.g., left FG as selective to strong clutter condition), it is possible that selectivity for both conditions exist within the same given region at the level of individual neurons or neuronal subpopulations. Techniques with far greater spatial resolution, such as monkey electrophysiological recordings, would be needed to explore this scenario. Third, the extent to which our findings are generalizable to other learning situations, especially under natural viewing conditions, remains to be seen. Thus, the significance of our results is that they provide an “existence-proof” for a learning type-dependent object recognition process, and not necessarily that it is a common mechanism of object learning and recognition.
A Hypothetical Mechanism by Which Functional Specialization May Arise in a Learning Type-Dependent Fashion
Our experiments were not designed to address the mechanisms by which brain regions come to be differentially responsive to the objects learned in strong vs. weak clutter. But it is worth pointing out the possibility that the differential responses may arise as a result of the interplay between two known memory subsystems, the MTL and the corticostriatal loop.
Both of these subsystems are known to play prominent roles in perceptual learning of visual objects (for reviews, see Seger, 2006; also see Poldrack et al., 2001; Poldrack and Foerde, 2008; Seger and Miller, 2010). Previous human and monkey studies indicate these two systems play different, somewhat complementary roles in visual learning: MTL is important for learning easy visual discriminations, whereas the corticostriatal loop is necessary for learning more difficult and gradually learned discrimination tasks (Teng et al., 2000; Poldrack et al., 2001, 2005; Seger, 2006). The involvement of the two subsystems is known to change dynamically over the course of learning (Poldrack et al., 2001; Voermans et al., 2004; Nomura and Reber, 2008; Daniel et al., 2011). In general, as object uncertainty decreases during the course of learning, the striatal loop becomes less active and MTL becomes more active (Teng et al., 2000; Daniel et al., 2011).
We posit that the corticostriatal loop plays a comparatively more prominent role than the MTL in object learning in strong clutter, and the reverse is true for the learning of objects in weak clutter, so that they come to preferentially represent the two sets of objects. The differential responses observed using identical testing conditions may reflect a differential engagement of these two subsystems and of other brain regions with close functional connections with either subsystem. Conversely, the regions activated by both sets of objects presumably reflect overlapping roles played by the two subsystems.
General Implications for Neural Mechanisms of Knowledge-Based Visual Disambiguation
Previous studies of the processes by which prior learning and knowledge of objects help resolve image ambiguities have shown that the underlying pattern of activity can differ based on whether the subject has learned to recognize a given object or not, based on the category of the given object or its visual context (Dolan et al., 1997; Moore and Engel, 2001; Gauthier et al., 2003; Grill-Spector and Malach, 2004; Kourtzi et al., 2005; McKeeff and Tong, 2007; Wong et al., 2009; Brascamp et al., 2010). More directly relevant to the present context, Kourtzi et al. (2005; also see Zhang and Kourtzi, 2010) have shown that many regions in the visual cortex are more responsive to trained than untrained shapes when the shapes are learned in clutter.
Our results further show that knowledge-based visual disambiguation of object category is not mediated by a single set of regions or a single pathway, but that different brain regions are activated during recognition depending on the type of learning even when the object category and task remain the same. Understanding the precise neural mechanisms by which the type of learning affects knowledge-based visual disambiguation—the process by which prior learning and knowledge resolves ambiguities in visual input—is likely to be a fruitful area for future research.
Conflict of Interest Statement
The authors declare that the research was conducted in the absence of any commercial or financial relationships that could be construed as a potential conflict of interest.
Acknowledgments
This work was supported by grants ONR N00014-05-1-0124 and NIH R01 EY015261 to Daniel Kersten. This research was partially supported by WCU (World Class University) program funded by the Ministry of Education, Science, and Technology through the National Research Foundation of Korea (R31-10008). This work was also supported in part by the US Army Research Laboratory and the US Army Research Office grant W911NF-11-1-0105 to Jay Hegdé. The 3T scanner at the University of Minnesota Center for Magnetic Resonance Research was supported by BTRR P41 008079 and by the MIND Institute. We thank Drs. Elizabeth Buffalo, Yuhong Jiang, Wilma Koutstaal, Chad Marsolek, and Edmund Rolls for helpful discussions.
References
Baker, C. I., Hutchison, T. L., and Kanwisher, N. (2007a). Does the fusiform face area contain subregions highly selective for nonfaces? Nat. Neurosci. 10, 3–4.
Baker, C. I., Liu, J., Wald, L. L., Kwong, K. K., Benner, T., and Kanwisher, N. (2007b). Visual word processing and experiential origins of functional selectivity in human extrastriate cortex. Proc. Natl. Acad. Sci. U.S.A. 104, 9087–9092.
Baxter, M. G. (2009). Involvement of medial temporal lobe structures in memory and perception. Neuron 61, 667–677.
Brascamp, J. W., Kanai, R., Walsh, V., and van Ee, R. (2010). Human middle temporal cortex, perceptual bias, and perceptual memory for ambiguous three-dimensional motion. J. Neurosci. 30, 760–766.
Brett, M., Anton, J.-L., Valabregue, R., and Poline, J.-B. (2002). “Region of interest analysis using an SPM toolbox,” in Paper Presented at: 8th International Conference on Functional Mapping of the Human Brain, June 2–6, 2002, (Sendai, Japan).
Buracas, G. T., and Boynton, G. M. (2002). Efficient design of event-related fMRI experiments using M-sequences. Neuroimage 16, 801–813.
Bussey, T. J., and Saksida, L. M. (2007). Memory, perception, and the ventral visual-perirhinal-hippocampal stream: thinking outside of the boxes. Hippocampus 17, 898–908.
Cavanagh, P. (1991). “What's up in top-down processing?,” in Representations of Vision: Trends and Tacit Assumptions in Vision Research, ed A. Gorea (New York, NY: Cambridge University Press), 295–304.
Cohen, J. (1988). Statistical Power Analysis for the Behavioral Sciences, 2nd Edn. Hillsdale, NJ: L. Erlbaum Associates.
Daniel, R., Wagner, G., Koch, K., Reichenbach, J. R., Sauer, H., and Schlosser, R. G. (2011). Assessing the neural basis of uncertainty in perceptual category learning through varying levels of distortion. J. Cogn. Neurosci. 23, 1781–1793.
Diana, R. A., Yonelinas, A. P., and Ranganath, C. (2010). Medial temporal lobe activity during source retrieval reflects information type, not memory strength. J. Cogn. Neurosci. 22, 1808–1818.
Dolan, R. J., Fink, G. R., Rolls, E., Booth, M., Holmes, A., Frackowiak, R. S., and Friston, K. J. (1997). How the brain learns to see objects and faces in an impoverished context. Nature 389, 596–599.
Ellis, P. D. (2010). The Essential Guide to Effect Sizes: Statistical Power, Meta-Analysis, and the Interpretation of Research Results. Cambridge, NY: Cambridge University Press.
Epshtein, B., Lifshitz, I., and Ullman, S. (2008). Image interpretation by a single bottom-up top-down cycle. Proc. Natl. Acad. Sci. U.S.A. 105, 14298–14303.
Epstein, R., Harris, A., Stanley, D., and Kanwisher, N. (1999). The parahippocampal place area: recognition, navigation, or encoding? Neuron 23, 115–125.
Epstein, R., and Kanwisher, N. (1998). A cortical representation of the local visual environment. Nature 392, 598–601.
Evans, A. C., Collins, D. L., Mills, S. R., Brown, E. D., Kelly, R. L., and Peters, T. M. (1993). “3D statistical neuroanatomical models from 305 MRI volumes,” in Proceedings of IEEE-Nuclear Science Symposium and Medical Imaging Conference. (Cambridge, MA: MIT Press), 1813–1817.
Friston, K. J. (2007). Statistical Parametric Mapping: The Analysis of Funtional Brain Images, 1st Edn. Amsterdam; Boston: Elsevier/Academic Press.
Ganel, T., Gonzalez, C. L., Valyear, K. F., Culham, J. C., Goodale, M. A., and Kohler, S. (2006). The relationship between fMRI adaptation and repetition priming. Neuroimage 32, 1432–1440.
Gauthier, I., Curran, T., Curby, K. M., and Collins, D. (2003). Perceptual interference supports a non-modular account of face processing. Nat. Neurosci. 6, 428–432.
Grill-Spector, K. (2003). The neural basis of object perception. Curr. Opin. Neurobiol. 13, 159–166.
Grill-Spector, K., Kourtzi, Z., and Kanwisher, N. (2001). The lateral occipital complex and its role in object recognition. Vision Res. 41, 1409–1422.
Grill-Spector, K., and Malach, R. (2004). The human visual cortex. Annu. Rev. Neurosci. 27, 649–677.
Hanlon, R. T., Naud, M. J., Forsythe, J. W., Hall, K., Watson, A. C., and McKechnie, J. (2007). Adaptable night camouflage by cuttlefish. Am. Nat. 169, 543–551.
Hegdé, J., Bart, E., and Kersten, D. (2008a). Fragment-based learning of visual object categories. Curr. Biol. 18, 597–601.
Hegdé, J., Fang, F., Murray, S. O., and Kersten, D. (2008b). Preferential responses to occluded objects in the human visual cortex. J. Vis. 8, 16.11–16.16.
Joseph, J. E., Partin, D. J., and Jones, K. M. (2002). Hypothesis testing for selective, differential, and conjoined brain activation. J. Neurosci. Methods 118, 129–140.
Kersten, D., Mamassian, P., and Yuille, A. (2004). Object perception as Bayesian inference. Annu. Rev. Psychol. 55, 271–304.
Kleinbaum, D. G., Klein, M., and Pryor, E. R. (2002). Logistic Regression: A Self-learning Text, 2nd Edn. New York, NY: Springer.
Koechlin, E., and Hyafil, A. (2007). Anterior prefrontal function and the limits of human decision-making. Science 318, 594–598.
Kourtzi, Z., Betts, L. R., Sarkheil, P., and Welchman, A. E. (2005). Distributed neural plasticity for shape learning in the human visual cortex. PLoS Biol. 3:e204. doi: 10.1371/journal.pbio.0030204
Kriegeskorte, N., Simmons, W. K., Bellgowan, P. S., and Baker, C. I. (2009). Circular analysis in systems neuroscience: the dangers of double dipping. Nat. Neurosci. 12, 535–540.
Levi, D. M. (2008). Crowding–an essential bottleneck for object recognition: a mini-review. Vision Res. 48, 635–654.
Li, N., Cox, D. D., Zoccolan, D., and DiCarlo, J. J. (2009). What response properties do individual neurons need to underlie position and clutter “invariant” object recognition? J. Neurophysiol. 102, 360–376.
McKeeff, T. J., and Tong, F. (2007). The timing of perceptual decisions for ambiguous face stimuli in the human ventral visual cortex. Cereb. Cortex 17, 669–678.
Moore, C., and Engel, S. A. (2001). Neural response to perception of volume in the lateral occipital complex. Neuron 29, 277–286.
Motter, B. C., and Simoni, D. A. (2007). The roles of cortical image separation and size in active visual search performance. J. Vis. 7, 6.1–6.15.
Murray, E. A., Bussey, T. J., and Saksida, L. M. (2007). Visual perception and memory: a new view of medial temporal lobe function in primates and rodents. Annu. Rev. Neurosci. 30, 99–122.
Murray, S. O., Kersten, D., Olshausen, B. A., Schrater, P., and Woods, D. L. (2002). Shape perception reduces activity in human primary visual cortex. Proc. Natl. Acad. Sci. U.S.A. 99, 15164–15169.
Nandy, A. S., and Tjan, B. S. (2008). Efficient integration across spatial frequencies for letter identification in foveal and peripheral vision. J. Vis. 8, 3.1–3.20.
Nomura, E. M., and Reber, P. J. (2008). A review of medial temporal lobe and caudate contributions to visual category learning. Neurosci. Biobehav. Rev. 32, 279–291.
Ollinger, J. M., Corbetta, M., and Shulman, G. L. (2001a). Separating processes within a trial in event-related functional MRI. Neuroimage 13, 218–229.
Ollinger, J. M., Shulman, G. L., and Corbetta, M. (2001b). Separating processes within a trial in event-related functional MRI. Neuroimage 13, 210–217.
Op de Beeck, H. P., Wagemans, J., and Vogels, R. (2007). Effects of perceptual learning in visual backward masking on the responses of macaque inferior temporal neurons. Neuroscience 145, 775–789.
Pelli, D. G., and Tillman, K. A. (2008). The uncrowded window of object recognition. Nat. Neurosci. 11, 1129–1135.
Poldrack, R. A., Clark, J., Pare-Blagoev, E. J., Shohamy, D., Creso Moyano, J., Myers, C., and Gluck, M. A. (2001). Interactive memory systems in the human brain. Nature 414, 546–550.
Poldrack, R. A., and Foerde, K. (2008). Category learning and the memory systems debate. Neurosci. Biobehav. Rev. 32, 197–205.
Poldrack, R. A., Sabb, F. W., Foerde, K., Tom, S. M., Asarnow, R. F., Bookheimer, S. Y., and Knowlton, B. J. (2005). The neural correlates of motor skill automaticity. J. Neurosci. 25, 5356–5364.
Reddy, L., Quiroga, R. Q., Wilken, P., Koch, C., and Fried, I. (2006). A single-neuron correlate of change detection and change blindness in the human medial temporal lobe. Curr. Biol. 16, 2066–2072.
Rolls, E. T., Tromans, J. M., and Stringer, S. M. (2008). Spatial scene representations formed by self-organizing learning in a hippocampal extension of the ventral visual system. Eur. J. Neurosci. 28, 2116–2127.
Schacter, D. L., Wig, G. S., and Stevens, W. D. (2007). Reductions in cortical activity during priming. Curr. Opin. Neurobiol. 17, 171–176.
Seger, C. A., and Miller, E. K. (2010). Category learning in the brain. Annu. Rev. Neurosci. 33, 203–219.
Sela, Y., Freiman, M., Dery, E., Edrei, Y., Safadi, R., Pappo, O., Joskowicz, L., and Abramovitch, R. (2011). fMRI-based hierarchical SVM model for the classification and grading of liver fibrosis. IEEE Trans. Biomed. Eng. 58, 2574–2581.
Serences, J. T. (2004). A comparison of methods for characterizing the event-related BOLD timeseries in rapid fMRI. Neuroimage 21, 1690–1700.
Stringer, S. M., and Rolls, E. T. (2000). Position invariant recognition in the visual system with cluttered environments. Neural Netw. 13, 305–315.
Stringer, S. M., and Rolls, E. T. (2008). Learning transform invariant object recognition in the visual system with multiple stimuli present during training. Neural Netw. 21, 888–903.
Stuss, D. T., and Knight, R. T. (2002). Principles of Frontal Lobe Function. Oxford, NY: Oxford University Press.
Suzuki, W. A., and Baxter, M. G. (2009). Memory, perception, and the medial temporal lobe: a synthesis of opinions. Neuron 61, 678–679.
Teng, E., Stefanacci, L., Squire, L. R., and Zola, S. M. (2000). Contrasting effects on discrimination learning after hippocampal lesions and conjoint hippocampal-caudate lesions in monkeys. J. Neurosci. 20, 3853–3863.
Ullman, S., Vidal-Naquet, M., and Sali, E. (2002). Visual features of intermediate complexity and their use in classification. Nat. Neurosci. 5, 682–687.
Ungerleider, L. G., and Bell, A. H. (2011). Uncovering the visual “alphabet”: advances in our understanding of object perception. Vision Res. 51, 782–799.
Van Essen, D. C., Drury, H. A., Dickson, J., Harwell, J., Hanlon, D., and Anderson, C. H. (2001). An integrated software suite for surface-based analyses of cerebral cortex. J. Am. Med. Inform. Assoc. 8, 443–459.
Vann, S. D., and Albasser, M. M. (2011). Hippocampus and neocortex: recognition and spatial memory. Curr. Opin. Neurobiol. 21, 440–445.
Voermans, N. C., Petersson, K. M., Daudey, L., Weber, B., Van Spaendonck, K. P., Kremer, H. P., and Fernandez, G. (2004). Interaction between the human hippocampus and the caudate nucleus during route recognition. Neuron 43, 427–435.
Wee, C. Y., Yap, P. T., Zhang, D., Denny, K., Browndyke, J. N., Potter, G. G., Welsh-Bohmer, K. A., Wang, L., and Shen, D. (2012). Identification of MCI individuals using structural and functional connectivity networks. Neuroimage 59, 2045–2056.
Wong, A. C., Palmeri, T. J., Rogers, B. P., Gore, J. C., and Gauthier, I. (2009). Beyond shape: how you learn about objects affects how they are represented in visual cortex. PLoS ONE 4:e8405. doi: 10.1371/journal.pone.0008405
Yi, D., Olson, I. R., and Chun, M. M. (2006). Shape-specific perceptual learning in a figure-ground segregation task. Vis. Res. 46, 914–924.
Yotsumoto, Y., Watanabe, T., and Sasaki, Y. (2008). Different dynamics of performance and brain activation in the time course of perceptual learning. Neuron 57, 827–833.
Yuille, A., and Kersten, D. (2006). Vision as Bayesian inference: analysis by synthesis? Trends Cogn. Sci. 10, 301–308.
Zhang, J., and Kourtzi, Z. (2010). Learning-dependent plasticity with and without training in the human brain. Proc. Natl. Acad. Sci. U.S.A. 107, 13503–13508.
Zhang, J., Liang, L., Anderson, J. R., Gatewood, L., Rottenberg, D. A., and Strother, S. C. (2008). Evaluation and comparison of GLM- and CVA-based fMRI processing pipelines with Java-based fMRI processing pipeline evaluation system. Neuroimage 41, 1242–1252.
Zoccolan, D., Kouh, M., Poggio, T., and DiCarlo, J. J. (2007). Trade-off between object selectivity and tolerance in monkey inferotemporal cortex. J. Neurosci. 27, 12292–12307.
Appendix
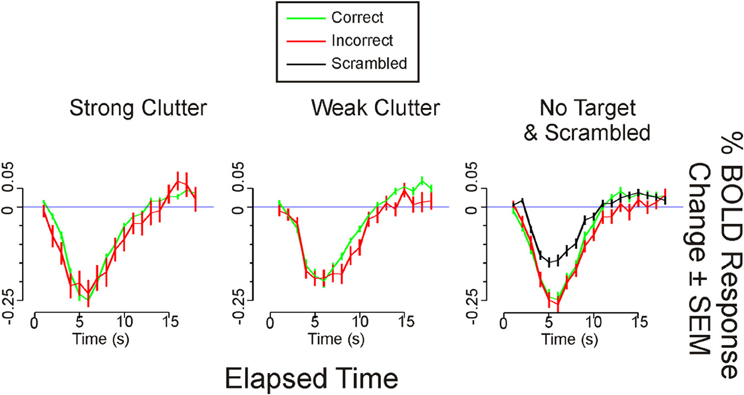
Figure A1. Time course of BOLD responses in bilateral medial occipital cortex. The time course of each given condition from each given ROI was calculated as the mean response (±SEM) across all sessions and subjects as determined by FIR modeling (Method 1; Materials and Methods). During the strong clutter and weak clutter conditions, the correct response was a “Target Present” report, whereas during the no target condition, the correct response was a “Target Absent” report. For these three conditions, the BOLD time courses are shown separately for correct vs. incorrect responses. For the “Scrambled” condition, all subjects provided the expected response in all trials, so that incorrect responses were not available.
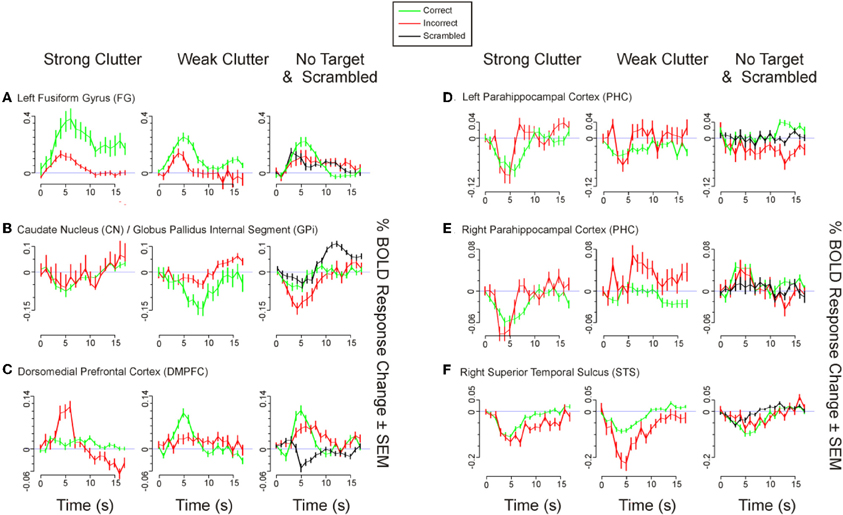
Figure A2. Time course of BOLD responses for selected ROIs in Table 2 in the main text. BOLD time courses are shown for those six ROIs in Table 2 (color-highlighted in Table 2) that showed significant correlation with the behavioral responses. Time courses were calculated and plotted as described in the legend to Figure A1.
Keywords: clutter tolerance, camouflage, configural processing, crowding, perceptual learning, pop-out, visual context, visual search
Citation: Hegdé J, Thompson SK, Brady M and Kersten D (2012) Object recognition in clutter: cortical responses depend on the type of learning. Front. Hum. Neurosci. 6:170. doi: 10.3389/fnhum.2012.00170
Received: 06 January 2012; Accepted: 24 May 2012;
Published online: 19 June 2012.
Edited by:
Srikantan S. Nagarajan, University of California, San Francisco, USAReviewed by:
Sara L. Gonzalez Andino, Hôpitaux Universitaires de Genève, SwitzerlandShugao Xia, Yeshiva University, USA
Copyright: © 2012 Hegdé, Thompson, Brady and Kersten. This is an open-access article distributed under the terms of the Creative Commons Attribution Non Commercial License, which permits non-commercial use, distribution, and reproduction in other forums, provided the original authors and source are credited.
*Correspondence: Jay Hegdé, Department of Ophthalmology, Vision Discovery Institute, Brain and Behavior Discovery Institute, Georgia Health Sciences University, CL-3033, 1120 15th Street, Augusta, GA 30912, USA. e-mail:amhlZ2RlQGdlb3JnaWFoZWFsdGguZWR1