 Noman Naseer
 Farzan M. Noori
 Nauman K. Qureshi
 Keum-Shik Hong
- 1Department of Mechatronics Engineering, Air University, Islamabad, Pakistan
- 2Department of Cogno-Mechatronics, School of Mechanical Engineering, Pusan National University, Busan, Korea
In this study, we determine the optimal feature-combination for classification of functional near-infrared spectroscopy (fNIRS) signals with the best accuracies for development of a two-class brain-computer interface (BCI). Using a multi-channel continuous-wave imaging system, mental arithmetic signals are acquired from the prefrontal cortex of seven healthy subjects. After removing physiological noises, six oxygenated and deoxygenated hemoglobin (HbO and HbR) features—mean, slope, variance, peak, skewness and kurtosis—are calculated. All possible 2- and 3-feature combinations of the calculated features are then used to classify mental arithmetic vs. rest using linear discriminant analysis (LDA). It is found that the combinations containing mean and peak values yielded significantly higher (p < 0.05) classification accuracies for both HbO and HbR than did all of the other combinations, across all of the subjects. These results demonstrate the feasibility of achieving high classification accuracies using mean and peak values of HbO and HbR as features for classification of mental arithmetic vs. rest for a two-class BCI.
Introduction
Engineering principles and techniques are nowadays becoming crucial aspects of development in the medical fields. Key examples are the diagnosis and cure of various diseases in the human body. Over the past few decades, the brain-computer interface (BCI), as utilized with computers and other external devices, has become an indispensable medium of communication for patients suffering from amyotrophic lateral sclerosis (ALS), locked-in syndrome (LIS) and other physical disabilities. Brain-signal acquisition methods for BCI are either invasive or non-invasive. Invasive brain-signal acquisition methods, albeit allowing for acquisition of fine-quality brain signals, incur the risks of surgery (Wester et al., 2009; Thongpang et al., 2011; Viventi et al., 2011). Non-invasive methods, therefore, are preferred. There are several types of non-invasive brain-signal acquisition methods, including electroencephalography (EEG) (Wolpaw et al., 2002; Salvaris and Sepulveda, 2010; Choi, 2013), functional magnetic resonance imaging (fMRI) (Enzinger et al., 2008; Sorger et al., 2009) and functional near infrared spectroscopy (fNIRS) (Ferrari et al., 1985; Kato et al., 1993; Coyle et al., 2004, 2007; Naito et al., 2007; Naseer and Hong, 2013; Naseer et al., 2014). fNIRS has better spatial resolution than most of the EEG systems (Hu et al., 2012; Hong et al., 2014). Furthermore, fNIRS signals are free of electrical noises and use of conductive gels. fMRI provides a good spatial resolution, though the equipment is bulky and, therefore, not feasible for a portable BCI. For recent BCI applications rather, fNIRS has been utilized owing to its balanced spatial and temporal resolutions, low noise, safety and overall ease of use. Indeed, it has been shown to work well for binary communication with high classification accuracies (Naseer et al., 2014). fNIRS has become a neuroimaging technique which is contributing in making advances toward the understanding of the human brain functionality (Irani et al., 2007; Ferrari and Quaresima, 2012; Hong and Nguyen, 2014; Hong and Naseer, 2016; Hong and Santosa, 2016).
fNIRS consists of near-infrared (NI) emitters that emit light within the 650~1000 nm wavelength range in order to measure changes in the concentrations of oxygenated hemoglobin and deoxygenated hemoglobin (△cHbO(t) and △cHbR(t)) (Villringer et al., 1993; Hoshi et al., 1994; Hoshi and Tamura, 1997). Oxygenated and deoxygenated hemoglobin (HbO and HbR) have diverse absorption spectra in the NI range; therefore, the association between the exiting- and incident-photon intensities can be used to calculate △cHbO(t) and △cHbR(t) on the photon paths by application of the modified Beer-Lamberts law (Delpy et al., 1988; Sassaroli and Fantini, 2004). Since Jobsis (1977) introduced the principle of near-infrared spectroscopy, it has been effectively employed for functional and structural brain imaging as well as BCI purposes (Hu et al., 2010, 2011, 2012, 2013; Cutini et al., 2012; Aqil et al., 2012a,b; Bhutta et al., 2014, 2015; Hong et al., 2014; Khan et al., 2014).
With fNIRS-BCI systems, the user elicits distinct brain-signal patterns by performing different mental tasks such as motor imagery (Coyle et al., 2004, 2007), mental arithmetic (MA) (Naito et al., 2007; Bauernfeind et al., 2008, 2011; Utsugi et al., 2008), music imagery (Naito et al., 2007; Power et al., 2010; Falk et al., 2011) and others. Pattern recognition techniques are then used to identify and recognize these signals. The related command signals can then be generated to communicate with a computer or external device in ways intended by the user. After the suitable signals are acquired from a specific brain region, noise removal techniques are used to remove the noises such as experimental, instrumental and physiological (cardiac and respiratory activities) (Kirilina et al., 2012; Santosa et al., 2013; Bajaj et al., 2014). Since these noises are uncorrelated with the experimental paradigm, the effect of these noises in fNIRS signals might yield to false or biased conclusions (Cui et al., 2010b; Santosa et al., 2014; Naseer and Hong, 2015a). The next step is feature extraction, based on which the signals are classified. In the relevant previous studies, the different statistical properties of time-domain signals have been used as features for classification; those properties include the mean, variance, slope, kurtosis, peak value and skewness, among others. To date, however, optimal feature-combination selection for the best classification accuracies has not been demonstrated.
The objective of the present study was to determine the optimal 2- and 3-feature combinations (among mean, variance, slope, kurtosis, peak value, and skewness) that yield the best “mental arithmetic task vs. rest” classification accuracies for a two-class fNIRS-BCI using linear discriminant analysis (LDA). After acquiring fNIRS signals representing mental arithmetic tasks or rest from the prefrontal cortex, noises were removed using a notch filter. Then, the six features noted above were calculated according to the △cHbO(t) and △cHbR(t) signals; all of the possible 2- and 3-feature combinations of those features were used to train the LDA (Lotte et al., 2007; Luu and Chau, 2009; Moghimi et al., 2012; Hong et al., 2014) classifier. For each of those combinations, the classification performance was evaluated using 10-fold cross-validation.
Materials and Methods
fNIRS Data Acquisition
A multichannel continuous-wave imaging system (DYNOT: DYnamic Near-infrared Optical Tomography; two wavelengths: 760 and 830 nm; NIRx Medical Technologies, NY) was used to acquire brain signals at a sampling rate of 1.81 Hz. The continuous-wave fNIRS detects the △cHbO(t) and △cHbR(t) in the microvessels of the cortex according to the modified Beer-Lamberts law:
where △A(t; ;λj) (j = 1.2) is the unit-less absorbance (optical density) variation of a light emitter of wavelength λj, aHbX(λj) is the extinction coefficient of HbX (HbO and HbR) in μM−1 mm−1, d is the unit-less differential path length factor (DPF), and l is the distance (in millimeters) between emitter and detector. The placement of the fNIRS optodes plays a crucial role in signal measurement, since a longer emitter-detector distance makes for greater imaging depth (McCormick et al., 1992). Usually an emitter-detector distance of around 2.5~3.5 cm is applied, because a distance less than 2 cm might result in only superficial-layer signal capture, while a distance more than 4 cm usually is too weak to be usable (Gratton et al., 2006).
We applied a 2.8 cm emitter-detector distance, as shown in Figure 1, in order to acquire brain signals resulting from mental arithmetic tasks. To that end, 4 near-infrared light emitters and 10 detectors were positioned over the prefrontal cortex, as it is known that mental arithmetic activates the prefrontal cortex of the brain (Ayaz et al., 2013, 2014; Khan et al., 2014; Di Domenico et al., 2015).
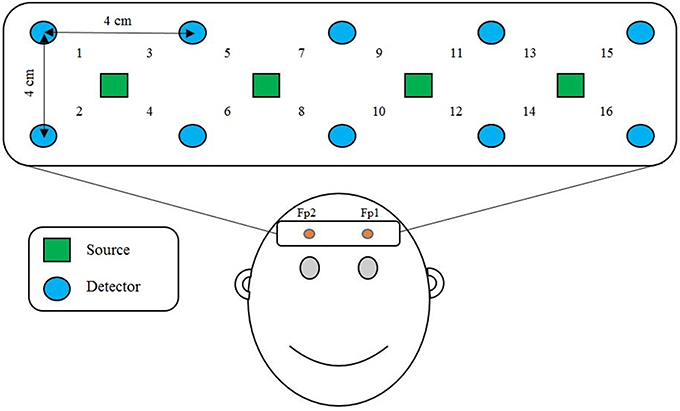
Figure 1. Optode placement and channel location on the prefrontal cortex. Fp1 and Fp2 are the reference points of the International 10–20 system.
Experimental Procedure
Seven male subjects (mean age 30.5 ± 5 years) participated in the experiments. The subjects were seated in a comfortable chair in front of a computer monitor. They were asked to relax and restrict their head movements as much as possible while performing a mental arithmetic task. The first 44 s was a rest period to set up the baseline condition; this was followed by a 44 s mental arithmetic task period, which was followed in turn by another 44 s rest period to allow the signals to return to the baseline values before the start of the next trial. The above sequence was repeated 5 times for a total experimental duration of 440 s for each subject. During the mental arithmetic task period, the participants performed a series of mental arithmetic calculations that appeared on the monitor in a pseudo-random order. These calculations consisted of subtraction of a two-digit number (between 10 and 20) from a three-digit number throughout the task period with successive subtraction of a two-digit number from the result of the previous subtraction (e.g., 244−14, 240−11, 229−16, etc.)(Power et al., 2011; Naseer et al., 2014; Naseer and Hong, 2015b). During the rest period the subjects were asked to relax and continue looking at the monitor. The experiments were conducted in accordance with the latest declaration of Helsinki and a verbal consent was taken from all the subjects after explaining the experimental paradigm. The work was approved by the Institutional Review Board of Pusan National University.
Signal Processing and Classification
The optical-density signals acquired were first converted to △cHbX(t) signals using Equation (1). Then, they were filtered using a notch filter with band-reject ranges of 1~1.2 Hz, 0.3~0.4 Hz, and below 0.1 Hz (Naseer and Hong, 2015a) in order to reduce physiological noises due to heartbeat, respiration, and Mayer waves and low frequency fluctuations (Bajaj et al., 2013), respectively. The frequency range considered for analysis was 0.1~0.3 Hz. Detrending of the data was performed using NIRS-SPM (Ye et al., 2009).
In this study, only the △cHbO(t) and △cHbR(t) signals were considered as features (Rejer, 2015) for classification. Although, fNIRS also provides changes in total concentration, △cHbT(t). However, since △cHbT(t) is just the addition of △cHbO(t) and △cHbR(t), it does not provide extra discriminative information and, therefore, has not been used as a feature for classification in most of the previous fNIRS-BCI studies (Bhutta et al., 2014; Khan et al., 2014; Santosa et al., 2014; Naseer and Hong, 2015b).
As classification features, all of the possible 2- and 3-feature combinations of signal slope, signal mean, signal variance, signal peak, signal kurtosis and signal skewness were considered as in Khan and Hong (2015). The signal mean of △HbO and △HbR are calculated as:
where M is the mean value, N is the number of observations and Xi represents the HbO or HbR data. The variance is calculated as follows:
where var is the variance, μ is the mean value of X. The skewness is computed as follows:
where skew is the skewness,E is the expected value of X and σ is the standard deviation of X. The kurtosis is computed as follows:
The signal peak is estimated using the Matlab max function. The signal slope is determined by fitting a line to all the data points during the mental arithmetic and rest using polyfit function in Matlab. These features were calculated for the mental arithmetic and rest periods across all 16 channels. The aim of classification was to decode the subject's state as “mental arithmetic task” or “rest task” with maximal accuracy. All of the feature values were scaled between 0 and 1 using the equation:
where x∈Rn denotes the original feature vales, x′ denotes the rescaled feature values between 0 and 1, max (x) is the largest value, and min (x) is the smallest value.
The method utilized in the present study to classify all possible 2- and 3-feature combinations of features extracted from the △cHbO(t) and △cHbR(t)signals was classified using LDA. LDA, a linear classifier, uses hyper-planes to separate the diverse classes of data (Lotte et al., 2007). The dividing hyper-plane is intended to maximize the separation between the class mean and minimize the inter-class variance. Owing to its ease of use and execution speed, LDA performs well in various BCI problems (Lotte et al., 2007; Salvaris and Sepulveda, 2010; Power et al., 2012a,b). Each classification performance was evaluated by 10-fold cross-validation over the course of 10 runs. Figure 2 shows the 2-dimensional feature spaces of subject 1 for all combinations.
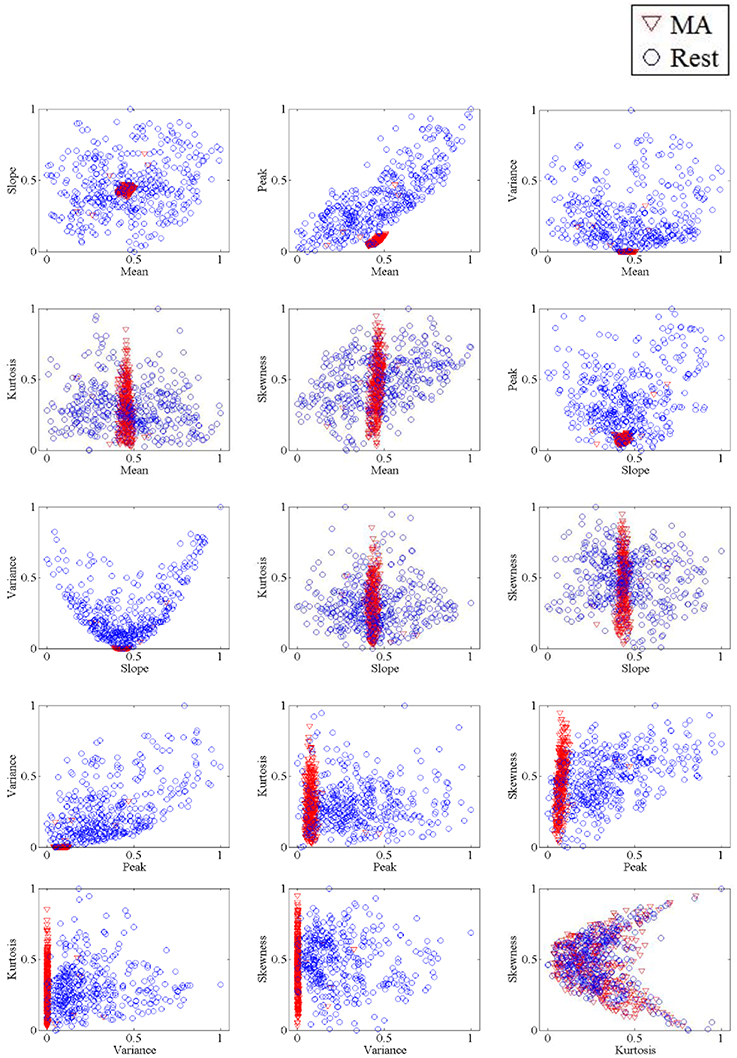
Figure 2. The 2-dimensional feature spaces of Subject 1 for all combinations of HbO features.
Results
For each subject, the classification accuracies obtained for all possible combinations of 2- and 3-features extracted using △cHbO(t) and △cHbR(t) are shown in Tables 1–4, respectively. The classification accuracies acquired using the 2-feature combination of peak and mean values were 93.0 and 89.9% using △cHbO(t) and △cHbR(t) signals, respectively. The classification accuracies obtained using the 3-feature combinations were correspondingly higher in the combinations including mean and peak values. In fact, these accuracies were higher as compared with all other possible combinations across all subjects for both △cHbO(t) and △cHbR(t) signals. To verify that the higher classification accuracies acquired using peak and mean values were statistically significant, we applied the permutation test. The p-values obtained using mean and peak values vs. all other combinations were less than 0.05 for both △cHbO(t) and △cHbR(t) signals, which established that the performance of the mean and peak value combination was statistically significant.
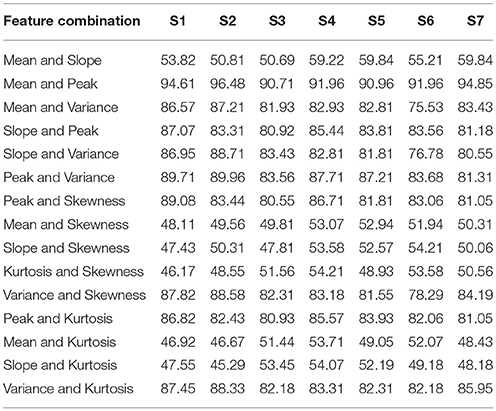
Table 1. The classification accuracies of all 2-feature combinations obtained from HbO signals for all subjects.
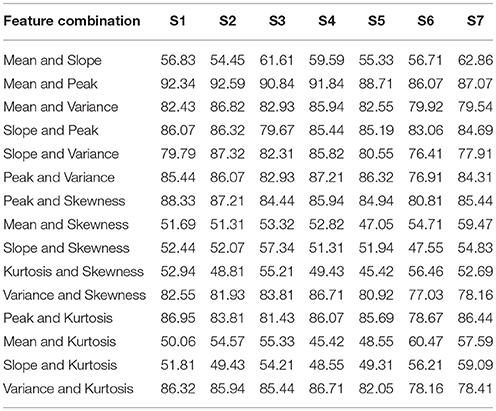
Table 2. The classification accuracies of all 2-feature combinations obtained from HbR signals for all subjects.
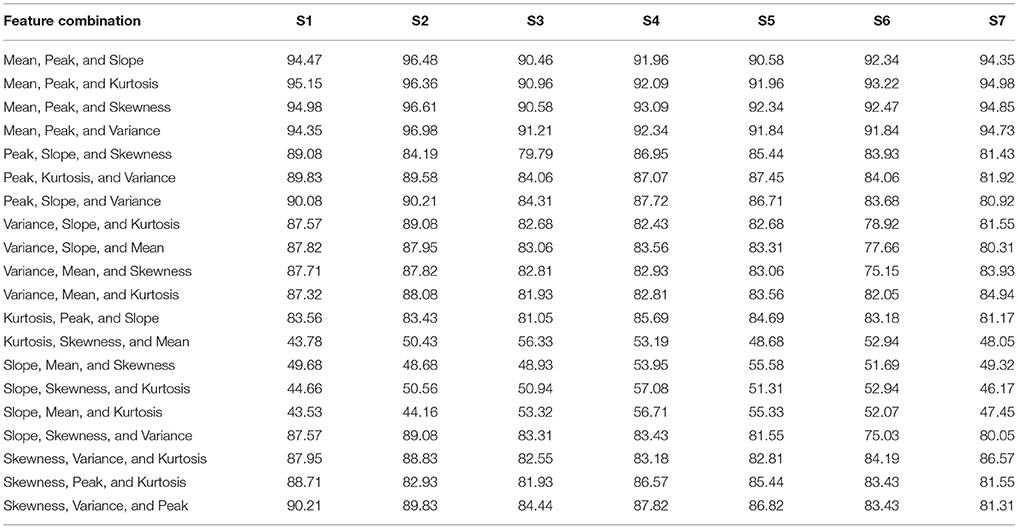
Table 3. The classification accuracies of all 3-feature combinations obtained from HbO signals for all subjects.
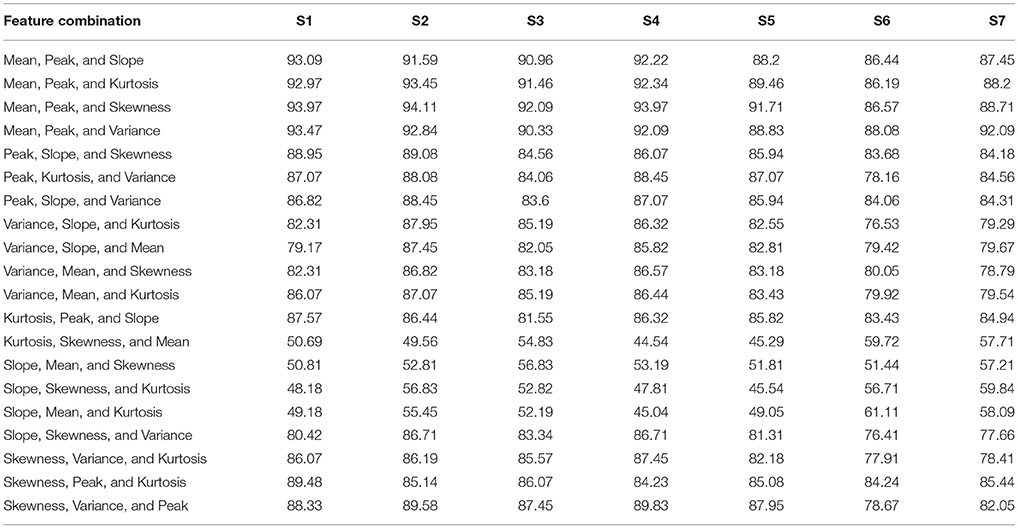
Table 4. The classification accuracies of all 3-feature combinations obtained from HbR signals for all subjects.
Discussion
Previous fNIRS-based BCI studies have mostly emphasized advanced signal-processing techniques and improved algorithms to improve classification accuracy and, thereby, enhance BCI performance (Sitaram et al., 2007; Power et al., 2010, 2011; Bauernfeind et al., 2011; Holper and Wolf, 2011; Abibullaev and An, 2012). These studies used mean (Sitaram et al., 2007; Power et al., 2010; Holper and Wolf, 2011; Faress and Chau, 2013; Naseer and Hong, 2013, 2015b; Power and Chau, 2013; Hong et al., 2014), variance (Tai and Chau, 2009; Holper and Wolf, 2011), slope (Tai and Chau, 2009; Power et al., 2011; Naseer and Hong, 2013, 2015b; Hong et al., 2014), kurtosis (Holper and Wolf, 2011), peak value (Tai and Chau, 2009; Cui et al., 2010a; Bauernfeind et al., 2011; Holper and Wolf, 2011) and skewness (Tai and Chau, 2009; Holper and Wolf, 2011) as features for classification (a detailed review of features used in the previous studies is provided in Naseer and Hong, 2015a). However, all of these feature might not contain discriminative information for classification and, therefore, in order to achieve high performance for fNIRS-based BCI systems different feature-combinations should be tested. In the current study, to improve the accuracy of “mental arithmetic vs. rest task” discrimination, various feature combinations were used to determine the single best combination for a two-class fNIRS-based BCI system. To the best of our knowledge, this is the first study to evaluate classification performance based on 2- and 3-feature combinations to determine those yielding the highest classification accuracies in discriminating mental arithmetic from rest tasks. The results demonstrate that the feature combination of peak and mean is the best among all possible combinations for both △cHbO(t) and △cHbR(t) signals. Furthermore, the peak-and-mean feature combination is the only one for which all subjects showed classification accuracies over 89%. Figure 3 plots the average classification accuracies of all 2-features combinations across all subjects for △cHbO(t) and △cHbR(t) signals, respectively; Figure 4 plots the average classification accuracies of all 3-features combinations across all subjects for △cHbO(t) and △cHbR(t) signals, respectively.
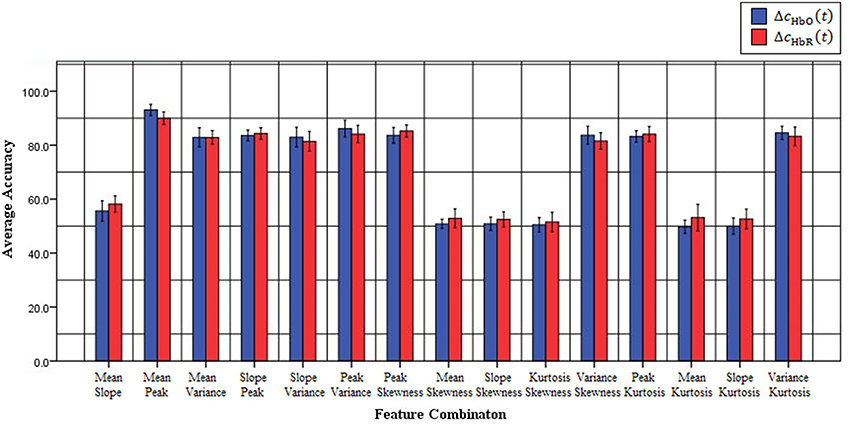
Figure 3. Classification accuracies of all possible 2-feature combinations averaged across all subjects using △cHbO(t) and △cHbR(t)signals.
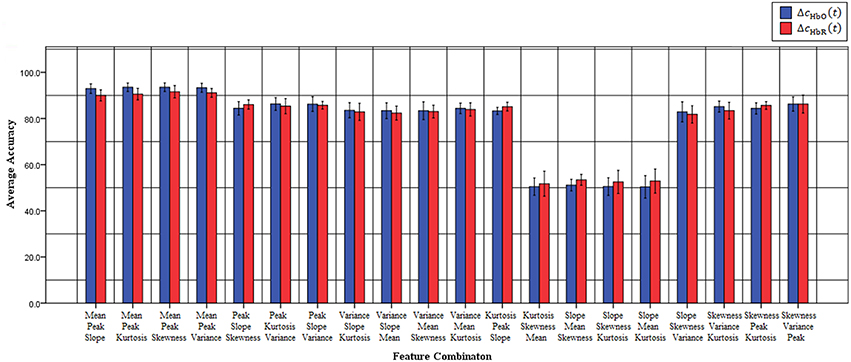
Figure 4. Classification accuracies of all possible 3-feature combinations averaged across all subjects using △cHbO(t) and △cHbR(t) signals.
Mental arithmetic and rest have been classified using LDA in previous studies. For example, Naseer et al. (2014) classified mental arithmetic vs. rest with accuracies of 74.2% using mean values of △cHbO(t) and △cHbR(t). In the present study, the optimal combination yielded a higher, 93% accuracy. Khan and Hong (2015) used 2-feature combinations of 8 features (28 combinations of 7 HbO-based features and 1 HbR-based feature) to demonstrate the feasibility of using mean and peak values to achieve high classification accuracies of up to 84.6%. In our study, we used both 2- and 3-feature combinations of 6 HbO and 6 HbR features, thus making for a total of 70 (30 2-feature and 40 3-feature) combinations. With regard to the 3-feature combinations, those including mean and peak features yielded higher accuracies ranging from 92 to 94%. Furthermore, Khan and Hong's (2015) study was based on a passive driving-task BCI, whereas ours dealt with an active, arithmetic-task BCI.
This study has some limitations. The first is that only mean, peak, slope, variance, skewness and kurtosis, 2- and 3- feature combinations of HbO and HbR were used. The rationale, however, was that these features are the most commonly used in fNIRS-based BCI studies (Naseer and Hong, 2015a). The second limitation of our study is the small sample size and low number of subjects. Usually in fNIRS based BCI studies, 7–12 persons are considered enough for data acquisition (Penny et al., 2000; Hu et al., 2012; Zimmermann et al., 2013; Hong et al., 2014; Naseer and Hong, 2015b). However, using more subjects might be desirable to validate the findings. The third limitation is that only LDA is used to acquire classification accuracies and generalization to other classifiers is not done. However, the authors, in their future work, are working on finding the effects of using these optimal features on several other classifiers. The fourth limitation is that only two mental tasks (mental arithmetic and rest) were considered, which fact restricts the present study to a two-class BCI problem. For three-class BCI problems and above, other features and/or combinations might yield better results. Certainly, further research entailing multiple-mental-task classification using multiple-dimension optimal-feature combinations IS required.
Conclusion
In this study we examined the effects of using different combinations of six commonly used features for classification of a two-class functional near-infrared spectroscopy (fNIRS)-based BCI based on mental arithmetic and rest tasks. It was shown that the combination of the peak and mean values of the changes in the concentrations of oxygenated hemoglobin (HbO) and deoxygenated hemoglobin (HbR) yielded the best average LDA-classification results for 2- as well as 3-feature sets across seven subjects. These results represent a step forward in the ongoing efforts to improve the classification accuracies of fNIRS-based BCI systems.
Author Contributions
NN conceived this study and was involved in experiments, data processing and writing of the manuscripts. FN and NQ performed the data analysis and wrote the manuscript. KH suggested the theoretical aspects of the current study and participated in revising the manuscript.
Conflict of Interest Statement
The authors declare that the research was conducted in the absence of any commercial or financial relationships that could be construed as a potential conflict of interest.
Acknowledgments
This work was supported by the National Research Foundation of Korea under the auspices of the Ministry of Science, ICT and Future Planning, Korea (grant no. NRF-2014R1A2A1A10049727) and the Higher Education Commission (HEC) of Pakistan (grant no. SRGP-726).
References
Abibullaev, B., and An, J. (2012). Classification of frontal cortex hemodynamic responses during cognitive tasks using wavelet transforms and machine learning algorithms. Med. Eng. Phys. 34, 1394–1410. doi: 10.1016/j.medengphy.2012.01.002
Aqil, M., Hong, K.-S., Jeong, M.-Y., and Ge, S. S. (2012a). Cortical brain imaging by adaptive filtering of NIRS signals. Neurosci. Lett. 514, 35–41. doi: 10.1016/j.neulet.2012.02.048
Aqil, M., Hong, K.-S., Jeong, M.-Y., and Ge, S. S. (2012b). Detection of event-related hemodynamic response to neuroactivation by dynamic modeling of brain activity. Neuroimage 63, 553–568. doi: 10.1016/j.neuroimage.2012.07.006
Ayaz, H., Onaral, B., Izzetoglu, K., Shewokis, P. A., McKendrick, R., and Parasuraman, R. (2013). Continuous monitoring of brain dynamics with functional near infrared spectroscopy as a tool for neuroergonomic research: empirical examples and a technological development. Front. Hum. Neurosci. 7:871. doi: 10.3389/fnhum.2013.00871
Ayaz, H., Shewokis, P. A., Scull, L., Libon, D. J., Feldman, S., Eppig, J., et al. (2014). Assessment of prefrontal cortex activity in amyotrophic lateral sclerosis patients with functional near infrared spectroscopy. J. Neurosci. Neuroeng. 3, 41–51. doi: 10.1166/jnsne.2014.1095
Bajaj, S., Adhikari, B. M., and Dhamala, M. (2013). Higher frequency network activity flow predicts lower frequency node activity in intrinsic low-frequency BOLD fluctuations. PLoS ONE 8:e64466. doi: 10.1371/journal.pone.0064466
Bajaj, S., Drake, D., Butler, A. J., and Dhamala, M. (2014). Oscillatory motor network activity during rest and movement: an fNIRS study. Front. Syst. Neurosci. 8:13. doi: 10.3389/fnsys.2014.00013
Bauernfeind, G., Leeb, R., Wriessnegger, S. C., and Pfurtscheller, G. (2008). Development, set-up and first results for a one-channel near-infrared spectroscopy system. Biomed. Tech. 53, 36–43. doi: 10.1515/BMT.2008.005
Bauernfeind, G., Scherer, R., Pfurtscheller, G., and Neuper, C. (2011). Single-trial classification of antagonistic oxyhemoglobin responses during mental arithmetic. Med. Biol. Eng. Comput. 49, 979–984. doi: 10.1007/s11517-011-0792-5
Bhutta, M. R., Hong, K.-S., Kim, B.-M., Hong, M. J., Kim, Y.-H., and Lee, S.-H. (2014). Note: three wavelengths near-infrared spectroscopy system for compensating the light absorbance by water. Rev. Sci. Intrum. 85:026111. doi: 10.1063/1.4865124
Bhutta, M. R., Hong, M. J., Kim, Y.-H., and Hong, K.-S. (2015). Single-trial lie detection using a combined fNIRS-polygraph system. Front. Psychol. 6:709. doi: 10.3389/fpsyg.2015.00709
Choi, K. (2013). Electroencephalography (EEG)-based neurofeedback training for brain–computer interface (BCI). Exp. Brain Res. 231, 351–365. doi: 10.1007/s00221-013-3699-6
Coyle, S. M., Ward, T. E., and Markham, C. M. (2007). Brain-computer interface using a simplified functional near-infrared spectroscopy system. J. Neural Eng. 4, 219–226. doi: 10.1088/1741-2560/4/3/007
Coyle, S. M., Ward, T. E., Markham, C. M., and McDarby, G. (2004). On the suitability of near-infrared (NIR) systems for next generation brain–computer interfaces. Physiol. Meas. 25, 815–822. doi: 10.1088/0967-3334/25/4/003
Cui, X., Bray, S., and Reiss, A. L. (2010a). Speeded near-infrared spectroscopy (NIRS) response detection. PLoS ONE 5:e15474. doi: 10.1371/journal.pone.0015474
Cui, X., Bray, S., and Reiss, A. L. (2010b). Functional near infrared spectroscopy (NIRS) signal improvement based on negative correlation between oxygenated and deoxygenated hemoglobin dynamics. Neuroimage 49, 3039–3046. doi: 10.1016/j.neuroimage.2009.11.050
Cutini, S., Moro, S. B., and Bisconti, S. (2012). Functional near infrared optical imaging in cognitive neuroscience: an introductory review. J. Near Infrared Spectrosc. 20, 75–92. doi: 10.1255/jnirs.969
Delpy, D. T., Cope, M., van der Zee, P., Arridge, S., Wray, S., and Wyat, J. (1988). Estimation of optical path length through tissue from direct time of flight measurement. Phys. Med. Biol. 33, 1433–1442. doi: 10.1088/0031-9155/33/12/008
Di Domenico, S. I., Rodrigo, A. H., Ayaz, H., Fournier, M. A., and Ruocco, A. C. (2015). Decision-making conflict and the neural efficiency hypothesis of intelligence: a functional near-infrared spectroscopy investigation. Neuroimagine 109, 307–317. doi: 10.1016/j.neuroimage.2015.01.039
Enzinger, C., Ropele, S., Fazekas, F., Loitfelder, M., Gorani, F., Seifert, T., et al. (2008). Brain motor system function in a patient with complete spinal cord injury following extensive brain–computer interface training. Exp. Brain Res. 190, 215–223. doi: 10.1007/s00221-008-1465-y
Falk, T. H., Guirgis, M., Power, S., and Chau, T. (2011). Taking NIRS-BCIs outside the lab: towards achieving robustness against environment noise. IEEE Trans. Neural Syst. Rehabil. Eng. 19, 136–146. doi: 10.1109/TNSRE.2010.2078516
Faress, A., and Chau, T. (2013). Towards a multimodal brain-computer interface: combining fNIRS and fTCD measurements to enable higher classification accuracy. Neuroimage 77, 186–194. doi: 10.1016/j.neuroimage.2013.03.028
Ferrari, M., Giannini, I., Sideri, G., and Zanette, E. (1985). Continuous non-invasive monitoring of human brain by near infrared spectroscopy. Adv. Exp. Med. Biol. 191, 873–882. doi: 10.1007/978-1-4684-3291-6_88
Ferrari, M., and Quaresima, V. (2012). A brief review on the history of human functional near-infrared spectroscopy (fNIRS) development and fields of application. Neuroimage 63, 921–935. doi: 10.1016/j.neuroimage.2012.03.049
Gratton, G., Brumback, C. R., Gordon, B. A., Pearson, M. A., Low, K. A., and Fabiani, M. (2006). Effects of measurement method, wavelength, and source-detector distance on the fast optical signal. Neuroimage 32, 1576–1590. doi: 10.1016/j.neuroimage.2006.05.030
Holper, L., and Wolf, M. (2011). Single-trial classification of motor imagery differing in task complexity: a functional near-infrared spectroscopy study. J. Neuroeng. Rehabil. 8:34. doi: 10.1186/1743-0003-8-34
Hong, K.-S., and Naseer, N. (2016). Reduction of delay in detecting initial dips from functional near-infrared spectroscopy signals using vector-based phase analysis. Int. J. Neur. Syst. 26:1650012. doi: 10.1142/S012906571650012X
Hong, K.-S., Naseer, N., and Kim, Y.-H. (2014). Classification of prefrontal and motor cortex signals for three-class fNIRS-BCI. Neurosci. Lett. 587, 87–92. doi: 10.1016/j.neulet.2014.12.029
Hong, K.-S., and Nguyen, H.-D. (2014). State-space models of impulse hemodynamic responses over motor, somatosensory, and visual cortices. Biomed. Opt. Express 5, 1778–1798. doi: 10.1364/BOE.5.001778
Hong, K.-S., and Santosa, H. (2016). Decoding four different sound-categories in the auditory cortex using functional near-infrared spectroscopy. Hear. Res. 333, 157–166. doi: 10.1016/j.heares.2016.01.009
Hoshi, Y., Onoe, H., Watanabe, Y., Andersson, J., Bergstrom, M., Lilja, A., et al. (1994). Non-synchronous behavior of neuronal-activity, oxidative-metabolism and blood-supply during mental tasks in man. Neurosci. Lett. 172, 129–133. doi: 10.1016/0304-3940(94)90679-3
Hoshi, Y., and Tamura, M. (1997). Near-infrared optical detection of sequential brain activation in the prefrontal cortex during mental tasks. Neuroimage 5, 292–297. doi: 10.1006/nimg.1997.0270
Hu, X.-S., Hong, K.-S., and Ge, S. S. (2011). Recognition of stimulus-evoked neuronal optical response by identifying chaos levels of near-infrared spectroscopy time series. Neurosci. Lett. 504, 115–120. doi: 10.1016/j.neulet.2011.09.011
Hu, X.-S., Hong, K.-S., and Ge, S. S. (2012). fNIRS-based online deception decoding. J. Neural Eng. 9:026012. doi: 10.1088/1741-2560/9/2/026012
Hu, X.-S., Hong, K.-S., and Ge, S. S. (2013). Reduction of trial-to-trial variability in functional near-infrared spectroscopy signals by accounting for resting-state functional connectivity. J. Biomed. Opt. 18:17003. doi: 10.1117/1.JBO.18.1.017003
Hu, X.-S., Hong, K.-S., Ge, S. S., and Jeong, M.-Y. (2010). Kalman estimator- and general linear model-based on-line brain activation mapping by near-infrared spectroscopy. Biomed. Eng. Online 9:82. doi: 10.1186/1475-925X-9-82
Irani, F., Platek, S. M., Bunce, S., Ruocco, A. C., and Chute, D. (2007). Functional near infrared spectroscopy (fNIRS): an emerging neuroimaging technology with important applications for the study of brain disorders. Clin. Neuropsychol. 21, 9–37. doi: 10.1080/13854040600910018
Jobsis, F. F. (1977). Non-invasive, infrared monitoring of cerebral and myocardial oxygen sufficiency and circulatory parameters. Science 198, 1264–1267. doi: 10.1126/science.929199
Kato, T., Kamei, A., Takashima, S., and Ozaki, T. (1993). Human visual cortical function during photic stimulation monitoring by means of near-infrared spectroscopy. J. Cereb. Blood Flow Metab. 13, 516–520. doi: 10.1038/jcbfm.1993.66
Khan, M. J., and Hong, K.-S. (2015). Passive BCI based on drowsiness detection: an fNIRS study. Biomed Opt. Express. 6, 4063–4078. doi: 10.1364/BOE.6.004063
Khan, M. J., Hong, M. J., and Hong, K.-S. (2014). Decoding of four movement directions using hybrid NIRS-EEG brain-computer interface. Front. Hum. Neurosci. 8:244. doi: 10.3389/fnhum.2014.00244
Kirilina, E., Jelzow, A., Heine, A., Niessing, M., Wabnitz, H., Brühl, R., et al. (2012). The physiological origin of task-evoked systemic artefacts in functional near infrared spectroscopy. Neuroimage 61, 70–81. doi: 10.1016/j.neuroimage.2012.02.074
Lotte, F., Congedo, M., Lecuyer, A., Lamarche, F., and Arnaldi, B. (2007). A review of classification algorithms for EEG-based brain-computer interfaces. J. Neural Eng. 4:R1. doi: 10.1088/1741-2560/4/2/R01
Luu, S., and Chau, T. (2009). Decoding subjective preferences from single-trial near-infrared spectroscopy signals. J. Neural Eng. 6:016003. doi: 10.1088/1741-2560/6/1/016003
McCormick, P. W., Stewart, M., Lewis, G., Dujovny, M., and Ausman, J. I. (1992). Intracerebral penetration of infrared light: technical note. J. Neurosurg. 76, 315–318. doi: 10.3171/jns.1992.76.2.0315
Moghimi, S., Kushki, A., Power, S., Guerguerian, A. M., and Chau, T. (2012). Automatic detection of a prefrontal cortical response to emotionally rated music using multi-channel near-infrared spectroscopy. J. Neural Eng. 9:026022. doi: 10.1088/1741-2560/9/2/026022
Naito, M., Michioka, Y., Ozawa, K., Ito, Y., Kiguchi, M., and Kanazawa, T. (2007). A communication means for totally locked-in ALS patients based on changes in cerebral blood volume measured with near-infrared light. IEICE Trans. Inf. Syst. E90D, 1028–1037. doi: 10.1093/ietisy/e90-d.7.1028
Naseer, N., and Hong, K.-S. (2013). Classification of functional near-infrared spectroscopy signals corresponding to the right- and left-wrist motor imagery for development of a brain-computer interface. Neurosci. Lett. 553, 84–49. doi: 10.1016/j.neulet.2013.08.021
Naseer, N., and Hong, K.-S. (2015a). fNIRS-based brain-computer interfaces: a review. Front. Hum. Neurosci. 9:3. doi: 10.3389/fnhum.2015.00003
Naseer, N., and Hong, K.-S. (2015b). Decoding answers to four-choice questions using functional near-infrared spectroscopy. J. Near Infrared Spectrosc. 23, 23–31. doi: 10.1255/jnirs.1145
Naseer, N., Hong, M. J., and Hong, K.-S. (2014). Online binary decision decoding using functional near-infrared spectroscopy for the development of brain-computer interface. Exp. Brain Res. 232, 555–564. doi: 10.1007/s00221-013-3764-1
Penny, W. D., Roberts, S. J., Curran, E. A., and Stokes, M. J. (2000). EEG-based communication: a pattern recognition approach. IEEE Trans. Rehabil. Eng. 8, 214–215. doi: 10.1109/86.847820
Power, S., and Chau, T. (2013). Automatic single-trial classification of prefrontal hemodynamic activity in an individual with Duchenne muscular dystrophy. Dev. Neurorehabil. 16, 67–72. doi: 10.3109/17518423.2012.718293
Power, S. D., Falk, T. H., and Chau, T. (2010). Classification of prefrontal activity due to mental arithmetic and music imagery using hidden Markov models and frequency domain near-infrared spectroscopy. J. Neural Eng. 7:026002. doi: 10.1088/1741-2560/7/2/026002
Power, S. D., Khushki, A., and Chau, T. (2012a). Automatic single trial discrimination of mental arithmetic, mental singing and the no-control state from the prefrontal activity: towards a three-state NIRS-BCI. BMC Res. Notes 5:141. doi: 10.1186/1756-0500-5-141
Power, S. D., Kushki, A., and Chau, T. (2011). Towards a system-paced near-infrared spectroscopy brain-computer interface: differentiating prefrontal activity due to mental arithmetic and mental singing from the no-control state. J. Neural Eng. 8:066004. doi: 10.1088/1741-2560/8/6/066004
Power, S. D., Kushki, A., and Chau, T. (2012b). Intersession consistency of single-trial classification of the prefrontal response to mental arithmetic and the no-control state by NIRS. PLoS ONE 7:e37791. doi: 10.1371/journal.pone.0037791
Rejer, I. (2015). Genetic algorithm with aggressive mutation for feature selection in BCI feature space. Pattern Anal. Appl. 18, 485–492. doi: 10.1007/s10044-014-0425-3
Salvaris, M., and Sepulveda, F. (2010). Classification effects of real and imaginary movement selective attention tasks on a P300-based brain–computer interface. J. Neural Eng. 7:056004. doi: 10.1088/1741-2560/7/5/056004
Santosa, H., Hong, M. J., and Hong, K.-S. (2014). Lateralization of music processing with noises in the auditory cortex: an fNIRS study. Front. Behav. Neurosci. 8:418. doi: 10.3389/fnbeh.2014.00418
Santosa, H., Hong, M. J., Kim, S. P., and Hong, K.-S. (2013). Noise reduction in functional near-infrared spectroscopy signals by independent component analysis. Rev. Sci. Instrum. 84:073106. doi: 10.1063/1.4812785
Sassaroli, A., and Fantini, S. (2004). Comment on the modified beer-lambert law for scattering media. Phys. Med. Biol. 49, N255–N257. doi: 10.1088/0031-9155/49/14/n07
Sitaram, R., Zhang, H. H., Guan, C. T., Thulasidas, M., Hoshi, Y., Ishikawa, A., et al. (2007). Temporal classification of multichannel near-infrared spectroscopy signals of motor imagery for developing a brain-computer interface. Neuroimage 34, 1416–1427. doi: 10.1016/j.neuroimage.2006.11.005
Sorger, B., Dahmen, B., Reithler, J., Gosseries, O., Maudoux, A., Laureys, S., et al. (2009). Another kind of ‘BOLD response’: answering multiple-choice questions via online decoded single-trial brain signals. Prog. Brain Res. 177, 275–292. doi: 10.1016/S0079-6123(09)17719-1
Tai, K., and Chau, T. (2009). Single-trial classification of NIRS signals during emotional induction tasks: towards a corporeal machine interface. J. Neuroeng. Rehabil. 6:39. doi: 10.1186/1743-0003-6-39
Thongpang, S., Richner, T. J., Brodnick, S. K., Schendel, A., Kim, J., Wilson, J. A., et al. (2011). A micro-electrocorticography platform and deployment strategies for chronic BCI applications. Clin. EEG Neurosci. 42, 259–265. doi: 10.1177/155005941104200412
Utsugi, K., Obata, A., Sato, H., Aoki, R., Maki, A., Koizumi, H., et al. (2008). GO-STOP control using optical brain-computer interface during calculation task. IEICE Trans. Commun. E91B, 2133–2141. doi: 10.1093/ietcom/e91-b.7.2133
Villringer, A., Planck, J., Hock, C., Schleinkofer, L., and Dirnagl, U. (1993). Near infrared spectroscopy (NIRS): a new tool to study hemodynamic changes during activation of brain function in human adults. Neurosci. Lett. 154, 101–104. doi: 10.1016/0304-3940(93)90181-J
Viventi, J., Kim, D.-H., Vigeland, L., Frechette, E. S., Blanco, J. A., Kim, Y.-S., et al. (2011). Flexible, foldable, actively multiplexed, high-density electrode array for mapping brain activity in vivo. Nat. Neurosci. 14, 1599–1605. doi: 10.1038/nn.2973
Wester, B. A., Lee, R. H., and LaPlaca, M. C. (2009). Development and characterization of in vivo flexible electrodes compatible with large tissue displacements. J. Neural Eng. 6:024002. doi: 10.1088/1741-2560/6/2/024002
Wolpaw, J. R., Birbaumer, N., McFarland, D. J., Pfurtscheller, G., and Vaughan, T. M. (2002). Brain-computer interfaces for communication and control. Clin. Neurophysiol. 113, 767–791. doi: 10.1016/S1388-2457(02)00057-3
Ye, J. C., Tak, S., Jang, K. E., Jung, J., and Jang, J. (2009). NIRS-SPM: statistical parametric mapping for near-infrared spectroscopy. Neuroimage 44, 428–447. doi: 10.1016/j.neuroimage.2008.08.036
Keywords: functional near-infrared spectroscopy, brain-computer interface, optimal feature selection, linear discriminant analysis, binary classification, mental arithmetic
Citation: Naseer N, Noori FM, Qureshi NK and Hong K-S (2016) Determining Optimal Feature-Combination for LDA Classification of Functional Near-Infrared Spectroscopy Signals in Brain-Computer Interface Application. Front. Hum. Neurosci. 10:237. doi: 10.3389/fnhum.2016.00237
Received: 19 January 2016; Accepted: 05 May 2016;
Published: 25 May 2016.
Edited by:
Mikhail Lebedev, Duke University, USAReviewed by:
Hasan Ayaz, Drexel University, USASahil Bajaj, The Houston Methodist Research Institute, USA
Mannes Poel, University of Twente, Netherlands
Copyright © 2016 Naseer, Noori, Qureshi and Hong. This is an open-access article distributed under the terms of the Creative Commons Attribution License (CC BY). The use, distribution or reproduction in other forums is permitted, provided the original author(s) or licensor are credited and that the original publication in this journal is cited, in accordance with accepted academic practice. No use, distribution or reproduction is permitted which does not comply with these terms.
*Correspondence: Noman Naseer, bm9tYW5AcHVzYW4uYWMua3I=