 Ryoki Sasaki*
 Shota Tsuiki
 Shota Miyaguchi
 Sho Kojima
 Kei Saito
 Yasuto InukaiNaofumi Otsuru
 Hideaki Onishi
- Institute for Human Movement and Medical Sciences, Niigata University of Health and Welfare, Niigata, Japan
Somatosensory inputs induced by repetitive passive movement (RPM) modulate primary motor cortex (M1) excitability; however, it is unclear whether RPM affects primary somatosensory cortex (S1) excitability. In this study, we investigated whether RPM affects somatosensory evoked potentials (SEPs) and resting state brain oscillation, including alpha and beta bands, depend on RPM frequency. Nineteen healthy subjects participated in this study, and SEPs elicited by peripheral nerve electrical stimulation were recorded from the C3’ area in order to assess S1 excitability (Exp. 1: n = 15). We focused on prominent SEP components such as N20, P25 and P45-reflecting S1 activities. In addition, resting electroencephalograms (EEGs) were recorded from C3’ area to assess the internal state of the brain network at rest (Exp. 2: n = 15). Passive abduction/adduction of the right index finger was applied for 10 min at frequencies of 0.5, 1.0, 3.0, and 5.0 Hz in Exp. 1, and 1.0, 3.0, and 5.0 Hz in Exp. 2. No changes in N20 or P25 components were observed following RPM. The 3.0 Hz-RPM decreased the P45 component for 20 min (p < 0.05), but otherwise did not affect the P45 component. There was no difference in the alpha and beta bands before and after any RPM; however, a negative correlation was observed between the rate of change of beta power and P45 component at 3.0 Hz-RPM. Our findings indicated that the P45 component changes depending on the RPM frequency, suggesting that somatosensory inputs induced by RPM influences S1 excitability. Additionally, beta power enhancement appears to contribute to the P45 component depression in 3.0 Hz-RPM.
Introduction
Various types of repetitive somatosensory inputs are capable of evoking neuroplastic changes in the primary motor cortex (M1). Indeed, previous studies have reported changes in motor-evoked potentials (MEPs) elicited by transcranial magnetic stimulation (TMS) over the M1 after a prolonged period of peripheral nerve electrical stimulation (Ridding et al., 2000; Kaelin-Lang et al., 2002; Sasaki et al., 2017a). Similarly, muscle vibration or water flow stimulation has been shown to modulate MEPs (Steyvers et al., 2003; Sato et al., 2015). These MEP changes induced by repetitive somatosensory inputs are believed to occur at the level of the cortex, because neither H-reflex nor F-wave amplitude, which selectively reflects spinal motoneuron excitability, differs following peripheral nerve electrical stimulation (Ridding et al., 2000; Tinazzi et al., 2005; Golaszewski et al., 2012). In addition, cortical facilitatory and inhibitory circuits using a paired-pulse TMS paradigm are modulated by these stimulations (Mileva et al., 2009; Golaszewski et al., 2012; Sato et al., 2015).
Passive movement of the limbs can elicit somatosensory inputs in the same way that peripheral nerve electrical stimulation, muscle vibration and water flow stimulation do. Our previous studies showed that somatosensory inputs induced by repetitive passive movement (RPM) of the index finger for 10 min decreases M1 excitability (Miyaguchi et al., 2013; Otsuka et al., 2017; Sasaki et al., 2017b), depending on passive movement frequency (Sasaki et al., 2017b). In addition, we showed that MEPs decreased immediately after 0.5 Hz- and 1.0 Hz-RPM, while 5.0 Hz-RPM induced a decrease that lasted for 15 min. In contrast, 3.0 Hz-RPM had no effect on MEPs (Sasaki et al., 2017b). Thus, RPMs may contribute to a rehabilitation approach in order to induce neuroplastic change in M1; however, the M1 excitability depression mechanism induced by RPM remains unclear.
The primary somatosensory cortex (S1) is the main brain area that receives somatosensory input from various body parts (Kaas, 2004) and is closely related to M1 (Zarzecki et al., 1978; Keller et al., 1991). Accordingly, S1 excitability changes affect M1 excitability (Schabrun et al., 2012; Jacobs et al., 2014; Tsang et al., 2014). Therefore, we sought to use physiological data to determine as to whether RPMs affect S1 excitability. In addition, we further explored M1 excitability change mechanisms induced by RPM.
We used somatosensory-evoked potentials (SEPs) elicited by peripheral nerve electrical stimulation to assess S1 excitability. SEPs are comprised of plural components such as N20, P25 and P45. The N20 component of SEPs has been shown to elicit a response in area 3b of S1 following median nerve stimulation (Allison et al., 1991; Namiki et al., 1996). The current generation source for the P25 and P45 components is still debated; however, previous studies have reported P25 components in response to activation in area 1 and 2 of S1 and area 4 of M1 (Dinner et al., 1987), or area 1 of S1 (Allison et al., 1989a). In addition, the P45 component includes the activation in S1 (Allison et al., 1989b, 1992; Bufalari et al., 2007). We believed that it can non-invasively evaluate whether RPMs affect S1 excitability by analyzing these SEP components. Neuroimaging studies using magnetoencephalography have shown that the resting state brain network, including alpha (8–12 Hz) or beta (12–25 Hz) oscillations, relates to S1 and M1 activities (Ploner et al., 2006; Hall et al., 2011; Rossiter et al., 2014). These spontaneous neural activities temporally change with somatosensory stimulation (Gaetz and Cheyne, 2006; Houdayer et al., 2006; Müller-Putz et al., 2007; Enatsu et al., 2014). Thus, we considered that alpha and beta oscillations may be used to evaluate in detail the effect of somatosensory input induced by RPM on brain activity. In the present study, we investigated the effects of different RPM frequencies to test if somatosensory inputs induced by RPMs affect SEPs and spontaneous oscillations, including alpha and beta frequencies.
Materials and Methods
Subjects
Nineteen healthy subjects (13 males and 6 females; mean ± standard deviation, 22.4 ± 2.6 years; age range, 20–30 years) participated in this study. All subjects were right-handed with no history of neurological or psychiatric disorders. All subjects gave written informed consent to the experimental procedures. This study complied with the Helsinki declaration on human experimentation and was approved by the ethics committee of Niigata University of Health and Welfare.
SEP Recordings Evoked by Peripheral Nerve Electrical Stimulation
Subjects sat in a comfortable reclining chair with a mounted headrest during experiments. This experiment was performed in a shielded room (Tokin Ltd, Sendai, Japan). Electroencephalogram (EEG) data were sampled at 10 kHz using an A/D converter (AIO AD16-16 (PCI)E, CONTEC, Osaka, Japan) and were amplified (BioTOP 6R12, NEC San-ei, Tokyo, Japan), band-pass filtered (0.5–3,000 Hz), and stored on a personal computer for later off-line analysis. EEG data were recorded from the C3’ area (2.0 cm posterior to C3 area) position of the international 10-20 system via Ag/AgCl electrodes (1.0 cm diameter). A reference electrode was placed at the Fz position, as this position can reduce mixing noise (Sonoo et al., 1996; Exp. 1). However, the frontal component mix for the active electrode used the Fz reference electrode (Desmedt and Cheron, 1981). Thus, we adopted the left earlobe (A1) and Fz reference electrodes, and the C3’ and Fz active electrodes were used to confirm that no SEPs changed with the activation of the frontal component in the reference electrode (Exp. 2). The earth electrode was placed on the Cz position in Exp. 1 and 2. Electrode skin impedance was always less than 10 kΩ. Electrical stimulation was applied to the right ulnar nerve at the wrist through a bar electrode, with the cathode positioned proximally delivering 0.2-ms square wave constant current pulses generated by a SEN-8203 stimulator (Nihon Kohden, Tokyo, Japan) to evoke SEPs. SEPs (360) were recorded from the active electrodes at an inter-stimulus interval of 1.5 s, with stimulus intensity set to 110% of the motor threshold at rest with the eyes opened. The motor threshold was determined as the minimum stimulus intensity that elicited M-waves to the right ulnar nerve of the wrist.
EEG Recordings in the Resting Condition
Subjects sat in a comfortable reclining chair with a mounted headrest during experiments. This experiment was performed in a shielded room (Tokin Ltd, Sendai, Japan). EEG data were sampled at 2,000 Hz using an A/D converter (Power Lab 8/30, AD Instruments, Colorado Springs, CO, USA), amplified (BioTOP 6R12, NEC San-ei, Tokyo, Japan), low-pass filtered (70 Hz) and then stored on a personal computer for later off-line analysis. EEG data were recorded from the C3’ area (2.0 cm posterior to C3) and Fz positions of the international 10–20 system via Ag/AgCl electrodes (1.0 cm diameter). Two reference electrodes were placed on the A1 and Fz positions. The earth electrode was placed on the Cz position and the electro-oculogram data were recorded from two additional electrodes above and below the left eye (Vossen et al., 2015). Electrode skin impedance was always less than 10 kΩ. Subjects were instructed to maintain the rest position with their eyes closed for 4 min.
Passive Movement Task
The passive movement task was applied using a custom-made device consisting of a controller used in our previous study (Sasaki et al., 2017b) in order to set the movement velocity and range and a motor device to deliver the set passive movement sequence (Figure 1). The movement device consisted of a plastic plate, rotating plate and a motor. Subjects placed their right palm on the plastic plate, aligning the center of the metacarpophalangeal joint of the right index finger to the rotary shaft of the motor. The right index finger was fixed by a belt attached to the rotating plate and was moved passively in the abduction−adduction, axis from 0° to 20° abduction. The zero position was defined as the intermediate position of the metacarpophalangeal joint. In Exp. 1, RPM was performed for 10 min at 0.5 (20°/s), 1.0 (40°/s), 3.0 (120°/s) and 5.0 Hz (200°/s; 0.5, 1.0, 3.0 and 5.0 Hz-RPM). In Exp. 2, RPM was performed for 10 min at 1.0, 3.0, 5.0 Hz and control condition at rest (1.0, 3.0, 5.0 Hz-RPM and control). The explanation of the control condition is given below. We used a vibration dampener under the passive movement device to avoid vibratory stimulation.
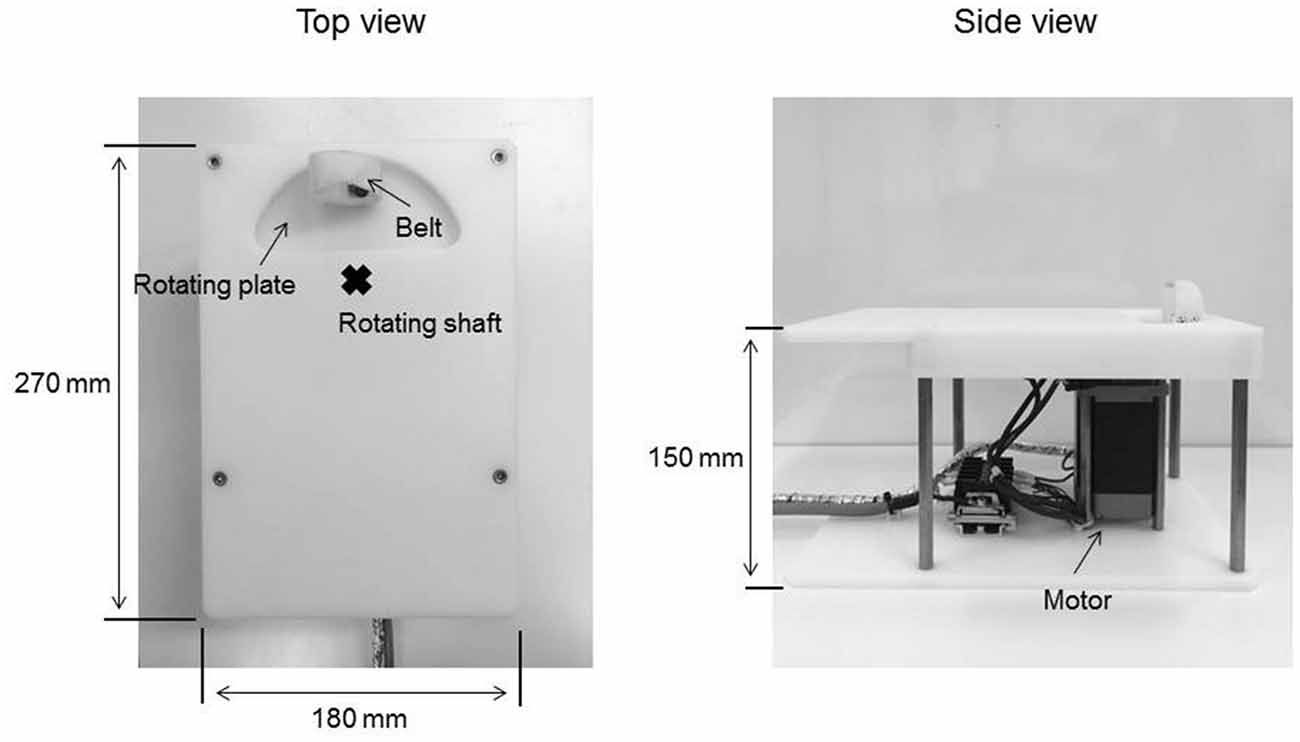
Figure 1. A custom-made device for passive movement.
Kinematic Data
We confirmed movement frequency and the joint angle during RPMs for subjects using an electrogoniometer (Single Axis Goniometer Type F 35, Biometrics Ltd, Newport, UK) attached to the metacarpophalangeal joint of right index finger (Figure 2). Surface electromyographic (EMG) activity was recorded from the right first dorsal interosseous (FDI) muscle via disposable Ag/AgCl electrodes (shape, oval; size, 44.3 mm × 22 mm; inter electrode distance, 10 mm) in a belly−tendon montage. EMG data were sampled at 4,000 Hz using an A/D converter (Power Lab 8/30, AD Instruments, Colorado Springs, CO, USA), amplified (100×; A-DL-720-140, 4 Assist, Tokyo, Japan), band-pass filtered (20–1,000 Hz), and then stored on a personal computer for later off-line analysis. Background EMG activity was monitored online from the right FDI muscle during RPM to confirm EMG activities, and subjects were instructed to relax if the root mean square background EMG activity exceeded 20 μV. However, background EMG and noise EMG activities were rarely observed (Figure 2).
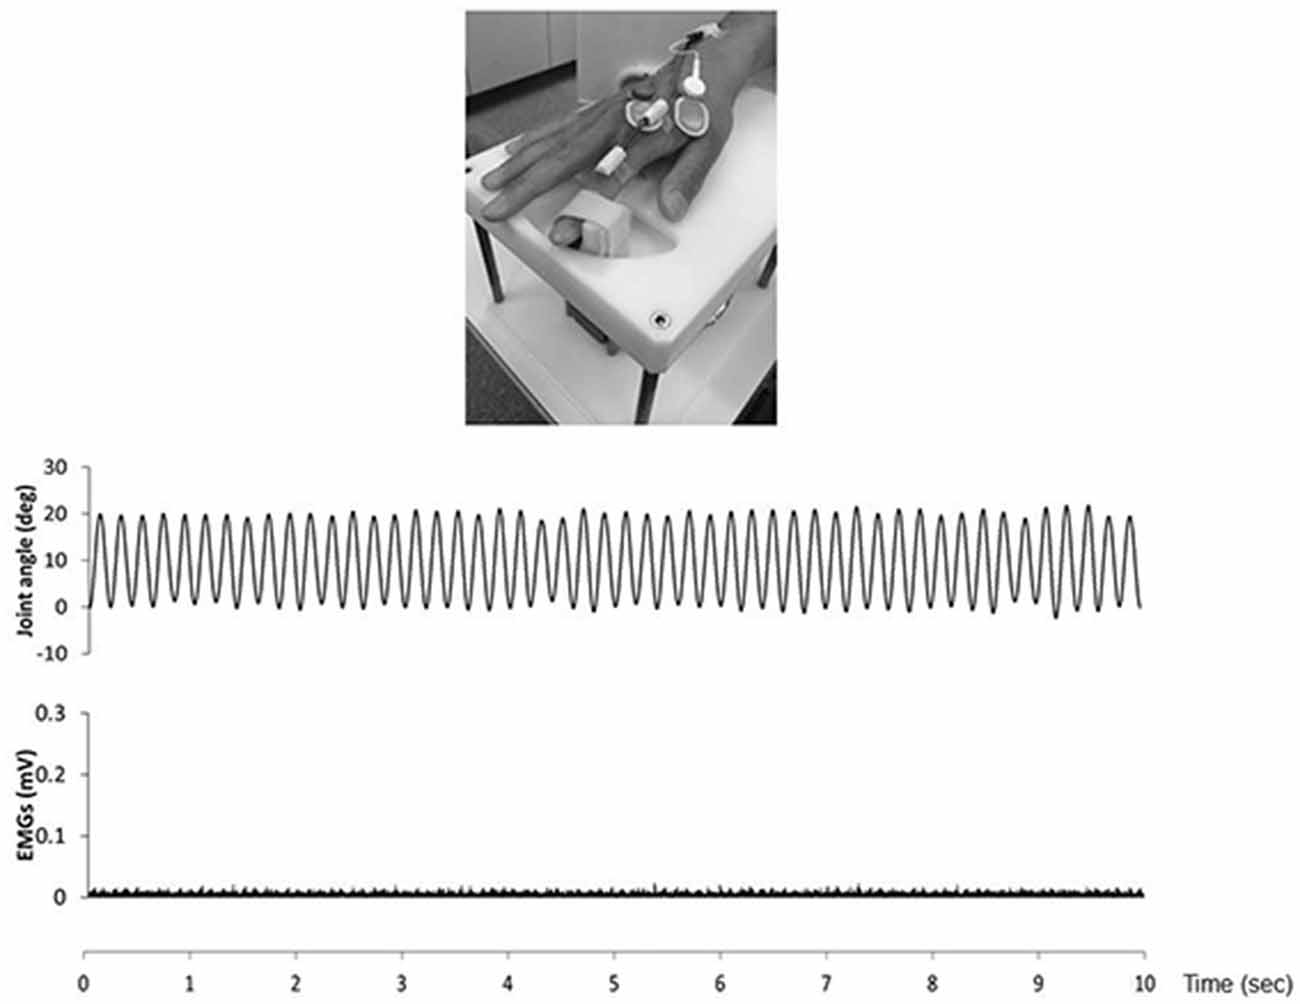
Figure 2. The top presence passive movement device. The middle presence joint angle during the 5.0 Hz-RPM. The under presence EMGs of the first dorsal interosseous (FDI) muscle during 5.0 Hz-RPM. Abbreviations: RPM, repetitive passive movement; EMG, electromyography.
Exp. 1: SEP Recordings Before and After RPM
Fifteen subjects (10 males and 5 females; mean ± standard deviation, 22.7 ± 2.8 years; range, 20–30 years) participated in Exp. 1. RPM was performed for 10 min at 0.5, 1.0, 3.0 and 5.0 Hz in random order on separate days, at least 3 days apart. SEPs (360) were recorded before (pre) RPM and then every 4 min for 24 min (post 0, post 4, post 8, post 12, post 16 and post 20) after RPM using the same electrical stimulation intensity (Figure 3A).
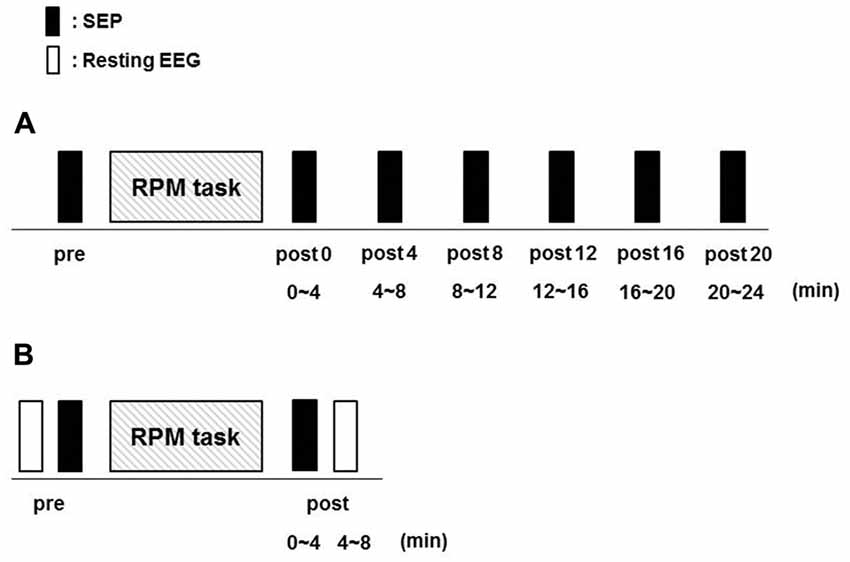
Figure 3. Experimental protocol. Fifteen subjects each participated in Exp. 1 and 2 to examine the effects of RPM conditions on SEPs and resting EEG, respectively. The minimum period between sessions for a single subject was 3 days. (A) In Exp. 1, SEPs were recorded 360 times at seven time-points (pre, post 0, post 4, post 8, post 12, post 16 and post 20) before and after RPM (0.5, 1.0, 3.0 and 5.0 Hz-RPM). (B) In Exp. 2, SEPs and resting EEG were recorded for 4 min at two time-points (pre and post) before and after Abbreviations: RPM (1.0, 3.0, 5.0 Hz-RPM and control). Abbreviations: RPM, repetitive passive movement; SEP, somatosensory-evoked potential; EEG, electroencephalogram.
Exp. 2: SEPs and Resting EEG Recordings Before and After RPM
Fifteen subjects (12 males and 3 females; mean ± standard deviation, 22.7 ± 2.5 years; range, 21–31 years) participated in Exp. 2. RPM was performed for 10 min at 1.0, 3.0, 5.0 Hz and control in random order on separate days, at least 3 days apart. SEPs and resting EEG data were recorded before (pre) RPM in order of resting EEG and SEPs, and then 4 min (post) after RPM in order of SEPs and resting EEG using the same electrical stimulation intensity (Figure 3B).
Data Analysis
Exp. 1
We used analysis software (EPLYZER II, KISSEI COMTEC, Nagano, Japan) for the analysis of SEPs. SEP recordings were acquired from 50 ms before to 200 ms after ulnar nerve electrical stimulation, and the average of 360 recordings was obtained during each time-point. Artifact detection was performed automatically with a threshold of 80 μV. The 20 ms period preceding stimulation was used as the baseline. The baseline-to-peak amplitudes (mean ± SE) of the three cortical components (N20, P25 and P45) from the C3’ area (Fz reference) were analyzed.
Exp. 2
We performed SEP analysis in a similar method as Exp. 1, and the baseline-to-peak amplitudes (mean ± SE) of the three cortical components (N20, P25 and P45) from the C3’ area (Fz reference) were analyzed. The baseline-to-peak amplitudes (mean ± SE) of the two cortical components (P45 and frontal N30) were recorded from the C3’ area (A1 reference) and the Fz area (A1 reference) and were analyzed.
Resting EEG analyses were conducted using Matlab R2016b (Mathworks, Inc) and EEGLAB toolbox (Delorme and Makeig, 2004). The EEG data from the C3’ area (A1 reference), the C3’ area (Fz reference), and the Fz area (A1 reference) changed the sampling rate to 1,024 Hz from 2,000 Hz. Each of the EEG data for 4 min were segmented into 2 s-epochs (total of 120 epchs). Before analysis, artifact detection was performed automatically with a threshold of 80 μV, visually involving all EEG channels and electro-oculogram with the exclusion of all EEG segments that contained obvious or muscle artifacts. Additionally, fast Fourier transform for frequencies between 1 and 40 Hz was calculated for individual epoach of 2,048 samples (2 s) in 50% overlapping at 1,024 points using the Hanning window (time resolution 0.5 Hz). After fast Fourier transform, we analayzed the mean (mean ± SE) of the power spectral of the alpha (8–12 Hz) and beta (12–25 Hz) bands.
Statistical Analysis
Statistical analysis was performed using PASW statistics software version 21 (SPSS; IBM, Armonk, NY, USA). In Exp. 1, two-way repeated-measures analysis of variance (RM-ANOVA) was applied to compare amplitudes and the latency of the three cortical components (N20, P25, and P45) from the C3’ area (Fz reference) with INTERVENTION (0.5, 1.0, 3.0 and 5.0 Hz-RPM) and TIME (pre, post 0, post 4, post 8, post 12, post 16 and post 20) as the main factors.
In Exp. 2, two-way RM-ANOVA with INTERVENTION (1.0, 3.0 and 5.0 Hz-RPM) and TIME (pre and post) was conducted on amplitudes and the latency of the three cortical components (N20, P25 and P45) from the C3’ area (Fz reference). In addition, two-way RM-ANOVA with INTERVENTION (1.0, 3.0 and 5.0 Hz-RPM) and TIME (pre and post) was conducted on amplitudes and the latency of the two cortical components (P45 and frontal N30) recorded from the C3’ area (A1 reference) and the Fz area (A1 reference). Two-way RM-ANOVA was conducted on the power spectral of the resting EEG, including the alpha and beta bands from the C3’ area (A1 reference and Fz reference) and the Fz area (A1 reference), and was compared with INTERVENTION (1.0, 3.0 and 5.0 Hz-RPM) and TIME (pre and post) as the main factors.
We calculated the effect size (partial η2) for all results of the two-way RM-ANOVA. The Mauchly’s test of sphericity was used to evaluate the sphericity assumption. If the sphericity assumption was violated, the Greenhouse–Geisser correction was conducted to adjust the F- and p-values. When a significant main effect or interaction was found, post hoc comparisons were conducted with Tukey’s test in Exp. 1 and paired t-tests in Exp. 2. In Exp. 2, Pearson’s correlation analysis was performed to determine whether RPM induced changes in P45 were associated with changes in the alpha and beta oscillations. Pearson’s correlation analysis was calculated using rate of change (P45 post/pre * 100) from the C3’ area (Fz reference) and (alpha or beta power post/pre * 100) from the C3’ area (A1 reference). Thus, we performed a control condition for RPM intervention to explore the correlation of the rate of change of P45 and resting EEG, including alpha and beta frequencies. A p-value< 0.05 was considered statistically significant for all the tests.
Results
Exp. 1: The Effects of RPM on SEPs From the C3’ Area (Fz Reference)
Table 1 presents the N20, P25 and P45 latency. Two-way RM-ANOVA for the latency of each component revealed no significant main effect of INTERVENTION or TIME and no interaction between INTERVENTION × TIME (Table 1).
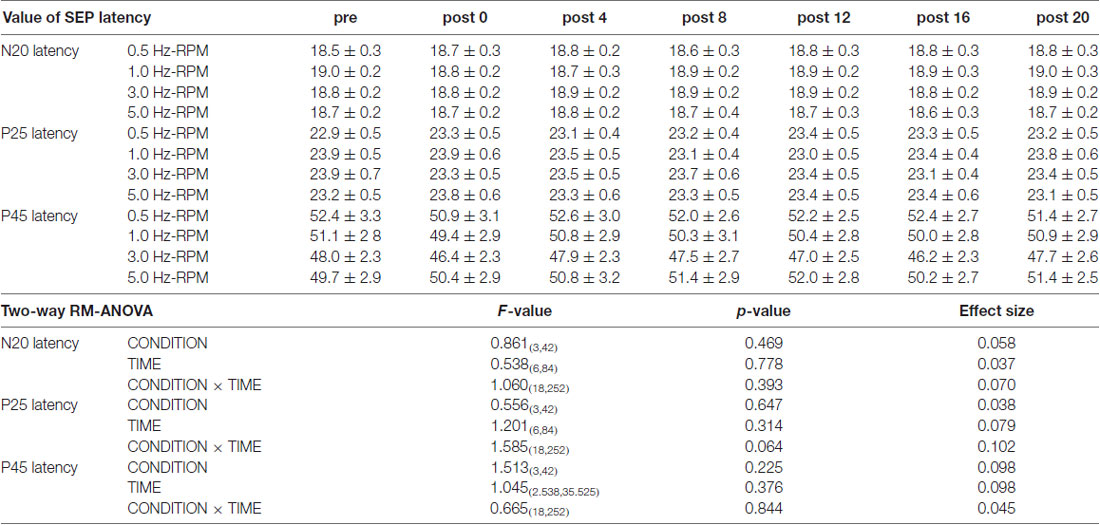
Table 1. The results of latency for SEPs and two-way repeated-measures analysis of variance (RM-ANOVA) in Exp. 1.
Figure 4 shows the SEP grand-averaged waveforms, whereas Figure 5 shows the SEP amplitudes for each component. Two-way RM-ANOVA for N20 amplitudes revealed no significant main effect of INTERVENTION (F (1.492,20.890) = 0.168, p = 0.783, partial η2 = 0.012) or TIME (F (6,84) = 0.240, p = 0.962, partial η2 = 0.017), and no interaction between INTERVENTION × TIME (F(18,252) = 0.182, p = 1.000, partial η2 = 0.013). Similarly, no significant main effect of INTERVENTION (F(3,42) = 0.037, p = 0.990, partial η2 = 0.098) or TIME (F(3.356,46.986) = 0.494, p = 0.453, partial η2 = 0.061) and no interaction of INTERVENTION × TIME (F(18,252) = 0.494, p = 0.960, partial η2 = 0.034) were observed at P25 amplitude. Additionally, no significant main effect of INTERVENTION (F(3,42) = 1.119, p = 0.352, partial η2 = 0.074) or TIME (F(2.624,36.740) = 0.709, p = 0.535, partial η2 = 0.048), but did reveal an interaction of INTERVENTION × TIME (F(18,252) = 1.828, p = 0.023, partial η2 = 0.115) were observed at P45 amplitude. Post hoc analysis showed a significant decrease in P45 amplitudes from post 0-post 20 after the end of the 3.0 Hz-RPM compared with the pre (p < 0.05). No significant differences in P45 amplitudes between pre and post 0 to post 20 after 0.5, 1.0 and 5.0 Hz-RPM were observed.
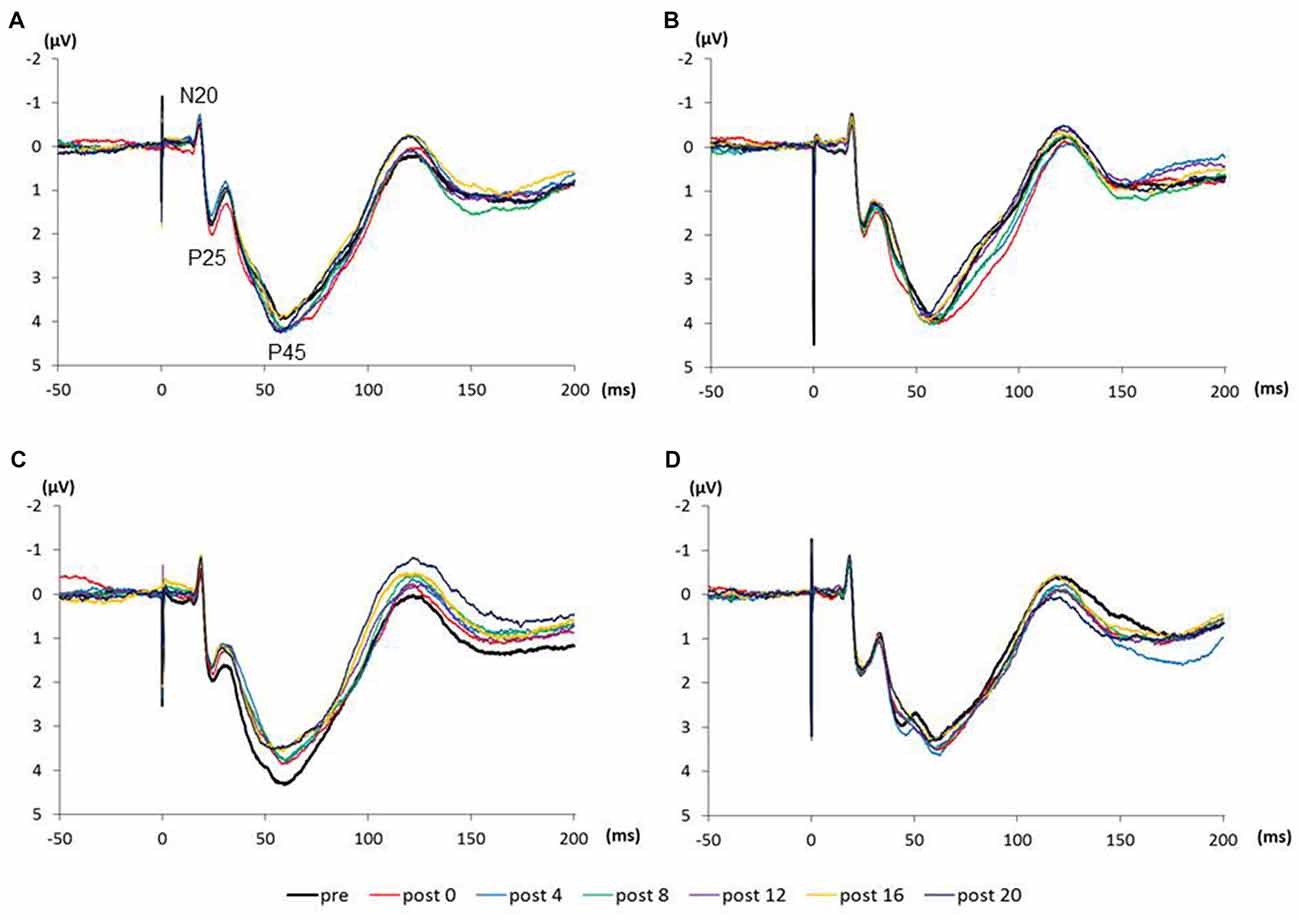
Figure 4. (A) 0.5 Hz-RPM, (B) 1.0 Hz-RPM, (C) 3.0 Hz-RPM, (D) 5.0 Hz-RPM. These SEP waveforms present the grand-averaged waveform (n = 15) from the C3’ area (Fz reference) before and after RPM. Abbreviations: RPM, repetitive passive movement.
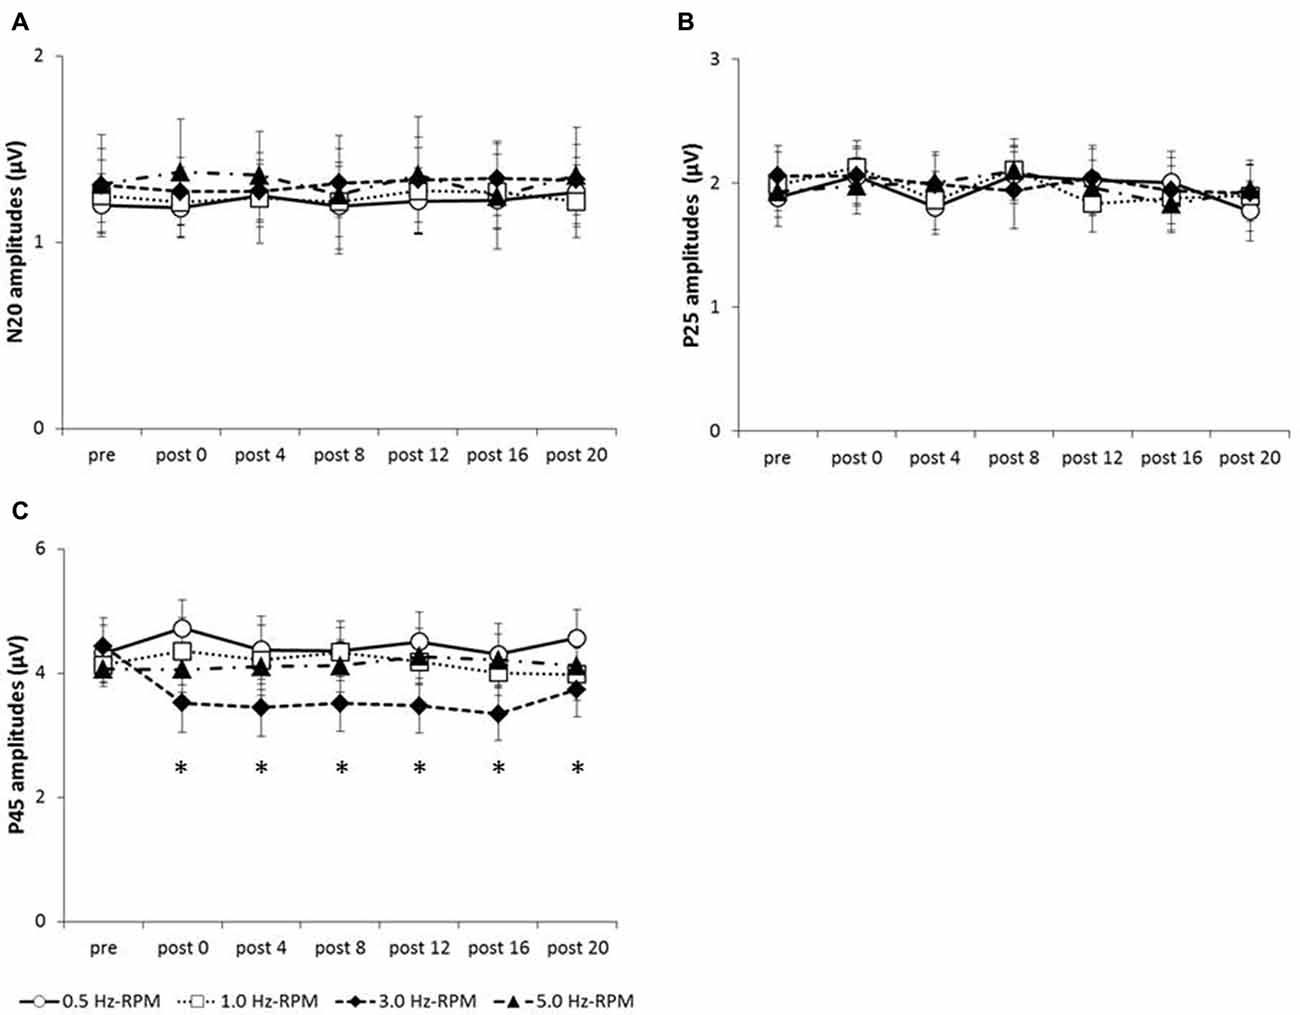
Figure 5. (A) N20 amplitudes, (B) P25 amplitudes, (C) P45 amplitudes. These graphs show the average of the N20, P25 and P45 amplitudes (mean ± SE) recorded at each time-point (pre, post 0, post 4, post 8, post 12, post 16 and post 20) before and after RPM (0.5, 1.0, 3.0 and 5.0 Hz-RPM). N20 and P25 amplitudes were not significant before and after RPM. P45 amplitudes decreased at post 0 to post 20 compared with the pre after the 3.0 Hz-RPM; however, other RPMs were not affected. *p < 0.05. Abbreviations: RPM, repetitive passive movement.
Exp. 2: The Effects of RPM on SEPs From the C3’ Area (Fz and A1 Reference) and Fz Area (A1 Reference)
Table 2 presents the N20, P25 and P45 latency from the C3’ area (Fz reference), the P45 latency from the C3’ area (A1 reference), and the frontal N30 latency from the Fz area (A1 reference). Two-way RM-ANOVA for the cortical components latency revealed no significant main effect of INTERVENTION or TIME, and no interaction between INTERVENTION × TIME.
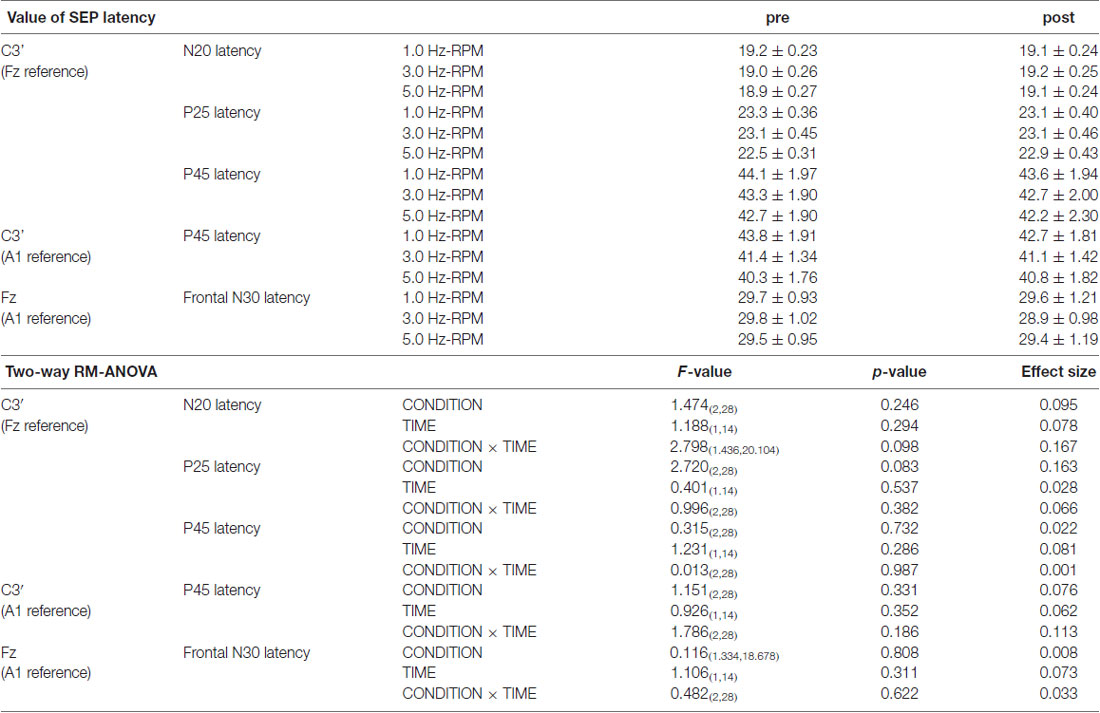
Table 2. The results of latency for SEPs and two-way RM-ANOVA in Exp. 2.
Table 3 presents the SEP amplitudes for each component. N20, P25, and frontal N30 amplitudes revealed no significant main effect of INTERVENTION or TIME, and no interaction between INTERVENTION × TIME. Two-way RM-ANOVA for the P45 amplitude from the C3’ area (Fz reference) revealed no significant main effect of INTERVENTION, but did reveal an interaction with TIME and an interaction between INTERVENTION × TIME (p < 0.05). Additionally, Two-way RM-ANOVA for the P45 amplitude from the C3’ area (A1 reference) revealed no significant main effect of INTERVENTION or TIME, but did reveal an interaction between INTERVENTION × TIME (p < 0.05). Post hoc analysis showed a significant decrease in P45 amplitudes from the C3’ area (Fz reference and A1 reference) at post after the end of the 3.0 Hz-RPM compared with the pre (p < 0.05), while there were no significant differences in P45 amplitudes between pre and post after 1.0 and 5.0 Hz-RPM.
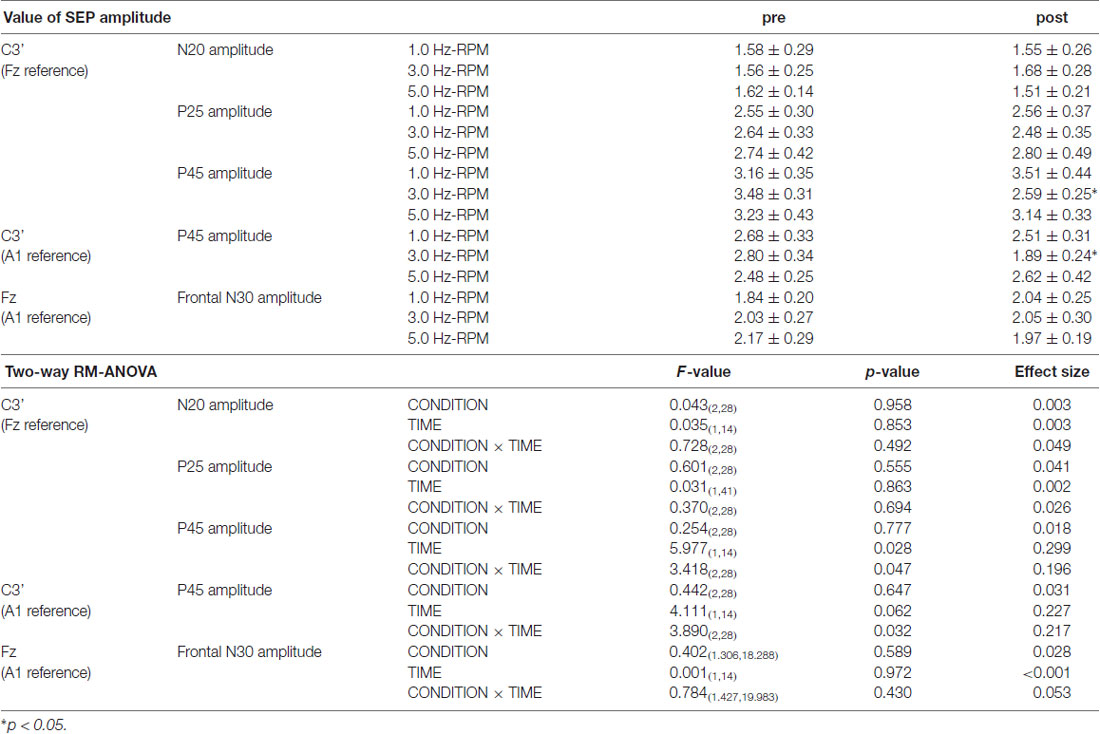
Table 3. The results of amplitudes for SEPs and two-way RM-ANOVA in Exp. 2.
Exp. 2: The Effects of RPM on Resting EEG From the C3’ Area (Fz and A1 Reference) and Fz Area (A1 Reference)
Figure 6 presents the resting EEG grand-averaged power spectrum, whereas Figure 7 presents the power spectrum of alpha and beta band frequencies at pre and post. Two-way RM-ANOVA for these oscillations revealed no significant main effect of INTERVENTION or TIME, and no interaction between INTERVENTION × TIME (Table 4).
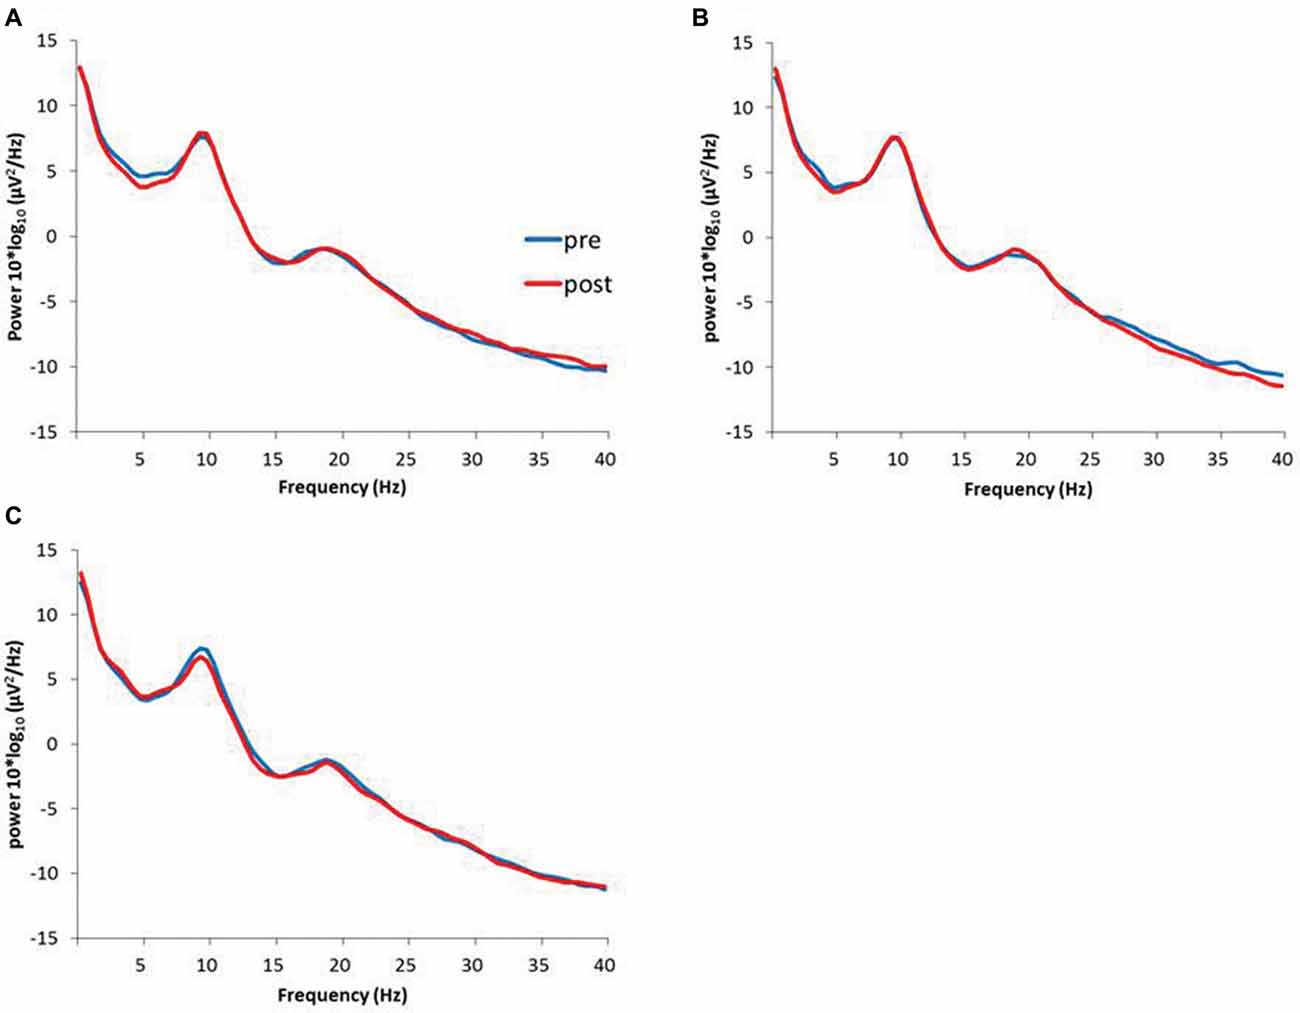
Figure 6. (A) 1.0 Hz-RPM, (B) 3.0 Hz-RPM, (C) 5.0 Hz-RPM. These waveforms present the grand average of the resting EEG (1–40 Hz; n = 15) from the C3’ area (A1 reference) before and after RPM. Abbreviations: RPM, repetitive passive movement; EEG, electroencephalogram.
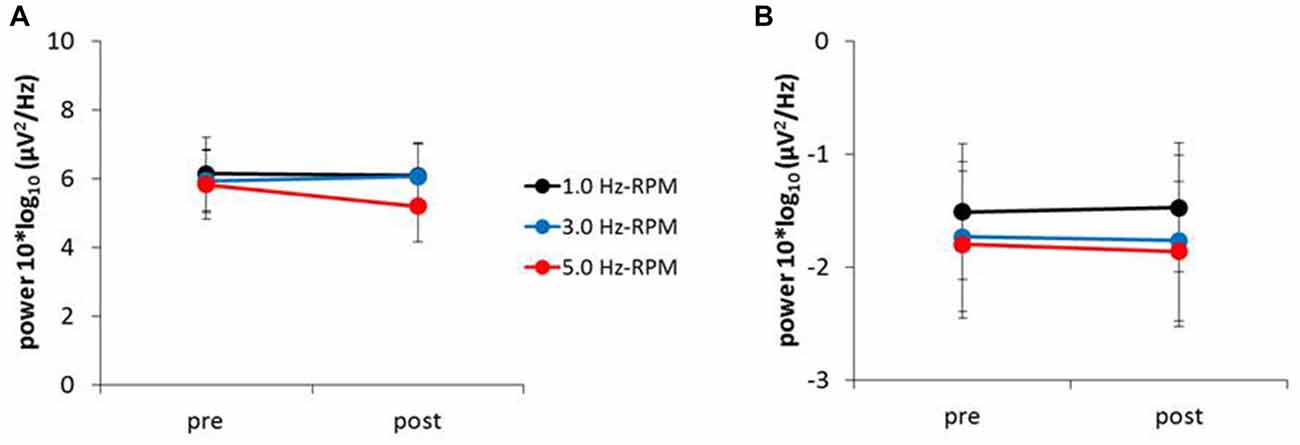
Figure 7. (A) Alpha power, (B) beta power. These graphs show the average of the alpha and beta powers (mean ± SE) recorded from the C3’ area (A1 reference) for each time-point (pre and post) before and after RPM (1.0, 3.0 and 5.0 Hz-RPM). Alpha and beta powers were not significant before and after RPM. Abbreviations: RPM, repetitive passive movement.
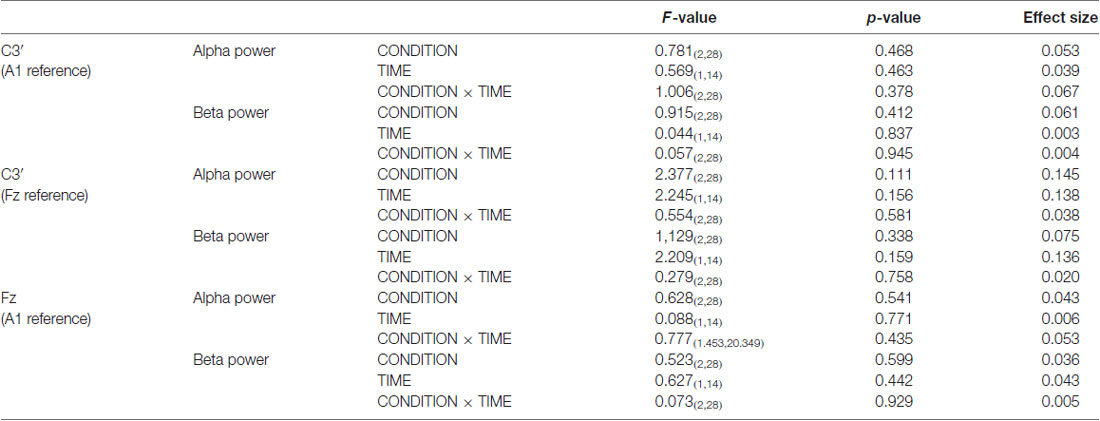
Table 4. The results of two-way RM-ANOVA for alpha and beta power in Exp. 2.
Exp. 2: The Relation Between P45 Component and Alpha and Beta Power
No significant correlation was found between the rate of change of P45 amplitudes and alpha power (Figure 8). A negative correlation was observed between the rate of change of P45 amplitudes and beta power in 3.0 Hz-RPM (r = −0.572, p < 0.05), but no correlation was found in 1.0 and 5.0 Hz-RPM and in the control (Figure 9).
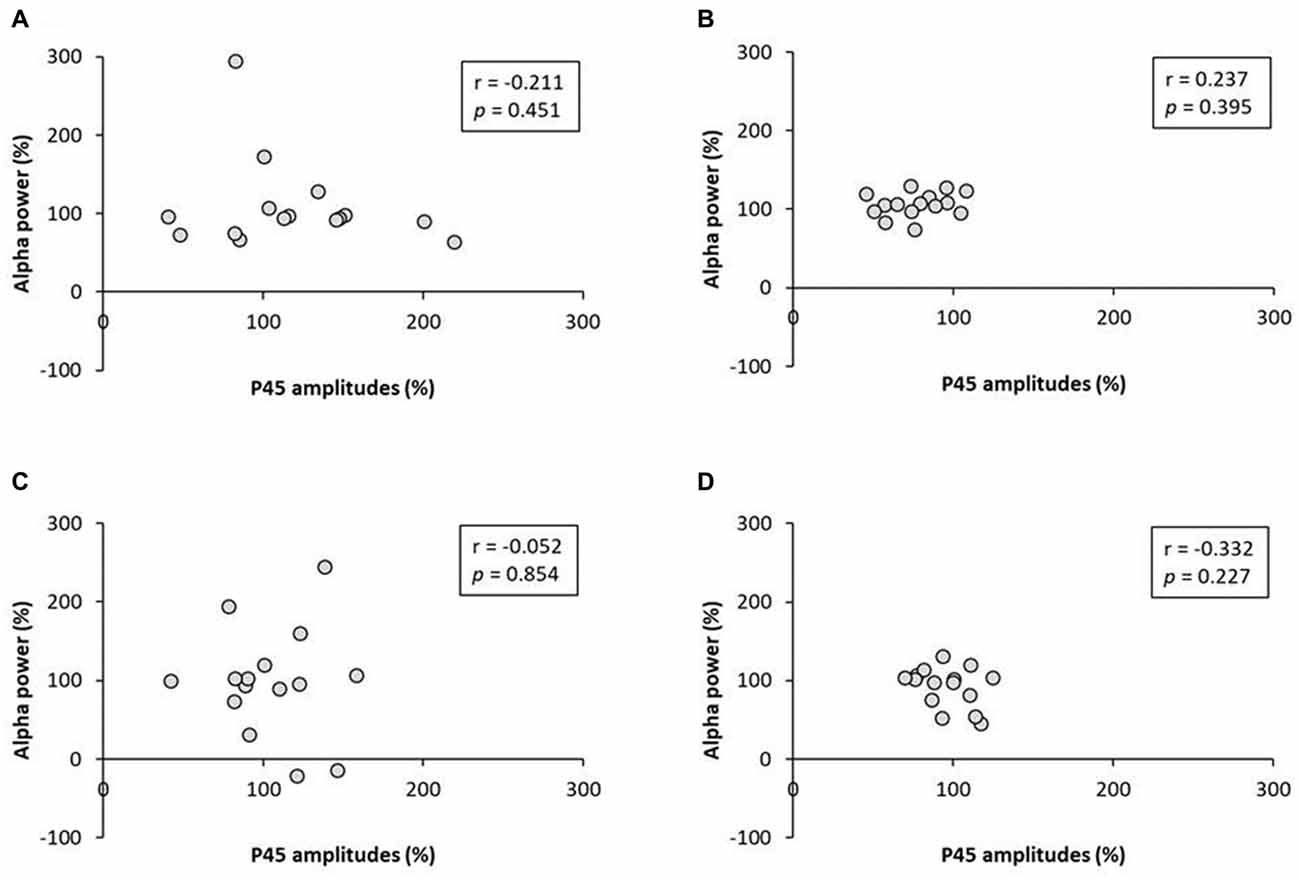
Figure 8. (A) 1.0 Hz-RPM, (B) 3.0 Hz-RPM, (C) 5.0 Hz-RPM, (D) control. These graphs present the relationship between the rate of change of P45 amplitudes (%) and alpha power (%) before and after RPM. No significant correlation was found between the rate of change of P45 amplitudes (%) and alpha power (%). Abbreviations: RPM, repetitive passive movement.
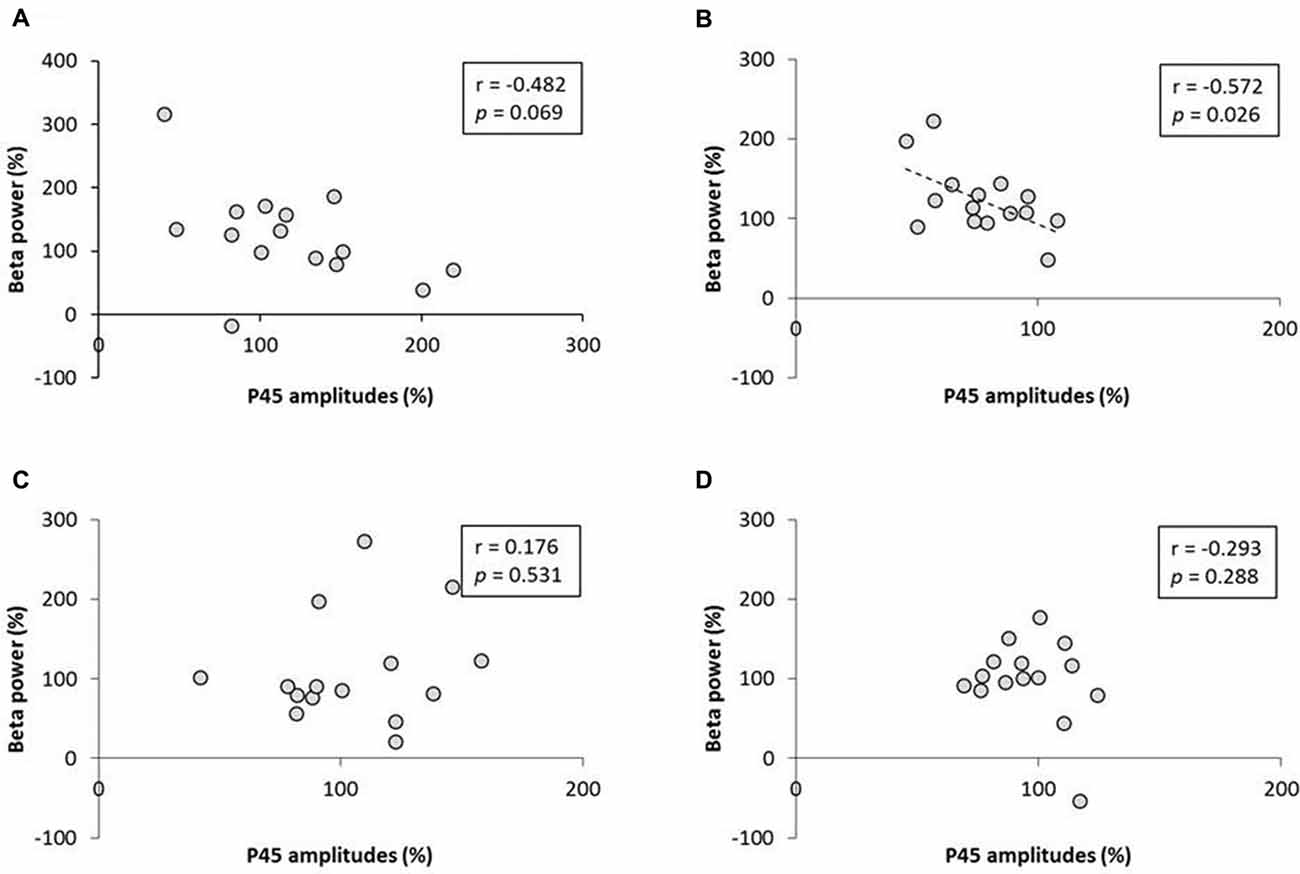
Figure 9. (A) 1.0 Hz-RPM, (B) 3.0 Hz-RPM, (C) 5.0 Hz-RPM, (D) control. These graphs present the relationship between the rate of change of P45 amplitudes (%) and beta power (%) before and after RPM. A negative correlation was shown only between the rate of change of P45 amplitudes (%) and beta power (%) (r = −0.572, p < 0.05) in the 3.0 Hz-RPM. Abbreviations: RPM, repetitive passive movement.
Discussion
This study investigated whether RPMs affect SEPs and resting EEG, including alpha and beta bands, depending on movement frequency. From our results, no significant changes were shown in N20 and P25 components before and after RPM. The P45 component decreased after the 3.0 Hz-RPM, but not after other RPMs. In addition, resting EEG, including alpha and beta frequencies, did not change before and after RPM. However, a negative correlation was found between the rate of change of P45 component and beta band for the 3.0 Hz-RPM.
In this study, we observed that the P45 component decreased after RPM. Previous studies have shown that the N20 component is produced by a tangential generator located in Brodman’s area 3b of S1 (Allison et al., 1991; Namiki et al., 1996). The P25 component has also been shown to be generated by Brodman’s areas 1 and 2 of S1, as well as area 4 of M1 (Dinner et al., 1987) or area 1 of S1 (Allison et al., 1989a). Additionally, the P45 component reflects the activity of S1 (Allison et al., 1989b, 1992; Bufalari et al., 2007). Neuroimaging studies using magnetoencephalography have reported that the source of N20m (corresponding to N20), P35m (corresponding to P25) and P60m (corresponding to P45) of somatosensory-evoked magnetic fields evoked by median nerve stimulation localize to different positions in S1 (Huttunen et al., 2006; Onishi et al., 2016). Therefore, somatosensory inputs induced by RPM may affect only specific areas in S1 because only P45 component changes have been observed.
Our study revealed that only 3.0 Hz-RPMs decreased the P45 component. Our previous study using MEPs indicated that 0.5, 1.0 and 5.0 Hz-RPMs decrease MEPs; however, no MEP changes were observed with only 3.0 Hz-RPM (Sasaki et al., 2017b). The reason for this was not clear, but it is likely that depression of the P45 component after the 3.0 Hz-RPM may disturb MEP depression. Neuroimaging studies have revealed that somatosensory input induced by passive movements without motor commands activate not only S1 but also M1 in humans (Weiller et al., 1996; Onishi et al., 2013; Piitulainen et al., 2015; Sugawara et al., 2016). In addition, somatosensory input influences M1 activity in primates via dense intracortical projections between S1 and M1 (Zarzecki et al., 1978). Additionally, TMS and EEG studies have shown that theta burst stimulation over S1 suppresses S1 excitability and facilitates M1 excitability (Jacobs et al., 2014; Tsang et al., 2014). We believe that S1 excitability depression after the 3.0 Hz-RPM through the nerve fibers from S1 to M1 acts as an enhancement of M1 excitability, and thus MEP depression was disturbed by the 3.0 Hz-RPM. In contrast, because we used four passive movement frequencies based on the findings of our previous study, we are unable to infer the results if we use other passive movement frequencies. Therefore, further study is necessary to determine if this is an accurate interpretation of these results, where the P45 component is reduced after 3.0 Hz RPM, but not after 0.5, 1.0 and 5.0 Hz-RPMs.
In Exp. 1, SEPs were recorded from the C3’ area in the Fz reference. We selected the Fz reference as this position can reduce mixing noise (Sonoo et al., 1996). However, frontal SEP components such as frontal N30 may mix for the active electrode using the Fz reference electrode (Cheron et al., 2000; Cebolla et al., 2011). Therefore, we examined whether the P45 component of SEP modulates in a non-cephalic reference in the same manner as the Fz reference. In addition, we confirmed whether the frontal N30 component of the frontal area origin was influenced by RPM intervention. Our results showed that P45 component depression was observed both with the Fz and A1 references after the 3.0 Hz-RPM. In addition, no frontal N30 changes were observed after the 3.0 Hz-RPM, and, thus, P45 component changes were caused by the C3’ area of the active electrode.
Resting EEG, including alpha and beta bands, did not change before and after RPM; however, a negative correlation was observed between the rate of change of beta power and P45 component in the 3.0 Hz-RPM. This result means that enhancement of beta power contributes to P45 component depression. Magnetoencephalography and EEG studies using time-frequency analysis have shown that alpha or beta band power is modulated by somatosensory stimulation such as peripheral nerve electrical stimulation, tactile stimulation and passive movement (Neuper and Pfurtscheller, 2001; Gaetz and Cheyne, 2006; Houdayer et al., 2006; Parkkonen et al., 2015), as well as M1 activations such as active movement and motor imagery (Cassim et al., 2000; Neuper and Pfurtscheller, 2001; Takemi et al., 2013). Additionally, sensorimotor cortex activation and deactivation are reflected in graduated changes of induced alpha and beta oscillations (Ploner et al., 2006; Hall et al., 2011; Rossiter et al., 2014), and a negative correlation has been observed between S1 excitability and the beta band (Ploner et al., 2006). Pharmacological studies have also shown that beta power increases following the administration of the GABA-A modulator diazepam (Hall et al., 2010; Premoli et al., 2017). In addition, P60m (corresponding to P45) depression appears to be caused by a GABA-A agonist (Huttunen et al., 2008). From these results, our study also showed a similar change between the beta power and P45 before and after the 3.0 Hz-RPM. Therefore, we believe that the enhancement of beta power contributes to P45 component depression after the 3.0 Hz-RPM.
Several studies have reported that transcranial alternating current stimulation, peripheral nerve electrical stimulation, and repetitive TMS affect M1 excitability in a stimulation frequency-specific manner (Fitzgerald et al., 2006; Chipchase et al., 2011; Schilberg et al., 2018); these low and high frequency stimulations modulate M1 excitability changes differently. This frequency dependent-specific manner on M1 excitability changes can be considered important to S1 excitability change using RPM, and thus S1 excitability changes induced by 3.0 Hz-RPM may depend on the RPM frequency. However, the specific S1 excitability change by 3.0 Hz-RPM cannot be entirely deduced by physiological explanations from this study. Therefore, further studies such as magnetoencephalography and multi-channel EEG are required to elucidate the effect of RPM frequency on S1 in detail.
In conclusion, we examined as to whether RPM affects SEP components and resting EEG, including alpha and beta oscillations depending on RPM frequency. Our results showed that the N20 and P25 components of SEP did not change before and after RPM, but P45 component depression was observed after 3.0 Hz-RPM but not after other RPMs. These findings suggest that somatosensory input induced by 3.0 Hz-RPM affected only the P45 component generator. There was no difference in alpha and beta bands before and after any RPM intervention. However, a negative correlation was observed between the rate of change of beta power and P45 component at 3.0 Hz-RPM, suggesting that beta power enhancement may contribute to P45 component depression. The novel findings of this study should provide new insight into the effects of RPM on the sensorimotor cortex. Additionally, these results, including our previous study (Sasaki et al., 2017b), suggest that M1 and S1 excitability for patients with motor and sensory diseases in the neurorehabilitation field may be capable of being modulated by RPM. In future, we wish to reveal the effect of neurorehabilitation by combining with motor learning task and conditioning stimulation by RPM for cortical activity.
Author Contributions
HO and RS conceived the study, designed the experiments and wrote the manuscript. RS and ST conducted the experiments and performed statistical analysis. SM and SK performed data interpretation. KS, YI and NO helped write the manuscript. All authors read and approved the final manuscript.
Funding
This work was supported by a Grant-in-Aid for Scientific Research (B) 16H03207 from the Japan Society for the Promotion of Science and a Grant-in-Aid for Scientific Research of Graduate Students of Niigata University of Health and Welfare (H28F01).
Conflict of Interest Statement
The authors declare that the research was conducted in the absence of any commercial or financial relationships that could be construed as a potential conflict of interest.
Acknowledgments
We would like to thank Enago Inc. (http://www.enago.jp/) for editorial assistance with the manuscript and all the subjects of the study for their collaboration.
References
Allison, T., McCarthy, G., and Wood, C. C. (1992). The relationship between human long-latency somatosensory evoked potentials recorded from the cortical surface and from the scalp. Electroencephalogr. Clin. Neurophysiol. 84, 301–314. doi: 10.1016/0168-5597(92)90082-m
Allison, T., McCarthy, G., Wood, C. C., Darcey, T. M., Spencer, D. D., and Williamson, P. D. (1989a). Human cortical potentials evoked by stimulation of the median nerve. I. Cytoarchitectonic areas generating short-latency activity. J. Neurophysiol. 62, 694–710. doi: 10.1152/jn.1989.62.3.694
Allison, T., McCarthy, G., Wood, C. C., Williamson, P. D., and Spencer, D. D. (1989b). Human cortical potentials evoked by stimulation of the median nerve. II. Cytoarchitectonic areas generating long-latency activity. J. Neurophysiol. 62, 711–722. doi: 10.1152/jn.1989.62.3.711
Allison, T., McCarthy, G., Wood, C. C., and Jones, S. J. (1991). Potentials evoked in human and monkey cerebral cortex by stimulation of the median nerve. A review of scalp and intracranial recordings. Brain 114, 2465–2503. doi: 10.1093/brain/114.6.2465
Bufalari, I., Aprile, T., Avenanti, A., Di Russo, F., and Aglioti, S. M. (2007). Empathy for pain and touch in the human somatosensory cortex. Cereb. Cortex 17, 2553–2561. doi: 10.1093/cercor/bhl161
Cassim, F., Szurhaj, W., Sediri, H., Devos, D., Bourriez, J., Poirot, I., et al. (2000). Brief and sustained movements: differences in event-related (de)synchronization (ERD/ERS) patterns. Clin. Neurophysiol. 111, 2032–2039. doi: 10.1016/s1388-2457(00)00455-7
Cebolla, A. M., Palmero-Soler, E., Dan, B., and Cheron, G. (2011). Frontal phasic and oscillatory generators of the N30 somatosensory evoked potential. Neuroimage 54, 1297–1306. doi: 10.1016/j.neuroimage.2010.08.060
Cheron, G., Dan, B., and Borenstein, S. (2000). Sensory and motor interfering influences on somatosensory evoked potentials. J. Clin. Neurophysiol. 17, 280–294. doi: 10.1097/00004691-200005000-00006
Chipchase, L. S., Schabrun, S. M., and Hodges, P. W. (2011). Peripheral electrical stimulation to induce cortical plasticity: a systematic review of stimulus parameters. Clin. Neurophysiol. 122, 456–463. doi: 10.1016/j.clinph.2010.07.025
Delorme, A., and Makeig, S. (2004). EEGLAB: an open source toolbox for analysis of single-trial EEG dynamics including independent component analysis. J. Neurosci. Methods 134, 9–21. doi: 10.1016/j.jneumeth.2003.10.009
Desmedt, J. E., and Cheron, G. (1981). Non-cephalic reference recording of early somatosensory potentials to finger stimulation in adult or aging normal man: differentiation of widespread N18 and contralateral N20 from the prerolandic P22 and N30 components. Electroencephalogr. Clin. Neurophysiol. 52, 553–570. doi: 10.1016/0013-4694(81)91430-9
Dinner, D. S., Lüders, H., Lesser, R. P., and Morris, H. H. (1987). Cortical generators of somatosensory evoked potentials to median nerve stimulation. Neurology 37, 1141–1145. doi: 10.1212/wnl.37.7.1141
Enatsu, R., Nagamine, T., Matsubayashi, J., Maezawa, H., Kikuchi, T., Fukuyama, H., et al. (2014). The modulation of rolandic oscillation induced by digital nerve stimulation and self-paced movement of the finger: a MEG study. J. Neurol. Sci. 337, 201–211. doi: 10.1016/j.jns.2013.12.011
Fitzgerald, P. B., Fountain, S., and Daskalakis, Z. J. (2006). A comprehensive review of the effects of rTMS on motor cortical excitability and inhibition. Clin. Neurophysiol. 117, 2584–2596. doi: 10.1016/j.clinph.2006.06.712
Gaetz, W., and Cheyne, D. (2006). Localization of sensorimotor cortical rhythms induced by tactile stimulation using spatially filtered MEG. Neuroimage 30, 899–908. doi: 10.1016/j.neuroimage.2005.10.009
Golaszewski, S. M., Bergmann, J., Christova, M., Kunz, A. B., Kronbichler, M., Rafolt, D., et al. (2012). Modulation of motor cortex excitability by different levels of whole-hand afferent electrical stimulation. Clin. Neurophysiol. 123, 193–199. doi: 10.1016/j.clinph.2011.06.010
Hall, S. D., Barnes, G. R., Furlong, P. L., Seri, S., and Hillebrand, A. (2010). Neuronal network pharmacodynamics of GABAergic modulation in the human cortex determined using pharmaco-magnetoencephalography. Hum. Brain Mapp. 31, 581–594. doi: 10.1002/hbm.20889
Hall, S. D., Stanford, I. M., Yamawaki, N., McAllister, C. J., Rönnqvist, K. C., Woodhall, G. L., et al. (2011). The role of GABAergic modulation in motor function related neuronal network activity. Neuroimage 56, 1506–1510. doi: 10.1016/j.neuroimage.2011.02.025
Houdayer, E., Labyt, E., Cassim, F., Bourriez, J. L., and Derambure, P. (2006). Relationship between event-related beta synchronization and afferent inputs: analysis of finger movement and peripheral nerve stimulations. Clin. Neurophysiol. 117, 628–636. doi: 10.1016/j.clinph.2005.12.001
Huttunen, J., Komssi, S., and Lauronen, L. (2006). Spatial dynamics of population activities at S1 after median and ulnar nerve stimulation revisited: an MEG study. Neuroimage 32, 1024–1031. doi: 10.1016/j.neuroimage.2006.04.196
Huttunen, J., Pekkonen, E., Kivisaari, R., Autti, T., and Kahkonen, S. (2008). Modulation of somatosensory evoked fields from SI and SII by acute GABAA-agonism and paired-pulse stimulation. Neuroimage 40, 427–434. doi: 10.1016/j.neuroimage.2007.12.024
Jacobs, M. F., Tsang, P., Lee, K. G., Asmussen, M. J., Zapallow, C. M., and Nelson, A. J. (2014). 30 Hz theta-burst stimulation over primary somatosensory cortex modulates corticospinal output to the hand. Brain Stimul. 7, 269–274. doi: 10.1016/j.brs.2013.12.009
Kaas, J. H. (2004). Evolution of somatosensory and motor cortex in primates. Anat. Rec. A Discov. Mol. Cell. Evol. Biol. 281, 1148–1156. doi: 10.1002/ar.a.20120
Kaelin-Lang, A., Luft, A. R., Sawaki, L., Burstein, A. H., Sohn, Y. H., and Cohen, L. G. (2002). Modulation of human corticomotor excitability by somatosensory input. J. Physiol. 540, 623–633. doi: 10.1113/jphysiol.2001.012801
Keller, A., Miyashita, E., and Asanuma, H. (1991). Minimal stimulus parameters and the effects of hyperpolarization on the induction of long-term potentiation in the cat motor cortex. Exp. Brain Res. 87, 295–302. doi: 10.1007/bf00231846
Mileva, K. N., Bowtell, J. L., and Kossev, A. R. (2009). Effects of low-frequency whole-body vibration on motor-evoked potentials in healthy men. Exp. Physiol. 94, 103–116. doi: 10.1113/expphysiol.2008.042689
Miyaguchi, S., Onishi, H., Kojima, S., Sugawara, K., Tsubaki, A., Kirimoto, H., et al. (2013). Corticomotor excitability induced by anodal transcranial direct current stimulation with and without non-exhaustive movement. Brain Res. 1529, 83–91. doi: 10.1016/j.brainres.2013.07.026
Müller-Putz, G. R., Zimmermann, D., Graimann, B., Nestinger, K., Korisek, G., and Pfurtscheller, G. (2007). Event-related beta EEG-changes during passive and attempted foot movements in paraplegic patients. Brain Res. 1137, 84–91. doi: 10.1016/j.brainres.2006.12.052
Namiki, J., Takase, M., Ohira, T., Goto, K., Ishikawa, M., Ajimi, Y., et al. (1996). The neural origin generating early cortical components of SEP: topographical analysis using temporal-second-order-differentiation of cortical SEPs. Brain Topogr. 8, 229–232. doi: 10.1007/bf01184774
Neuper, C., and Pfurtscheller, G. (2001). Evidence for distinct beta resonance frequencies in human EEG related to specific sensorimotor cortical areas. Clin. Neurophysiol. 112, 2084–2097. doi: 10.1016/s1388-2457(01)00661-7
Onishi, H., Sugawara, K., Yamashiro, K., Sato, D., Kirimoto, H., Tamaki, H., et al. (2016). Inhibitory effect of intensity and interstimulus interval of conditioning stimuli on somatosensory evoked magnetic fields. Eur. J. Neurosci. 44, 2104–2113. doi: 10.1111/ejn.13317
Onishi, H., Sugawara, K., Yamashiro, K., Sato, D., Suzuki, M., Kirimoto, H., et al. (2013). Neuromagnetic activation following active and passive finger movements. Brain Behav. 3, 178–192. doi: 10.1002/brb3.126
Otsuka, R., Sasaki, R., Tsuiki, S., Kojima, S., and Onishi, H. (2017). Post-exercise cortical depression following repetitive passive finger movement. Neurosci. Lett. 656, 89–93. doi: 10.1016/j.neulet.2017.07.030
Parkkonen, E., Laaksonen, K., Piitulainen, H., Parkkonen, L., and Forss, N. (2015). Modulation of the ~20-Hz motor-cortex rhythm to passive movement and tactile stimulation. Brain Behav. 5:e00328. doi: 10.1002/brb3.328
Piitulainen, H., Bourguignon, M., Hari, R., and Jousmäki, V. (2015). MEG-compatible pneumatic stimulator to elicit passive finger and toe movements. Neuroimage 112, 310–317. doi: 10.1016/j.neuroimage.2015.03.006
Ploner, M., Gross, J., Timmermann, L., Pollok, B., and Schnitzler, A. (2006). Oscillatory activity reflects the excitability of the human somatosensory system. Neuroimage 32, 1231–1236. doi: 10.1016/j.neuroimage.2006.06.004
Premoli, I., Bergmann, T. O., Fecchio, M., Rosanova, M., Biondi, A., Belardinelli, P., et al. (2017). The impact of GABAergic drugs on TMS-induced brain oscillations in human motor cortex. Neuroimage 163, 1–12. doi: 10.1016/j.neuroimage.2017.09.023
Ridding, M. C., Brouwer, B., Miles, T. S., Pitcher, J. B., and Thompson, P. D. (2000). Changes in muscle responses to stimulation of the motor cortex induced by peripheral nerve stimulation in human subjects. Exp. Brain Res. 131, 135–143. doi: 10.1007/s002219900269
Rossiter, H. E., Davis, E. M., Clark, E. V., Boudrias, M. H., and Ward, N. S. (2014). Beta oscillations reflect changes in motor cortex inhibition in healthy ageing. Neuroimage 91, 360–365. doi: 10.1016/j.neuroimage.2014.01.012
Sasaki, R., Kotan, S., Nakagawa, M., Miyaguchi, S., Kojima, S., Saito, K., et al. (2017a). Presence and absence of muscle contraction elicited by peripheral nerve electrical stimulation differentially modulate primary motor cortex excitability. Front. Hum. Neurosci. 11:146. doi: 10.3389/fnhum.2017.00146
Sasaki, R., Nakagawa, M., Tsuiki, S., Miyaguchi, S., Kojima, S., Saito, K., et al. (2017b). Regulation of primary motor cortex excitability by repetitive passive finger movement frequency. Neuroscience 357, 232–240. doi: 10.1016/j.neuroscience.2017.06.009
Sato, D., Yamashiro, K., Onishi, H., Yasuhiro, B., Shimoyama, Y., and Maruyama, A. (2015). Whole-hand water flow stimulation increases motor cortical excitability: a study of transcranial magnetic stimulation and movement-related cortical potentials. J. Neurophysiol. 113, 822–833. doi: 10.1152/jn.00161.2014
Schabrun, S. M., Ridding, M. C., Galea, M. P., Hodges, P. W., and Chipchase, L. S. (2012). Primary sensory and motor cortex excitability are co-modulated in response to peripheral electrical nerve stimulation. PLoS One 7:e51298. doi: 10.1371/journal.pone.0051298
Schilberg, L., Engelen, T., Ten Oever, S., Schuhmann, T., de Gelder, B., de Graaf, T. A., et al. (2018). Phase of beta-frequency tACS over primary motor cortex modulates corticospinal excitability. Cortex 103, 142–152. doi: 10.1016/j.cortex.2018.03.001
Sonoo, M., Kobayashi, M., Genba-Shimizu, K., Mannen, T., and Shimizu, T. (1996). Detailed analysis of the latencies of median nerve somatosensory evoked potential components, 1: selection of the best standard parameters and the establishment of normal values. Electroencephalogr. Clin. Neurophysiol. 100, 319–331. doi: 10.1016/0168-5597(96)95035-2
Steyvers, M., Levin, O., Van Baelen, M., and Swinnen, S. P. (2003). Corticospinal excitability changes following prolonged muscle tendon vibration. Neuroreport 14, 1901–1905. doi: 10.1097/01.wnr.0000093296.63079.fa
Sugawara, K., Onishi, H., Yamashiro, K., Kojima, S., Miyaguchi, S., Kotan, S., et al. (2016). Effect of range and angular velocity of passive movement on somatosensory evoked magnetic fields. Brain Topogr. 29, 693–703. doi: 10.1007/s10548-016-0492-4
Takemi, M., Masakado, Y., Liu, M., and Ushiba, J. (2013). Event-related desynchronization reflects downregulation of intracortical inhibition in human primary motor cortex. J. Neurophysiol. 110, 1158–1166. doi: 10.1152/jn.01092.2012
Tinazzi, M., Zarattini, S., Valeriani, M., Romito, S., Farina, S., Moretto, G., et al. (2005). Long-lasting modulation of human motor cortex following prolonged transcutaneous electrical nerve stimulation (TENS) of forearm muscles: evidence of reciprocal inhibition and facilitation. Exp. Brain Res. 161, 457–464. doi: 10.1007/s00221-004-2091-y
Tsang, P., Jacobs, M. F., Lee, K. G. H., Asmussen, M. J., Zapallow, C. M., and Nelson, A. J. (2014). Continuous theta-burst stimulation over primary somatosensory cortex modulates short-latency afferent inhibition. Clin. Neurophysiol. 125, 2253–2259. doi: 10.1016/j.clinph.2014.02.026
Vossen, A., Gross, J., and Thut, G. (2015). Alpha power increase after transcranial alternating current stimulation at alpha frequency (β-tACS) reflects plastic changes rather than entrainment. Brain Stimul. 8, 499–508. doi: 10.1016/j.brs.2014.12.004
Weiller, C., Jüptner, M., Fellows, S., Rijntjes, M., Leonhardt, G., Kiebel, S., et al. (1996). Brain representation of active and passive movements. Neuroimage 4, 105–110. doi: 10.1006/nimg.1996.0034
Keywords: passive movement, movement frequency, somatosensory-evoked potential, alpha oscillation, beta oscillation
Citation: Sasaki R, Tsuiki S, Miyaguchi S, Kojima S, Saito K, Inukai Y, Otsuru N and Onishi H (2018) Repetitive Passive Finger Movement Modulates Primary Somatosensory Cortex Excitability. Front. Hum. Neurosci. 12:332. doi: 10.3389/fnhum.2018.00332
Received: 08 June 2018; Accepted: 30 July 2018;
Published: 20 August 2018.
Edited by:
Mikhail Lebedev, Duke University, United StatesReviewed by:
Giancarlo Zito, Agenzia Italiana del Farmaco (AIFA), ItalyWolf-Julian Neumann, Charité Universitätsmedizin Berlin, Germany
Copyright © 2018 Sasaki, Tsuiki, Miyaguchi, Kojima, Saito, Inukai, Otsuru and Onishi. This is an open-access article distributed under the terms of the Creative Commons Attribution License (CC BY). The use, distribution or reproduction in other forums is permitted, provided the original author(s) and the copyright owner(s) are credited and that the original publication in this journal is cited, in accordance with accepted academic practice. No use, distribution or reproduction is permitted which does not comply with these terms.
*Correspondence: Ryoki Sasaki, aHdkMTcwMDVAbnVody5hYy5qcA==