- 1Biomechanics, Rehabilitation, and Integrative Neuroscience Lab, Department of Physical Medicine and Rehabilitation, School of Medicine, University of California, Davis, Sacramento, CA, United States
- 2UC Davis Healthy Aging in a Digital World Initiative, a UC Davis “Big Idea”, Sacramento, CA, United States
- 3Center for Neuroengineering and Medicine, University of California, Davis, Davis, CA, United States
- 4VA Northern California Health Care System, Martinez, CA, United States
Purpose: To examine the between-day absolute reliability of gait parameters acquired with Theia3D markerless motion capture for use in biomechanical and clinical settings.
Methods: Twenty-one (7 M,14 F) participants aged between 18 and 73 years were recruited in community locations to perform two walking tasks: self-selected and fastest-comfortable walking speed. Participants walked along a designated walkway on two separate days.Joint angle kinematics for the hip, knee, and ankle, for all planes of motion, and spatiotemporal parameters were extracted to determine absolute reliability between-days. For kinematics, absolute reliability was examined using: full curve analysis [root mean square difference (RMSD)] and discrete point analysis at defined gait events using standard error of measurement (SEM). The absolute reliability of spatiotemporal parameters was also examined using SEM and SEM%.
Results: Markerless motion capture produced low measurement error for kinematic full curve analysis with RMSDs ranging between 0.96° and 3.71° across all joints and planes for both walking tasks. Similarly, discrete point analysis within the gait cycle produced SEM values ranging between 0.91° and 3.25° for both sagittal and frontal plane angles of the hip, knee, and ankle. The highest measurement errors were observed in the transverse plane, with SEM >5° for ankle and knee range of motion. For the majority of spatiotemporal parameters, markerless motion capture produced low SEM values and SEM% below 10%.
Conclusion: Markerless motion capture using Theia3D offers reliable gait analysis suitable for biomechanical and clinical use.
Introduction
Walking represents an individual’s capacity for independence, autonomy, and self-efficacy making it an important benchmark of human health. Biomechanical gait analysis has been used extensively for evaluating human movement with findings applied in clinical populations to identify changes that occur in neuropathologies (Chen et al., 2005a; Albani et al., 2014). Gait is such a fundamental manifestation of human health that White et al. (2013) proposed gait speed, a spatiotemporal parameter (STP), as the sixth vital sign. More recently, various gait parameters (e.g., reduced hip flexion range of motion, increased stride time variability, swing time, step width) have been proposed as biomarkers for disease identification, progression, and rehabilitation outcomes in neuropathologies and cognitive disorders (Chen et al., 2005a, 2011; Jonkers et al., 2009; McDonald et al., 2013; Albani et al., 2014; Mancini et al., 2015; Valkanova et al., 2018; De Cock et al., 2019).
Joint kinematics, generated through biomechanical analyses, can be assessed over the entire time series of a gait cycle through curve analysis (Edwards et al., 2017) which offers the ability to characterize the pattern of excursion across the entire gait cycle (Fellin et al., 2010). For clinical use, however, gait analysis typically focuses on key determinants of gait such as the ankle, knee, and hip joint angles at specific events within the gait cycle, and may evaluate joint angles at initial contact, maximum angles in stance phase, and range of motion (RoM) across the entire gait cycle (El-Tamawy et al., 2012; Bonnyaud et al., 2015). Each of these variables has been used to explore movement behaviors in individuals with pathological gait (Chen et al., 2005a, b; Chen and Patten, 2008; Tenniglo et al., 2018; Penko et al., 2020). Additionally, STPs such as gait speed, cadence, stance, swing, and stride time, are used to describe gait dysfunction (Chen et al., 2005a, b), while STP variability has been used to characterize age-related and cognitive decline (Bahureska et al., 2017; Ceïde et al., 2018; De Cock et al., 2019).
Gait analysis is typically measured in a dedicated laboratory requiring specialized equipment and expertise. Laboratory three-dimensional (3D) motion capture systems rely on researcher expertise to perform data collection where required anthropometric measures such as stature, leg length, knee, and ankle breadth are required (Sun et al., 2020; Moreira et al., 2021; Reznick et al., 2021). Marker placement on specific anatomical landmarks is a critical skill that influences the accuracy of calculations derived from the collected data. Indeed, marker placement has been identified as a key source of error in motion analysis (Ferber et al., 2002; Noehren et al., 2010). For example, a marker misplacement of 10 mm on the ankle or knee can cause an error up to 7° (Osis et al., 2016). An additional challenge is for securing markers to reduce noise resulting from skin and tissue artifacts (Akbarshahi et al., 2010; Tsai et al., 2011; Osis et al., 2016).
Wearable inertial measurement units (IMUs) address some of these challenges inherent to 3D motion capture and also offer potential for cost-effective portable clinical gait analysis (Wu et al., 2021; McDevitt et al., 2022). Wearable devices such as the APDM Opal IMU-based system have been promoted for use in clinical populations to monitor gait and mobility in individuals with neurodegenerative conditions such as Parkinson’s disease and have recently been advanced as digital biomarker endpoints for clinical trials (Mancini et al., 2015; Mancini and Horak, 2016). IMU development has seen much progress and is under rapid expansion with offering the potential for accurate detection of kinematics (Al Borno et al., 2022).
In addition to IMUs, markerless motion capture (MLMC) systems have been under development by multiple investigators for purposes ranging from surveillance to motion analysis (Mündermann et al., 2006a, 2007). Several authors have worked on progressing the technology for clinical use (Mündermann et al., 2006a, b; Sandau et al., 2014; Kanko et al., 2021a, b; Lonini et al., 2022). Contributions from the fields such as machine learning have made critical advances to the accuracy and feasibility of this approach (Mündermann et al., 2007; Corazza et al., 2010). Corazza et al. (2010) introduced an automatic generation of subject-specific models that produced a comparable error in joint identification to marker placement errors for 3D motion capture. Implementation of MLMC comes with an underlying premise for robust detection and quantification of gait (Kanko et al., 2021a, b, c). Furthermore, MLMC technology improves data collection efficiency by eliminating the need for marker placement while providing accurate, high-resolution data (Sandau et al., 2014; Verlekar et al., 2019). Importantly, while IMUs may reduce some burden associated with data collection, they still require direct contact with the participant and accurate placement of sensors on body segments (Mancini and Horak, 2016; Al Borno et al., 2022). A distinct advantage of MLMC is the ability to capture data without the need for a dedicated laboratory or requirements for specialized attire, including footwear. Freedom from these requirements greatly improves the accessibility of gait analysis to clinical and community settings while simultaneously lowering the experimental burden on participants.
Theia3D, a machine learning algorithm-based MLMC software, has been recently developed with an aim for clinical use (Kanko et al., 2021a, b, c). This algorithm uses current biomechanical standards (i.e., inverse kinematics and rigid body tracking) to estimate the three-dimensional pose of the body segments. The Theia3D algorithm has been carefully examined by the developers demonstrating comparable outcomes to kinematics acquired with the putative gold standard, marker-based 3D motion capture (Kanko et al., 2021a). Kanko et al. (2021a) examined lower extremity joint motions during gait and found that data acquired using MLMC are comparable to traditional maker-based methods in sagittal, frontal, and transverse planes. Subsequently, Kanko et al. (2021b) reported repeatable inter-session data using MLMC by evaluating the variability of segmental kinematics captured across the full gait cycle (i.e., curves). Their analysis, however, did not provide a between-day measurement error of discrete points associated with Theia3D.
Assessment of measurement error is necessary for discriminating between healthy and abnormal gait while avoiding over-interpretation of small differences such as those intrinsic to human motor behavior or technical attributes of instrumentation (Schwartz et al., 2004; McGinley et al., 2009). Absolute reliability can provide clinicians a value of the magnitude of measurement error associated with the equipment and an index of expected trial-to-trial noise in the data (Weir, 2005). For kinematics, measurement errors typically reported from marker-based methods range from 2 to 5°, while errors greater than 5° are cause for concern (McGinley et al., 2009).
While the developers have demonstrated data acquired with MLMC that may be comparable to marker-based motion capture with acceptable inter-session variation (Kanko et al., 2021a, c), the absolute reliability of kinematic data acquired with Theia3D has not been reported. The aims of this study are to investigate (i) test-retest (between days) measurement error of lower extremity kinematics—(a) over the entire joint curve; and (b) at specific points within the gait cycle commonly used to evaluate gait; and (ii) spatiotemporal parameters of gait acquired using MLMC. The data captured during this study were collected in community and clinic-adjacent settings to establish the feasibility of using MLMC for gait analysis as a clinical outcome for the assessment of impairment and intervention effects in persons with neuropathological conditions.
Methods
Participants
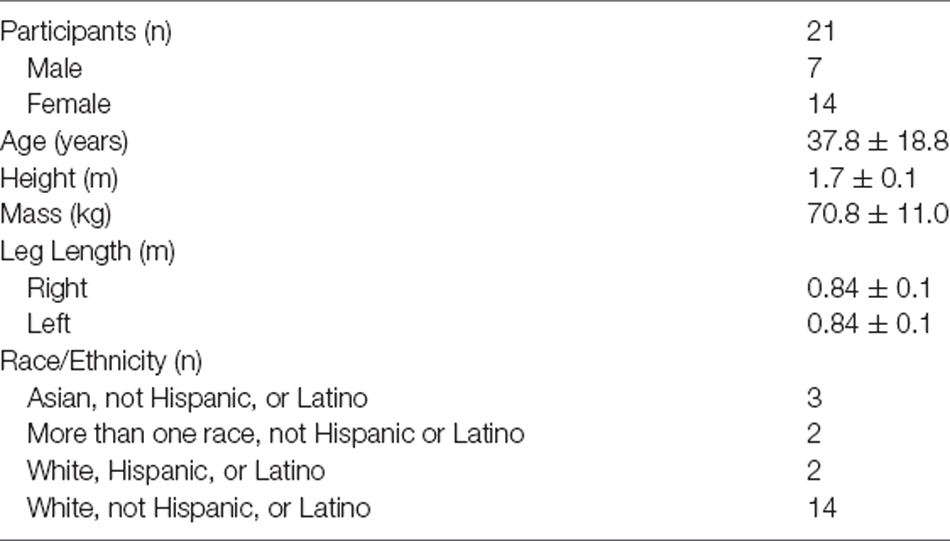
Following a review of literature (McGinley et al., 2009), we determined that 20 participants were necessary to establish reliability. A total of 21 individuals meeting the following broad criteria: (i) ability to follow three-step commands; (ii) ability to ambulate 15 meters, independently; and (iii) ability to provide written informed consent, participated in two sessions of gait assessment conducted in community and clinically-adjacent settings (detailed in the companion article, McGuirk et al., 2022). Participant characteristics and demographics are presented in Table 1. Participants were recruited in real-time, thus were given no prior instruction regarding clothing or footwear. Participants provided electronically written informed consent and completed health history and demographics questionnaires hosted on the Research Electronic Data Capture (REDCap) infrastructure (Harris et al., 2009, 2019). All procedures were approved by the University of California, Davis Institutional Review Board (#1386142) and conducted according to the Declaration of Helsinki.
Data Capture
Gait analysis was performed at three University of California, Davis locations. Nineteen (of 21) participants were studied in the same location. All participants performed two sessions separated by 10 ± 12 days (range, 1–52 days). The same camera setup was deployed at all locations (see Figure 1). Eight video cameras (Basler ace acA1300-75gc GigE, Ahrensburg, Germany) were arranged to produce a capture volume approximately six meters long, four meters wide, and two meters high. Four cameras were positioned along each side of the walkway with cameras nearest the ends of the walkway shifted 0.5 m to the center. The cameras were calibrated during set up at each location and recalibrated between each data collection session. Brightly colored sports cones were placed 10 m apart at the far ends of the walkway to mark the start and finish targets. Synchronized videos were collected at 60 Hz using AccuPower 4.0 software (v1.3.6.1978 Treadmetrix, Park City, Utah, USA).
Procedure
Participants performed two walking tasks: self-selected walking speed (SSWS) and fastest comfortable walking speed (FCWS). For the SSWS task, participants were instructed to walk normally at their usual pace. For FCWS, participants were instructed to imagine seeing oncoming traffic while being in a crosswalk and navigating to safety without running or jogging. Participants performed approximately six to eight passes for each task. These procedures were repeated in the second session.
Data Analysis
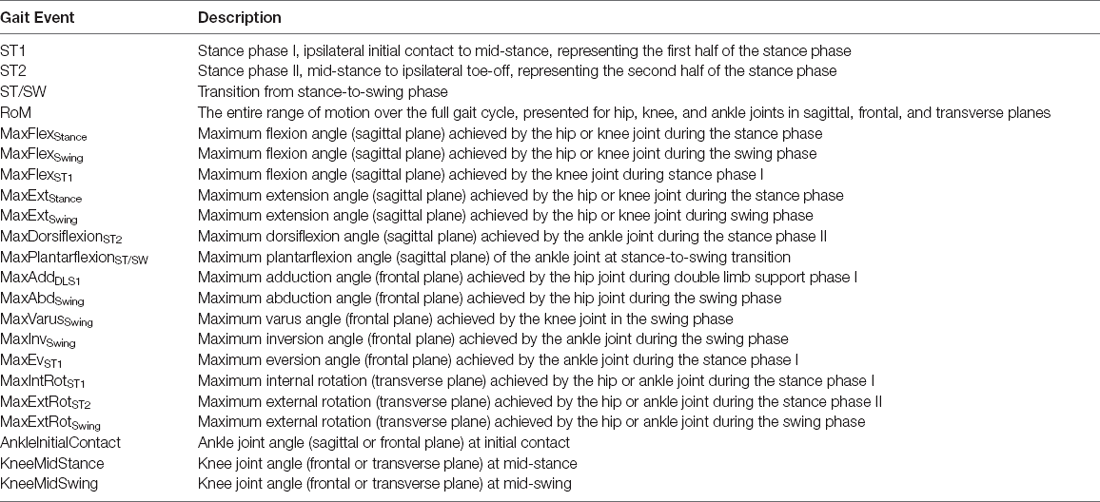
Video data were processed using Theia3D (v2021.2.0.1675, Theia Markerless Inc., Kingston, ON, Canada) to obtain three-dimensional (3D) subject pose estimates of limb segments. The resulting 4 × 4 pose estimates for each body segment were exported to Visual3D Professional (v2021.06.02, C-Motion, Inc., Germantown, MD, USA) for further analysis. The gait events, initial contact (IC), and toe-off, were determined using methods described by Zeni et al. (2008), with quality checks performed in Visual3D. Lower limb joint kinematics for the hip, knee, and ankle were calculated for the sagittal, frontal, and transverse planes (see Table 2). Variables of interest at defined points in the gait cycle and spatiotemporal parameters were calculated and analyzed in MATLAB (v2020a, Mathworks, Natick, MA, USA; see Table 3). Data were analyzed from the participant’s self-identified dominant leg. For each condition, the number of strides was matched between the two sessions.
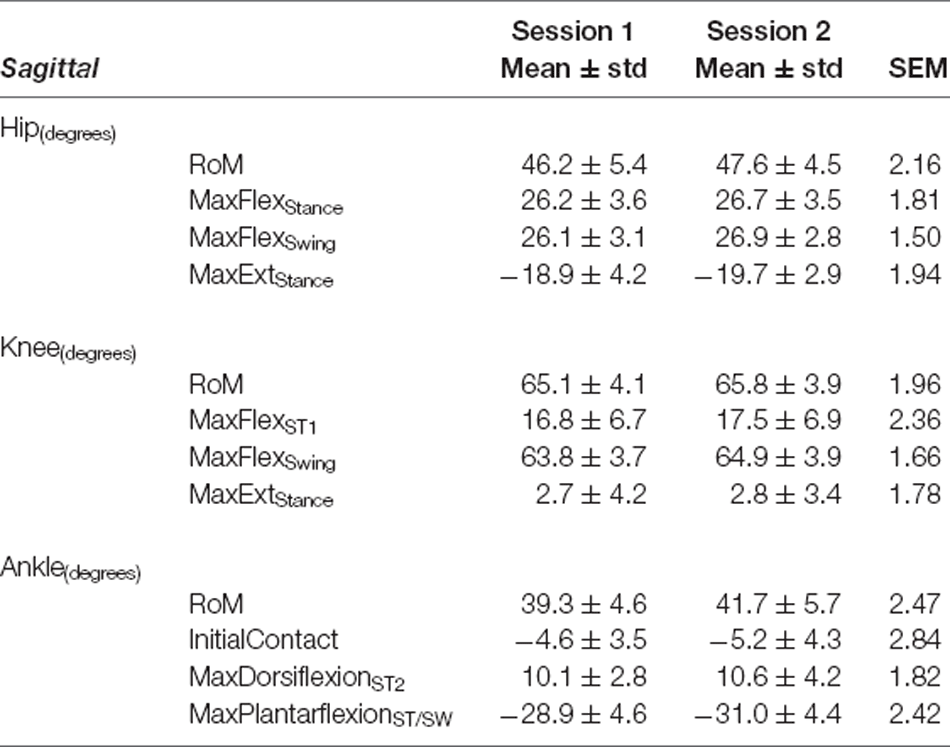
Table 3. Sagittal plane variables—Self-Selected Walking Speed: mean ± standard deviation (std) for Session 1 and Session 2, and Standard Error of Measurement (SEM).
Statistical Analysis
Error examination was performed using the approach described by Kanko et al. (2021a) where root-mean-square differences (RMSD) were calculated to evaluate between-day differences in the full curves of all three joints and planes of motion. For each session, the average RMSD was computed using the ensemble average of the participant’s within-session data. Absolute reliability was examined using standard error of measurement (SEM) of discrete points within the gait cycle and spatiotemporal parameters (Weir, 2005). Standard error of measurement represents a combination of random and systematic error and quantifies the precision of the equipment. Additionally, the SEM provides a value of error in the same units as the measurement (Weir, 2005). Measurement errors between 2° and 5° are to be considered acceptable (McGinley et al., 2009). The percentage of SEM expressed from the mean (SEM%) was derived for all spatiotemporal parameters. All statistical analysis was performed via custom-written MATLAB scripts and SPSSv27 (SPSS Inc., Chicago, IL, USA).
Results
The RMSDs from full curve analysis of kinematics for both SSWS and FCWS are reported in Figures 2 and 3. Absolute reliability expressed as SEM and RMSD was <5° for the majority of variables, thus deemed acceptable (McGinley et al., 2009). Results of discrete point kinematics and spatiotemporal variables expressed as SEM are presented in Tables 3–9.
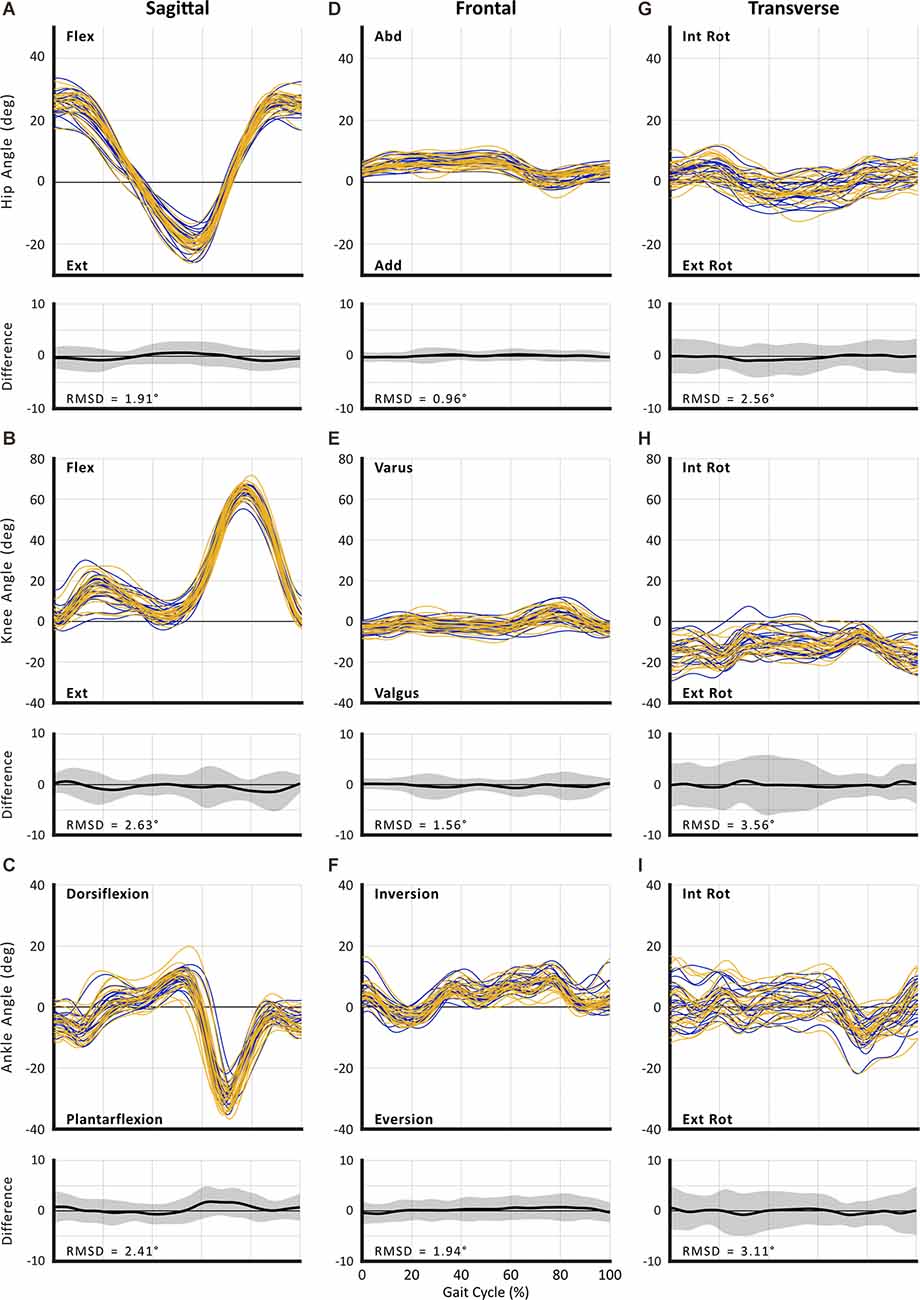
Figure 2. Between-session reproducibility of full curve analysis for subject-average joint angles during self-selected walking speed (SSWS). Data illustrate joint angles for hip (row 1), knee (row 2), and ankle (row 3) in the sagittal (A–C), frontal (D–F), and transverse planes (G–I). Each curve represents the ensemble average of each individual’s trials for Session 1 (blue lines) and Session 2 (gold lines). The average RMS difference across all subjects is shown below the respective joint angle plot; across all joints and planes of motion, the largest RMSD was 3.71°.
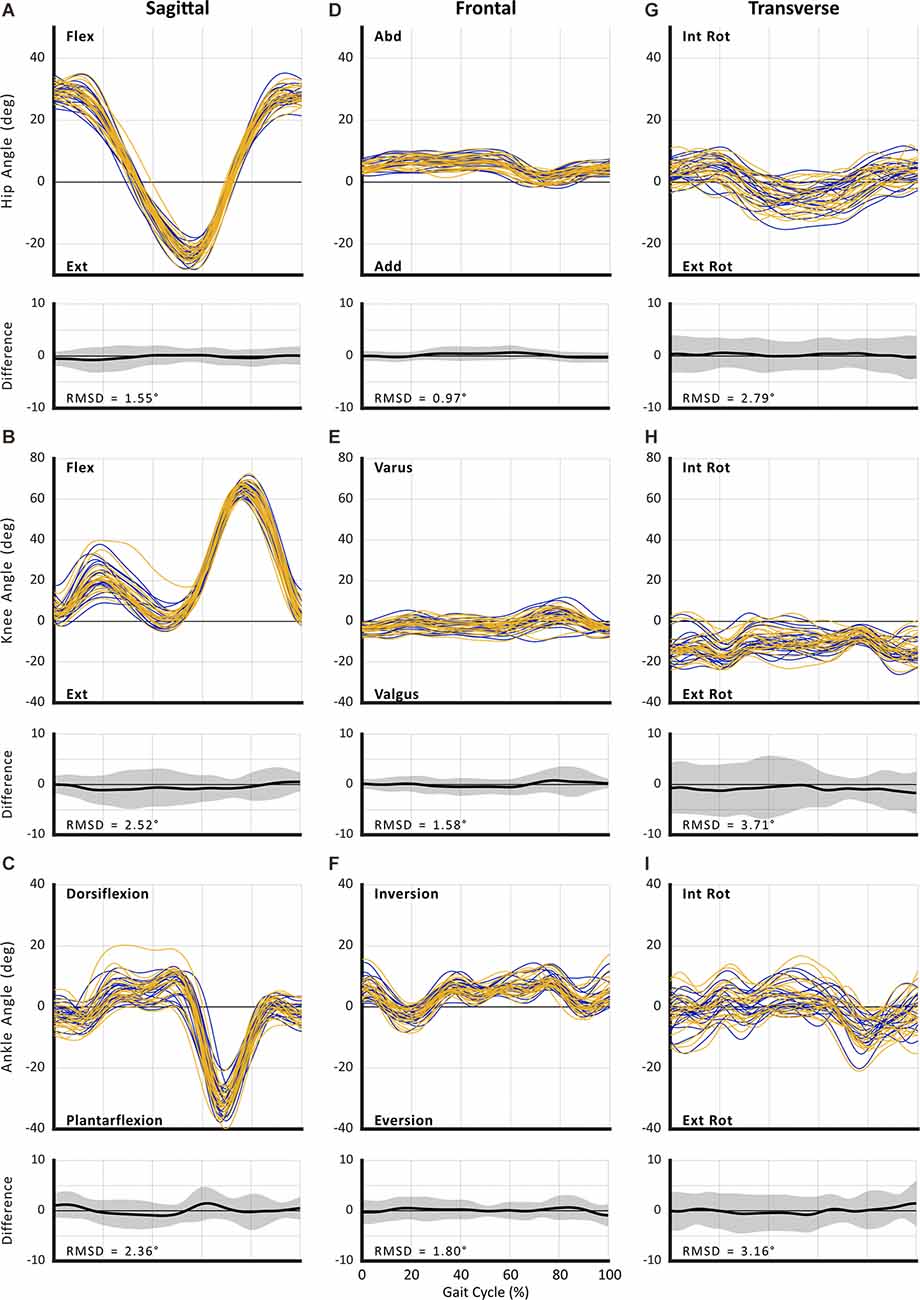
Figure 3. Between-session reproducibility of full curve analysis for subject-average joint angle during fastest comfortable walking speed (FCWS). Data illustrate joint angles for hip (row 1), knee (row 2), and ankle (row 3) in the sagittal (A–C), frontal (D–F), and transverse planes (G–I). Each curve represents the ensemble average of each individual’s trials for Session 1 (blue lines) and Session 2 (gold lines). The average RMS difference across all subjects is shown below the respective joint angle plot; across all joints and planes of motion, the largest RMSD was 3.56°.
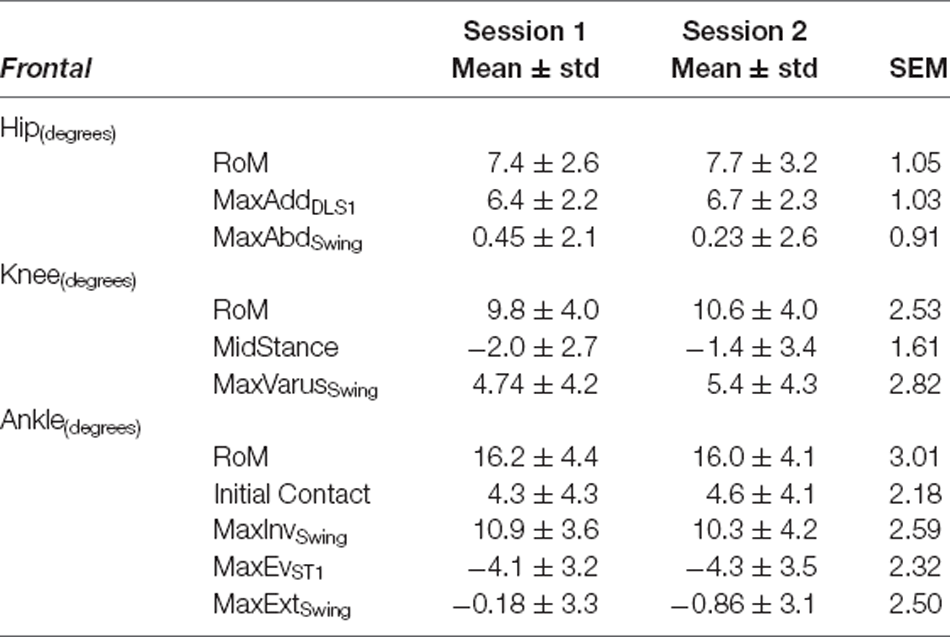
Table 4. Frontal plane variables—Self-Selected Walking Speed: mean ± standard deviation (std) for Session 1 and Session 2, and Standard Error of Measurement (SEM).
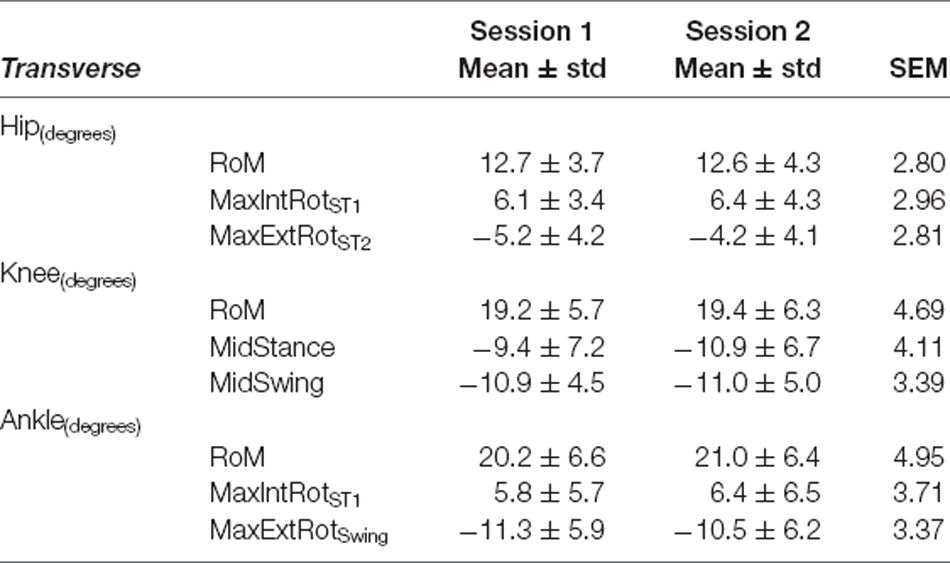
Table 5. Transverse plane variables—Self-Selected Walking Speed: mean ± standard deviation (std) for Session 1 and Session 2, and Standard Error of Measurement (SEM).
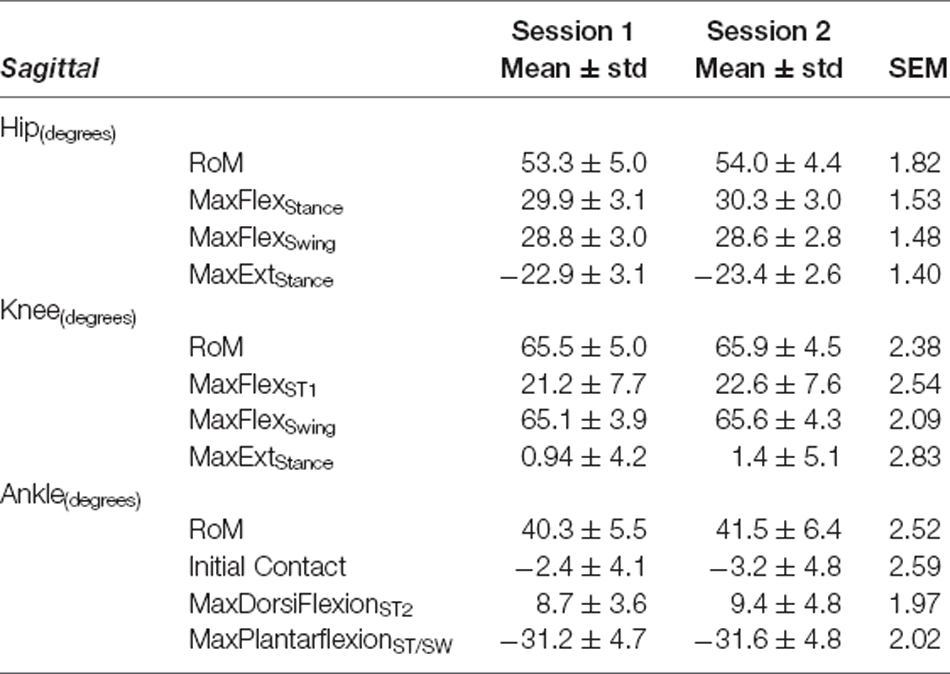
Table 6. Sagittal plane variables—Fastest Comfortable Walking Speed: mean ± standard deviation (std) for Session 1 and Session 2, and Standard Error of Measurement (SEM).
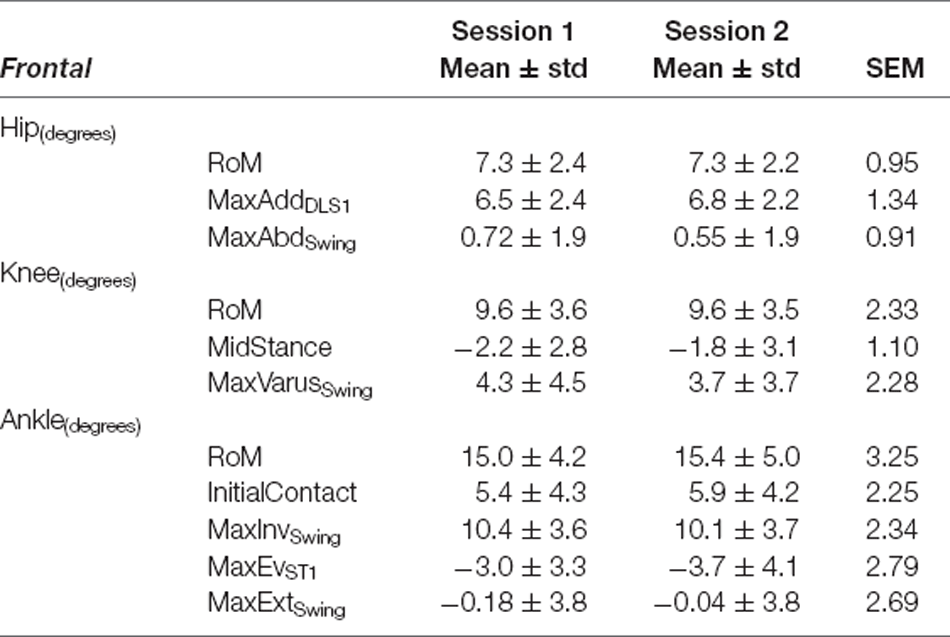
Table 7. Frontal plane variables—Fastest Comfortable Walking Speed: mean ± standard deviation (std) for Session 1 and Session 2, and Standard Error of Measurement (SEM).
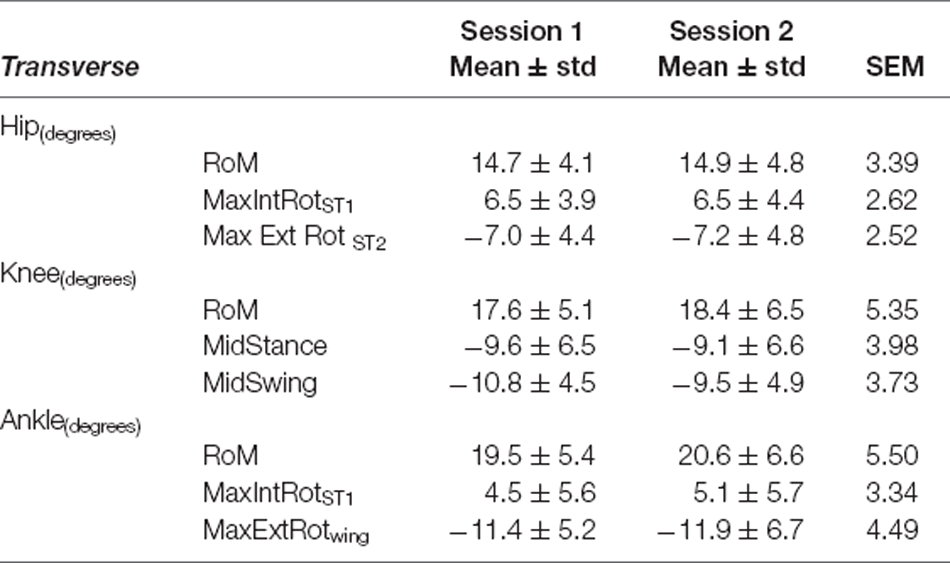
Table 8. Transverse plane variables—Fastest Comfortable Walking Speed: mean ± standard deviation (std) for Session 1 and Session 2, and Standard Error of Measurement (SEM).
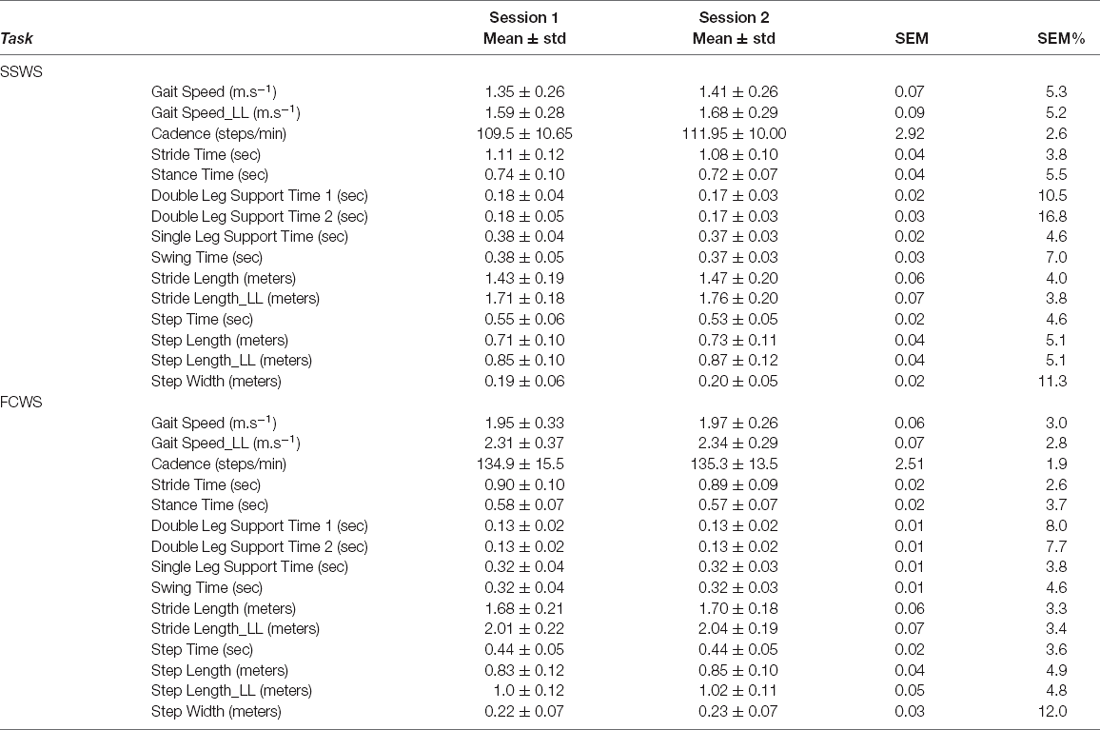
Table 9. Mean ± standard deviation (std) of the variables for both sessions (session 1 and session 2) along with Standard Error of Measurement (SEM), and percentage of Standard Error of Measurement expressed from the mean (SEM%) of Spatio-temporal variables during both self-selected walking speed (SSWS) and fastest comfortable walking speed (FCWS).
The absolute reliability of STP, reported here as SEM%, is comparable to previously reported clinical gait outcome measures (Flansbjer et al., 2005). Spatiotemporal parameters have been used widely in determining clinical outcomes and differences between healthy and pathological populations. Changes to joint RoM have been reported to influence spatiotemporal parameters; for example, in individuals with Parkinson’s disease, reduced step length, increased double support time, and cadence have been informative in determining the stage of the disease (Mirelman et al., 2019). Literature has reported differences in pathological gait compared to healthy individuals as 0.2–0.42 m for stride length, 0.05–0.13 m for step width, 0.06–0.14 m for step length (Chen et al., 2005a; Albani et al., 2014; Pistacchi et al., 2017; Bouça-Machado et al., 2020). Considering the data reported in the literature as expected differences, then we can proceed with confidence that gait analysis performed with Theia3D MLMC is sensitive and can discriminate spatiotemporal deviations for clinical use. Similar to kinematics, the measurement errors of spatiotemporal parameters reported in this study may help to avoid over-interpretation of results in studies employing Theia3D.
Curve Analysis
The RMSD ranged from 0.96° to 3.56° for SSWS (see Figure 2) and 0.97° to 3.71° for FCWS (see Figure 3). Across all joints, planes of motion, and walking tasks, the lowest RMSD was observed in hip frontal plane angles (see Figures 2D, Figures 3D) while the highest RMSD was observed at the knee joint in the transverse plane (see 2H, 3H), across both walking tasks.
SEM
Sagittal Plane
Our data revealed SEM values of less than 3° for sagittal plane kinematics for all three joints (range: 1.5°–2.84° for SSWS and 1.40°–2.83° during FCWS; see Tables 3, 6).
Frontal Plane
Kinematics for all three joints produced errors ranging from 0.91° to 3.01° during SSWS and 0.91° to 3.25°during FCWS. For both walking tasks (see Tables 4, 7), ankle RoM produced the highest SEM >3°. The lowest values were observed for hip joint maximum abduction angle during swing phase (SEM <1°) across both walking tasks.
Transverse Plane
For all joints, the largest measurement errors were observed in the transverse plane (range: 2.80°–4.95° in SSWS and 2.52°–5.50° for FCWS; see Tables 5, 8). Ankle and knee RoM angles for both walking tasks produced measurement errors >5°. Hip joint kinematics produced the lowest SEM across both walking tasks.
Spatiotemporal Parameters
All spatiotemporal parameters produced SEM% ranging between 2.6 and 16.8 percent during SSWS and 1.9 and 12.0 percent during FCWS (see Table 9). During SSWS, first and second double limb support time, and stride width produced SEM% >10%. During FCWS, only stride width produced an SEM% above >10% (12.0%).
Discussion
To our knowledge, this is the first study to report measurement errors associated with the Theia3D MLMC software. To date, no study has reported concurrent measurement of absolute reliability for both full curve and discrete point analysis kinematics and spatiotemporal parameters using either marker-based or markerless 3D motion capture. Our results show that MLMC is able to provide acceptable measurement error for the assessment of both full curve and discrete point kinematics, and spatiotemporal parameters. The full curve analysis reported here shows acceptable error for between-day kinematics examination. For between-day reliability, gait data acquired with MLMC largely produced measurement errors <3°. The highest measurement error was observed in the transverse plane, a typical observation when performing 3D motion capture of human walking (McGinley et al., 2009). This result is consistent with previous findings and not surprising as transverse plane motions are susceptible to error due to the limited range of movement (McGinley et al., 2009). Specifically, McGinley et al. (2009) identified hip rotation angles to be susceptible to the highest error when using the current gold standard, marker-based 3D motion capture. The results of this study, however, show that, with the exception of hip joint RoM during FCWS (3.39°), the hip transverse plane motion produced RMSD and SEM values <3° which tend lower than data acquired with marker-based motion capture (McGinley et al., 2009). The SEM of spatiotemporal parameters reported here is similar to previous studies that have examined reliability using 3D motion capture, IMU sensors, or pressure sensing walkways (Paterson et al., 2008; Meldrum et al., 2014; Posada-Ordax et al., 2021).
The low measurement errors observed from data acquired with Theia3D MLMC reported in this study demonstrate the sensitivity necessary to detect small changes in clinically important outcome measures. Thus, Theia3D provides confidence for detecting gait pathology or monitoring outcomes in response to rehabilitation. Data currently reported in the literature, derived from marker-based motion capture, reveal mean differences greater than the SEM values reported here. For example, Albani et al. (2014) examined sagittal plane kinematic differences between healthy controls and individuals with Parkinson’s disease. The authors reported differences between healthy and patient groups of 5.1° for hip RoM, 7.5° for knee RoM, 1.7° for max knee flexion angle during swing, and 1.3° for ankle RoM. Chen et al. (2005a) reported a difference of 20.8° between stroke survivors and healthy controls for sagittal plane max knee angle during swing. While an SEM value of 2.47° for the ankle sagittal plane RoM is reported here, Albani et al. (2014) reported a difference of 1.3° between healthy and impaired gait. However, within Parkinson’s disease, ankle kinematics are less likely to be altered when compared to healthy (Zanardi et al., 2021). Regardless, the knowledge of SEM values of hip, knee, and ankle kinematics should aid future studies using Theia3D and avoid potential over-interpretation of results when reporting kinematic differences.
Full curve examination affords the ability to detect possible deviations that may not be detected using discrete analysis. While values at a defined point may be similar between sessions, such evaluation does not mean that the pattern of motion was consistent across the full gait cycle. Our inter-session curve analysis reveals low magnitude differences for the entire gait cycle providing further confidence for both biomechanists and clinicians who desire to use MLMC for kinematic investigation.
Previous examinations of the reliability and validity of MLMC, Theia3D specifically, have been performed by the developers who bring extensive knowledge and experience with both deep learning (AI) and biomechanical analysis (Kanko et al., 2021a, b). The current study has several differences from the experiments conducted by Kanko and colleagues. Kanko et al. (2021b) established reliability using data collected in a dedicated laboratory setting, from eight college-aged participants, while controlling for clothing and footwear. In the present study, we leveraged the ability to perform 3D gait analysis outside of a laboratory, working instead in accessible environments such as community centers and clinical facilities representative of where this new technology may be used to evaluate clinical populations and functional outcomes. Additionally, we sampled a diverse group of individuals and explicitly did not control for their attire. We sought to determine how realistic it will be to use this tool for the evaluation of gait dysfunction in clinical populations, particularly individuals participating in neurorehabilitation. Our data show strong evidence of low measurement error, even in what may be traditionally considered non-ideal conditions for 3D motion analysis, demonstrating strong potential for use of MLMC in clinical environments.
While representing significant and important advances in biomechanical technologies, it is important to note that, similar to marker-based motion capture tools, currently available commercial MLMC products are not turnkey systems. Prior to conducting the present study, our team performed extensive development work (described in the companion article, McGuirk et al., 2022) to determine the requisites (e.g., location, optimal capture volume, camera configuration, lighting, collection time, sampling frequency, and the number of trials required for each task and location) for feasibly acquiring 3D kinematics in free living spaces. This development process revealed the majority of clothing allows for detection of expected limb and segment motion. One challenge encountered, however, was with calf/ankle length skirts, which did not allow the modeling of the pelvis and legs. Of the 21 individuals who participated in this study, 10 wore similar clothing for both sessions (e.g., t-shirt and shorts). Six individuals wore shorts or a short (above-knee length) skirt for one session and switched to long trousers for the other; all six also wore different shoes. One individual switched from sandals to shoes between sessions; another walked barefoot for both sessions.
Conclusion
The results of this study show that 3D gait analysis conducted in open, participant-facing environments with markerless motion capture affords repeatable, accurate 3D gait data suitable for both biomechanists and clinicians. Measurement error of 3D kinematics examined through both full curve and discrete point analysis and spatiotemporal parameters was low, providing a basis for interpretation of both clinical status and monitoring rehabilitation outcomes. This study shows that implementation of Theia3D MLMC does not require specific procedures to control for clothing as is the case for marker-based motion capture. The findings of this study also support the feasibility of using the MLMC tools in various settings and populations. While the reliability of the data acquired using markerless motion capture was comparable to that reported from marker-based systems, in some cases—such as hip transverse plane kinematics—we observed lower measurement errors. Together, these findings provide confidence in MLMC and indicating strong potential for its future use in the neurorehabilitation setting.
Data Availability Statement
The raw data supporting the conclusions of this article will be made available by the authors, without undue reservation.
Ethics Statement
The studies involving human participants were reviewed and approved by University of California, Davis Institutional Review Board. The patients/participants provided their written informed consent to participate in this study.
Author Contributions
CP and TM conceived and designed the study. All authors contributed to data collection. TM and WS processed, SR analyzed, and SR and CP interpreted, the data. EP developed electronic data collection tools. All authors contributed to writing the manuscript and approved the submitted version.
Funding
This research was sponsored by the UC Davis Healthy Aging in a Digital World initiative, with financial support from the Tsakopoulos Demos Aging and Healthy Communities Fund. SR is the inaugural UC Davis Healthy Aging in a Digital World post-doctoral fellow and received financial support from the Tsakopoulos Demos Aging and Healthy Communities Fund. The implementation of REDCap for this study was supported by the National Center for Advancing Translational Sciences (NCATS), National Institutes of Health (NIH), through grant UL1 TR000002. This work was supported by the UC Davis School of Medicine and the VA Rehabilitation RR&D Service (Research Career Scientist Award #IK6RX003543; CP).
Conflict of Interest
The authors declare that the research was conducted in the absence of any commercial or financial relationships that could be construed as a potential conflict of interest.
Publisher’s Note
All claims expressed in this article are solely those of the authors and do not necessarily represent those of their affiliated organizations, or those of the publisher, the editors and the reviewers. Any product that may be evaluated in this article, or claim that may be made by its manufacturer, is not guaranteed or endorsed by the publisher.
Acknowledgments
We would like to acknowledge and thank the entire UC Davis BRaIN Lab for their contributions to both practice and data collection with the markerless motion capture system. Notably: Adam M. Weiner, Caitlin L. Banks, Karen Shlesinger, Ryan L. Hobbib, Hannah F. Hanif, and David R. Young.
References
Akbarshahi, M., Schache, A. G., Fernandez, J. W., Baker, R., Banks, S., Pandy, M. G., et al. (2010). Non-invasive assessment of soft-tissue artifact and its effect on knee joint kinematics during functional activity. J. Biomech. 43, 1292–1301. doi: 10.1016/j.jbiomech.2010.01.002
Al Borno, M., O’Day, J., Ibarra, V., Dunne, J., Seth, A., Habib, A., et al. (2022). OpenSense: an open-source toolbox for inertial-measurement-unit-based measurement of lower extremity kinematics over long durations. J. Neuroeng. Rehabil. 19, 1–11. doi: 10.1186/s12984-022-01001-x
Albani, G., Cimolin, V., Fasano, A., Trotti, C., Galli, M., Mauro, A., et al. (2014). “Masters and Servants” in parkinsonian gait: a three-dimensional analysis of biomechanical changes sensitive to disease progression Funct. Neurol. 29, 99–105.
Bahureska, L., Najafi, B., Saleh, A., Sabbagh, M., Coon, D., Mohler, J., et al. (2017). The impact of mild cognitive impairment on gait and balance. Gerontology 165, 255–269. doi: 10.1159/000445831
Bonnyaud, C., Pradon, D., Vuillerme, N., Bensmail, D., and Roche, N. (2015). Spatiotemporal and kinematic parameters relating to Oriented gait and turn performance in patients with chronic stroke. PLoS One 10:e0129821. doi: 10.1371/journal.pone.0129821
Bouça-Machado, R., Jalles, C., Guerreiro, D., Pona-Ferreira, F., Branco, D. I., Guerreiro, T., et al. (2020). Gait kinematic parameters in Parkinson’s disease: a systematic review. J. Parkinsons. Dis. 10:843. doi: 10.3233/JPD-201969
Ceïde, M. E., Ayers, E. I., Lipton, R., and Verghese, J. (2018). Walking while talking and risk of incident dementia. Am. J. Geriatr. Psychiatry 26, 580–588. doi: 10.1016/j.jagp.2017.12.009
Chen, G., and Patten, C. (2008). Joint moment work during the stance-to-swing transition in hemiparetic subjects. J. Biomech. 41, 877–883. doi: 10.1016/j.jbiomech.2007.10.017
Chen, S.-C., Hsieh, H.-J., Lu, T.-W., and Tseng, C.-H. (2011). A method for estimating subject-specific body segment inertial parameters in human movement analysis. Gait Posture 33, 695–700. doi: 10.1016/j.gaitpost.2011.03.004
Chen, G., Patten, C., Kothari, D. H., and Zajac, F. E. (2005a). Gait differences between individuals with post-stroke hemiparesis and non-disabled controls at matched speeds. Gait Posture 22, 51–56. doi: 10.1016/j.gaitpost.2004.06.009
Chen, G., Patten, C., Kothari, D. H., and Zajac, F. E. (2005b). Gait deviations associated with post-stroke hemiparesis: Improvement during treadmill walking using weight support, speed, support stiffness and handrail hold. Gait Posture 22, 57–62. doi: 10.1016/j.gaitpost.2004.06.008
Corazza, S., Mündermann, L., Gambaretto, E., Ferrigno, G., and Andriacchi, T. P. (2010). Markerless motion capture through visual hull, articulated ICP and subject specific model generation. Int. J. Comput. Vis. 87, 156–169. doi: 10.1007/s11263-009-0284-3
De Cock, A. M., Fransen, E., Perkisas, S., Verhoeven, V., Beauchet, O., Vandewoude, M., et al. (2019). Comprehensive quantitative spatiotemporal gait analysis identifies gait characteristics for early dementia subtyping in community dwelling older adults. Front. Neurol. 10:313. doi: 10.3389/fneur.2019.00313
Edwards, W. B., Derrick, T. R., and Hamill, J. (2017). “Time series analysis in biomechanics,” in Handbook of Human Motion, ed B. Müller et al. (Cham: Springer), 1–24. doi: 10.1007/978-3-319-30808-1_178-1
El-Tamawy, M. S., Darwish, M. H., and Khallaf, M. E. (2012). Effects of augmented proprioceptive cues on the parameters of gait of individuals with Parkinson’s disease. Ann. Indian Acad. Neurol. 15, 267–272. doi: 10.4103/0972-2327.104334
Fellin, R. E., Manal, K., and Davis, I. S. (2010). Comparison of lower extremity kinematic curves during overground and treadmill running. J. Appl. Biomech. 26, 407–414. doi: 10.1123/jab.26.4.407
Ferber, R., McClay Davis, I., Williams III, D. S., and Laughton, C. (2002). A comparison of within- and between-day reliability of discrete 3D lower extremity variables in runners. J. Orthop. Res. 20, 1139–1145. doi: 10.1016/S0736-0266(02)00077-3
Flansbjer, U. B., Holmbäck, A. M., Downham, D., Patten, C., and Lexell, J. (2005). Reliability of gait performance tests in men and women with hemiparesis after stroke. J. Rehabil. Med. 37, 75–82. doi: 10.1080/16501970410017215
Harris, P. A., Taylor, R., Minor, B. L., Elliott, V., Fernandez, M., O’Neal, L., et al. (2019). The REDCap consortium: building an international community of software platform partners. J. Biomed. Inform. 95:103208. doi: 10.1016/j.jbi.2019.103208
Harris, P. A., Taylor, R., Thielke, R., Payne, J., Gonzalez, N., Conde, J. G., et al. (2009). Research electronic data capture (REDCap)-a metadata-driven methodology and workflow process for providing translational research informatics support. J. Biomed. Inform. 42, 377–381. doi: 10.1016/j.jbi.2008.08.010
Jonkers, I., Delp, S., and Patten, C. (2009). Capacity to increase walking speed is limited by impaired hip and ankle power generation in lower functioning persons post-stroke. Gait Posture 29, 129–137. doi: 10.1016/j.gaitpost.2008.07.010
Kanko, R. M., Laende, E. K., Davis, E. M., Selbie, W. S., and Deluzio, K. J. (2021a). Concurrent assessment of gait kinematics using marker-based and markerless motion capture. J. Biomech. 127:110665. doi: 10.1016/j.jbiomech.2021.110665
Kanko, R. M., Laende, E. K., Strutzenberger, G., Brown, M., Selbie, W. S., DePaul, V., et al. (2021b). Assessment of spatiotemporal gait parameters using a deep learning algorithm-based markerless motion capture system. J. Biomech. 122:110414. doi: 10.1016/j.jbiomech.2021.110414
Kanko, R. M., Laende, E., Selbie, W. S., and Deluzio, K. J. (2021c). Inter-session repeatability of markerless motion capture gait kinematics. J. Biomech. 121:110422. doi: 10.1016/j.jbiomech.2021.110422
Lonini, L., Moon, Y., Embry, K., Cotton, R. J., McKenzie, K., Jenz, S., et al. (2022). Video-based pose estimation for gait analysis in stroke survivors during clinical assessments: a proof-of-concept study. Digit. Biomarkers 6, 9–18. doi: 10.1159/000520732
Mancini, M., El-Gohary, M., Pearson, S., Mcnames, J., Schlueter, H., Nutt, J. G., et al. (2015). Continuous monitoring of turning in Parkinson’s disease: rehabilitation potential. NeuroRehabilitation 37:3. doi: 10.3233/NRE-151236
Mancini, M., and Horak, F. B. (2016). Potential of APDM mobility lab for the monitoring of the progression of Parkinson’s disease. Expert Rev. Med. Devices 13:455. doi: 10.1586/17434440.2016.1153421
McDevitt, S., Hernandez, H., Hicks, J., Lowell, R., Bentahaikt, H., Burch, R., et al. (2022). Wearables for biomechanical performance optimization and risk assessment in industrial and sports applications. Bioengineering 9:33. doi: 10.3390/bioengineering9010033
McDonald, C. M., Henricson, E. K., Abresch, R. T., Florence, J. M., Eagle, M., Gappmaier, E., et al. (2013). The 6-minute walk test and other endpoits in duchene muscular dystrophy: longitudinal natural history oservations over 48 weeks from a multicenter study. Muscle Nerve 48:343. doi: 10.1002/mus.23902
McGinley, J. L., Baker, R., Wolfe, R., and Morris, M. E. (2009). The reliability of three-dimensional kinematic gait measurements: a systematic review. Gait Posture 29, 360–369. doi: 10.1016/j.gaitpost.2008.09.003
McGuirk, T. E., Perry, E. S., Sihanath, W. B., Riazati, S., and Patten, C. (2022). Feasibility of markerless motion capture for three-dimensional gait assessment in community settings. Front. Hum. Neurosci. 16:867485. doi: 10.3389/fnhum.2022.867485
Meldrum, D., Shouldice, C., Conroy, R., Jones, K., and Forward, M. (2014). Test-retest reliability of three dimensional gait analysis: including a novel approach to visualising agreement of gait cycle waveforms with bland altman plots. Gait Posture 39, 265–271. doi: 10.1016/j.gaitpost.2013.07.130
Mirelman, A., Bonato, P., Camicioli, R., Ellis, T. D., Giladi, N., Hamilton, J. L., et al. (2019). Gait impairments in Parkinson’s disease. Lancet Neurol. 18, 697–708. doi: 10.1016/S1474-4422(19)30044-4
Moreira, L., Figueiredo, J., Fonseca, P., Vilas-Boas, J. P., and Santos, C. P. (2021). Lower limb kinematic, kinetic and EMG data from young healthy humans during walking at controlled speeds. Sci. Data 8, 1–11. doi: 10.1038/s41597-021-00881-3
Mündermann, L., Corazza, S., and Andriacchi, T. P. (2007). “Accurately measuring human movement using articulated ICP with soft-joint constraints and a repository of articulated models,” in 2007 IEEE Conference on Computer Vision and Pattern Recognition (Minneapolis, MN, USA). doi: 10.1109/CVPR.2007.383302
Mündermann, L., Corazza, S., Chaudhari, A. M., Andriacchi, T. P., Sundaresan, A., Chellappa, R., et al. (2006a). Measuring human movement for biomechanical applications using markerless motion capture. Three-Dimensional Image Capture Applications VII 6056:60560R. doi: 10.1117/12.650854
Mündermann, L., Corazza, S., and Andriacchi, T. P. (2006b). The evolution of methods for the capture of human movement leading to markerless motion capture for biomechanical applications. J. Neuroeng. Rehabil. 3, 1–11. doi: 10.3174/ajnr.A7501
Noehren, B., Manal, K., and Davis, I. (2010). Improving between-day kinematic reliability using a marker placement device. J. Orthop. Res. 28, 1405–1410. doi: 10.1002/jor.21172
Osis, S. T., Hettinga, B. A., Macdonald, S., and Ferber, R. (2016). Effects of simulated marker placement deviations on running kinematics and evaluation of a morphometric-based placement feedback method. PLoS One 11:e0147111. doi: 10.1371/journal.pone.0147111
Paterson, K. L., Hill, K. D., Lythgo, N. D., and Maschette, W. (2008). The reliability of spatiotemporal gait data for young and older women during continuous overground walking. Arch. Phys. Med. Rehabil. 89, 2360–2365. doi: 10.1016/j.apmr.2008.06.018
Penko, A. L., Streicher, M. C., Dey, T., Rosenfeldt, A. B., and Alberts, J. L. (2020). Parkinson’s gait kinematics deteriorates across multiple cognitive domains under dual-task paradigms. Clin. Neurol. Neurosurg 197:106083. doi: 10.1016/j.clineuro.2020.106083
Pistacchi, M., Gioulis, M., Sanson, F., de Giovannini, E., Filippi, G., Rossetto, F., et al. (2017). Gait analysis and clinical correlations in early Parkinson’s disease. Funct. Neurol. 32, 28–34. doi: 10.11138/fneur/2017.32.1.028
Posada-Ordax, J., Cosin-Matamoros, J., Losa-Iglesias, M. E., Becerro-De-Bengoa-Vallejo, R., Esteban-Gonzalo, L., Martin-Villa, C., et al. (2021). Clinical medicine accuracy and repeatability of spatiotemporal gait parameters measured with an inertial measurement unit. J. Clin. Med 10:1804. doi: 10.3390/jcm10091804
Reznick, E., Embry, K. R., Neuman, R., Bolívar-Nieto, E., Fey, N. P., Gregg, R. D., et al. (2021). Lower-limb kinematics and kinetics during continuously varying human locomotion. Sci. Data 8, 1–12. doi: 10.1038/s41597-021-01057-9
Sandau, M., Koblauch, H., Moeslund, T. B., Aanæs, H., Alkjær, T., Simonsen, E. B., et al. (2014). Markerless motion capture can provide reliable 3D gait kinematics in the sagittal and frontal plane. Med. Eng. Phys. 36, 1168–1175. doi: 10.1016/j.medengphy.2014.07.007
Schwartz, M. H., Trost, J. P., and Wervey, R. A. (2004). Measurement and management of errors in quantitative gait data. Gait Posture 20, 196–203. doi: 10.1016/j.gaitpost.2003.09.011
Sun, D., Fekete, G., Baker, J. S., and Gu, Y. (2020). Foot motion character during forward and backward walking with shoes and barefoot. J. Mot. Behav. 52, 214–225. doi: 10.1080/00222895.2019.1605972
Tenniglo, M. J. B., Buurke, J. H., Prinsen, E. C., Kottink, A. I. R., Nene, A. V., Rietman, J. S., et al. (2018). Influence of functional electrical stimulation of the hamstrings on knee kinematics in stroke survivors walking with stiff knee gait. J. Rehabil. Med. 50, 719–724. doi: 10.2340/16501977-2367
Tsai, T. Y., Lu, T. W., Kuo, M. Y., and Lin, C. C. (2011). Effects of soft tissue artifacts on the calculated kinematics and kinetics of the knee during stair-ascent. J. Biomech. 44, 1182–1188. doi: 10.1016/j.jbiomech.2011.01.009
Valkanova, V., Esser, P., Demnitz, N., Sexton, C. E., Zsoldos, E., Mahmood, A., et al. (2018). Association between gait and cognition in an elderly population based sample. Gait Posture 65, 240–245. doi: 10.1016/j.gaitpost.2018.07.178
Verlekar, T. T., De Vroey, H., Claeys, K., Hallez, H., Soares, L. D., Correia, P. L., et al. (2019). Estimation and validation of temporal gait features using a markerless 2D video system. Comput. Methods Programs Biomed. 175, 45–51. doi: 10.1016/j.cmpb.2019.04.002
Weir, J. P. (2005). Quantifying test-retest reliability using the intraclass correlation coefficient and the SEM. J. Strength Cond. Res. 19, 231–240. doi: 10.1519/15184.1
White, D. K., Neogi, T., Nevitt, M. C., Peloquin, C. E., Zhu, Y., Boudreau, R. M., et al. (2013). Trajectories of gait speed predict mortality in well-functioning older adults: the health, aging and body composition study. J. Gerontol. A Biol. Sci. Med. Sci. 68, 456–464. doi: 10.1093/gerona/gls197
Wu, J., Kuruvithadam, K., Schaer, A., Stoneham, R., Chatzipirpiridis, G., Easthope, C. A., et al. (2021). An intelligent in-shoe system for gait monitoring and analysis with optimized sampling and real-time visualization capabilities. Sensors 21:2869. doi: 10.3390/s21082869
Zanardi, A. P. J., da Silva, E. S., Costa, R. R., Passos-Monteiro, E., dos Santos, I. O., Kruel, L. F. M., et al. (2021). Gait parameters of Parkinson’s disease compared with healthy controls: a systematic review and meta-analysis. Sci. Rep. 11:752. doi: 10.1038/s41598-020-80768-2
Keywords: measurement error, repeatability, digital biomarkers, kinematics, rehabilitation outcomes, gait, markerless motion capture, spatiotemporal gait parameters
Citation: Riazati S, McGuirk TE, Perry ES, Sihanath WB and Patten C (2022) Absolute Reliability of Gait Parameters Acquired With Markerless Motion Capture In Living Domains. Front. Hum. Neurosci. 16:867474. doi: 10.3389/fnhum.2022.867474
Received: 01 February 2022; Accepted: 27 April 2022;
Published: 16 June 2022.
Edited by:
Lauri Bishop, University of Southern California, United StatesReviewed by:
Russell Johnson, University of Southern California, United StatesYaodong Gu, Ningbo University, China
Jos Vanrenterghem, KU Leuven, Belgium
Copyright © 2022 Riazati, McGuirk, Perry, Sihanath and Patten. This is an open-access article distributed under the terms of the Creative Commons Attribution License (CC BY). The use, distribution or reproduction in other forums is permitted, provided the original author(s) and the copyright owner(s) are credited and that the original publication in this journal is cited, in accordance with accepted academic practice. No use, distribution or reproduction is permitted which does not comply with these terms.
*Correspondence: Carolynn Patten, Y3BhdHRlbkB1Y2RhdmlzLmVkdQ==
 Sherveen Riazati
 Theresa E. McGuirk
 Elliott S. Perry
 Wandasun B. Sihanath
 Carolynn Patten