 Xiaomin Wang
 Shaokai Zhao2†
 Yu Pei
 Zhiguo Luo
 Liang Xie
 Erwei Yin
- 1Academy of Medical Engineering and Translational Medicine, Tianjin University, Tianjin, China
- 2Defense Innovation Institute, Academy of Military Sciences (AMS), Beijing, China
Introduction: Emotion recognition plays a crucial role in affective computing. Recent studies have demonstrated that the fuzzy boundaries among negative emotions make recognition difficult. However, to the best of our knowledge, no formal study has been conducted thus far to explore the effects of increased negative emotion categories on emotion recognition.
Methods: A dataset of three sessions containing consistent non-negative emotions and increased types of negative emotions was designed and built which consisted the electroencephalogram (EEG) and the electrocardiogram (ECG) recording of 45 participants.
Results: The results revealed that as negative emotion categories increased, the recognition rates decreased by more than 9%. Further analysis depicted that the discriminative features gradually reduced with an increase in the negative emotion types, particularly in the θ, α, and β frequency bands.
Discussion: This study provided new insight into the balance of emotion-inducing stimuli materials.
1. Introduction
Affective computing is aims to give machines the ability to interpret and simulate human emotional states (Tao and Tieniu, 2005). A significant advance in the last few decades can be attributed to the updates and developments in new feature extraction, machine learning algorithms, and portable devices (Arya et al., 2021). Advances in hardware have increased the emotional modality that machines can perceive, such as Electroencephalogram (EEG), Electrocardiography (ECG), Galvanic Skin Response (GSR), and Electromyography (EMG). Meanwhile, advances in software have helped machines mine the emotional component of multimodal data more effectively.
Achieving better emotion recognition performance is a constant topic for emotional human-computer interface (HCI) researchers. This led to many previous studies on affective HCI (aHCI) focusing on algorithm application. However, in Parkinson’s criticism of the “machine” end, such as novel feature extraction or the novel three areas of emotion research (individual, interpersonal, and representational components of emotion), “human” is the determining factor (Subramanian et al., 2016). Recently, some researchers have attempted to make some changes to bring human factors into emotional computing (Miranda-Correa et al., 2018; Song et al., 2019; Lee and Yoo, 2020). Particularly, negative emotion recognition has attracted much attention (Vaudable and Devillers, 2012; Gouizi et al., 2014).
Negative emotions are usually defined as these with low valences (Zheng et al., 2017). Negative emotions often lead to mental stress, as well as a decrease in attention and concentration. Therefore, it plays a significant role in the survival and adaptation of individuals (Vaskinn et al., 2017; Woodard et al., 2022). From this perspective, recognizing negative emotions is extremely important for affective HCI (Lee and Yoo, 2020). Research on negative emotions can help guide the diagnosis and treatment of mood disorders (Terhürne et al., 2022; Wu et al., 2022). Typical application scenarios for negative emotion detection include the online mental healthcare platforms or an indicator to assess the quality of call center conversations (Vaudable and Devillers, 2012; Gouizi et al., 2014; Dheeraj and Ramakrishnudu, 2021). However, recent studies have demonstrated that it is more difficult to accurately classify negative emotions than neutral and positive emotions (Calvo et al., 2009; Wang et al., 2020). For example, in SEED IV, the accuracies of EEG signal-based classifier in the case of neutral and positive emotions were 80 and 78%, respectively, whereas those for sadness and fear were 63 and 65% (Zheng et al., 2018). Zhuang et al. (2018) investigated the classification accuracy of six discrete emotions, including four negative emotions. The accuracy of the latter four emotions was approximately 50%, whereas the accuracies of neutral and positive emotions reached 70 and 62%, respectively. In terms of EEG signal characteristics, negative emotional states exhibited higher energy in the delta, theta, and alpha frequency bands compared to neutral emotions (Feradov and Ganchev, 2019). And some studies showed that high-arousal negative emotions are associated with increased physiologic reactivity such as elevated blood pressure (Gordon and Mendes, 2021).
Dozens of databases have been proposed for various purposes in affective computing research. They can be classified into three types based on their motivation. First, several studies have explored the representation of emotions in different physiological signal (Kim and André, 2008; Soleymani et al., 2011; Katsigiannis and Ramzan, 2017; Leelaarporn et al., 2021; Chen J. et al., 2022; Yu et al., 2022). For example, some researchers have attempted to induce negative emotions, such as disgust and amusement, by watching videos and synchronizing the acquisition of multiple physiological electrical signals (Soleymani et al., 2011). Their findings suggest that multimodal data can improve the accuracy of emotion recognition. Second, other databases were created to explore altering stimulus materials to increase the intensity of emotional arousal (Koelstra et al., 2011; Carvalho et al., 2012; Aydemir, 2017; Raheel et al., 2021; Elkobaisi et al., 2022; Kadiri and Alku, 2022). Typically, some researchers created immersive multimedia content for the audiovisual elicitation paradigm alone. Finally, other researchers have designed new experimental paradigms (Zheng and Lu, 2015; Samson et al., 2016; Subramanian et al., 2016; Menezes et al., 2017; Miranda-Correa et al., 2018; Sharma et al., 2019; Siddiqui et al., 2022).
For example, researchers designed an experiment in which subjects watched videos while simultaneously assessing their emotions and annotating their sentiment in real-time using a joystick (Sharma et al., 2019). This study provides an open-source real-time emotion-annotation database. In general, most databases aim at experimental paradigm innovation. However, to our knowledge, no database has formally explored the effects of increasing negative emotion types on subjects’ emotion evocation.
EEG is a bio signal that offers not only safety and non-invasiveness (Hu et al., 2022) but also a high temporal resolution, allowing for the recording of brain electrical activity at millisecond rates (Hua et al., 2022). Due to its capability to capture neural electrical activity, EEG is highly valuable in comprehending human cognitive processes, attention, emotional responses (Li et al., 2020; Schlumpf et al., 2022). ECG is capable of providing crucial insights into the heart’s functioning (Shi et al., 2022). Features extracted from ECG signals can be utilized to analyze variations in heart rate resulting from emotional changes (Chen P. et al., 2022; Rabbani and Khan, 2022). EEG and ECG were selected.
The major contributions of this study can be summarized as follows: (1) A new multimodal dataset of emotions called the continuous upgrading multi-model affect elicitation (CUMULATE) database was developed to assess the effects of increasing negative emotion types on emotion recognition. As far as we know, no similar application dataset has been proposed to data. (2) A fundamental reason for the difficulty in achieving good performance for negative emotion recognition was systematically described. We introduced a bioinformatics volcano plot to depict the changes in each dimension of emotional traits with the increase types in negative emotions. (3) Our results provide suggestions to avoid the effects of unbalanced negative emotion materials on emotion recognition.
The rest of this paper is organized as follows: The second part describes the main methods used in this research, including experimental design, multi-model data recording, and the feature extraction process. The experimental results section presents the results of the emotion classification based on EEG and ECG. The main reasons for the decrease in classification accuracy with an increase in negative emotion types were also analyzed. In the discussion section, we discussed biological mechanisms and suggestions. Finally, we presented the conclusions of this study.
2. Experimental setup
2.1. Experimental scenarios
The main objective of this work was to explore the effect of adding stimuli with negative valence to the paradigm on the accuracy of emotion classification. The entire process of the CUMULATE dataset was shown in Figure 1A. For this purpose, three sessions were designed in the study. In session 1, there were video clips of three types of emotions: calmness, fear, and happiness. Sadness was added in session 2, and anger was further included in session 3. In each session, the participants watched varying numbers of movie clips, and EEG and ECG data were recorded synchronously. All subjects learned the experimental process and equipment safety and signed the informed consent form before the experiment. The experiment was approved by the Ethics Committee of Tianjin University (TJUE-2021-138).
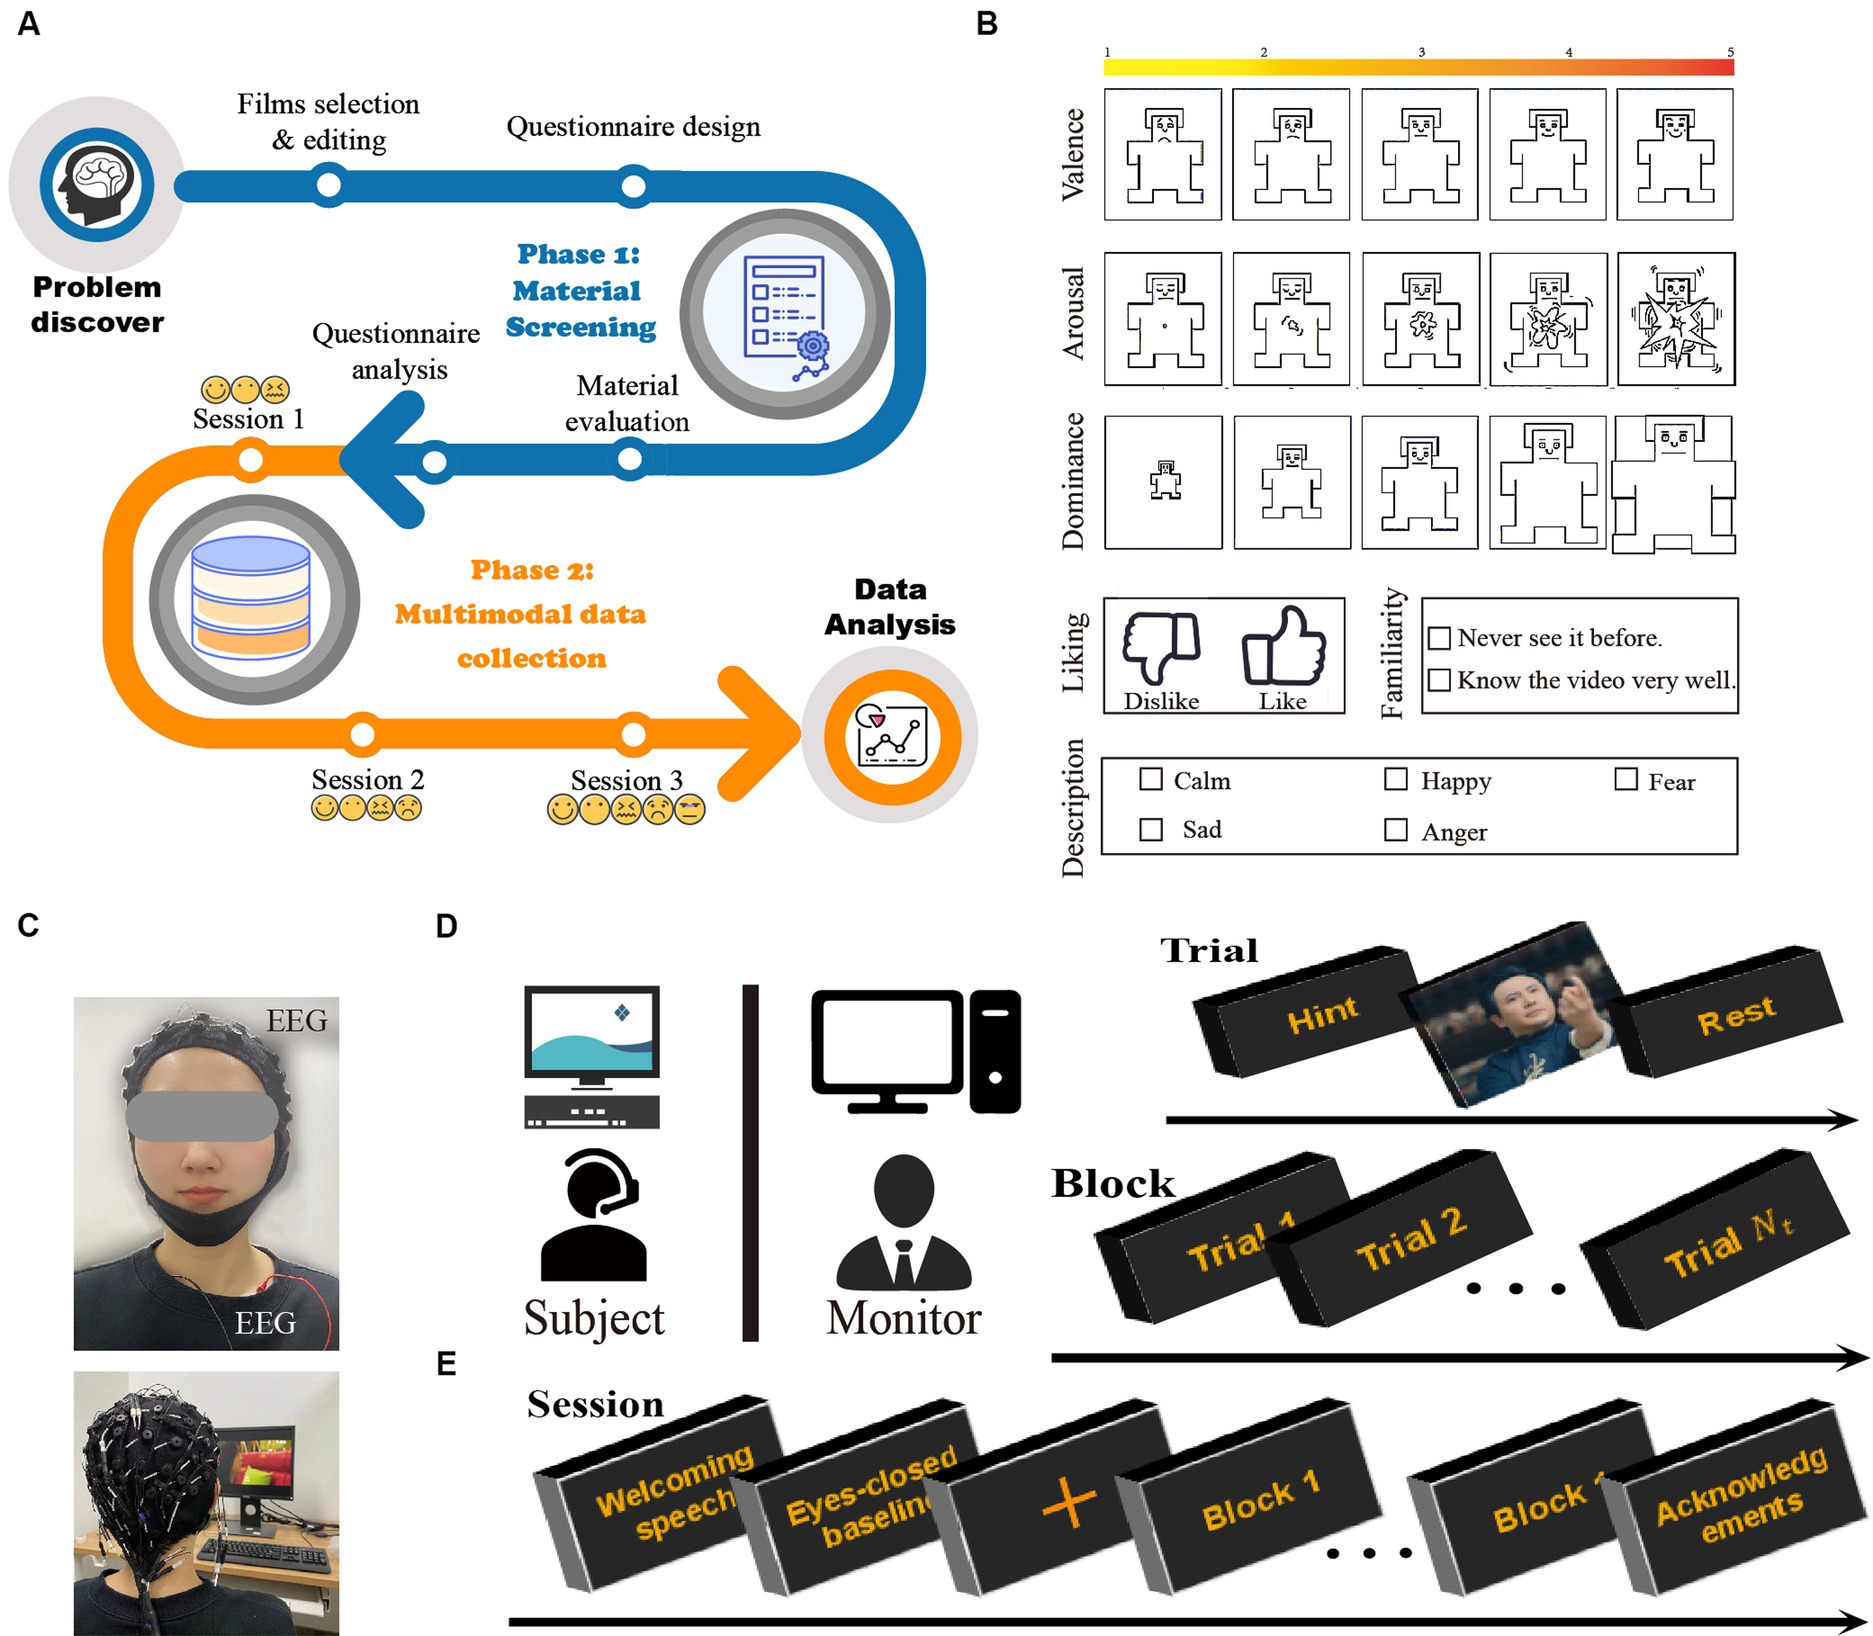
Figure 1. (A) Collection process of the dataset. CUMULATE study overview. (B) Images used for self-assessment. (C) Placement of physiological sensors. Sixty electrodes were used to record EEG and three for ECG. Experimental settings. (D) The experiments were performed in a separate laboratory environment. (E) Timeline for an experimental protocol.
2.2. Stimulus selection
Two phases were included in the selection of stimulating materials. In the first phase, seven members of our research group constructed an initial database of 129 movie clips. In this process, according to EMDB’s requirements (Carvalho et al., 2012), the following three criteria were referenced: (a) stability of video content; (b) persisting characters in the scene, except the neutral material; and (c) positive and negative emotions not being elicited as coexisting. Each clip was edited according to acting scene and the emotional content throughout its duration to ensure consistency. Based on the rating results, 29 video clips were selected. In the second phase, 27 annotators (y: 26.26 ± 3.30, 8 females) were invited to watch these 29 video clips. During each video, the participants self-rated their emotions according to a self-assessment questionnaire as displayed in Figure 1B.
Both dimensional and discrete emotion models (Eerola and Vuoskoski, 2011) were included in the questionnaire. The dimensional emotion model involved five dimensions rated on a five-point Likert scale: valence (1 indicates extremely unpleasant, 5 indicates extremely pleasant), arousal (1 indicates calm, 5 indicates exciting), dominance (1 indicates submissive, 5 indicates sense of control) (Lu et al., 2005), liking, and familiarity. This study investigated five emotions in a discrete emotion model: happiness, sadness, fear, anger, and calmness. At the end of the second phase, the emotion label (emotion/rage + word/description) was determined for each movie clip.
According to DECAF (Abadi et al., 2015), to better estimate general affective perception, the outliers found in each video clip were discarded (Real and Vargas, 1996). According to the annotators’ rating, video clips were divided into high- and low-score sets along the valence (V) or arousal (A) axes with a 3 threshold. Then, the Jaccard distances between each pair of annotators for the high- and low-score sets were computed to form a distance matrix , where 𝐻𝑖 is a binary vector denoting the high- or low-score of the i-th annotator’s rating and . denotes the number of equal elements in corresponding index between and . Finally, the median absolute deviation (MAD) was calculated as the standard deviation of D′ upper- or lower- triangular. If the standard deviation of the i-th row of D was over 1.5 times of MAD, the corresponding annotator was considered outliers. As shown in Figure 2A, two annotators in V dimension and one annotator in A dimension was removed as outliers, respectively.
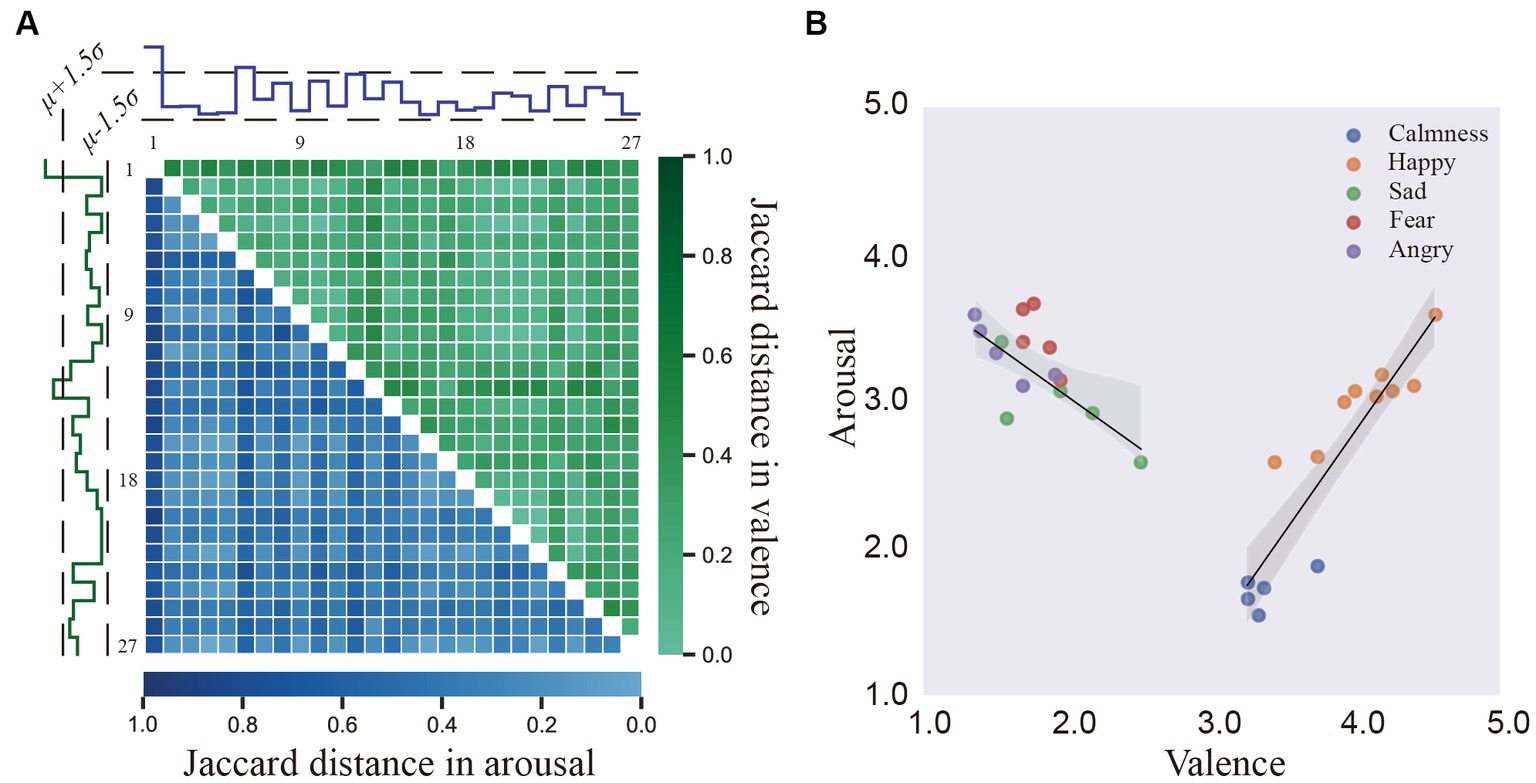
Figure 2. (A) The Jaccard distance between 27 annotators in valence and arousal. (B) The mean locations of the stimuli on the arousal–valence plane (AV plane).
2.3. Stimulus assessment
Figure 2B presents the distributions of V/A ratings provided by the remaining 24 (27–3) annotators for the video clips. Colored dots denote five emotions with different V/A values: calmness (high valence and low arousal; HVLA, blue), happiness (HVHA, orange), sadness (LVHA, green), fear (LVHA, red), and anger (LVHA, purple). A U-shaped curve was observed, similar to (Abadi et al., 2015), implying the difficulty of evoking low arousal but a strong valence response (Lang et al., 2005; Koelstra et al., 2011). A linear regression model was adopted to check whether the valence ratings of the video stimuli were associated with arousal ratings. In the entire set of video stimuli, the linear correlation between arousal and high valence rating was substantial (R2 = 0.8307, F value = 58.8808, p value <0.001, b = 1.4183) compared with the correlation between arousal and low valence ratings (R2 = 0.4998, F value = 12.9901, p value <0.005, b = −0.7082). The shadow in Figure 2B is a 95% confidence interval for this regression model.
Figure 3 presents the distribution of user ratings for the above-mentioned five discrete emotions in terms of arousal, valence, engagement, liking, and familiarity. Despite the inter-individual differences in scores, significant differences between the conditions in V/A scores reflected the successful elicitation of target emotional state (Koelstra et al., 2011).
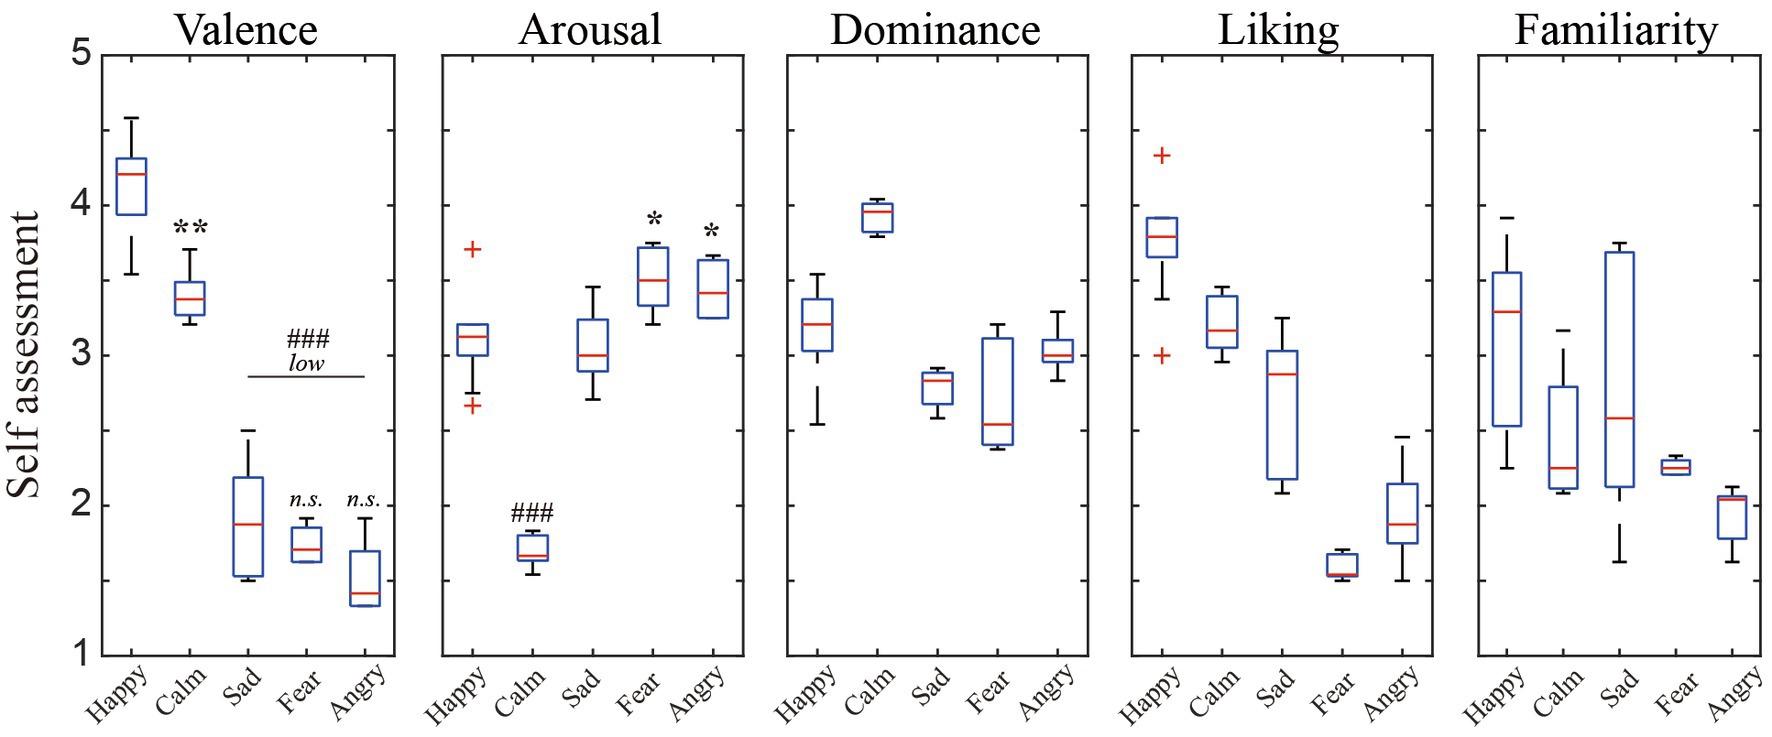
Figure 3. The distribution of the participants’ subjective ratings per scale for the five affects elicitation conditions.
The consistency of the V/A ratings among the annotators was evaluated using Krippendorff’s alpha metric, and they were found to be 0.69 and 0.30, respectively. This suggested that the annotators’ V/A scores for the mood and the arousal of the video clips were more consistent in our database than in ASCERTAIN with corresponding values of 0.58 and 0.12, respectively (Subramanian et al., 2016). Furthermore, as illustrated in Figure 4, Cohen’s Kappa test was adopted to explore the consistency of annotator pairs, and the results implied more consistent pairs in valence than in arousal. Overall, these measures showed that, while individual differences existed in the affective perception of video clips, there was substantial agreement among the assessments of each annotator, suggesting the effectiveness of the selected video clips for emotion elicitation.
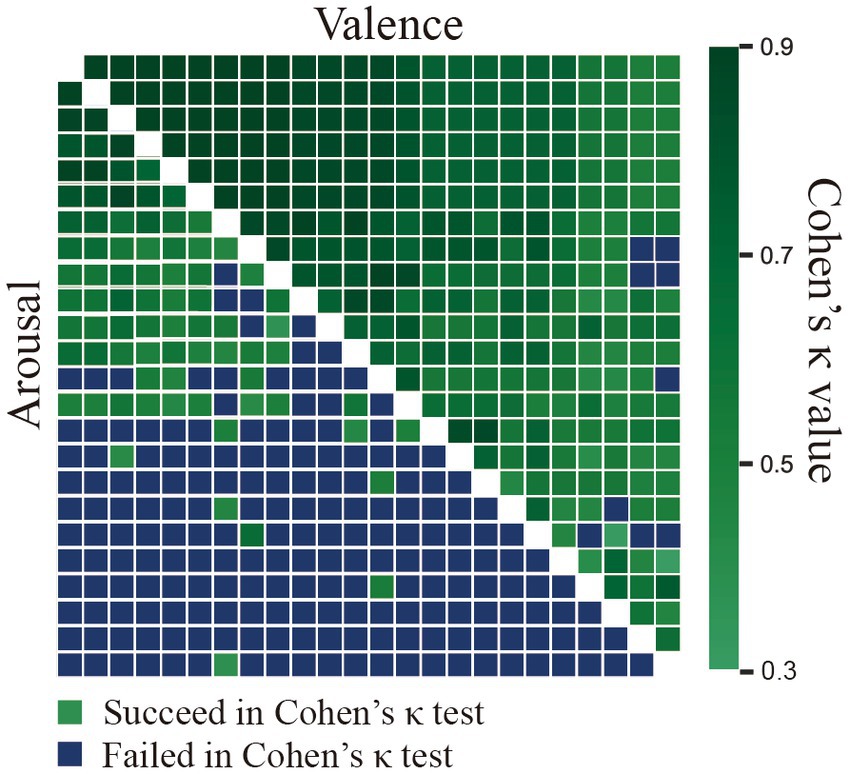
Figure 4. The agreement between the ground truth and the participant ratings using Cohen’s Kappa measure assumes that the ground-truth AV labels were provided by annotators.
2.4. Signal recording and synchronization
EEG was acquired using the NEUROSCAN acquisition system and a SynAmps RT 64-channel amplifier.1 Sixty electrodes were used to record EEG(FP1, FPZ, FP2, AF3, AF4, F7, F5, F3, F1, FZ, F2, F4, F6, F8, FT7, FC5, FC3, FC1, FCZ, FC2, FC4, FC6, FT8, T7, T5, C3, C1, CZ, C2, C4, T6, T8, TP7, CP5, CP3, CP1, CPZ, CP2, CP4, CP6, TP8, P7, P5, P3, P1, PZ, P2, P4, P6, P8, PO7, PO5, PO3, POZ, PO2, PO4, PO6, O1, OZ, O2). The ECG was acquired using BIOPAC MP150 acquisition system and ECG100C model.2 Three electrodes for ECG (RA, LA, LL). They were synchronized via a common parallel bus, with an accuracy of approximately 1 ms.
2.5. Experiment protocol
A total of 45 subjects (y: 26.20 ± 4.74, 10 females) participated in the experiment, with 15 subjects in each session. The experiments were conducted in an isolated laboratory under controlled light, as displayed in Figure 1D. Before the start of the experiment, the subjects were given verbal and written instructions regarding the experiment. After all the questions about the experiment were addressed and all issues were clarified, the subjects were asked to sign an informed consent form. Physiological sensors were then attached to the participants, who sat 60 cm (Wang et al., 2018) from a 15-inch screen (Hettich et al., 2016), as displayed in Figure 1C. The experimental process is illustrated in Figure 1E. Each trail contained progress and hints, video clips playing and emotional recovery. Before each video was played, the type of video determined from the statistical results of the user self-evaluation questionnaire was displayed promptly (Dutton and Aron, 1974; Satpute et al., 2016). The subjects controlled their progress independently by pressing the space button on each link. At the end of the experiment, if the subjects’ target emotions were not elicited or if the elicited emotions were insufficiently strong, the data were discarded.
3. Methods
3.1. EEG feature extraction
(1) Signal preprocessing: The raw EEG data were first processed with a bandpass filter between 0.3–50 Hz (Zheng and Lu, 2015), followed by a 50 Hz trap filter to remove powerline interference. Subsequently, EEG data were downsampled to a 200 Hz sampling rate from 1,000 Hz to reduce the computational complexity and improve the processing speed. To avoid interference from eye-movement artifacts and EMG signals, independent component analysis (ICA) of EEGLAB toolbox (Delorme and Makeig, 2004) was used. Finally, only EEG data from video viewing phase were selected for further processing, and the data from each channel were divided into non-overlapping 1-s samples (Zheng and Lu, 2015; Song et al., 2019) from which EEG features were extracted.
(2) Differential entropy: For EEG signals, differential entropy (DE) is a very effective feature, which is a generalized form of Shannon information entropy over continuous variables (Duan et al., 2013; Zheng and Lu, 2015). Assuming that x is a continuous random variable and is its probability density function, the differential entropy is calculated by the formula depicted in Eq. 1:
When random variable x ~ N (μ, σ2), Eq. 1 can be rewritten as Eq. 2:
3.2. ECG feature extraction
1. Signal preprocessing: Initially, the original ECG signal underwent band-pass filtering using a Butterworth band-pass filter, with a range of 0.4 to 10 Hz. This filtering process aimed to eliminate direct current noise, as well as high-frequency myoelectricity and other interferences. Subsequently, to simplify subsequent signal processing and enhance processing speed, the filtered signal was downsampled. The original sampling frequency of 1,000 Hz was reduced to 200 Hz. Finally, the corresponding video clip of the ECG signal was segmented, and the data from each channel was divided into 60-s segments with a 55-s overlap (Moeyersons et al., 2017; Benouis et al., 2021).
2. Heart rate variability (HRV) feature extraction: Among the various features extracted from the ECG signal, HRV is the most commonly used. It captures the variation in the duration of consecutive heartbeats, as determined by the adjacent R-R intervals. HRV encompasses time-domain, frequency-domain, and some nonlinear features. ECG feature extraction were using TEAP Toolbox (Soleymani et al., 2017). In the time domain, key HRV measures include the Standard Deviation of NN Intervals (SDNN), Root Mean Square Successive Differences of adjacent RR interval lengths (RMSSD), Differences of adjacent RR interval lengths (SDSD), the standard deviation of Successive Differences (SDSD), the number of adjacent RR interval lengths greater than 50 ms (NN50), and the ratio of NN50 to the total number of RR intervals (pNN50). Eqs 3–5 depict the formulas for calculating SDNN, RMSSD, and SDSD, respectively.
In the equations, N represents the total number of RR intervals, represents the length of the ith RR interval, and represents the average length of all RR intervals.
Additionally, the time-domain features encompass geometric characteristics derived from the RR histogram model. These include the HRV Triangular Index (TRI) and the Triangular Interpolation of NN Interval Histogram (TINN) width. The TRI denotes the ratio of the total number of RR intervals to the height of the RR histogram, while the TINN represents the base width of the triangle obtained when approximating the RR histogram with a triangle.
Frequency-domain features are then extracted, primarily including the power of Heart Rate Variability (HRV) in the Very Low Frequency (VLF) range (≤0.04 Hz), Low Frequency (LF) range (0.04–0.15 Hz), and High Frequency (HF) range (0.15–0.4 Hz). Additionally, these features consist of the LF/HF ratio, which represents the ratio of power between LF and HF, as well as the percentage of power contributed by LF and HF components.
Detrended Fluctuation Analysis (DFA) is a quantitative method for analyzing the fractal scaling properties of RR intervals. It is primarily used to measure the short-term and long-term correlations in RR interval sequences. It includes two features: the short-term scaling exponent alpha1 and the long-term scaling exponent alpha2. The calculation steps are as follows:
For a sequence first calculate its cumulative time series , as shown in Eq. 6:
where is the average of . Then the obtained time series is divided into equally spaced small segments, each of length , called scale indicators, when is small, called short-range scale, and when is large, called long-range scale. A linear trend is fitted to each small segment using the least squares method, and the trend is removed from to obtain the series after detrending as shown in Eq. 7:
Then the volatility function after detrending is shown in Eq. 8:
Finally, the least squares method is used to linearly fit to these scattered points, and a threshold is set for s. A straight line is fitted when s is less than the threshold, and the slope of the line is the short-range scalar index alpha1, and another straight line is fitted when s is greater than the threshold, and the slope of the line is the long-range scalar index alpha2.
The magnitude of the approximate entropy reflects the complexity of the signal, and the larger the value indicates the higher the complexity of the signal. The calculation steps are as follows: for the sequence , given the pattern dimension m, a set of m-dimensional vectors can be constructed, as shown in Eq. 9:
Set an approximate threshold value r. For any and , if the difference between corresponding elements in the two vectors is consistently smaller than r, we say that vectors and ,are approximately close under r. Then, for each , we calculate the ratio of the approximate vectors to the total number of vectors, denoted as , with the definition in Eq. 10:
Then the approximate entropy is shown in Eq. 11:
The calculation of approximate entropy involves two parameters, m and r. m is usually taken as 2 and r is usually taken as 0.1 to 0.25 times the variance of the signal.
So far, six time-domain indicators, six frequency-domain indicators and six nonlinear indicators of heart rate variability were extracted. ECG data were analyzed to HRV and heart rate (HR), so a total of 19 ECG features were extracted.
3.3. Classification protocol
A linear support vector machine (SVM) was used as a classifier (Chang and Lin, 2011). A block cross-validation method was used to evaluate the classification performance, with data from one block as the test set and others as the training set. This process was repeated five times to ensure that each block was used as the test set. Finally, cross-average classification accuracy was used to evaluate the classification performance.
3.4. Comparisons of evaluation results
The EEG in the continuous dimensional emotion model was analyzed by drawing volcano plots referring to (Kane et al., 2022; Mahendran and PM, 2022). Taking valence as an example, all sample features of each subject were first divided into positive and negative groups according to their valence scores. Next, the mean values of all samples with the same valence degree were calculated. Subsequently, a 300-dimensional positive value vector and a 300-dimensional negative value vector for a single subject were obtained. By repeating this process, 15 subjects could form a positive and a negative emotion matrix with a size of 15 × 300, respectively. Paired t-tests (Lillietest was conducted, t = 0, p<0.05) were used to measure the significance of differences between positive and negative emotions in each dimension. The 15 subjects’ average positive emotions and average negative emotions are indicated by the folded line with F. Obviously, F represents the upregulation multiplier of this feature, which was upregulated under a positive emotion rather than a negative emotion. In , this feature is upregulated under a positive rather than negative emotion, otherwise, these features were downregulated. Finally, the above results were plotted as volcano plots. Its X-axis is , and its Y-axis is . The same process was repeated for arousal dimension. Downregulated. Finally, the above results were plotted as volcano plots. Its X-axis is , and its Y-axis is . The same process was repeated for arousal. Dimension.
4. Results
4.1. Classification results
Figure 5 displays the classification accuracy of discrete emotions. The first row shows the density distributions of the accuracy for sessions 1, 2, and 3 from left to right. Overall, the average classification accuracy decreased as the number of negative emotion types increased. The classification accuracies were 73.50, 56.54, and 46.48% for EEG, and 58.85, 41.42, and 31.47% for ECG in sessions 1, 2, and 3, respectively. In the same session, the average classification accuracy of EEG was significantly higher than that of ECG. Considering the balance of positive and negative emotions, the same emotion types with session 1 were extracted from sessions 2 and 3 and further implemented in the classification experiments. The results are presented in the second row (EEG) and third row (ECG) of Figure 5 Separate comparison experiments passed the independent samples t-test, indicating that the presence of sadness and anger reduced the classification accuracy of happiness, fear, and calmness. Figure 6 depicts the confusion matrix for the discrete sentiment classification experiment. In the off-diagonal figures, we observe that the curves exhibit an upward trend. This suggests that increased from negative emotions increased the error rate of the classification experiments.
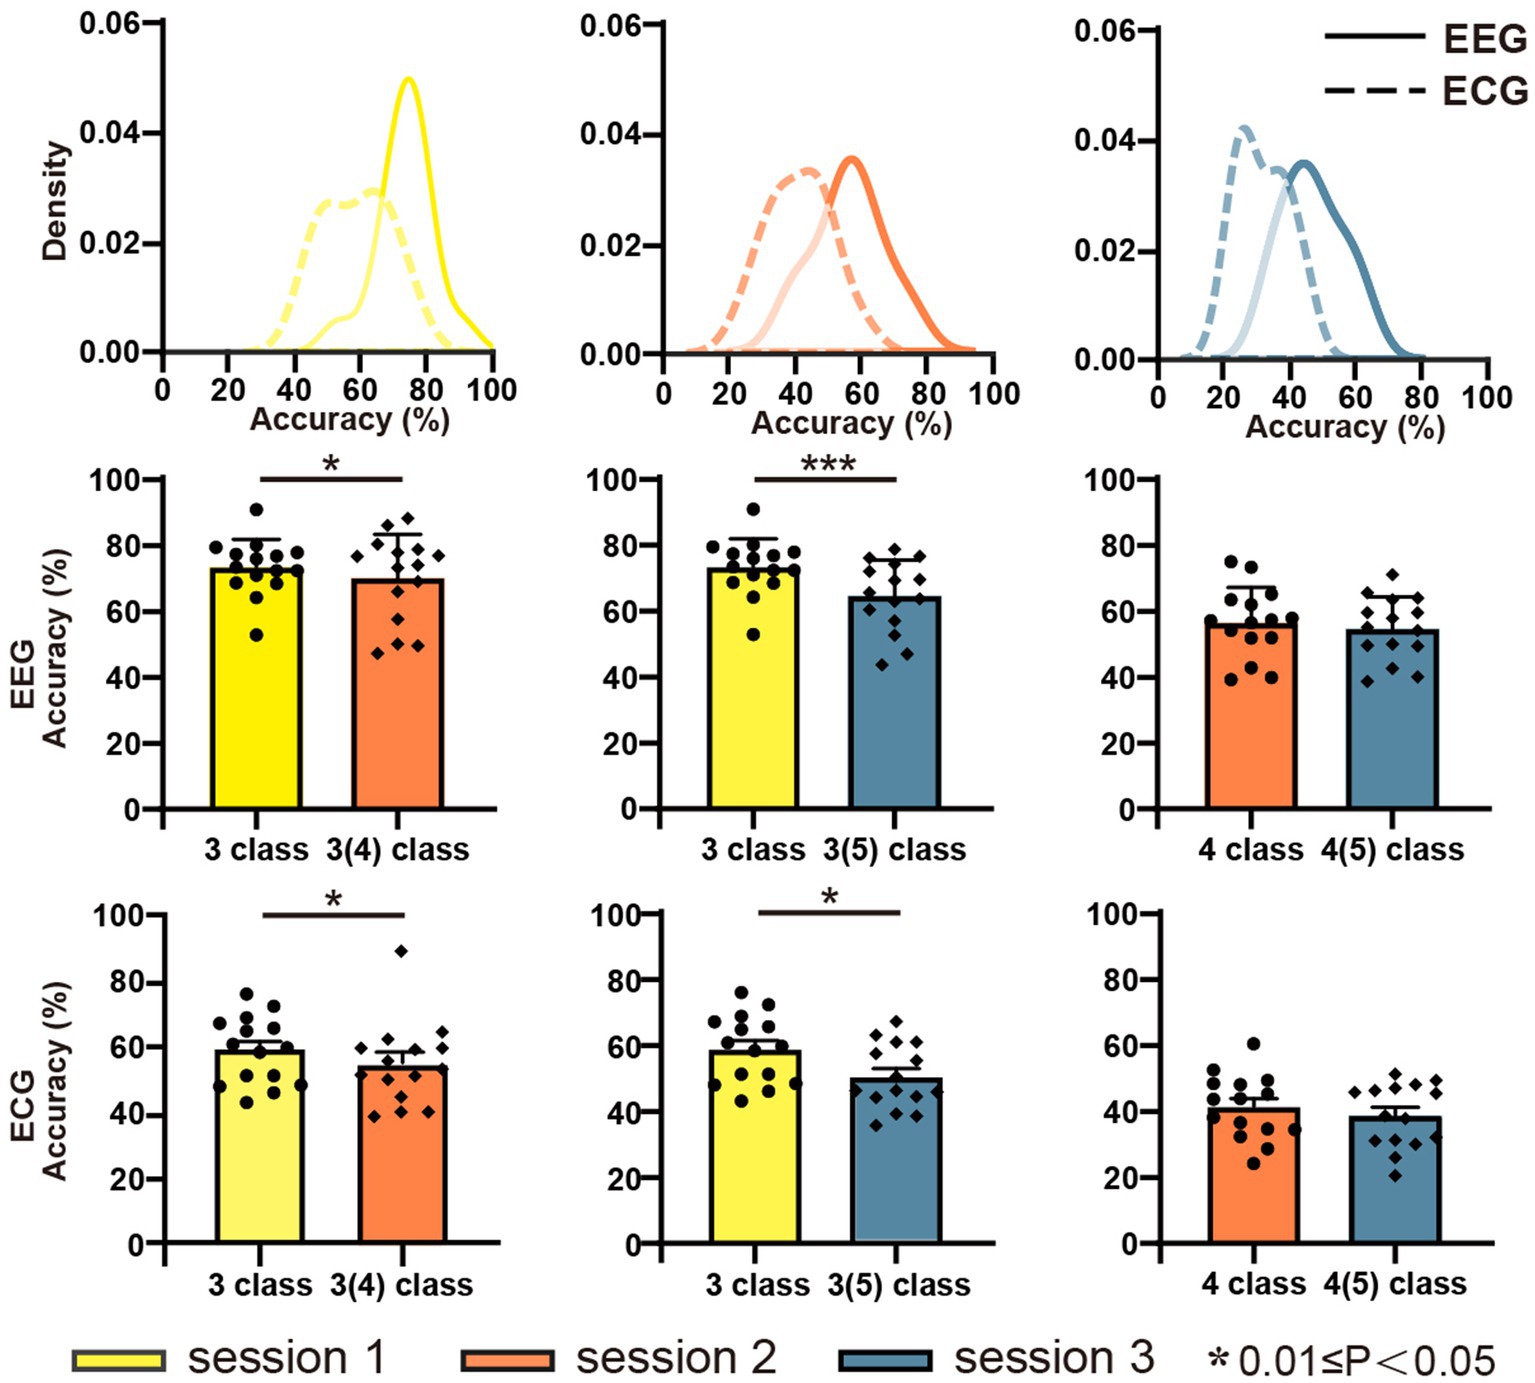
Figure 5. Accuracy of classification recognition of EEG and ECG signals.
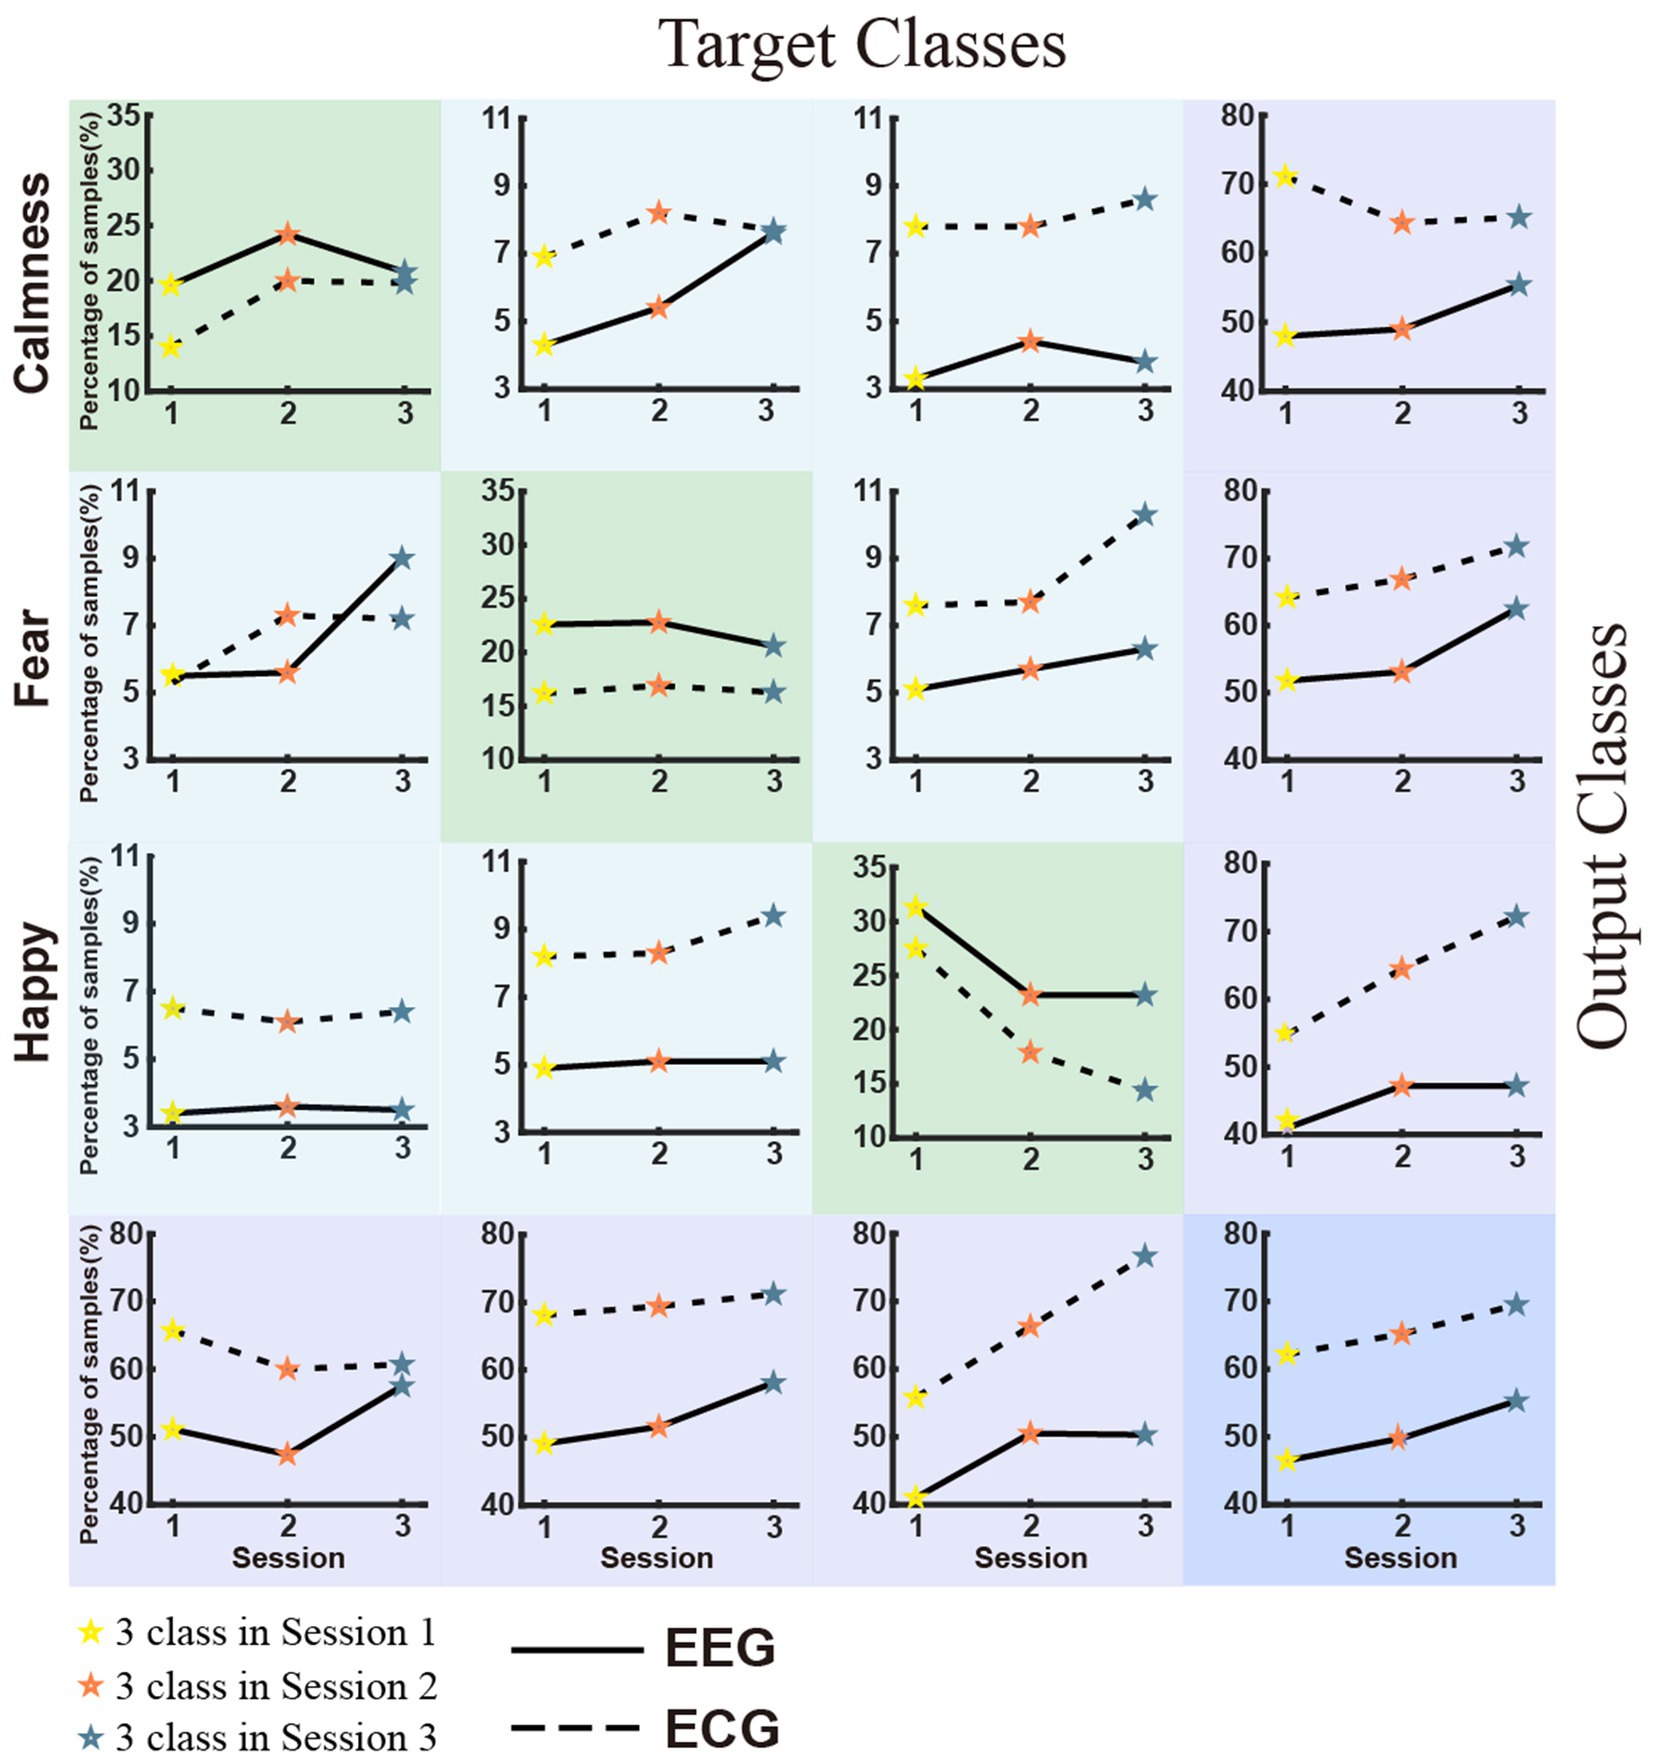
Figure 6. Confusion matrix of the discrete emotion classification experiment.
4.2. Cross-session analysis
To investigate the effect of increasing the stress of negative emotion, the DE features from five frequency bands (δ, θ, α, β, and γ) were plotted on volcano plots (Figure 7). In terms of valence, there were more points reaching the significant level (Kruskal-Wallis Test, p < 0.05) in the θ, α, and β frequency bands and most of them were upregulated, which suggested that these three bands were more critical for distinguishing the valence. In terms of arousal, there were more significant differences in the δ, θ, and β bands, where most points were also upregulated. With increased negative emotional stress, the points in Figure 7 tended to shrink to the original point (0, 0), meaning that the distinguishing ability of these features is vanishing. This trend was more obvious in the θ, α, and β frequency bands for valence and in the δ, θ, and β frequency bands for arousal.
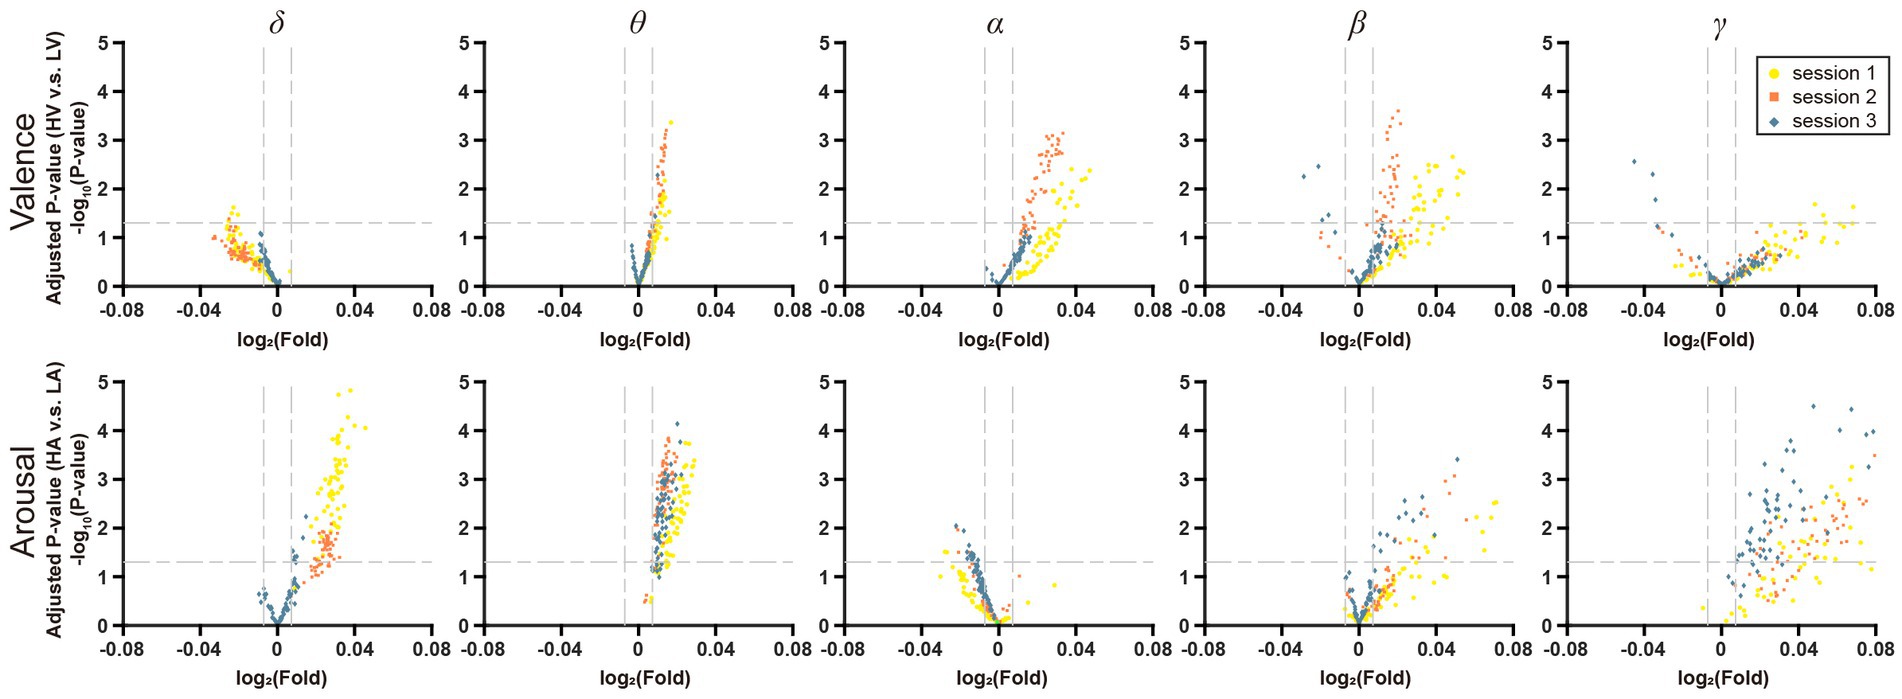
Figure 7. Volcano plot of EEG frequency bands features on VA dimension. The horizontal line in it represents the significant level α = 0.05, and the two vertical lines represent F = 201/200 and F = 200/201, respectively.
4.3. Within-session analysis
To reflect the sensitivity of DE features for valence and arousal in a single session, we mapped the upregulated and downregulated points into the brain map in red and blue, respectively, as shown in Figure 8.
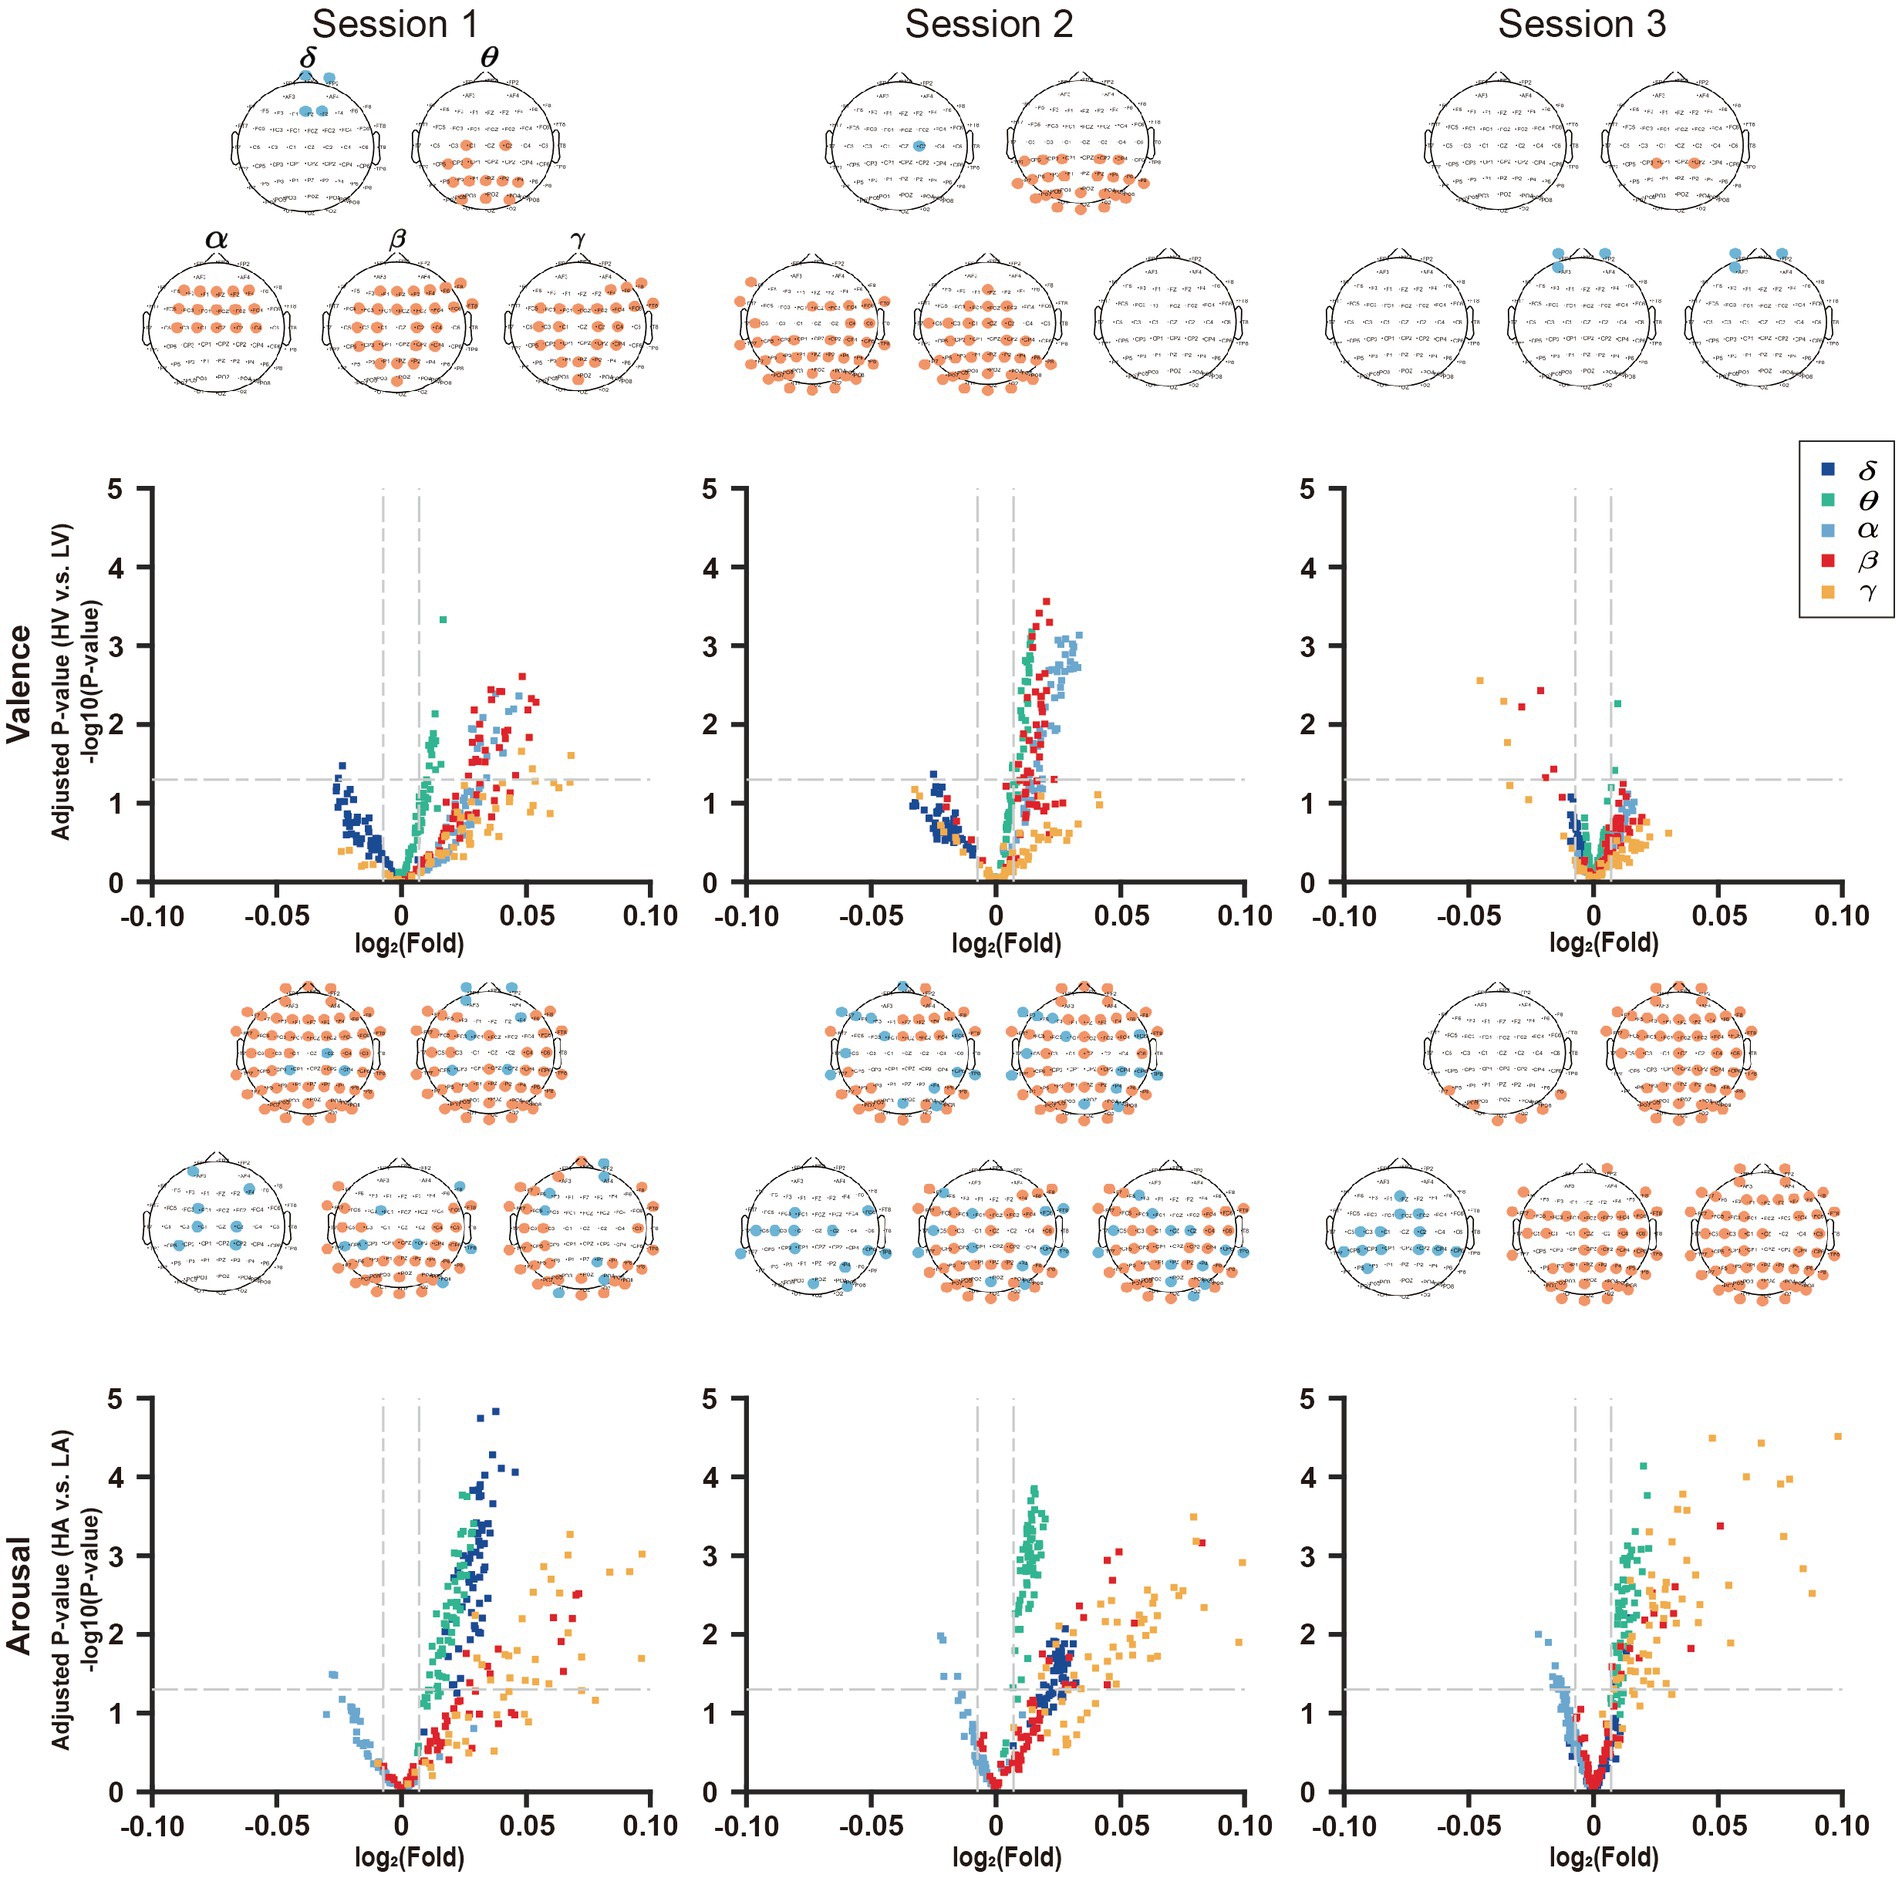
Figure 8. Joint analysis of EEG features in volcano plot and topographic map. In the volcano plots, the horizontal lines in it represents the significant level α = 0.05, and the two vertical lines represent F = 201/200 and F = 200/201, respectively.
In session 1, the number of features reaching the significant level (p < 0.05) in the valence volcano plot were fewer in δ-band than in other bands. Except for the δ-band where four EEG features are painted in blue, the features in other bands are all painted in red, and the number of feature points is more than that of the δ-band. This demonstrated that the other four frequency bands were more sensitive to the changes in valence. In the volcano plots of arousal, there were a certain number of feature points reaching the significant level (p < 0.05) in all frequency bands, and most of them were upregulated in the δ, θ, β, and γ bands.
On one hand, regarding the brain map of valence, the prefrontal lobe was downregulated in the δ band. The parietal lobe in the β frequency bands and occipital lobe in the α and θ frequency bands were upregulated to valence’s changes.
On the other hand, for the brain map of arousal, except that parietal lobe in the α band is downregulated, everywhere else of the whole brain is almost upregulated. There were similar results in session 2 and session 3.
In addition, the downregulated region of valence and the upregulated region of arousal in δ-band gradually shrank as the negative emotional stress increased. In contrast, for the arousal, the downregulated region in α-band, upregulated region in γ-band, and downregulated region in θ-band tended to expand from session 1 to session 3.
5. Discussion and conclusion
This study analyzed the cause and effect of increasing negative emotions on emotion classification during experimental emotion induction. Several studies have revealed low classification accuracy for negative emotion recognition. For example, in a study by Zhuang et al. negative emotions were identified with nearly 20% lower accuracy than positive and neutral emotions (Zheng et al., 2018; Zhuang et al., 2018). One possible reason was that negative emotions shared some commonalities (Zhuang et al., 2018). However, most of the negative stimulus video clips in the database differed significantly from each other’s dimensional models (at least one dimension) concerning the self-assessment questionnaire. Therefore, we proposed that the difficulty in classifying negative emotions lay not just in the similarity between negative emotions. This coincided with our previous conclusion. Further analysis supported our idea. When negative emotions increased, the physiological activities (EEG and ECG) evoked by the same stimulus material were more similar in characteristics, which made emotion recognition more difficult.
In this study, the volcano plot was introduced to illustrate the DE difference along valence and arousal in different sessions and frequency bands. The vertical axis of the volcano plot indicates value of p of one index between two sets of experiment which in our research represent emotional levels (high/low). The horizontal axis of the volcano plot shows the ratio of one index between two sets of experiment. Larger inter-group variations would skew the sample toward the extreme left and right sides of the volcano map. To the best of our knowledge, this is the first application of the volcano plot in the field of emotion recognition. Generally, volcanic plots are used for transcriptome studies as well as genome, proteome, metabolome and other statistical data because they are suitable for showing comparisons between two groups of samples (Edwards et al., 2015; Topper et al., 2017). Obviously, volcano plots provide an effective means for visualizing the direction, magnitude, and significance of changes in samples. Volcano plots like the one shown in our experiment are useful when there are many of observations with a wide range of differences, both positive and negative. Our results show that the volcano plot can efficiently represent the differences of hundreds of DE features (multi-band and multi-channel EEG) induced by several types of emotional materials, which could be worth to popularizing in the field of emotion recognition.
Human emotional states are complex and constantly changing, and there may be similarities and overlaps between different emotional states (Tekoppele et al., 2023). Facing the challenges presented by the indistinct boundaries among negative emotions, firstly we can try to build emotion models with stronger emotion characterization ability to more accurately describe and differentiate different emotional states. Secondly, we can develop more high-quality multimodal databases, such as multimodal physiological signals of text, speech, facial expression, EEG, ECG, respiration. The third approach is to enhance data processing methods, such as adjusting the time window of the EEG signal samples (Shin et al., 2018; Zheng et al., 2018).
Moreover, we believe that imbalanced negative emotional material in the stimulus paradigm can lead to a bias in emotion recognition and affect the accuracy of emotion classification. Considering that this conclusion is true for both EEG and ECG signals, we consider this conclusion to be cross-modal stability. However, the study still has some restrictions. For example, it is unclear whether changing the order of emotional stimulation videos or increasing the types of positive emotion videos will help increase their effect on the excessive negative emotions toward the subjects. Moreover, while more negative emotional stimuli brought more negative emotional experiences for the participants, there was still a lack of a quantitative assessment of the painful experience of watching many negative emotional videos. In addition, the interpersonal response index (IRI) can be considered an indicator to quantify a subject’s painful experience (Lang et al., 2005). Therefore, we plan to introduce more positive emotional stimulus samples in the following study to balance the pain of negative emotional experiences.
Data availability statement
The original contributions presented in the study are included in the article/supplementary material, further inquiries can be directed to the corresponding author.
Ethics statement
The studies involving humans were approved by Ethics Committee of Tianjin University (TJUE-2021-138). The studies were conducted in accordance with the local legislation and institutional requirements. The participants provided their written informed consent to participate in this study.
Author contributions
ZGL, LX, and EWY designed the research study. XMW and SKZ performed the research. SKZ and YY provided help and advice on the experimental paradigm design. XMW and YP analyzed the data. All authors contributed to editorial changes in the manuscript. All authors read and approved the final manuscript. All authors have participated sufficiently in the work and agreed to be accountable for all aspects of the work.
Funding
This work was supported in part by the National Natural Science Foundation of China under Grant 62076250, Grant 61703407, and Grant 61901505.
Conflict of interest
The authors declare that the research was conducted in the absence of any commercial or financial relationships that could be construed as a potential conflict of interest.
Publisher’s note
All claims expressed in this article are solely those of the authors and do not necessarily represent those of their affiliated organizations, or those of the publisher, the editors and the reviewers. Any product that may be evaluated in this article, or claim that may be made by its manufacturer, is not guaranteed or endorsed by the publisher.
Footnotes
References
Abadi, M. K., Subramanian, R., Kia, S. M., Avesani, P., Patras, I., and Sebe, N. (2015). DECAF: MEG-based multimodal database for decoding affective physiological responses. IEEE Trans. Affect. Comput. 6, 209–222. doi: 10.1109/TAFFC.2015.2392932
Arya, R., Singh, J., and Kumar, A. (2021). A survey of multidisciplinary domains contributing to affective computing. Comput. Sci. Rev. 40:100399. doi: 10.1016/j.cosrev.2021.100399
Aydemir, O. (2017). Olfactory recognition based on EEG gamma-band activity. Neural Comput. 29, 1667–1680. doi: 10.1162/NECO_a_00966
Benouis, M., Mostefai, L., Costen, N., and Regouid, M. (2021). ECG based biometric identification using one-dimensional local difference pattern. Biomed. Signal Process. Control 64:102226. doi: 10.1016/j.bspc.2020.102226
Calvo, R. A., Brown, I., and Scheding, S. (2009). “Effect of experimental factors on the recognition of affective mental states through physiological measures” in AI 2009: Advances in artificial intelligence: 22nd Australasian joint conference Eds. A. Nicholson and X. Li. (Melbourne, Australia, December 1-4, 2009, Proceedings 22: Springer), 62–70.
Carvalho, S., Leite, J., Galdo-Álvarez, S., and Gonçalves, Ó. F. (2012). The emotional movie database (EMDB): a self-report and psychophysiological study. Appl. Psychophysiol. Biofeedback 37, 279–294. doi: 10.1007/s10484-012-9201-6
Chang, C.-C., and Lin, C.-J. (2011). LIBSVM: a library for support vector machines. ACM Trans. Intell. Syst. Technol. 2, 1–27. doi: 10.1145/1961189.1961199
Chen, J., Ro, T., and Zhu, Z. (2022). Emotion recognition with audio, video, EEG, and EMG: a dataset and baseline approaches. IEEE Access 10, 13229–13242. doi: 10.1109/ACCESS.2022.3146729
Chen, P., Zou, B., Belkacem, A. N., Lyu, X., Zhao, X., Yi, W., et al. (2022). An improved multi-input deep convolutional neural network for automatic emotion recognition. Front. Neurosci. 16:965871. doi: 10.3389/fnins.2022.965871
Delorme, A., and Makeig, S. (2004). EEGLAB: an open source toolbox for analysis of single-trial EEG dynamics including independent component analysis. J. Neurosci. Methods 134, 9–21. doi: 10.1016/j.jneumeth.2003.10.009
Dheeraj, K., and Ramakrishnudu, T. (2021). Negative emotions detection on online mental-health related patients texts using the deep learning with MHA-BCNN model. Expert Syst. Appl. 182:115265. doi: 10.1016/j.eswa.2021.115265
Duan, R. N., Zhu, J. Y., and Lu, B. L. (2013). “Differential entropy feature for EEG-based emotion classification” in 2013 6th international IEEE/EMBS conference on neural engineering (NER). San Diego, CA, USA: IEEE. 81–84. doi: 10.1109/NER.2013.6695876
Dutton, D. G., and Aron, A. P. (1974). Some evidence for heightened sexual attraction under conditions of high anxiety. J. Pers. Soc. Psychol. 30, 510–517. doi: 10.1037/h0037031
Edwards, J., Johnson, C., Santos-Medellín, C., Lurie, E., Podishetty, N. K., Bhatnagar, S., et al. (2015). Structure, variation, and assembly of the root-associated microbiomes of rice. Proc. Natl. Acad. Sci. 112, E911–E920. doi: 10.1073/pnas.1414592112
Eerola, T., and Vuoskoski, J. K. (2011). A comparison of the discrete and dimensional models of emotion in music. Psychol. Music 39, 18–49. doi: 10.1177/0305735610362821
Elkobaisi, M. R., Al Machot, F., and Mayr, H. C. (2022). Human emotion: a survey focusing on languages, ontologies, datasets, and systems. SN Comput. Sci. 3, 1–31. doi: 10.1007/s42979-022-01116-x
Feradov, F. N., and Ganchev, T. D. (2019). “Spectral features of EEG signals for the automated recognition of negative emotional states” in 2019 IEEE XXVIII international scientific conference electronics (ET), Sozopol, Bulgaria: IEEE. 1–4. doi: 10.1109/ET.2019.8878557
Gordon, A. M., and Mendes, W. B. (2021). A large-scale study of stress, emotions, and blood pressure in daily life using a digital platform. Proc. Natl. Acad. Sci. 118:e2105573118. doi: 10.1073/pnas.2105573118
Gouizi, K., Maaoui, C., and Reguig, F. B. (2014). “Negative emotion detection using EMG signal” in 2014 international conference on control, decision and information technologies. Eds. I. Kacem, P. Laroche, and Z. Roka. (CoDIT: IEEE), 690–695.
Hettich, D. T., Bolinger, E., Matuz, T., Birbaumer, N., Rosenstiel, W., and Spüler, M. (2016). EEG responses to auditory stimuli for automatic affect recognition. Front. Neurosci. 10:244. doi: 10.3389/fnins.2016.00244
Hu, M., Chen, J., Jiang, S., Ji, W., Mei, S., Chen, L., et al. (2022). E2SGAN: EEG-to-SEEG translation with generative adversarial networks. Front. Neurosci. 16:971829. doi: 10.3389/fnins.2022.971829
Hua, J., Wolff, A., Zhang, J., Yao, L., Zang, Y., Luo, J., et al. (2022). Alpha and theta peak frequency track on-and off-thoughts. Commun. Biol. 5:209. doi: 10.1038/s42003-022-03146-w
Kadiri, S. R., and Alku, P. (2022). Subjective evaluation of basic emotions from audio–visual data. Sensors 22:4931. doi: 10.3390/s22134931
Kane, O., McCoy, A., Jada, R., Borisov, V., Zag, L., Zag, A., et al. (2022). Characterization of spontaneous seizures and EEG abnormalities in a mouse model of the human A350V IQSEC2 mutation and identification of a possible target for precision medicine based therapy. Epilepsy Res. 182:106907. doi: 10.1016/j.eplepsyres.2022.106907
Katsigiannis, S., and Ramzan, N. (2017). DREAMER: a database for emotion recognition through EEG and ECG signals from wireless low-cost off-the-shelf devices. IEEE J. Biomed. Health Inform. 22, 98–107. doi: 10.1109/JBHI.2017.2688239
Kim, J., and André, E. (2008). Emotion recognition based on physiological changes in music listening. IEEE Trans. Pattern Anal. Mach. Intell. 30, 2067–2083. doi: 10.1109/TPAMI.2008.26
Koelstra, S., Muhl, C., Soleymani, M., Lee, J.-S., Yazdani, A., Ebrahimi, T., et al. (2011). Deap: a database for emotion analysis; using physiological signals. IEEE Trans. Affect. Comput. 3, 18–31. doi: 10.1109/T-AFFC.2011.15
Lang, P. J., Bradley, M. M., and Cuthbert, B. N. (2005). “International affective picture system (IAPS): affective ratings of pictures and instruction manual” Technical Report A-8. in NIMH, Center for the Study of Emotion & Attention. (Gainesville, FL: University of Florida).
Lee, J., and Yoo, S. K. (2020). Recognition of negative emotion using long short-term memory with bio-signal feature compression. Sensors 20:573. doi: 10.3390/s20020573
Leelaarporn, P., Wachiraphan, P., Kaewlee, T., Udsa, T., Chaisaen, R., Choksatchawathi, T., et al. (2021). Sensor-driven achieving of smart living: a review. IEEE Sensors J. 21, 10369–10391. doi: 10.1109/JSEN.2021.3059304
Li, X., Zhao, Z., Song, D., Zhang, Y., Pan, J., Wu, L., et al. (2020). Latent factor decoding of multi-channel EEG for emotion recognition through autoencoder-like neural networks. Front. Neurosci. 14:87. doi: 10.3389/fnins.2020.00087
Lu, B., Hui, M. A., and Yu-Xia, H. (2005). The development of native Chinese affective picture system—a pretest in 46 college students. Chin. Ment. Health J. 19, 719–722. Available at: http://zxws.cbpt.cnki.net/WKD/WebPublication/paperDigest.aspx?paperID=6bea0a0d-a072-4f21-896e-69fb103571e7.
Mahendran, N., and PM, D. R. V. (2022). A deep learning framework with an embedded-based feature selection approach for the early detection of the Alzheimer's disease. Comput. Biol. Med. 141:105056. doi: 10.1016/j.compbiomed.2021.105056
Menezes, M. L. R., Samara, A., Galway, L., Sant ‘Anna, A., Verikas, A., Alonso-Fernandez, F., et al. (2017). Towards emotion recognition for virtual environments: an evaluation of eeg features on benchmark dataset. Pers. Ubiquit. Comput. 21, 1003–1013. doi: 10.1007/s00779-017-1072-7
Miranda-Correa, J. A., Abadi, M. K., Sebe, N., and Patras, I. (2018). Amigos: a dataset for affect, personality and mood research on individuals and groups. IEEE Trans. Affect. Comput. 12, 479–493. doi: 10.1109/TAFFC.2018.2884461
Moeyersons, J., Varon, C., Testelmans, D., Buyse, B., and Van Huffel, S. (2017). “ECG artefact detection using ensemble decision trees” in 2017 computing in cardiology (CinC). Rennes, France: IEEE. 1–4. doi: 10.22489/CinC.2017.240-159
Rabbani, S., and Khan, N. (2022). Contrastive self-supervised learning for stress detection from ecg data. Bioengineering 9:374. doi: 10.3390/bioengineering9080374
Raheel, A., Majid, M., and Anwar, S. M. (2021). Dear-mulsemedia: dataset for emotion analysis and recognition in response to multiple sensorial media. Inf. Fusion 65, 37–49. doi: 10.1016/j.inffus.2020.08.007
Real, R., and Vargas, J. M. (1996). The probabilistic basis of Jaccard's index of similarity. Syst. Biol. 45, 380–385. doi: 10.1093/sysbio/45.3.380
Samson, A. C., Kreibig, S. D., Soderstrom, B., Wade, A. A., and Gross, J. J. (2016). Eliciting positive, negative and mixed emotional states: a film library for affective scientists. Cognit. Emot. 30, 827–856. doi: 10.1080/02699931.2015.1031089
Satpute, A. B., Nook, E. C., Narayanan, S., Shu, J., Weber, J., and Ochsner, K. N. (2016). Emotions in “black and white” or shades of gray? How we think about emotion shapes our perception and neural representation of emotion. Psychol. Sci. 27, 1428–1442. doi: 10.1177/0956797616661555
Schlumpf, Y. R., Nijenhuis, E. R., Klein, C., Jäncke, L., and Bachmann, S. (2022). Functional connectivity changes in the delta frequency band following trauma treatment in complex trauma and dissociative disorder patients. Front. Psych. 13:889560. doi: 10.3389/fpsyt.2022.889560
Sharma, K., Castellini, C., van den Broek, E. L., Albu-Schaeffer, A., and Schwenker, F. (2019). A dataset of continuous affect annotations and physiological signals for emotion analysis. Sci. Data 6, 1–13. doi: 10.1038/s41597-019-0209-0
Shi, J., Wang, F., Qin, M., Chen, A., Liu, W., He, J., et al. (2022). New ECG compression method for portable ECG monitoring system merged with binary convolutional auto-encoder and residual error compensation. Biosensors 12:524. doi: 10.3390/bios12070524
Shin, J., Von Lühmann, A., Kim, D.-W., Mehnert, J., Hwang, H.-J., and Müller, K.-R. (2018). Simultaneous acquisition of EEG and NIRS during cognitive tasks for an open access dataset. Sci. Data 5, 1–16. doi: 10.1038/sdata.2018.3
Siddiqui, M. F. H., Dhakal, P., Yang, X., and Javaid, A. Y. (2022). A survey on databases for multimodal emotion recognition and an introduction to the VIRI (visible and InfraRed image) database. Multimodal Technol. Interact. 6:47. doi: 10.3390/mti6060047
Soleymani, M., Lichtenauer, J., Pun, T., and Pantic, M. (2011). A multimodal database for affect recognition and implicit tagging. IEEE Trans. Affect. Comput. 3, 42–55. doi: 10.1109/T-AFFC.2011.25
Soleymani, M., Villaro-Dixon, F., Pun, T., and Chanel, G. (2017). Toolbox for emotional feAture extraction from physiological signals (TEAP). Front. ICT 4:1. doi: 10.3389/fict.2017.00001
Song, T., Zheng, W., Lu, C., Zong, Y., Zhang, X., and Cui, Z. (2019). MPED: a multi-modal physiological emotion database for discrete emotion recognition. IEEE Access 7, 12177–12191. doi: 10.1109/ACCESS.2019.2891579
Subramanian, R., Wache, J., Abadi, M. K., Vieriu, R. L., Winkler, S., and Sebe, N. (2016). ASCERTAIN: emotion and personality recognition using commercial sensors. IEEE Trans. Affect. Comput. 9, 147–160. doi: 10.1109/TAFFC.2016.2625250
Tao, J., and Tieniu, T. (2005). Affective computing: a review. Affective computing and intelligent interaction. LNCS 3784:995. doi: 10.1007/11573548_125
Tekoppele, J. L., De Hooge, I. E., and van Trijp, H. C. (2023). We've got a situation here!–how situation-perception dimensions and appraisal dimensions of emotion overlap. Personal. Individ. Differ. 200:111878. doi: 10.1016/j.paid.2022.111878
Terhürne, P., Schwartz, B., Baur, T., Schiller, D., Eberhardt, S. T., André, E., et al. (2022). Validation and application of the non-verbal behavior analyzer: an automated tool to assess non-verbal emotional expressions in psychotherapy. Front. Psych. 13:1026015. doi: 10.3389/fpsyt.2022.1026015
Topper, M. J., Vaz, M., Chiappinelli, K. B., Shields, C. E. D., Niknafs, N., Yen, R.-W. C., et al. (2017). Epigenetic therapy ties MYC depletion to reversing immune evasion and treating lung cancer. Cells 171, 1284–1300.e21. e1221. doi: 10.1016/j.cell.2017.10.022
Vaskinn, A., Lagerberg, T. V., Bjella, T. D., Simonsen, C., Andreassen, O. A., Ueland, T., et al. (2017). Impairment in emotion perception from body movements in individuals with bipolar I and bipolar II disorder is associated with functional capacity. Int. J. Bipolar Disord. 5, 1–9. doi: 10.1186/s40345-017-0083-7
Vaudable, C., and Devillers, L. (2012). “Negative emotions detection as an indicator of dialogs quality in call centers” in 2012 IEEE international conference on acoustics, speech and signal processing (ICASSP). Kyoto, Japan: IEEE. 5109–5112. doi: 10.1109/ICASSP.2012.6289070
Wang, S., Mamelak, A. N., Adolphs, R., and Rutishauser, U. (2018). Encoding of target detection during visual search by single neurons in the human brain. Curr. Biol. 28:2058-2069. e2054. doi: 10.1016/j.cub.2018.04.092
Wang, F., Wu, S., Zhang, W., Xu, Z., Zhang, Y., Wu, C., et al. (2020). Emotion recognition with convolutional neural network and EEG-based EFDMs. Neuropsychologia 146:107506. doi: 10.1016/j.neuropsychologia.2020.107506
Woodard, K., Zettersten, M., and Pollak, S. D. (2022). The representation of emotion knowledge across development. Child Dev. 93, e237–e250. doi: 10.1111/cdev.13716
Wu, M., Chen, Y., Shen, Z., Zhu, Y., Xiao, S., Zhu, X., et al. (2022). Electroacupuncture alleviates anxiety-like behaviors induced by chronic neuropathic pain via regulating different dopamine receptors of the basolateral amygdala. Mol. Neurobiol. 59, 5299–5311. doi: 10.1007/s12035-022-02911-6
Yu, Z., Shen, Y., Shi, J., Zhao, H., Torr, P. H., and Zhao, G. (2022). “PhysFormer: facial video-based physiological measurement with temporal difference transformer” in Proceedings of the IEEE/CVF conference on computer vision and pattern recognition, 4186–4196.
Zheng, W.-L., Liu, W., Lu, Y., Lu, B.-L., and Cichocki, A. (2018). Emotionmeter: a multimodal framework for recognizing human emotions. IEEE Trans. Cybern. 49, 1110–1122. doi: 10.1109/TCYB.2018.2797176
Zheng, W.-L., and Lu, B.-L. (2015). Investigating critical frequency bands and channels for EEG-based emotion recognition with deep neural networks. IEEE Trans. Auton. Ment. Dev. 7, 162–175. doi: 10.1109/TAMD.2015.2431497
Zheng, W.-L., Zhu, J.-Y., and Lu, B.-L. (2017). Identifying stable patterns over time for emotion recognition from EEG. IEEE Trans. Affect. Comput. 10, 417–429. doi: 10.1109/TAFFC.2017.2712143
Keywords: affective computing, emotion recognition, EEG, ECG, experimental protocol designing, negative emotion
Citation: Wang X, Zhao S, Pei Y, Luo Z, Xie L, Yan Y and Yin E (2023) The increasing instance of negative emotion reduce the performance of emotion recognition. Front. Hum. Neurosci. 17:1180533. doi: 10.3389/fnhum.2023.1180533
Edited by:
Elias Ebrahimzadeh, University of Tehran, IranReviewed by:
Chao Chen, Tianjin University of Technology, ChinaJane Zhen Liang, Shenzhen University, China
Xiaogang Chen, Chinese Academy of Medical Sciences and Peking Union Medical College, China
Yangsong Zhang, Southwest University of Science and Technology, China
Copyright © 2023 Wang, Zhao, Pei, Luo, Xie, Yan and Yin. This is an open-access article distributed under the terms of the Creative Commons Attribution License (CC BY). The use, distribution or reproduction in other forums is permitted, provided the original author(s) and the copyright owner(s) are credited and that the original publication in this journal is cited, in accordance with accepted academic practice. No use, distribution or reproduction is permitted which does not comply with these terms.
*Correspondence: Ye Yan, eXlfdGFpaWNAMTYzLmNvbQ==
†These authors have contributed equally to this work