


- 1Department of Biological Sciences, University of Southern California, Los Angeles, CA, USA
- 2Laboratory of Neuro Imaging, Department of Neurology, School of Medicine, University of California, Los Angeles, CA, USA
Many different independently published neuroanatomical parcellation schemes (brain maps, nomenclatures, or atlases) can exist for a particular species, although one scheme (a standard scheme) is typically chosen for mapping neuroanatomical data in a particular study. This is problematic for building connection matrices (connectomes) because the terms used to name structures in different parcellation schemes differ widely and interrelationships are seldom defined. Therefore, data sets cannot be compared across studies that have been mapped on different neuroanatomical atlases without a reliable translation method. Because resliceable 3D brain models for relating systematically and topographically different parcellation schemes are still in the first phases of development, it is necessary to rely on qualitative comparisons between regions and tracts that are either inserted directly by neuroanatomists or trained annotators, or are extracted or inferred by collators from the available literature. To address these challenges, we developed a publicly available neuroinformatics system, the Brain Architecture Knowledge Management System (BAMS; http://brancusi.usc.edu/bkms). The structure and functionality of BAMS is briefly reviewed here, as an exemplar for constructing interrelated connectomes at different levels of the mammalian central nervous system organization. Next, the latest version of BAMS rat macroconnectome is presented because it is significantly more populated with the number of inserted connectivity reports exceeding a benchmark value (50,000), and because it is based on a different classification scheme. Finally, we discuss a general methodology and strategy for producing global connection matrices, starting with rigorous mapping of data, then inserting and annotating it, and ending with online generation of large-scale connection matrices.
Introduction
The “connectome” concept was introduced by Sporns and his colleagues (Sporns et al., 2005). Initially it referred to the global matrix of macroconnections (i.e., axonal connections between gray matter regions seen as black box nodes; for its complete definition see BAMS Foundational Model of Connectivity Thesaurus, http://brancusi1.usc.edu/thesaurus/definition/connectome/; Swanson and Bota, 2010) for the human brain. The concept has since been refined and today has at least three specific meanings that are applied to the nervous system as a whole, not just the brain (Swanson and Bota, 2010; Akil et al., 2011). Besides the macroconnectome between gray matter regions, which includes functional magnetic resonance imaging (fMRI) and diffusion tensor imaging (DTI) results, there is the global mesoconnectome, which is a matrix of all axonal connections between all neuron types; and there is the global microconnectome, which is a matrix of all axonal connections between all individual neurons in a particular animal or person (Swanson and Bota, 2010).
The level of abstraction of a connectome is variable, and it depends on the number of experimental variables and metadata (expressivity), associated with connectivity reports in a database. The most abstract levels are those used to construct macroconnection wiring diagrams and square matrices of gray matter regions that show qualitative connection strengths in different visual formats (Stephan et al., 2000b; Bota and Swanson, 2007a; Bohland et al., 2009; Swanson and Bota, 2010). However, they can be enhanced with other information like the spatial characteristics of injection and labeling sites, axon branching patterns, and routes taken by the axons through associated white matter tracts (Swanson and Bota, 2010).
One other factor is critical. Connection matrix construction requires the use of a single, internally consistent nomenclature for gray matter regions (macroconnectome), neuron types (mesoconnectome), and individual neurons (microconnectome). Thus, it is necessary to define relationships within and between the sets of gray matter regions and neuron types defined in different neuroanatomical and neuron nomenclatures, respectively, and individual neurons. The ultimate global connectome would thus consist of an integrated macroconnectome, mesoconnectome, and microconnectome based on an integrated nomenclature for all of them (see Figure 1 in Bota and Swanson, 2007b).
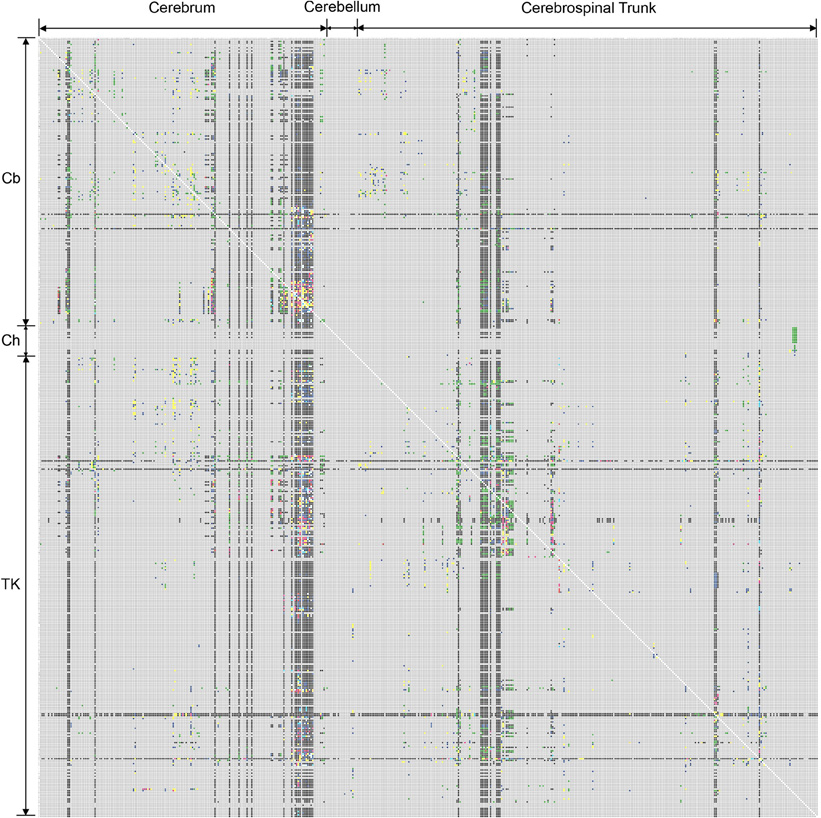
Figure 1. First version of the rat CNS macroconnectome, defined in the Swanson-1998 nomenclature and constructed from data in BAMS [Bota and Swanson (2007a); Bohland et al. (2009)]. The color code used to produce both macroconnectome versions is as follows: gray—absent information; black—evidence that connection is absent; green—evidence that connection exists, without any explicit qualitative strength; red—very strong connection; pink—strong connection; yellow-to-red—medium-to-strong connection; yellow—medium or moderate connection; blue—weak or sparse connection; light blue—very weak (sparse) connection; or axons-of-passage. See Text for details.
The Brain Architecture Knowledge Management System (BAMS; http://brancusi.usc.edu/bkms; http://brancusi1.usc.edu) was designed to handle neuroanatomical information across multiple levels of vertebrate nervous system organization. It includes five interrelated Modules that store and process data about: (1) molecules expressed in different gray matter regions or neurons, (2) neuron types and classes, (3) gray matter regions, (4) relations between gray matter regions defined in different parcellation schemes, and (5) about connections between gray matter regions or neuron types defined in different nomenclatures and species. BAMS also includes inference engines relating gray matter regions defined in different parcellation schemes—neuron populations defined by different authors. Its backend database and inference engines currently allow construction of macroconnectomes from manually and semi-automatically inserted data, with several levels of abstraction—from simple gray matter region wiring diagrams and 2D connectomes in different graphical formats to more detailed tabular representations of connections, augmented with spatial details that include injection and labeling sites, specific zones within regions (layers and other features), and white matter tract information (Bota et al., 2003, 2005; Bota and Swanson, 2007b).
We consider here three BAMS Modules, Connections, Relations, and Cells from the perspective of macroconnectome construction and relationships with mesoconnectomes, as well as the BAMS inference engine for online translation of connection reports across different nomenclatures (Bota and Swanson, 2010). The Connections and Relations Modules have been used to construct user-defined connectivity matrices and diagrams (Bota et al., 2003), as well as rat macroconnectomes since the work reported in Bota and Swanson (2007a). In this paper we present the newest version of the rat BAMS macroconnectome, which was created by using the inference engine for translation of connections reports. We also discuss the steps that have to be taken to ensure correct translation of connection reports collated from the literature. Finally, we discuss the most important challenges related to connectome construction within BAMS and argue for a collaborative and coordinated effort of the neuroinformatics community.
BAMS—Mesoconnectome
To reiterate: a global mesoconnectome is defined as the complete set of axonal connections between all neuron types in the nervous system of a particular species (Swanson and Bota, 2010). Depending on which methods and classification criteria are chosen, different authors may name the same or overlapping neuron sets (types or classes) differently. Therefore, one prerequisite for constructing mesoconnectomes is the construction of a single, internally consistent classification system for neuron types in a particular species. A second prerequisite is a systematic account of relationships between classification schemes used by different authors (Bota and Swanson, 2007b).
The Cell Module of BAMS was designed specifically to handle neuron sets (types) reports collated from the literature, as well as criteria for hierarchical classification specified by different authors. Each “is_a” relationship that relates a class to its instances is associated with a complex representation of criteria and subcriteria that are used in the literature.
BAMS also includes an inference engine that relates neuron types and classes defined in different neuron nomenclatures (Bota and Swanson, 2007b). The relations that are established across neuron populations defined or described by different authors are both qualitatively spatial (i.e., topological; Egenhofer and Franzosa, 1991), and in terms of common structural attributes. For example, two neuron sets (classes, or types) are considered identical whenever they share a common space and they have the same attributes as stated by authors, or inferred by collators.
To simplify the “knowledge maps” that can be extracted from the inserted relationships (Bota and Swanson, 2007b), we use a set of semantic relations that take into account the general spatial relations that can be defined between two neuron populations, and their compared attributes: “synonym,” “includes,” “partial correspondence,” and “different.” The details of reducing the qualitative spatial relations to a set of semantic relations, and examples of how a “knowledge map” can be constructed from the information inserted in BAMS, are discussed in Bota and Swanson (2007b). Because the sources of axonal inputs and the targets of axonal outputs for a specific neuron type or class are explicitly recorded in BAMS as classification attributes, they can be inferred using the relationships between neuron populations that include hodological criteria (i.e., the set of inputs and targets) in their definitions or descriptions. An inference engine that uses information about axonal inputs and targets for automatic classification of neurons was already implemented in BAMS. This engine automatically establishes the level of a specific neuron population within BAMS' classification scheme as well as the hierarchy of criteria, solely based on the inputs and targets, and their nature (gray matter regions or white matter tracts). Examples of such inferences are shown and discussed in detail in Bota and Swanson (2007b).
Finally, the backend structures of the Cell and Connections Modules are interrelated such that one or more connection reports about gray matter regions can be associated with the axonal connections of one or more neuron types (Bota et al., 2005). To summarize, axonal connections between neuron types or between neuron types and gray matter regions are encoded in BAMS in two different ways: first as components of macroconnections, and second as criteria for definition of neuron types and classes.
BAMS—Macroconnectome
The BAMS Connections Module allows insertion of data and metadata at the level of macroconnections. The Entity-Relationship (ER) structure of this Module allows insertion of more than 40 qualitative, semi-quantitative, and quantitative attributes associated with a neuroanatomical connection report, as collated from the literature (Bota et al., 2005). The large number of attributes associated with any connection report (i.e., high expressivity) of the BAMS Connections Module allows reconstruction of connection patterns between distinct gray matter regions, including connection patterns between sets of neuron types identified in different gray matter regions.
It also allows association of macroconnection (as well as mesoconnection) reports with major white matter tracts. Thus, the Module can be used to reconstruct tracts in terms of contributions from one or more gray matter regions (or neuron types as described above; for details and examples see Bota et al., 2005). This BAMS feature becomes increasingly important in the context of global efforts intended to create 2D and 3D connectome maps (Hjornevik et al., 2007; Hawrylycz et al., 2011). Each connectivity report can be associated in BAMS with Atlas Levels (the serially numbered 2D maps in a brain atlas) and stereotaxic coordinates where the stain was reported. Finally, each major white matter tract of a given mammalian species can be associated with a set of neuroanatomical connections, and thus can be reconstructed in terms of the input and output regions. These three features of the BAMS Connections module allow it to be used as a backend data provider for reconstruction of CNS roadmaps by future visualization tools.
The high expressivity of the backend structure of BAMS's Connections module is necessary but not sufficient for the complete and correct insertion of connectivity data, and in the end for creating a macroconnectome using connections mapped on neuroanatomical nomenclatures (atlases) other than the standard nomenclature. The construction of any macroconnectome depends on the choice of a standard nomenclature, and it is always ideal to map new data directly onto the standard nomenclature. It also depends on the completeness and correctness of inserted data by the collators or experts.
Connectivity reports mapped on different parcellation schemes either have to be remapped by collators and curators, or the system can translate topologically the injection and labeled sites. The first option, manual remapping, does not preserve the integrity of original reports, and must be performed whenever a new nomenclature (e.g., atlas) is encountered. To preserve the original integrity of connectivity reports as collated from the associated references, remapping must become as independent as possible from the nomenclature in use. And to avoid unnecessary duplication of reports (e.g., one in the original nomenclature and the second mapped and inserted by the human expert), we employed a second option, automatic translation of connectivity data across nomenclatures.
Since standard, high-resolution, resliceable 3D computer graphics frames of reference for the rat brain and nervous system are still in the first phases of construction and testing (Hjornevik et al., 2007; Hawrylycz et al., 2011), connectome construction has to rely on a qualitative translation engine across different parcellation schemes. For this, we have constructed a special Module in BAMS, Relations, that allows encoding of qualitative spatial relations between nervous system parts defined in different neuroanatomical nomenclatures (e.g., atlases) in specific species. This Module also includes a large set of metadata associated with the actual process of mapping nervous system parts, performed or inserted by collators (Bota and Swanson, 2010). After the qualitative spatial relations between gray matter regions of two neuroanatomical nomenclatures defined in the same species have been inserted in BAMS, connections reports associated with either of the nomenclatures can be translated to the related one. This translation is the result of the Connections Translations inference engine implemented in BAMS. Full description of this engine and examples of translations are provided in Bota and Swanson.
Besides the problem of choosing a nomenclature for mapping the results of pathway tracing experiments to help establish connections (projections), the second challenge is the process of data entry itself. Any connectivity database can be populated from data collated from the literature, or it can be directly inserted by neuroanatomists, or both. The database design of the Connections module and its associated interfaces allow both ways of data insertion (Bota et al., 2005). BAMS is used by neuroanatomists to insert their experimental data, and manipulate in different ways the connectivity information. However, the connectivity data inserted in BAMS is mainly collated from the published literature. The collation procedure is manual and each report inserted in the system is supported by a textual annotation from the associated reference, or by collator's interpretations.
Finally, the BAMS Connections module is associated with a set of publicly accessible interfaces that allow construction of user-customized connections matrices. The web interface of BAMS's Connections module also includes inference engines that construct networks of gray matter regions, defined in specific neuroanatomical nomenclatures (Bota et al., 2003, 2005).
The Rat Macroconnectome
The first version of the rat macroconnectome was constructed from ipsilateral connectivity reports inserted in BAMS (Bota and Swanson, 2007a; Bohland et al., 2009) and used the Swanson-1998 (Swanson, 1998) nomenclature and classification hierarchy. It covered 9.4% of the entire matrix, which has 486 × 486 cells—with each cell representing a gray matter region at the bottom of the region classification hierarchy. The number of cells that are filled with any other color than gray (no data) is 22,178 (Figure 1).
Because the number of connection reports inserted in BAMS exceeded an internal benchmark value (50,000), we reconstructed the rat BAMS macroconnectome using the Swanson-2004 parcellation scheme (Swanson, 2004). The connection reports used in this new macroconnectome were originally mapped onto different nomenclatures recorded in BAMS; for example, Swanson (1998), Fulwiler and Saper (1984), and Moga et al. (1989). The translation of connections into the Swanson-2004 nomenclature was semi-automatic, first using the Connections Translations inference engine described above, and then using results validation by human agents when the relationships between Swanson-2004 nomenclature and the original nomenclature yielded equivocal results.
The increase in reports collated in BAMS's Connections module from the previous connectome version (Bota and Swanson, 2007a; Bohland et al., 2009) is 28.20%, from about 39,000 reports to the present value of 52,458. The present version of the rat BAMS connectome (Figure 2) is a matrix of 503 × 503 cells with 11.2% coverage (i.e., cells filled with any color but gray—no data). One percent coverage of the connectome matrix shown in Figure 2 corresponds to about five completely filled columns or rows. This connectivity data increase was collated and curated from 15 newly inserted research papers collated from 2009. In addition, the results of pathway tracing experiments from more than 20 references were re-mapped, completed, or corrected.
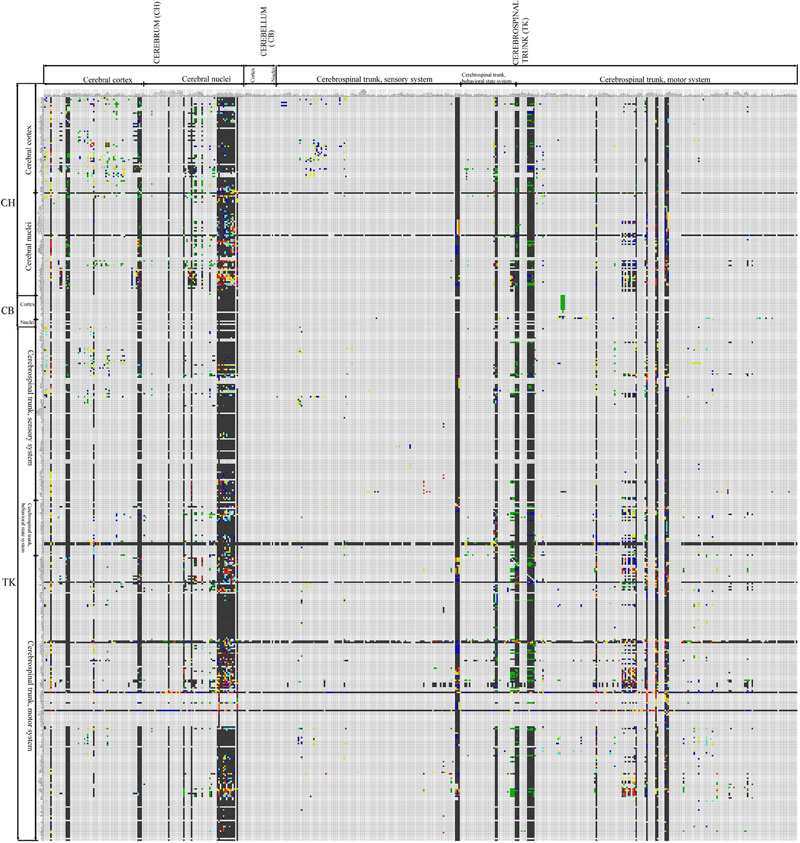
Figure 2. Second version of the rat CNS macroconnectome, defined in the Swanson-2004 nomenclature and constructed from data in BAMS. The color code is identical to that used in the first version. The number of filled cells in this new rat connectome is 27,796, which represents more than 25% increase in connection data used to construct the matrix, from the 22,178 labeled cells (Figure 1; Bota and Swanson, 2007a) in the first version of the rat connectome.
There are two notable differences between the Swanson-1998 and Swanson-2004 connectomes shown in Figures 1 and 2, respectively. First, the Swanson-2004 macroconnection matrix is slightly larger than the Swanson-1998 macroconnection matrix, mostly because several gray matter regions were remapped and more finely parceled in Swanson-2004, especially the lateral hypothalamic area (LHA). However, the number of bed nuclei of the stria terminalis (BST) regions is reduced, three of them defined in Swanson-1998 nomenclature (BSTad, BSTav, BSTdl) being grouped in a single gray matter region, BSTam, in the Swanson-2004 parcellation scheme (Swanson, 2004).
The second and more important difference is the internal organization of the Swanson-1998 and Swanson-2004 nomenclatures. The main criterion for internal organization of the Swanson-2004 rat nomenclature is functional network organization (see Table B in Swanson, 2003, 2004), whereas that of Swanson-1998 is based more on strict topographical relationships. As a result, connections of the same gray matter regions will be displayed in different columns and rows of the matrix, and under different higher-order subdivisions of the rat nervous system. The advantages of using the rat Swanson-2004 nomenclature over Swanson-1998 is thus three fold: (1) several gray matter regions are refined, (2) the nomenclature is constructed on more criteria, and (3) the nomenclature is applied consistently across the rat CNS. Hence, the internal consistency of the newest Swanson nomenclature is strengthened. Finally, the new hierarchical organization of Swanson-2004 nomenclature better integrates the structure-function relationships of rat CNS gray matter regions.
Because coverage in the newest version of the rat BAMS connectome reached a landmark value and the gray matter regions that send or receive at least one connection are not concentrated in a single CNS subdivision, we analyzed the results shown in Figure 2. The number of connections shown to be absent (black squares) is 22,064, about 80% (79.38%) of the total. The number of regions with data about a connection to at least one other gray matter region is 317, which means that 62% of the regions in the BAMS rat connectome are associated with at least one output connection. Regions with highest numbers of inputs are in the cerebral cortex (prelimbic and infralimbic areas), cerebral nuclei (several BST nuclei), and hypothalamus (LHA regions).
The highest output connection ratio (i.e., the ratio, matrix cells in a column with data indicating an output: total number of cells in a column) shown by any gray matter region in Figure 2 is 34%, and the highest ratio for a cerebral cortical area is 18%. In a second, more stringent and informative, step of this preliminary CNS-wide analysis we took into account only those gray matter regions with a complete set of ipsilateral outputs registered in BAMS (shown as entire filled columns in Figure 2). We thus determined the output connection ratio for 44 gray matter regions that include select parts of the cerebral cortex (including the subiculum), amygdalar region, lateral septal nucleus, and hypothalamus—and all parts of the BST. The output connection ratios for this subset of 44 gray matter regions range from 2% (for lateral septal nucleus subdivisions) to 34% (for LHA regions). In other words, the number of ipsilateral terminal field targets for this subset of gray matter regions ranges from 8 to 150. The average output connection ratio for this subset is 10%, which means that on average each member of the subset has about 40–50 ipsilateral gray matter region targets, out of a total of about 500 possible targets.
The average output connection ratio for the entire set of rat CNS gray matter regions may be significantly less than 10%, however, because the analyzed subset is heavily biased toward gray matter regions with very complex output patterns.
A similar situation was found for data about input connection ratios of the gray matter regions shown in Figure 2. Some 406 (81.2%) gray matter regions from the total of 503 have data about the reception of at least one axonal input. From data available in BAMS so far, regions that receive the most axonal inputs are mostly located in the cerebral nuclei and hypothalamus.
The connectivity data used for constructing the second BAMS rat macroconnectome is available to the neuroscience community in interactive graphical format in the newest version of BAMS: http://brancusi1.usc.edu/connections. Users can construct it online and export the data in XML or JSON formats, or as a flat image. A second XML version of the macroconnectome that includes the BAMS unique ID's of brain regions is provided in the classic version of BAMS: http://brancusi.usc.edu/bkms/brain/choose-connection.php. This additional XML version is useful for third party systems that would use the numerical ID's to bring additional gray matter region data and metadata from BAMS. Thus, the new rat macroconnectome, or parts of it, can be linked to, replicated, analyzed, or enhanced by members of the neuroscience community.
Discussion
Connectome construction at all scales (micro-, meso-, or macro-) is important for analyzing and understanding global nervous system wiring diagrams, which in turn may help generate new hypotheses and design the experiments to test them. The most abstract and simplest form of a neuroinformatics-driven connectome is a 2D matrix that shows the presence or absence of connections between gray matter regions (a macroconnectome). Obviously, such connectomes can be refined by adding more information about spatial attributes like the route taken by a connection through various white matter tracts, and specific zones (differentiations) within a particular gray matter region. In the following we discuss two of the most important challenges we addressed in macroconnectome construction within BAMS: nomenclatures and data collation or annotation.
Nomenclatures
The construction of macroconnectomes, even in their simplest and most abstract form, needs to follow a set of rules. First, any macroconnectome must be associated minimally with an internally consistent nomenclature of gray matter regions that can be either based on published parcellation schemes, or can be constructed de novo by an expert or group of experts. For macroconnectomes, internal consistency of the chosen nomenclature is the necessary prerequisite ensuring that the gray matter regions used for matrix construction are distinct and do not overlap. In addition, nomenclature must cover the entire part of the nervous system under consideration and should be species specific. The nomenclatures proposed for nervous system parts in different mammalian species by different authors may or not be hierarchically organized. Any nomenclature that is also hierarchically organized according to specific sets of structural or functional criteria allows construction of connectomes that are more informative than those arranged simply alphabetically. Thus, the arrangement and size of any connectome in the graphical format of a 2D matrix depends on the nomenclature and internal classification schemes used.
Second, a macroconnectome based on data collated from the literature is the abstract form of results from many pathway tracing experiments mapped using a variety of non-identical methods and nomenclatures. The translation of connections mapped on parcellation schemes different from the connectome's standard nomenclature may be performed automatically, but the results must be verified and validated by human experts. Results produced by inference engines may be incomplete, or even contradictory, and human experts are necessary for checking them and resolving discrepancies.
Data Collation
There are at least three aspects of connectivity data collation that influence the construction and usefulness of connectomes: level of detail, completeness, and correctness of inserted data. The level of detail associated with inserted data depends on the complexity of the computer-readable representation, and on how the results are presented in the literature. The simplest form of a connectivity report is “region X connects to Y,” with no other details. Connectomes based on such information provide only a superficial view of CNS connectivity patterns in the species of interest, and they will be not as informative as those constructed from reports that include, for example, qualitative assessments and/or quantitative data about connections. Thus, the richer the connection reports, the more informative the connectomes.
The high degree of abstraction in macroconnectomes that are organized in the format of a 2D matrix allows the construction of relatively simple wiring diagrams. More realistic and functionally relevant wiring diagrams need more structural and functional attributes associated with individual connections. This can be approached by relating each cell of a connectome matrix with the relevant data and metadata, as collated from the literature or inserted by experts. However, the detail level in connectivity reports collated from the literature is constrained by the mode of data presentation within them. Because a standard for presenting pathway tracing results in published references is not yet available, published connectivity data are organized in different ways by different authors. Usually, an original research article includes images of representative experimental material and more or less detailed descriptions of neuroanatomical connections. Thus, without the original results of the published pathway tracing experiments, the collation of connectivity data is best accomplished when displayed on a series of Atlas Level maps or images. Whenever possible, we collate the connectivity data from each Atlas Level presented in a published reference, and combine this information with the textual description provided by authors. This approach is necessary for qualitatively capturing the topographical details of terminal fields, and the axonal pathways and their routes. It is also useful for any neuroinformatic system that aims to reconstruct macroconnections in visual format (Tallis et al., 2011).
Regardless of the general procedure used to populate a database with pathway tracing information—either collation of the published literature or direct insertion by neuroanatomists—the process is manual and thus time consuming. Ideally, the process of connectivity data insertion should be performed in parallel with the mapping and annotation of pathway tracing experiments performed by neuroanatomists. However, this is not yet possible in an organized and large-scale way, so that collation and curation of the published literature is currently one of the most widely used methods for populating knowledge management systems. Examples of such systems include NeuroScholar (Burns, 2001), CoCoMac (Stephan et al., 2000b), BAMS (Bota et al., 2005; Bota and Swanson, 2010), and Temporal Lobe database (van Strien et al., 2009). The comprehensive collation and curation of connectivity data from published literature is also important from an historical perspective, for establishing novelty (by priority analysis) of current research results, and for future comparisons.
While the macroconnectomes of selected gray matter regions or subsytems in few mammalian species may be complete or nearly complete, it is difficult to assess the present degree of coverage for the complete macroconnectome of any particular species. We report here a coverage of about 11% for the rat CNS macroconnectome in matrix format. However, the expressiveness (in terms of attributes and associated metadata) of a neuroinformatics system is proportional to the time spent on curation and data entry. Minimally, all connectivity reports inserted in a neuroinformatics system should include information about species, standard nomenclature, methods used, and details about injection and labeled sites. Pathway tracing experiments rely on many different methods, each with unique advantages and limitations (Bota et al., 2003), so the results of pathway tracing experiments using different methods can be different, or even contradictory. As a result, information about pathway tracing methods used and about injection and labeled sites, respectively, is necessary for future evaluation of connectivity data reliability (Bota and Arbib, 2004). Further details, such as the Atlas Levels and spatial coordinates of injection and labeling sites, become very important in the context of 3D reconstructions of experimental results.
Because the prerequisites of connectome construction (pathway tracing data collation and relating gray matter regions across different parcellations) are very time consuming, the order of connectivity matrix filling in species of interest becomes important both for practical and collaborative reasons. Thus, the sequential release of updated, more complete macroconnectome versions for a species of interest allows the neuroscience community to perform statistical analyses on the released data, and to integrate it with already existent information. Moreover, each release can be seen as a benchmark toward completion of a very large-scale task. Because this task can only be done stepwise, the advantage of choosing a hierarchically organized nomenclature is obvious: it can be subdivided and reorganized as needed.
Such large-scale efforts can be accomplished only through collaboration. Completion of the rat macroconnectome both in a timely manner and with high quality data is a task that can only be done collaboratively by multiple neuroanatomy and neuroinformatics groups. Several neuroinformatics and neuroanatomy groups can work in parallel toward completion of major structural or functional divisions of the nervous system macroconnectome in a particular species. For example, each group can complete the macroconnectome for one major subdivision of a common, hierarchically organized, nomenclature. Collaboration and coordinated efforts of different groups (Bota and Swanson, 2007a; Akil et al., 2011) are already underway for neuroscience data integration at different levels of the vertebrate and invertebrate nervous systems. Associated with this, BAMS infrastructure already allows creation of collaborative mouse, rat, or macaque macroconnectomes with several systems, including the UCLA Mouse Connectome Project (http://www.mouseconnectome.org/), Rodent Brain Workbench (http://www.rbwb.org/; Zakiewicz et al., 2011), Temporal Lobe database (http://www.temporal-lobe.com; van Strien et al., 2009; Sugar et al., 2011), CoCoMac (http://cocomac.org), and the Brain Architecture Project (http://brainarchitecture.org/).
For example, the backend structure of BAMS is compatible with the recorded data and metadata associated with connection and neuron type reports, respectively, in two very important publicly available neuroinformatics applications—CoCoMac and CoCoDat—that were designed, developed, and populated by Rolf Kötter and his colleagues (Stephan et al., 2000b; Kötter, 2004; Dyhrfjeld-Johnsen et al., 2005). However, whereas the BAMS-implemented algorithm for qualitatively relating gray matter regions defined in different nomenclatures (for same species) uses the complete set of eight topological relations (Egenhofer and Franzosa, 1991; Sharma, 1986) that can be defined for a pair of convex regions, and is thus purely topological (Bota and Arbib, 2004; Bota et al., 2005), the Objective Relational Transformation (ORT) algorithm implemented in CoCoMac uses only five topological relations and a logical inference engine (Stephan et al., 2000a). Extensive discussion and comparison of both approaches is provided in Bota and Arbib (2004). Both BAMS and CoCoMac are integrated in the Neuroscience Information Framework and provide extensive information about gray matter regions and connectivity to the neuroscience community (NIF; http://www.neuinfo.org; Akil et al., 2011). A comprehensive comparison of BAMS with the major publicly accessible neuroinformatics systems developed by other groups was presented in Bota and Swanson, 2007a.
The backend database structure of BAMS, along with its interfaces and the data collated so far, allow us in principle and practice to construct macroconnectomes for the entire nervous system of any species (including mouse, rat, monkey, and human), using the results of pathway tracing experiments based on different methods and mapped onto different nomenclatures in the same species. The translation of connections across nomenclatures in a species is semi-automatic, and is verified by collators and experts. Using this approach, we constructed a new version of the rat macroconnectome that is the most complete connectome available to date for any vertebrate, as far as we know. This second version of the rat macroconnectome contains significantly more data than the first version, and it is based on a complete and internally consistent rat nomenclature and classification scheme for gray matter regions that facilitates network analysis. As discussed in the section above, the amount of connectivity data already inserted in BAMS allowed us to perform preliminary statistical analysis over the rat macroconnectome, and hypothesize that the average number of targets of any rat gray matter region is a maximum of 50 out of about 500.
Future work will augment the present matrix-form macroconnectome representation with spatial attributes including pathway tracer injection site and sites of connection labeling resulting from the injection. Using these attributes, we will re-implement the inference engine for evaluating connectivity data reliability (Bota and Arbib, 2004) and we will provide users with a set of tools to construct macroconnectomes that evaluate connections in different ways. In addition, we intend to complete the rat macroconnectome as best as possible from the existing literature and start constructing macroconnectomes for other species, in particular the mouse, monkey, and human. Work on the mouse connectome has already begun (mouseconnectome.org), and one novel feature here is the direct transfer of connection data from expert annotators to a reference nomenclature (Dong, 2007) in BAMS. This mouse connectome project is based on a powerful new double coinjection (DCI) method that allows to two different stereotaxically placed coinjections of an anterograde and a retrograde pathway tracer in each animal, resulting in data from four separate tracers, each labeled in a different color in each histological section (Thompson and Swanson, 2010). An example of data from two coinjections in the LHA of the rat is shown in Figure 3. A growing set of DCI experiment results for the mouse brain can be found at mouseconnectome.org. The networks inference engines of BAMS (Bota et al., 2003, 2005) also will be used to extract functionally relevant gray matter region networks in both rat and mouse that can be further compared.
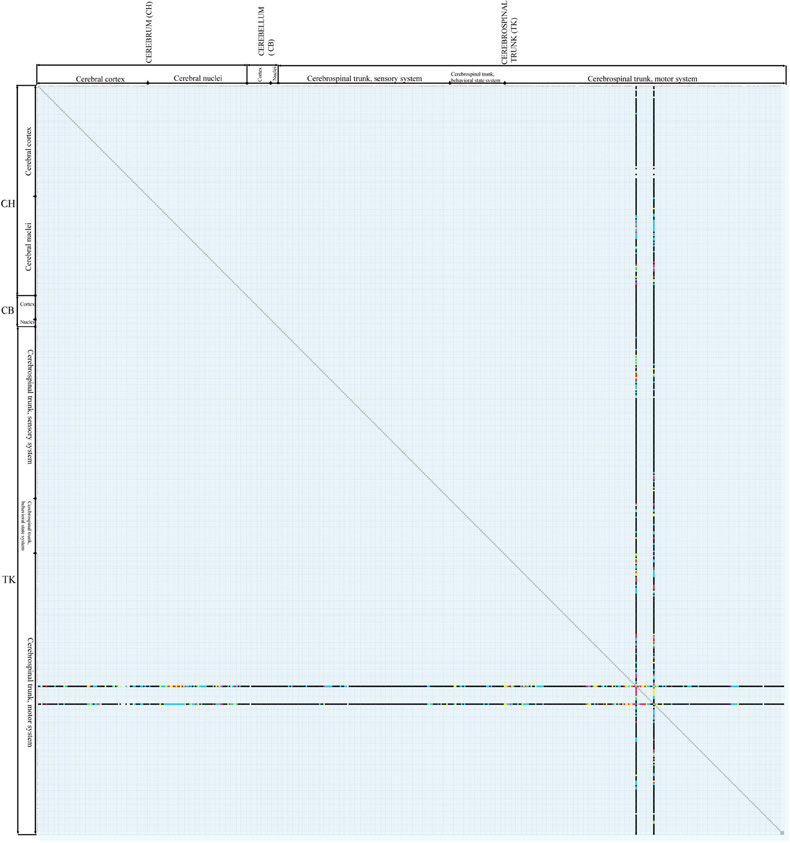
Figure 3. Results of a coinjection pathway tracer analysis [Hahn and Swanson (2010)] of two nearby regions of the rat lateral hypothalamic area, the LHAjp, and LHAs, plotted on the connectome matrix for Swanson-2004 (see Figure 2). The two columns represent anterograde tracer (PHAL) data from injection sites in the LHAjp and LHAs (the leftmost and rightmost columns, respectively), whereas the two rows represent retrograde tracer (CTb) data from the same two injection sites (in different animals, in this case, though results were plotted on the same series of reference atlas level plates in the original publication). A large-scale, systematic series of coinjection sites throughout the central nervous system would gradually fill in the entire matrix. Attempts to do this in the mouse have begun in the last two years.
More importantly, we will develop the backend structure and inference engines needed in BAMS to construct mesoconnectomes and microconnectomes that are fully integrated and interoperable with macroconnectomes—thus spanning and integrating the molecular, neuron, neuron type, and gray matter region levels of analysis. This extension will begin with the already implemented Molecules and Cells Modules and their relationships with the Connections Module.
Conflict of Interest Statement
The authors declare that the research was conducted in the absence of any commercial or financial relationships that could be construed as a potential conflict of interest.
Acknowledgments
Mihail Bota and Larry W. Swanson are supported by National Institutes of Health Grant NS050792. Hong-Wei Dong is supported by Grants NIH R21MH083180 and P41RR013642. We thank Joel Hahn for providing connectivity data in electronic format and for his valuable input.
References
Akil, H., Martone, M. E., and van Essen, D. C. (2011). Challenges and opportunities in mining neuroscience data. Science 6018, 708–712.
Bohland, J. W., Wu, C., Barbas, H., Bokil, H., Bota, M., Breiter, H. C., Cline, H. T., Doyle, J. C., Freed, P. J., Greenspan, R. J., Haber, S. N., Hawrylycz, M., Herrera, D. G., Hilgetag, C. C., Huang, Z. J., Jones, A., Jones, E. G., Karten, H. J., Kleinfeld, D., Kötter, R., Lester, H. A., Lin, J. M., Mensh, B. D., Mikula, S., Panksepp, J., Price, J. L., Safdieh, J., Saper, C. B., Schiff, N. D., Schmahmann, J. D., Stillman, B. W., Svoboda, K., Swanson, L. W., Toga, A. W., Van Essen, D. C., Watson, J. D., and Mitra, P. P. (2009). A proposal for coordinated effort for the determination of brainwide neuroanatomical connectivity in model organisms at a mesoscopic level scale. PLoS Comput. Biol. 5:e1000334. doi: 10.1371/journal.pcbi.1000334
Bota, M., and Arbib, M. A. (2004). Integrating databases and expert systems for the analysis of brain structures, connections, and homologies. Neuroinformatics 2, 20–59.
Bota, M., Dong, H. W., and Swanson, L. W. (2003). From gene networks to brain networks. Nat. Neurosci. 6, 795–799.
Bota, M., Dong, H. W., and Swanson, L. W. (2005). Brain architecture management system. Neuroinformatics 3, 15–48.
Bota, M., and Swanson, L. W. (2007a). Online workbenches for neural network connections. J. Comp. Neurol. 500, 807–814.
Bota, M., and Swanson, L. W. (2010). Collating and curating neuroanatomical nomenclatures: principles of use of the Brain Architecture Management System (BAMS). Front. Neuroinform. 4:3. doi: 10.3389/fninf.2010.00003
Brain Architecture Project: http://brainarchitecture.org
Burns, G. A. P. C. (2001). Knowledge management of the neuroscientific literature: the data model and underlying strategy of the NeuroScholar system. Philos. Trans. R. Soc. Lond. B Biol. Sci. 356, 1187–1208.
Dong, H. W. (2007). Allen Reference Atlas: A Digital Color Brain Atlas of the C57Black/67 Male Mouse. Hoboken, NJ: Wiley.
Dyhrfjeld-Johnsen, J., Maier, J., Schubert, D., Staiger, J., Luhmann, H. J., Stephan, K. E., and Kötter, R. (2005). CoCoDat: a database system for organizing and selecting quantitative data on single neurons and neuronal microcircuitry. J. Neurosci. Methods 141, 291–308.
Egenhofer, M., and Franzosa, R. (1991). Point-set topological spatial relations. Int. J. Geogr. Inf. Syst. 5, 161–174.
Fulwiler, C. E., and Saper, C. B. (1984). Subnuclear organization of the efferent connections of the parabrachial nucleus in the rat. Brain Res. 319, 219–259.
Hahn, J. D., and Swanson, L. W. (2010). Distinct patterns of neuronal inputs and outputs of the juxtaparaventricular and suprafornical regions of the lateral hypothalamic area in the male rat. Brain Res. Rev. 64, 14–103.
Hawrylycz, M., Baldock, R. A., Burger, A., Hashikawa, T., Johnson, G. A., Martone, M., Ng, L., Lau, C., Larson, S. D., Nissanov, J., Puelles, L., Ruffins, S., Verbeek, F., Zaslavsky, I., and Boline, J. (2011). Digital atlasing and standardization in the mouse brain. PLoS Comput. Biol. 7:e1001065. doi: 10.1371/journal.pcbi.1001065
Hjornevik, T., Leergaard, T. B., Darine, D., Moldestad, O., Dale, A. M., Willoch, F., and Bjaalie, J. G. (2007). Three-dimensional atlas system for mouse and rat brain imaging data. Front. Neuroinform. 1:4. doi: 10.3389/neuro.11.004.2007
Kötter, R. (2004). Online retrieval, processing, and visualization of primate connectivity data from the CoCoMac database. Neuroinformatics 2, 127–144.
Moga, M. M., Saper, C. B., and Gray, T. S. (1989). Bed nucleus of the stria terminalis: cytoarchitecture, immunohistochemistry, and projections to the parabrachial nucleus in the rat. J. Comp. Neurol. 283, 283–332.
Rodent Brain Workbench: http://www.rbwb.org
Sharma, J. (1986). Integrated spatial reasoning in geographic infomation systems: continuing topology and direction. University of Maine, PhD Thesis.
Sporns, O., Tononi, G., and Kötter, R. (2005). The human connectome: a structural description of the human brain. PLoS Comput. Biol. 1:e42. doi: 10.1371/journal.pcbi. 0010042
Stephan, K. E., Zilles, K., and Kötter, R. (2000a). Coordinate-independent mapping of structural and functional data by objective relational transformation (ORT). Philos. Trans. R. Soc. Lond. B Biol. Sci. 355, 37–54.
Stephan, K. E., Kamper, L., Bozkurt, A., Burns, G. A., Young, M. P., and Kötter, R. (2000b). Advanced database methodology for the Collation of Connectivity data on the Macaque brain (CoCoMac). Philos. Trans. R. Soc. Lond. B Biol. Sci. 356, 1159–1186.
Sugar, J., Witter, M. P., van Strien, N., and Cappaert, N. L. (2011). The retrosplenial cortex: intrinsic connectivity and connections with the (para)hippocampal region in the rat. An interactive connectome. Front. Neuroinform1. 5:7. doi: 10.3389/fninf.2011.00007
Swanson, L. W. (2003). Brain Architecture: Understanding the Basic Plan. New York, NY: Oxford University Press.
Swanson, L. W. (2004). Brain Maps: Structure of the Rat Brain. A Laboratory Guide with Printed and Electronic Templates for Data, Models and Schematics, 3rd Edn. Amsterdam: Elsevier.
Swanson, L. W., and Bota, M. (2010). Foundational model of structural connectivity in the nervous system with a schema for wiring diagrams, connectome, and basic plan architecture. Proc. Natl. Acad. Sci. U.S.A. 107, 20610–20617.
van Strien, N. M., Cappaert, N. L., and Witter, M. P. (2009). The anatomy of memory: an interactive overview of the parahippocampal-hippocampal network. Nat. Rev. Neurosci. 10, 272–282.
Tallis, M., Thompson, R., Russ, T. A., and Burns, G. A. (2011). Knowledge synthesis with maps of neural connectivity. Front. Neuroinform. 5:24. doi: 10.3389/fninf.2011.00024
Thompson, R. H., and Swanson, L. W. (2010). Hypothesis-driven structural connectivity analysis supports network over hierarchical model of brain architecture. Proc. Natl. Acad. Sci. U.S.A. 107, 15235–15239.
Keywords: connectome, neuroinformatics, data mining, data collation and annotation, neuroanatomy, mapping, BAMS
Citation: Bota M, Dong H and Swanson LW (2012) Combining collation and annotation efforts toward completion of the rat and mouse connectomes in BAMS. Front. Neuroinform. 6:2. doi: 10.3389/fninf.2012.00002
Received: 19 March 2011; Accepted: 06 February 2012;
Published online: 28 February 2012.
Edited by:
Trygve B. Leergaard, University of Oslo, NorwayReviewed by:
Claus Hilgetag, Jacobs University Bremen, GermanyNiels M. van Strien, University of Amsterdam, Netherlands
Rembrandt Bakker, Radboud University Nijmegen, Netherlands
Copyright: © 2012 Bota, Dong and Swanson. This is an open-access article distributed under the terms of the Creative Commons Attribution Non Commercial License, which permits non-commercial use, distribution, and reproduction in other forums, provided the original authors and source are credited.
*Correspondence: Mihail Bota, Department of Biological Sciences, University of Southern California, 3641 Watt Way, HEDCO Neuroscience Building, Los Angeles, CA 90089, USA. e-mail:bWJvdGFAdXNjLmVkdQ==