 Jon T. Brown
1
Jon T. Brown
1 Kate L. Weatherall
2
Kate L. Weatherall
2 Laura R. Corria
2
Laura R. Corria
2 Thomas E. Chater
1
Thomas E. Chater
1 John T. Isaac
3
John T. Isaac
3 Neil V. Marrion
2*
Neil V. Marrion
2*
- 1 Department Anatomy, School of Medical Sciences, University of Bristol, Bristol, UK
- 2 Department of Physiology and Pharmacology, School of Medical Sciences, University of Bristol, Bristol, UK
- 3 National Institute of Neurological Disorders and Stroke, National Institute of Health, Bethesda, MD, USA
Glutamate is released from synaptic vesicles following formation of a fusion pore, connecting the vesicle interior with the synaptic cleft. Release is proposed to result from either full fusion of the vesicle with the terminal membrane or by ‘kiss-and-run,’ where release occurs through the fusion pore. ‘Kiss-and-run’ seems implausible as passive diffusion of glutamate through the pore is too slow to account for the rapidity of release. Vesicular accumulation of glutamate is driven by a proton gradient, resulting in the co-release of protons during exocytosis. We tested whether the proton gradient between the vesicle and cleft contributes to glutamate exocytosis. Collapse of the gradient reduced hippocampal glutamatergic transmission, an effect that was not associated with presynaptic changes in excitability, transmitter release probability, or postsynaptic sensitivity. These data indicate that approximately half of glutamate release utilizes the proton gradient between vesicle and cleft, suggesting a significant proportion of release by ‘kiss-and-run.’
Introduction
The amino acid L-glutamate mediates the vast majority of excitatory transmission in the vertebrate central nervous system. Transmitter release from synaptic vesicles into the synaptic cleft was classically thought to occur following formation of a fusion pore that dilated to result in full vesicle fusion with the presynaptic membrane. This process is considered to be responsible for the omega-shaped profile of membranes observed in ultra-structural investigations of the release sites of presynaptic terminals (Heuser, 1989 ). This classical release mechanism requires that components of the vesicle membrane are retrieved after the vesicle has merged with the terminal to discharge its contents into the synaptic cleft, with vesicle retrieval and repriming taking tens of seconds (Ryan et al., 1993 ; Liu and Tsien, 1995 ). More recently, it has been proposed that vesicles can remain intact, with release occurring through a transient fusion pore, which can close to produce incomplete exocytosis of the vesicle contents. This is often referred to as ‘kiss-and-run’ exocytosis (An and Zenisek, 2004 ).
The contribution of full fusion and ‘kiss-and-run’ exocytosis to transmitter release in the CNS is a matter of considerable debate. It has been reported that up to 70–80% of glutamate release in the hippocampus occurs by ‘kiss-and-run’ during low frequency stimulation (Aravanis et al., 2003 ; Richards et al., 2005 ; Harata et al., 2006 ; Zhang et al., 2007 ). The release of dopamine in ventral midbrain is also proposed to be largely by ‘kiss-and-run’ (Staal et al., 2004 ). In contrast, other studies have suggested that as few as 20% of vesicles in the CNS release their transmitter by ‘kiss-and-run’ (Stevens and Williams, 2000 ; He et al., 2006 ). It is becoming apparent that the two release mechanisms can co-exist, with it being proposed that synapses with a low release probability favor ‘kiss-and-run,’ while high probability terminals preferentially utilize full fusion exocytosis (Gandhi and Stevens, 2003 ; Harata et al., 2006 ).
It is estimated that transmitter must exit a vesicle within 100 μs to support the rapid rate of synaptic communication observed at glutamatergic synapses (Clements, 1996 ; Wadiche and Jahr, 2001 ). This fact alone can be used to question the contribution of exocytosis via ‘kiss-and-run’ for rapid synaptic communication, because the estimated conductance (200–300 pS, Klyachko and Jackson, 2002 ; He et al., 2006 ) and open time (<100 ms, Stevens and Williams, 2000 ; Gandhi and Stevens, 2003 ) of a fusion pore suggest that diffusion of glutamate through the pore would be too slow to generate the rapid rise in glutamate to produce the time-course of synaptic currents (Khanin et al., 1994 ). Therefore, it is likely that glutamate is expelled from synaptic vesicles to provide excitatory transmission with the observed time-course if ‘kiss-and-run’ is a plausible contributor to fast transmission.
A mechanism of ion-interchange or co-efflux of counter-charged particles would accelerate the movement of glutamate out of the vesicle (Khanin et al., 1997 ). Simulations of acetylcholine (ACh) release at the neuromuscular junction show that the interchange of the positively charged ACh with Na+ ions or co-efflux of Cl− ions markedly increases the rate of efflux of transmitter from vesicles, allowing models to account for the time-course of synaptic currents (Khanin et al., 1997 ). This has been confirmed experimentally by finding that release of positively charged catecholamine from chromaffin cell vesicles uses an ion-interchange mechanism of a counter flux of Na+ ions into the vesicle through the fusion pore (Gong et al., 2007 ). The intravesicular pH is acidic (pH∼5.5), which dictates that glutamate possesses a negative charge while stored in vesicles within glutamatergic terminals. Efflux of H+ from vesicles releasing glutamate has been reported during synaptic activation (Krishtal et al., 1987 ; Traynelis and Cull-Candy, 1990 ; DeVries, 2001 ; Palmer et al., 2003 ) raising the possibility that the co-efflux of H+ promotes glutamate efflux from synaptic vesicles. However, this has never been directly tested. To investigate this, we have perturbed the H+ gradient between vesicle lumen and synaptic cleft at CA3-CA1 synapses in hippocampal slices and studied the effects on synaptic transmission.
Materials and Methods
Slice Preparation
Hippocampal slices (350 μm thick) were prepared from P14 Wistar rats in ice cold solution of composition (in mM): 119 NaCl, 2.5 KCl, 1.0 NaH2PO4, 26.2 NaHCO3, 11.0 glucose, 2.5 CaCl2, and 9.0 MgSO4, bubbled with 95% O2/5% CO2, pH 7.4, 300 mOsm. Slices were subsequently stored at room temperature in aCSF consisting of (in mM): 119 NaCl, 2.5 KCl, 1.0 NaH2PO4, 26.2 NaHCO3, 21.0 glucose, 2.5 CaCl2, and 1.3 MgSO4, bubbled with 95% O2/5% CO2, pH 7.4, 300 mOsm. Slices were left to recover for at least 1 h before recordings were made.
Cell Culture
Hippocampal cultures were prepared as described previously (Corrêa et al., 2004 ). The cells were plated onto 22 mm glass coverslips coated with poly-L-lysine and used 14–21 days after plating.
Electrophysiology
Whole-cell voltage-clamp recordings were made from visualized CA1 pyramidal neurons within transverse cut hippocampal slices superfused with aCSF at room temperature (18–20°C) (to minimize the incidence of spontaneous release). To determine the effect of extracellular pH6, slices were superfused with aCSF of composition (in mM): 119 NaCl, 2.5 KCl, 1.0 NaH2PO4, 16.2 NaHCO3, 21 glucose, 2.5 CaCl2, and 1.3 MgSO47H2O, 10 MES, bubbled with 95% O2/5% CO2, 300 mOsm. The solution was adjusted to either pH6 (using HCl) or pH7.4 (using NaOH). The solution was supplemented with picrotoxin (100 μM) and tetrodotoxin (1 μM). For both slice and culture recording, whole-cell current was recorded with an Axopatch 200A (Axon Instruments, Sunnyvale, CA, USA), low-pass filtered at 5 kHz (8-pole Bessel, Frequency Devices, Haverhill, MA, USA) and acquired at 20 kHz using Pulse (HEKA Elektronik, Lambrecht/Pfalz, Germany). Neurons were whole-cell voltage-clamped at −70 mV with borosilicate glass electrodes of resistances between 4 and 6 MΩ that contained (in mM): 130 cesium methane sulfonate, 10.0 HEPES, 0.5 EGTA, 4.0 MgATP, 0.3 Na2GTP, 4.0 NaCl, 5.0 QX314-Cl, pH 7.2, 285 mOsm. For slice recording, series resistance was monitored for the duration of the recording, with experiments discarded if changes of more than 20% were observed. In contrast, series resistance was compensated approximately 95% in recording from cultured neurons. For slice recording, a twisted 50 μm nickel/chromium bipolar stimulating electrode was placed in the stratum radiatum proximally and distally from the CA1 soma, to evoke an EPSC in the CA1 pyramidal neuron by stimulating the Schaffer-collateral pathway for 0.1 ms stimulus duration at a frequency of 0.067 Hz. EPSC amplitude is normalized to the mean of the baseline EPSC amplitude. Inhibitory postsynaptic potentials (IPSCs) were isolated by holding at −40 mV and including D-AP5 (50 μM) and NBQX (20 μM) in the aCSF to block NMDA and AMPA receptors respectively. The stimulating electrode was placed in the stratum radiatum, proximal to the cell soma to directly stimulate interneurons. IPSCs were abolished by picrotoxin (50 μM), demonstrating that they originated from activation of GABAA receptors. During paired-pulse experiments, two stimuli were delivered with an inter-stimulus interval of 50 ms. The second facilitated EPSC was contaminated by the decay phase of the first EPSC, therefore the waveform of a single EPSC was subtracted from each paired-pulse record to obtain an uncontaminated amplitude. Paired-pulse ratio (PPR) was calculated by dividing the amplitude of the second response by the first. For extracellular recordings, a recording electrode containing 4 M NaCl, was placed into the stratum radiatum whilst the stimulating electrode evoked action potentials in the Schaffer-collateral pathway. Extracellular voltage was recorded with an Axoclamp 2B (Axon Instruments, Sunnyvale, CA, USA), low-pass filtered at 1 kHz and acquired at 20 kHz using Pulse. The biphasic presynaptic fiber volley (PFV) amplitude was measured from the initial positive peak to the negative peak, and the slope of the excitatory postsynaptic potential (EPSP) measured using PulseFit (HEKA Elektronik). The first evoked response [EPSC, IPSC, paired-pulse facilitation (PPF), PFV] after resumption of stimulation in test/control solutions was used, because that response was not contaminated by the effect of test solutions on vesicle refilling.
For excised patches, a whole-cell recording from a CA1 pyramidal cell in a hippocampal slice or a hippocampal neuron in culture was first obtained, and then an outside-out patch pulled. For experiments studying the effect of pH on the amplitude of glutamate-activated currents, the patch was positioned in front of a glass theta capillary from which a HEPES–MES buffered solution (HMBS) was continuously flowing from one barrel and HMBS plus glutamate of varying concentrations (1–10 mM) from the other barrel. A HMBS consisting of (in mM): 125 NaCl, 2.5 KCl, 1 NaH2PO4, 1.3 MgSO4, 21 Glucose, 10 HEPES, 10 MES, 2.5 CaCl2 (pH7.4 or 6 as appropriate) was used for these experiments. This external solution was used because of the relatively slow flow rate of solution from the reservoirs to the tip of the theta glass, potentially allowing CO2 to diffuse out of the aCSF solution, thus altering the pH. A pulse of glutamate (25 ms duration) was rapidly applied to the patch by moving the theta capillary using a piezo element (Lester and Jahr, 1990 ; Colquhoun et al., 1992 ). Glutamate-evoked currents were recorded at a holding potential of −70 mV. Solution exchange time was <400 μs for complete exchange (∼150 μs for 20–80% exchange time) as estimated using open tip currents in the same experiments. To test for the effects of changing pH on the glutamate-evoked current, responses to pH7.4 aCSF and aCSF + glutamate were first collected and then the solutions switched to pH6.0 aCSF and aCSF + glutamate and tested again on the same patches. To determine if antagonism by γ-D-glutamylglycine (γ-DGG) was affected by pH, cultured hippocampal neurons were bathed in HMBS supplemented with cyclothiazide (30 μM) to block AMPA receptor desensitization (Donevan and Rogawski, 1998 ). Outside-out patches were voltage-clamped at −70 mV and positioned in front of capillaries connected to a RSC200 rapid switcher (Biologic, Claix, France), to permit two point concentration-response curves to glutamate (0.3–3 mM) in the absence and presence of a fixed concentration of γ-DGG (300 μM) at both pH7.4 and 6 to be generated.
Miniature EPSCs (mEPSCs) were recorded from 14- to 21-day-old hippocampal cultures bathed in HMBS, with this solution being supplemented with N-methyl-D-glutamine (30 mM) to allow equimolar replacement with NH4Cl for determination of the effects of extracellular ammonium ions (NH4+). mEPSCs were analyzed with Clampfit (Molecular Devices) to determine effects on amplitude and kinetics of activation.
Bafilomycin A1, cyclothiazide, and tetrodotoxin were purchased from Tocris (Bristol, UK), and FCCP was obtained from Sigma (Poole, UK). All data are presented as mean ± SEM. Statistical comparisons between test and control groups were carried out using an unpaired or paired t-test where applicable (Origin, Microcal Software, Inc.) with statistical significance accepted when p < 0.05, with * indicating p < 0.05, ** indicating p < 0.01, and *** indicating p < 0.001 in the Figures and p values stated in the text.
Results
The loading of vesicles with glutamate requires an H+ gradient, as transport of the amino acid into the vesicle is coupled with H+ efflux (Maycox et al., 1988 ; Shioi and Ueda, 1990 ). We designed an experimental protocol to manipulate the H+ gradient between the interior of the synaptic vesicle membrane and the synaptic cleft without compromising the glutamate content of vesicles. This protocol was strictly followed for all experiments. The baseline EPSC/P amplitude in response to stimulation of Schaffer-collateral/commissural axons was measured for 10 min. Synaptic activation was then stopped for 5 min to allow active presynaptic terminals to retrieve released vesicles, reload them with glutamate, and dock/prime them ready for the next round of release (Maycox et al., 1988 ; Ryan et al., 1993 ; Liu and Tsien, 1995 ; Sankaranarayanan and Ryan, 2000 ). The slice was then superfused with test or control aCSF for a further 15 min, in the absence of stimulation. Synaptic stimulation was then resumed to determine the effect of the manipulation on the amplitude of the synaptic response before any subsequent effects on vesicle refilling occurred (see Figures 1 A,B). Therefore, this experimental design allowed the measurement of the effect of manipulating the H+ gradient between vesicle and cleft on glutamate release in isolation from any effect on vesicle refilling.
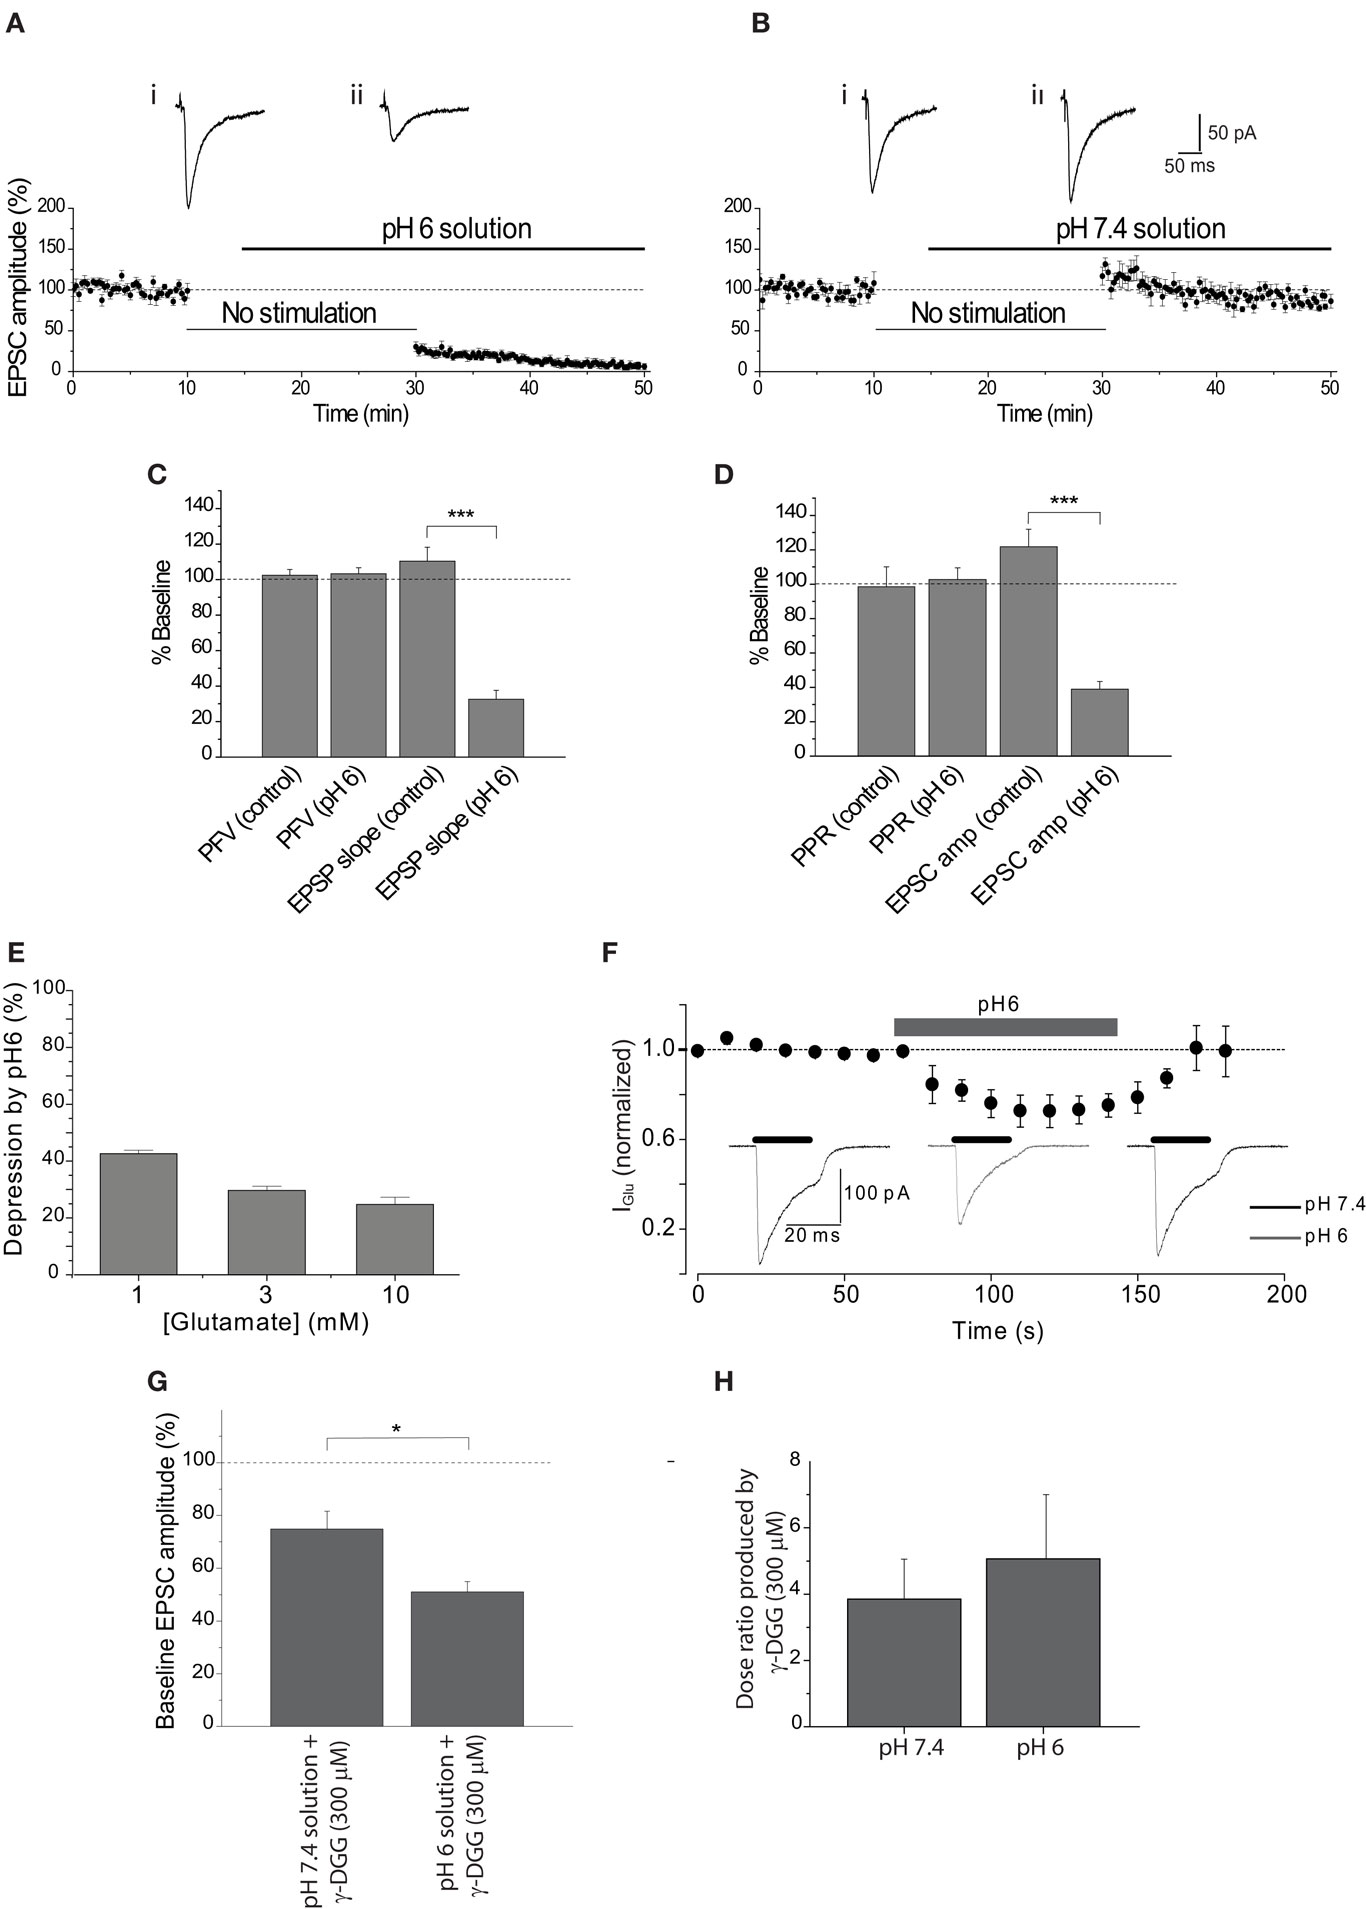
Figure 1. Extracellular acidosis reduces the EPSC. (A) EPSC amplitude was reduced by approximately 70% after stimulation was resumed in the presence of pH6 aCSF. Representative EPSCs show the final baseline response (i) and the first response in pH6 solution (ii). (B) Application of pH7.4 augmented EPSC amplitude following the absence of stimulation, apparent in traces of the final baseline response (i) and the first response evoked in pH7.4 (ii). (C) Initial PFV amplitudes in pH6 and pH7.4 solutions are not significantly different, in contrast to reduction of the initial EPSP slope by pH6. (D) Initial PPR ratios in pH6 and pH7.4 are not significantly different, in contrast to reduction of the initial EPSC amplitude in pH6. (E) Reduction of postsynaptic sensitivity by pH6 is dependent on the concentration of applied glutamate. (F) A reversible modest reduction in amplitude of currents evoked by rapid application of glutamate (3 mM) is produced by pH6 extracellular solution. (G) EPSC amplitude evoked in pH6 is attenuated by γ-DGG (300 μM) to a greater extent than in pH7.4 (p < 0.012). (H) Antagonism of two point concentration-response curves to glutamate (0.3–3 mM) by γ-DGG (300 μM) was not affected by extracellular pH (n = 3, p > 0.65).
Reduction of Synaptic Transmission by Extracellular Acidosis
The effect of a diminished H+ gradient between vesicle lumen and synaptic cleft on synaptic transmission was first tested by exposing the hippocampal slice to pH6 aCSF. Extracellular acidosis reduced the first EPSC after resumption of stimulation by 69.5 ± 5.9% (n = 6, p < 0.00005). This is compared with experiments where the slice remained in pH 7.4 solution, where a small augmentation of the EPSC was observed upon resuming stimulation (+17.1 ± 11.0%, n = 5; Figures 1 A,B). These data indicate that reducing the H+ gradient between the vesicle lumen and synaptic cleft reduces EPSC amplitude by a mechanism that is independent of vesicular accumulation of glutamate. These data are consistent with the hypothesis that the H+ gradient between vesicle and cleft can influence the rate of glutamate exocytosis, although additional data were required to rule out effects of extracellular acidosis on other components of synaptic transmission including presynaptic excitability and postsynaptic AMPA receptor function.
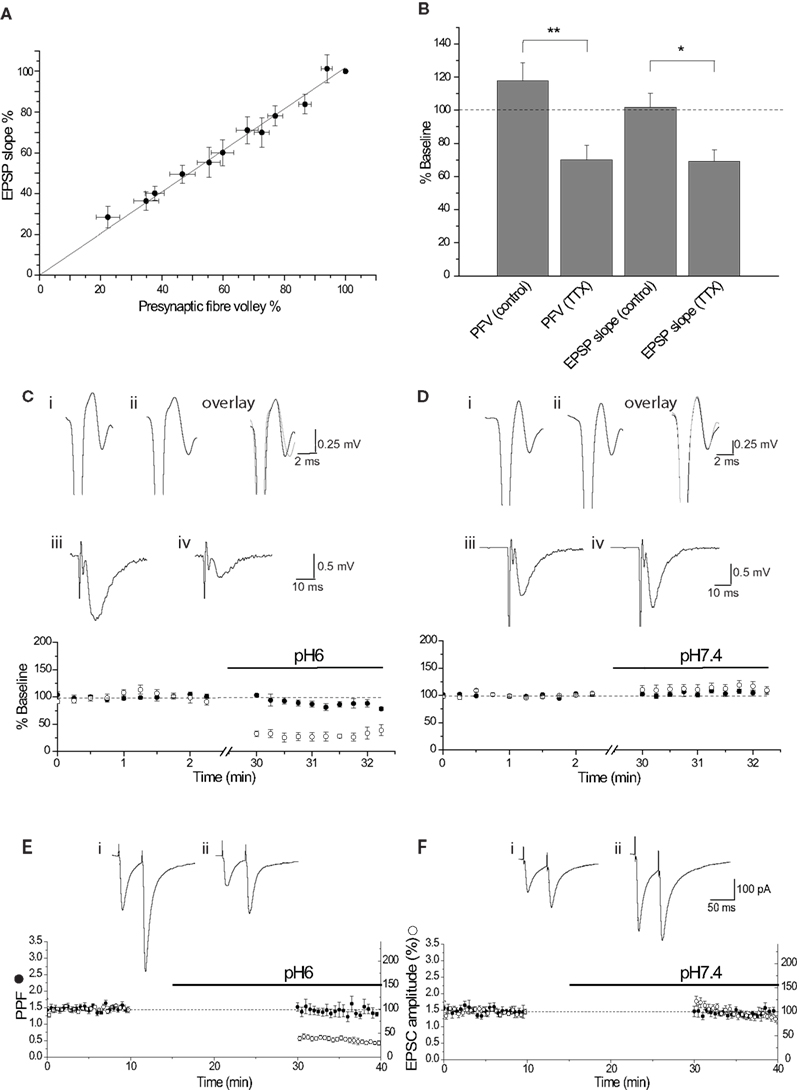
Figure 2. The effect of pH6 aCSF is not mediated by presynaptic changes. (A) Relationship between the PFV amplitude and EPSP slope, determined by incrementally deceasing the stimulus intensity (n = 8). Relationship was fit by linear regression, displaying a gradient of 1.02 (R2 = 0.992). (B) The relationship was also determined by superfusion of TTX (200 nM). Both methods show a 1:1 relationship between PFV amplitude and EPSP slope. (C) pH6 had little effect on the PFV amplitude (•) for the duration of the experiment (note the break in the time axis). This is illustrated by traces of the final control PFV (i), the first PFV evoked in pH6 (ii) and the overlay. In contrast, pH6 reduced the EPSP slope (○) by approximately 70%. This reduction is apparent in the traces of the control EPSP (average of 10 waveforms) (iii) and the EPSP in pH6 (iv). (D) pH7.4 had no effect on either the PFV amplitude (•) or the EPSP slope (○), as shown in traces of the final control PFV (i), the first PFV evoked in pH7.4 (ii) and in the overlay, and the control average EPSP (iii) with the average EPSP in pH7.4(iv). (E) A 15-min application of pH6 had no effect on the amplitude of the PPR (•) upon resuming stimulation, but reduced the EPSC amplitude (○) by approximately 70%. This is seen in traces before (i) and after application of pH6 (ii). (F) pH7.4 did affect either the PPR (•) or EPSC amplitude (○) after resuming stimulation. A small augmentation of the EPSC amplitude, with no effect on the PPR is seen in the control traces (i) and after application of pH7.4 (ii).
Reduction of Synaptic Transmission by Extracellular Acidosis is not Mediated by Changes in Presynaptic Excitability or Release Probability
Extracellular acidosis could alter glutamate release by reducing presynaptic excitability through alteration of presynaptic sodium channel activity (Daumas and Andersen, 1993 ; Tombaugh and Somjen, 1996 ). The effect of pH6 aCSF on presynaptic fiber excitability was determined by measurement of the PFV amplitude. The relationship between the PFV and EPSP slope was first determined to resolve how much of a decrease in the PFV amplitude would cause a significant reduction in synaptic response. This relationship was determined either by incremental decrease of the stimulus intensity or by partial reduction of the PFV by tetrodotoxin (200 nM). Both approaches showed that the relationship between the PFV amplitude and EPSP slope was ∼1:1 (Figures 2 A,B). Therefore, a substantial reduction in the PFV amplitude would be expected if changes in presynaptic excitability were responsible for the ∼70% inhibition of the EPSC amplitude observed at pH6. However, there was no significant difference between the initial PFV amplitude recorded in pH6 and pH7.4 solution (p ≥ 0.87; Figure 1 C). Consistent with whole-cell voltage-clamp recordings of EPSC amplitude (Figures 1 A,B), pH6 reduced the slope of the first EPSP (−67.5 ± 5.1%, n = 5), whereas a small increase was again observed when slices remained at pH7.4 (+10.3 ± 7.9%, n = 8; p < 0.0002; Figure 1 C, also see Figures 2 C–F).
It is possible that the effects of pH6 aCSF on the amplitude of evoked EPSCs reflect a decrease in the probability of transmitter release. Transmitter release is dependent on a number of factors, including calcium (Ca2+) entry through N-, P/Q-, or R-type channels (Takahashi and Momiyama, 1993 ; Wheeler et al., 1994 ; Gasparini et al., 2001 ). PPF is used to resolve changes in release probability, with two stimuli applied in quick succession (e.g., 50 ms) producing an augmentation in the second response that is considered to result from the presence of residual intra-terminal Ca2+. Therefore, the effect of pH6 aCSF on PPF was determined to resolve whether the probability of transmitter was affected. Extracellular acidosis had no effect on the PPR of the first response after resumption of stimulation (p > 0.77; Figures 1 D and 2 E), although the amplitude of the first EPSC in pH6 solution decreased by 61.1 ± 4.5% (n = 7). In contrast, the EPSC amplitude increased in controls left in pH 7.4 solution (+21.8 ± 10.3%, n = 7; p < 0.00001) with no change in PPF (Figures 1 D and 2 F). Therefore, these data indicate that the reduction in EPSC amplitude observed in pH6 is not caused by a reduction in the probability of glutamate release.
Finally, extracellular acidosis can lead to the release of adenosine, which can inhibit Ca2+ influx into presynaptic terminals by activation of presynaptic A1 receptors (Latini et al., 1998 ). Although such a change would also be expect to produce a change in PPR (cf. Figure 1 D), we wished to determine whether the decrease in EPSC amplitude by pH6 aCSF resulted from the release of adenosine into the slice. This was discounted by finding that the reduction of EPSC amplitude by pH6 was not affected by antagonism of A1 receptors (Figures 3 A,B).
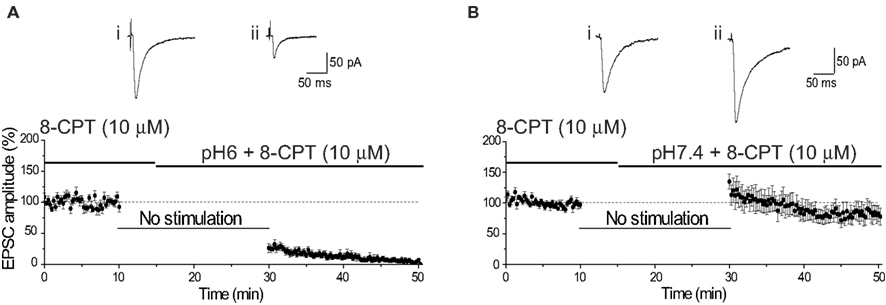
Figure 3. Antagonism of adenosine A1 receptors does not affect reduction of EPSC amplitude by pH6 aCSF. (A) The reduction of EPSC amplitude was not affected by antagonism of adenosine A1 receptors. Baseline EPSC amplitude was determined in the presence of the A1 receptor antagonist 8-CPT (10 μM). The slice was superfused with pH6 aCSF containing 8-CPT (10 μM) 5 min after cessation of stimulation. Resumption of stimulation after 15 min produced an inhibition of the EPSC amplitude, comparable with that observed in the absence of 8-CPT. Representative EPSCs show the final baseline response (i) and the first response evoked in pH6 solution containing 8-CPT (10 μM) (ii). (B) As seen in the absence of 8-CPT, the EPSC amplitude was augmented after stimulation in pH7.4 containing 8-CPT (10 μM). Traces show the final baseline response (i) and the first response evoked in pH7.4 containing 8-CPT (10 μM) (ii).
Reduced Synaptic Transmission by Extracellular Acidosis Only Partly Results from a Change in Postsynaptic Receptor Sensitivity
Inhibition of AMPA receptor-mediated currents has been observed with extracellular acidification, with the degree of inhibition reflecting the concentration of applied AMPA receptor agonist (Traynelis and Cull-Candy, 1991 ; Lei et al., 2001 ). The concentration of glutamate in the synaptic cleft has been estimated to be in the region of 3 mM (Diamond and Jahr, 1997 ; Choi et al., 2003 ) and is likely to be significantly higher at receptors immediately juxtapose to release sites (Clements et al., 1992 ). Rapid application of glutamate concentrations (1, 3, and 10 mM) within this range to outside-out patches excised from the soma of hippocampal CA1 pyramidal neurons within a slice showed a modest concentration-dependent inhibition by pH6 (Figures 1 E,F). These data would suggest that approximately one third of the reduction of EPSC amplitude results from a direct effect on the postsynaptic receptors, indicating that an approximately two-thirds of the reduction in the EPSC amplitude must arise from a different mechanism.
Reduction of Synaptic Transmission by Extracellular Acidosis Occurs by a Decrease in Transmitter Release
The presented data have not directly determined whether the amount of glutamate released is affected by pH6 solution. The low affinity competitive glutamate receptor antagonist γ-DGG can be used to resolve whether the concentration of glutamate at the postsynaptic receptors is different during extracellular acidosis, because the antagonism is inversely proportional to the amount of glutamate released (Clements et al., 1992 ; Diamond and Jahr, 1997 ; Liu et al., 1999 ; Wadiche and Jahr, 2001 ). Antagonism of the EPSC amplitude by γ-DGG (300 μM) was significantly greater in pH6 than pH7.4 aCSF, with the EPSC amplitude being antagonized by 49.0 ± 3.9% (n = 6) in pH6 solution and 25.1 ± 6.7% (n = 6) in pH7.4 (p < 0.01; Figure 1 G). This effect was not the result of a change in affinity of γ-DGG for AMPA receptors, as the measured dose ratio produced by the rightward shift of two point concentration-response relationships to glutamate by the low affinity competitive antagonist was not affected by extracellular pH (Figure 1 H). These data indicate that less glutamate is released during acidosis. Together, these data indicate that the reduction of EPSC amplitude by extracellular acidosis partly results from a decrease in the concentration of released glutamate and does not involve changes in presynaptic excitability (Figures 1 C and 2 C,D), glutamate release probability (Figures 1 D and 2 E,F), or the secondary release of adenosine (Figure 3 ).
Slowing of Miniature EPSC Activation by Acidosis is Consistent with a Decrease in Transmitter Release
The increased EPSC antagonism by γ-DGG at pH6 (Figure 1 G) suggests that less transmitter is released during acidosis of the synaptic cleft. A reduction in transmitter release should not only depress EPSC amplitude but also reduce the rate of rise of mEPSCs. It is well known that the recording conditions for neurons within a slice preparation are far from optimal to permit quantitative examination of the rising phase of the EPSC (Williams and Mitchell, 2008 ). This is of particular concern when trying to measure fast responses such as the rate of rise of glutamatergic EPSCs. Analysis of EPSC kinetics can often be better achieved by the recording mEPSCs in cultured neurons (Stevens and Williams, 2000 ). Application of pH6 extracellular solution to cultured hippocampal neurons significantly reduced the amplitude of spontaneous mEPSCs by 55%, from −15.03 ± 2.36 to −6.77 ± 0.62 pA (n = 8; p < 0.05; Figures 4 A–C). Notably, this reduction in mEPSC amplitude is likely to be an underestimate, because the reduced amplitudes in pH6 resulted in smaller events in the population falling below the resolution of event detection. Application of extracellular pH6 solution also slowed the rate of rise of spontaneous mEPSCs. The time constant of an exponential function fitted to the rising phase of the mEPSC increased from 0.85 ± 0.09 at pH 7.4 to 1.18 ± 0.15 ms at pH 6 (n = 5; p < 0.05; Figures 4 D,E). These data confirm that at least part of the decrease in evoked EPSC amplitude by extracellular pH6 solution arises from a decrease in glutamate release.
The pH gradient between the vesicle interior and synaptic cleft can also be dissipated by intracellular alkalization using extracellular ammonium ions (NH4+) (Boron and De Weer, 1976 ). Extracellular application of NH4Cl (30 mM) significantly reduced the amplitude of spontaneous mEPSCs by 28%, from −30.9 ± 2.2 to −22.3 ± 1.5 pA (n = 8; p < 0.05; Figure 4 F). In addition, extracellular NH4Cl slowed the rate of rise of spontaneous mEPSCs. The time constant of the rising phase of the mEPSC increased from 0.72 ± 0.07 in control to 1.93 ± 0.49 ms in the presence of NH4+ (n = 8; p < 0.05; Figures 4 G,H). These data confirm that decreasing the H+ gradient between vesicle and cleft reduces the amount of glutamate released.
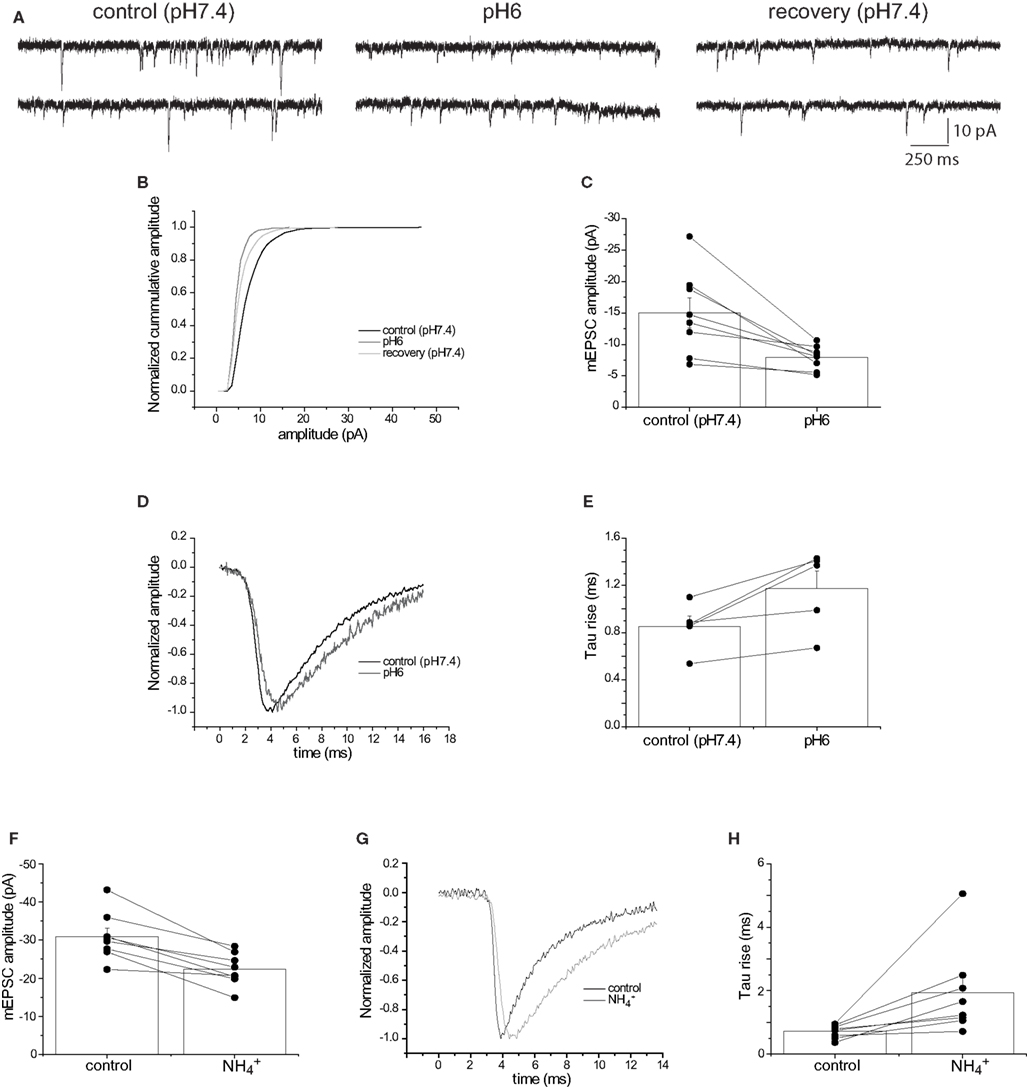
Figure 4. Extracellular pH6 reversibly reduces the amplitude of spontaneous miniature EPSCs. (A). Sample current traces showing miniature EPSCs (mEPSC) before and after application of pH6 extracellular solution, showing a clear reduction of amplitude of the spontaneous events. (B) Cumulative amplitude plot for the experiment shown in (A) Application of pH6 extracellular solution reduces mEPSC amplitude, an effect that is partially reversible. (C) Meaned (±sem, n = 8) mEPSC amplitude before and after application of pH6 extracellular solution. Amplitudes from individual cells are shown in a combined line series plot. (D) Normalized mEPSC waveforms from a single cell before and after the application of pH6 extracellular solution, showing the clear slowing of the rate of rise. (E) Meaned (±SEM, n = 5) tau rise of mEPSCs before and in the presence of pH6 solution, with time-courses from individual cells shown as an associated line series plot. (F) Meaned (±sem, n = 8) mEPSC amplitude before and after addition of extracellular NH4Cl (30 mM). Amplitudes from individual cells are shown in a combined line series plot. (G) Normalized mEPSC waveforms from a cell before and after the extracellular addition of NH4Cl (30 mM), showing the clear slowing of the rate of rise. (H) Meaned (±sem, n = 8) tau rise of mEPSCs before and after the extracellular addition of NH4Cl (30 mM), with time-courses from individual cells shown as an associated line series plot.
The Effect of Extracellular Acidosis is Mimicked by FCCP
An additional approach is to dissipate the H+ gradient before release is initiated by using FCCP, a protonophore that collapses H+ gradients across membranes (Tarasenko et al., 2005 ). Application of FCCP during cessation of synaptic stimulation will dissipate the H+ gradient of vesicles preloaded with glutamate that are primed/docked and ready for release. The evoked EPSC amplitude was significantly reduced (−66.7 ± 6.4%, n = 8; p < 0.0004) following resumption of stimulation in the presence of FCCP (3 μM). In contrast, the evoked EPSC amplitude exhibited a small increase with the vehicle control (0.03% ethanol) (+11.6 ± 11.6%, n = 8; p < 0.00004; Figures 5 A,B). This effect is consistent with data from extracellular acidosis, but the same potential caveats apply with data interpretation. For example, the reduction in EPSC amplitude could arise from a reduction in presynaptic excitability. Assessment of the PFV amplitude showed that FCCP (3 μM) did not affect presynaptic fiber excitability (n = 5, p = 0.50; Figure 5 C). Consistent with whole-cell voltage-clamp data, FCCP reduced the EPSP slope by 75.1 ± 7.2%, compared with the ethanol control (+23.1 ± 10.6%, n = 8; p < 0.00004; Figure 5 C, also see Figures 6 A,B). Determination of the probability of glutamate release using PPR, showed that the PPR of the first responses in FCCP (3 μM) was not significantly different from the corresponding ethanol control (p = 0.16; Figure 5 D), suggesting that FCCP did not change release probability. The simultaneous measurement of EPSC amplitude showed a significant effect of FCCP (−58.4 ± 7.2%, n = 8) compared with the ethanol control (+53.6 ± 15.2 %, n = 9; p < 0.00002; Figure 5 D, also see Figures 6 C,D).
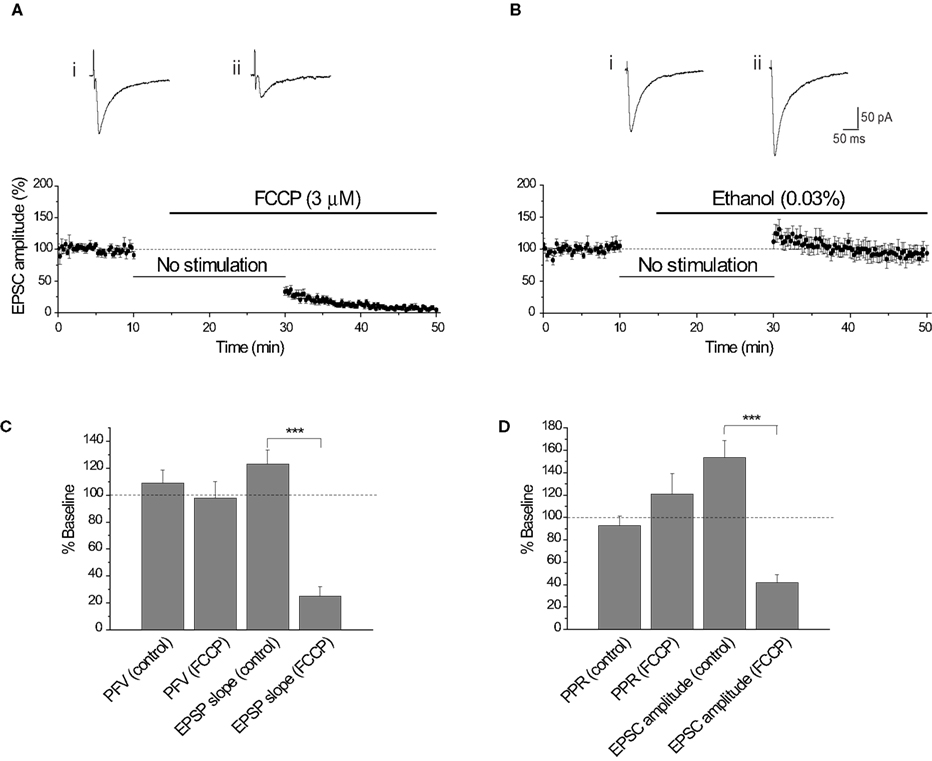
Figure 5. FCCP (3 μM) reduces the EPSC amplitude. (A) Diary plot of EPSC amplitude showing that the EPSC was reduced by approximately 70% 15 min after the application of FCCP (3 μM). Representative EPSCs show the final baseline response (i) and the first response evoked in FCCP (ii). (B) The effect of FCCP is not observed with the vehicle control (0.03% ethanol), with the EPSC amplitude following the 20 min cessation being augmented. This is apparent in the representative traces from a single experiment showing the final baseline response (i) and the first response evoked in 0.03% ethanol (ii). (C) Comparison of the initial PFV amplitude and EPSP slope in FCCP (3 μM) and ethanol (0.03%) (control). FCCP did not affect the initial PFV amplitude (p = 0.87), but did reduce the initial EPSP slope. (D) Comparison of the initial PPR and EPSC amplitude in FCCP (3 μM) and ethanol (0.03%). The initial PPR in FCCP (3 μM) and ethanol (0.03%) were not significantly different, in contrast to the initial EPSC amplitudes.
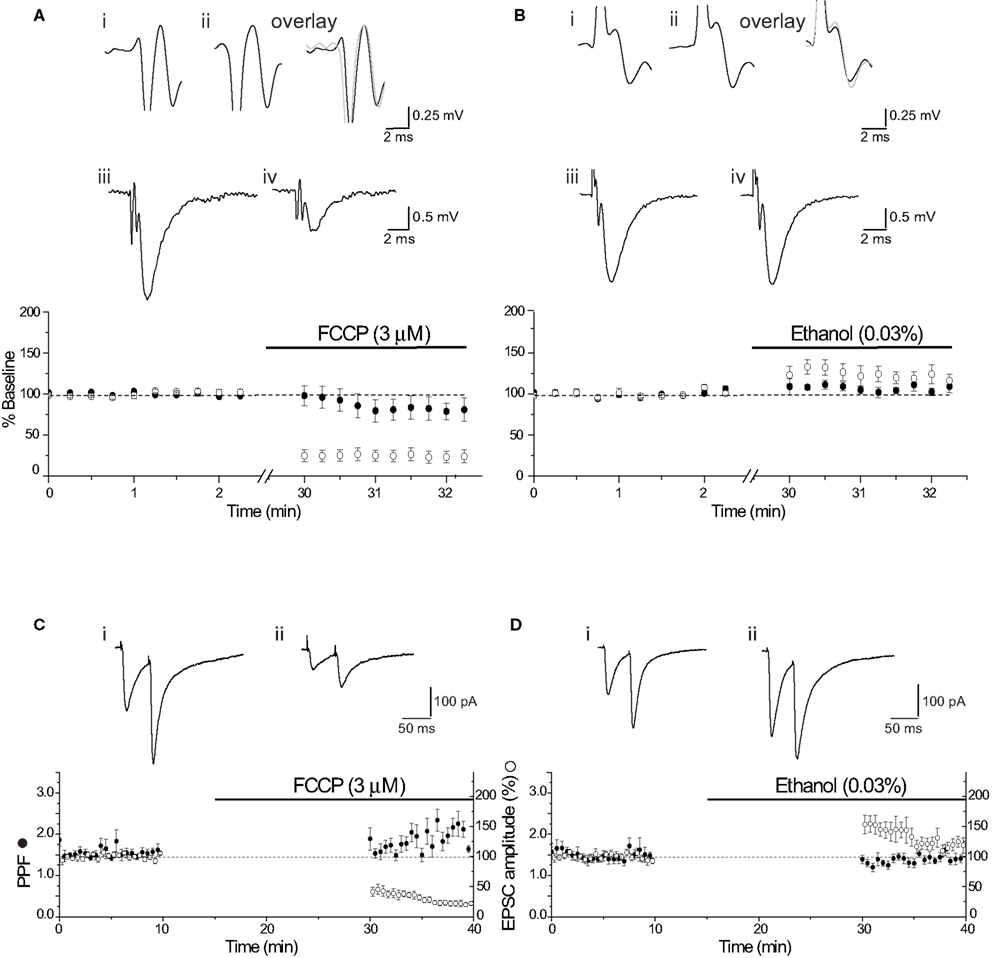
Figure 6. Lack of presynaptic effect of FCCP. (A) Diary plot showing the effect of FCCP (3 μM) on PFV amplitude and EPSP slope (note break in time axis). The initial PFV amplitude (•) was not different from the baseline after stimulation was resumed in FCCP (3 μM), while EPSP slope (() was reduced by approximately 70%. Illustrated traces show the final baseline PFV (i), the first PFV evoked in FCCP (3 μM) (ii) and the overlay, and the control EPSP (average of 10) (iii) and in FCCP (3 μM) (iv). (B) Superfusion of the vehicle control (0.03% ethanol) augmented both PFV amplitude and EPSP slope. Individual traces show the final baseline PFV (i), the first PFV evoked in ethanol (ii) and the overlay, and the control EPSP (iii) and in ethanol (iv). (C) FCCP (3 μM) had no significant effect on the first PPR, but reduced the EPSC by approximately 60%. Diary plot shows the effect of FCCP (3 μM) on PPR (•) and EPSC amplitude (○). Traces show the final baseline PPR (i) and the first PPR evoked in FCCP (3 μM) (ii). (D) The ethanol control had no effect on PPR (•), but augmented the EPSC amplitude (○) by approximately 50%. Traces show the final baseline PPR (i) and the first PPR in ethanol (ii).
Loss of Transmitter from Vesicles Does not Underlie Reduction of Synaptic Transmission
Our data show that loss of the H+ gradient between the lumen of the synaptic vesicle and cleft reduces the concentration of released glutamate, downstream of presynaptic excitability and Ca2+ influx. It is possible that disrupting the H+ gradient causes the synaptic depression by depleting vesicles of glutamate (since the H+ gradient is required to load vesicles with glutamate) or by leakage of glutamate out of filled vesicles (Zhou et al., 2000 ), rather than our favored model in which transmission is depressed as a result of lost H+ co-efflux from fused vesicles. To test this possibility, we investigated the effects on synaptic transmission of the v-ATPase inhibitor, Bafilomycin (Baf A1).
This compound inhibits the accumulation of H+ into synaptic vesicles, preventing recently released vesicles from refilling with glutamate (Roseth et al., 1995 ). For our favored model, this manipulation would be predicted to have no effect, since our experiments are designed to assay release of only preloaded vesicles. Consistent with this, application of Baf A1 (1 μM) did not cause a reduction in the EPSC amplitude compared with the DMSO (0.025%) vehicle control (p = 0.72; Figures 7 A,B). However, a subsequent stimulus-dependent reduction in EPSC amplitude was observed in the presence of Baf A1 (−76.7 ± 12.6% by the end of the stimulation; p < 0.01 vs control; Figures 7 A,B). This slow decline in amplitude did not result from a problem in access of Baf A1 into the slice, as the onset of slow decline was apparent within 15 min application (Figures 7 C,D).
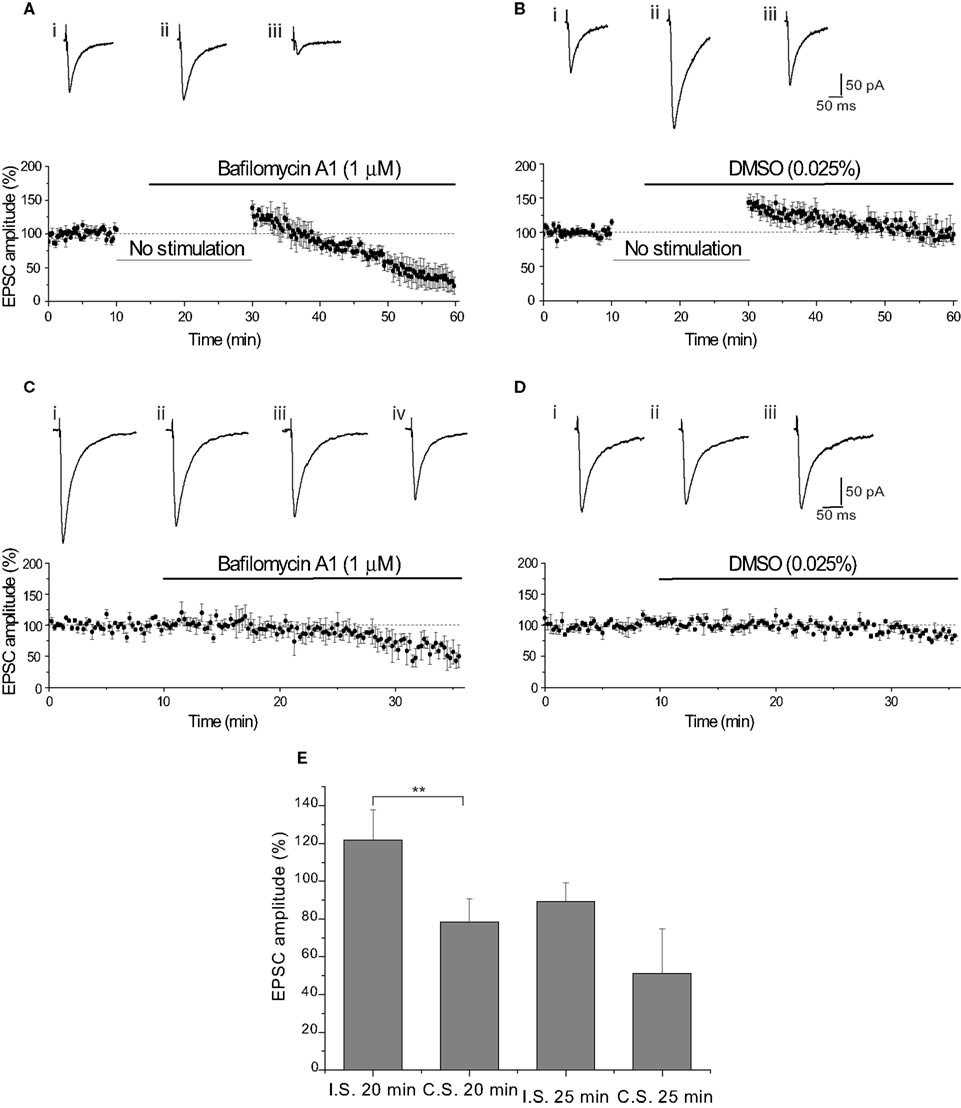
Figure 7. Vesicle depletion does not underlie the reduction of EPSC amplitude. (A) Bafilomycin A1 (Baf A1) did not reduce the amplitude of the EPSC after resuming stimulation. The initial augmentation in the presence of Baf A1 (1 μM) (+38.6 ± 10.9%, n = 4) shows that storage of glutamate was not affected by the protocol. Representative EPSCs show the final baseline EPSC (i), the first EPSC evoked in Baf A1 (ii) and the final EPSC evoked in Baf A1 (iii). (B) The vehicle control (0.025% DMSO) augmented EPSC amplitude on stimulating after 15 min cessation (+43.3 ± 7.3%, n = 6). Representative EPSCs show the final baseline response (i), the first response evoked in DMSO (ii) and the final EPSC evoked in DMSO (iii). Initial EPSC amplitudes evoked in Baf A1 and DMSO were not significantly different. (C) Slow reduction of EPSC did not result from poor access of Baf A1 (1 μM). Traces show the final baseline response (i), the response evoked after 7.25 min (ii), 15 min (iii) and 20 min (iv) in Baf A1 (1 μM). (D) Preservation of EPSC amplitude with DMSO (0.025%) for the duration of the recording. Traces show the final baseline response (i) and the response evoked after 15 min (ii) and 20 min (iii) in DMSO. (E) Comparison of the effect of BaF A1 (1 μM) on EPSC amplitude produced using the interrupted (I.S.) or continuous (C.S.) stimulation paradigms.
The lack of effect of Baf A1 after 20 min application on the EPSC evoked immediately following resumption of stimulation [interrupted stimulation (I.S.)] compared with continuous stimulation (C.S.) is clearly seen in Figure 7 E. The EPSC amplitude following I.S. was in excess of the baseline amplitude, while the EPSC amplitude was significantly reduced by approximately 30% when evoked by C.S. (p < 0.01). In contrast, after a further 5 min of stimulation in Baf A1 reduced the EPSC following I.S. by approximately 10% and the EPSC amplitude evoked by C.S. by a further 25% (Figure 7 E). This difference was not significant, which suggests that this subsequent slow decline in EPSC amplitude likely reflects the time-course of depletion of filled vesicles, because under these conditions, recycling vesicles are unable to reload with transmitter (see Discussion).
Reduction of Release by Disruption of the Vesicular H+ Gradient Requires a Charged Transmitter
Transport of the major inhibitory neurotransmitter GABA into synaptic vesicles also requires a H+ gradient. In contrast to glutamate, this amino acid neurotransmitter is a zwitterion at the acidic pH within the vesicle, exhibiting close to 0 net charge (Hell et al., 1990 ). Therefore, unlike glutamate, release of GABA is unlikely to use H+ efflux to speed release and disruption of the vesicular H+ gradient should not affect the release of GABA. Due to the striking pH-dependence of GABAA receptor gating (Mozrzymas et al., 2003 ), we were unable to use a pH6 solution to test this hypothesis. However, superfusion of FCCP (3 μM) did not have a significant effect on GABAA receptor-mediated transmission. The first IPSC evoked after 20 min without synaptic stimulation was not affected by FCCP (FCCP: −6.00 ± 25.18%, n = 5; vehicle control: −7.93 ± 9.41%, n = 5; p = 0.94; Figures 8 A,B). The subsequent time-dependent reduction of the IPSC is likely to reflect effects on vesicle refilling with GABA.
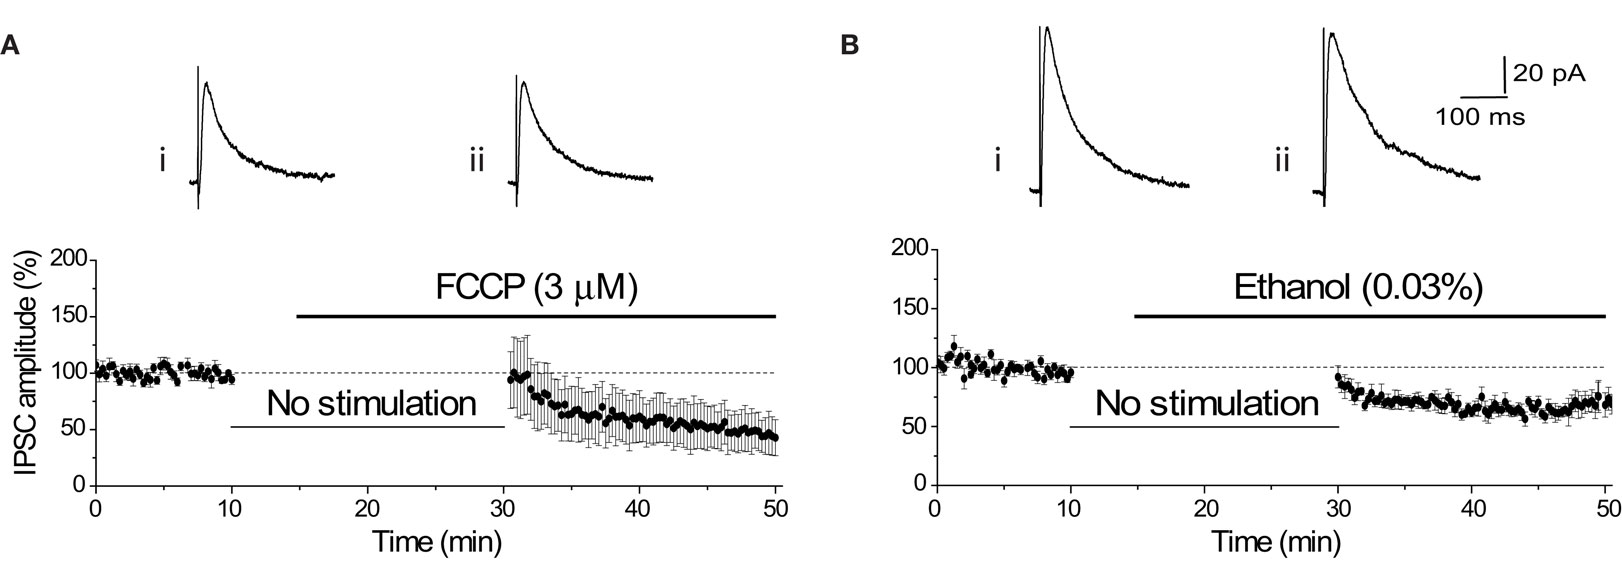
Figure 8. FCCP does not immediately affect the amplitude of the GABAA-mediated IPSC. (A) Diary plot of IPSC amplitude showing that the initial mean IPSC after resumption of stimulation was unaffected by the application of FCCP (3 μM). Representative individual IPSCs from a single experiment show the final baseline response (i) and the first response evoked in FCCP (ii). The subsequent decline in IPSC amplitude upon stimulation is comparable with that seen under control conditions. (B) The diary plot shows that application of the vehicle control (0.03% ethanol) had no initial effect on the mean IPSC amplitude, with the mean IPSC amplitude gradually decreasing over the next 15 min of recording. Representative individual IPSCs from a single experiment show the final baseline response (i) and the first response evoked in ethanol (0.03%) (ii).
Discussion
It has been unknown whether the observed acidification of the synaptic cleft during glutamate release has any physiological relevance. Here we now show that approximately two-thirds of glutamate release utilizes an H+ gradient between the vesicle lumen and the synaptic cleft. The presence of an H+ gradient to release glutamate can only be utilized if release occurs through the narrow fusion pore, with modeling showing that the co-efflux of a counter-charged ion will facilitate the release of a charged neurotransmitter through the fusion pore (Khanin et al., 1994 , 1997 ). Clearly, there would be no role for an H+ gradient if release occurred by full fusion of vesicles with the terminal membrane. The first EPSC evoked after treatment with either extracellular pH6 aCSF or FCCP was reduced by approximately two-thirds compared with control. Following this initial reduction, a slow decline in amplitude was observed for the remaining 20 min of recording. This raises the questions of why the effect on the initial EPSC is incomplete, and what underlies the secondary slow reduction in amplitude? We propose that the majority of the approximately two-thirds reduction of initial EPSC amplitude seen in pH6 or FCCP that follows the 20 min refractory period, reflects loss of ‘kiss-and-run’ glutamate release through a fusion pore. The amplitude of the EPSC remaining after collapsing of the vesicle and synaptic cleft H+ gradient is largely generated by transmitter release via a full fusion mechanism. The fraction of release indicated by our data to occur through a transient fusion pore is consistent with current estimates (20–80%) of the proportion of ‘kiss-and-run’ release at CNS synapses (Stevens and Williams, 2000 ; Aravanis et al., 2003 ; Gandhi and Stevens, 2003 ; Richards et al., 2005 ; Harata et al., 2006 ; He et al., 2006 ; Zhang et al., 2007 ). This large range of estimated contribution of release by kiss-and-run has been proposed to reflect differences in release probability (Gandhi and Stevens, 2003 ; Harata et al., 2006 ). The secondary slow reduction in EPSC amplitude is proposed to result from subsequent effects on vesicle filling. This is supported by our observation that the secondary rate of decline of EPSC amplitude in FCCP (τ ∼ 6.2 ± 0.7 min) is comparable with that seen in Baf A1 (τ ∼ 10.2 ± 6.0 min) (see Figures 5 A and 7 A).
Our findings support the idea that synapses can release glutamate using both kiss-and-run and full fusion, with ‘kiss-and-run’ exocytosis accounting for the majority of transmitter release under these conditions. Evidence is accumulating that postsynaptic glutamate receptors are not saturated by single quanta at certain synapses (Liu et al., 1999 ; Choi et al., 2000 ; Mainen et al., 1999 ). Utilization of the H+ gradient between vesicle lumen and synaptic cleft poses the question of how quantal is the quantal response? (Lisman et al., 2007 ; Zhang et al., 2007 ). Indeed, it has been proposed that plasticity of release could contribute to the expression of long-term potentiation (Choi et al., 2000 , 2003 ). Changes in the H+ gradient will affect the quantity of glutamate released from a single vesicle and affect quantal size. This could prevent excitotoxicity during ischemia or hypoxia, where extracellular acidification is observed (Lipton, 1999 ). In addition, accumulation of co-released H+ during high frequency repetitive stimulation could generate short-term synaptic plasticity by depressing subsequent release. Alternatively, it is possible that this increase in transmitter release occurs by an increase in the H+ gradient between vesicle lumen and synaptic cleft mediated by a lower intravesicular pH or cleft alkalosis. These data are consistent with the proposal that a significant proportion of release occurs by ‘kiss-and-run’ and shows that the H+ gradient is utilized not only for the filling of vesicles, but also for the rapid release of glutamate.
Conflict of Interest Statement
The authors declare that the research was conducted in the absence of any commercial or financial relationships that could be construed as a potential conflict of interest.
Acknowledgments
We wish to thank Profs. Graham Collingridge, Jeremy Henley, and Andrew Randall, and Drs. Jack Mellor and Dawn Shepherd for helpful discussions and critical reading of the manuscript. This work was supported by the MRC (UK).
References
An, S., and Zenisek, D. (2004). Regulation of exocytosis in neurons and neuroendocrine cells. Curr. Opin. Neurobiol. 14, 522.
Aravanis, A. M., Pyle, J. L., and Tsien, R. W. (2003). Single synaptic vesicles fusing transiently and successively without loss of identity. Nature 423, 643.
Boron, W. F., and De Weer, P. (1976). Intracellular pH transients in squid giant axons caused by CO2, NH3, and metabolic inhibitors. J. Gen. Physiol. 67, 91.
Choi, S., Klingauf, J., and Tsien, R. W. (2000). Postfusional regulation of cleft glutamate concentration during LTP at ‘silent synapses’. Nat. Neurosci. 3, 330.
Choi, S., Klingauf, J., and Tsien, R. W. (2003). Fusion pore modulation as a presynaptic mechanism contributing to expression of long-term potentiation. Philos. Trans. R. Soc. Lond., B, Biol. Sci. 358, 695–705.
Clements, J. D. (1996). Transmitter timecourse in the synaptic cleft: its role in central synaptic function. Trends Neurosci. 19, 163.
Clements, J. D., Lester, R. A., Tong, G., Jahr, C. E., and Westbrook, G. L. (1992). The time course of glutamate in the synaptic cleft. Science 258, 1498.
Colquhoun, D., Jonas, P., and Sakmann, B. (1992). Action of brief pulses of glutamate on AMPA/kainate receptors in patches from different neurones of rat hippocampal slices. J. Physiol. 458, 261.
Corrêa, S. A. L., Munton, R., Nishimune, A., Fitzjohn, S., and Henley, J. M. (2004). Development of GABAB subunits and functional GABAB receptors in rat cultured hippocampal neurons. Neuropharmacology 47, 475–484.
Daumas, P., and Andersen, O. S. (1993). Proton block of rat brain sodium channels. Evidence for two proton binding sites and multiple occupancy. J. Gen. Physiol. 101, 27–43.
DeVries, S. H. (2001). Exocytosed Protons Feedback to Suppress the Ca2+ Current in Mammalian Cone Photoreceptors. Neuron 32, 1107.
Diamond, J. S., and Jahr, C. E. (1997). Transporters buffer synaptically released glutamate on a submillisecond time scale. J. Neurosci. 17, 4672.
Donevan, S. D., and Rogawski, M. A. (1998). Allosteric regulation of α-amino-3-hydroxy-5-methyl-4-isoxazole-propionate receptors by thiocyanate and cyclothiazide at a common modulatory site distinct from that of 2,3-benzodiazepines. Neuroscience 87, 615.
Gandhi, S. P., and Stevens, C. F. (2003). Three modes of synaptic vesicular recycling revealed by single-vesicle imaging. Nature 423, 607–613.
Gasparini, S., Kasyanov, A. M., Pietrobon, D., Voronin, L. L., and Cherubini, E. J. (2001). Presynaptic R-type calcium channels contribute to fast excitatory synaptic transmission in the rat hippocampus. Neuroscience 21, 8715.
Gong, L.-W., Alvarez de Toledo, G., and Lindau, M. (2007). Exocytotic catecholamine release is not associated with cation flux through channels in the vesicle membrane but Na+ influx through the fusion pore. Nat. Cell Biol. 9, 915.
Harata, N. C., Choi, S., Pyle, J. L., Aravanis, A. M., and Tsien, R. W. (2006). Frequency-dependent kinetics and prevalence of kiss-and-run and reuse at hippocampal synapses studied with novel quenching methods. Neuron 49, 243.
He, L., Wu, X.S., Mohan, R. & Wu, L.G. (2006). Two modes of fusion pore opening revealed by cell-attached recordings at a synapse. Nature 444, 102–105.
Hell, J. W., Maycox, P. R., and Jahn, R. (1990). Energy dependence and functional reconstitution of the gamma-aminobutyric acid carrier from synaptic vesicles. J. Biol. Chem. 265, 2111.
Heuser, J. E. (1989). Review of electron microscopic evidence favouring vesicle exocytosis as the structural basis for quantal release during synaptic transmission. J. Exp. Physiol. 74, 1051–1069.
Khanin, R., Parnas, H., and Segel, L. (1994). Diffusion cannot govern the discharge of neurotransmitter in fast synapses. Biophys. J. 67, 966.
Khanin, R., Parnas, H., and Segel, L. (1997). A mechanism for discharge of charged excitatory neurotransmitter. Biophys. J. 72, 507.
Klyachko, V. A., and Jackson, M. B. (2002). Capacitance steps and fusion pores of small and large-dense-core vesicles in nerve terminals. Nature 418, 89.
Krishtal, O. A., Osipchuk, Y. V., Shelest, T. N., and Smirnoff, S. V. (1987). Rapid extracellular pH transients related to synaptic transmission in rat hippocampal slices. Brain Res. 436, 352.
Latini, S., Bordoni, F., Corradetti, R., Pepeu, G., and Pedata, F. (1998). Temporal correlation between adenosine outflow and synaptic potential inhibition in rat hippocampal slices during ischemia-like conditions. Brain Res. 794, 325.
Lei, S., Orser, B. A., Thatcher, G. R. L., Reynolds, J. N., and MacDonald, J. F. (2001). Positive allosteric modulators of AMPA receptors reduce proton-induced receptor desensitization in rat hippocampal neurons. J. Neurophysiol. 85, 2030–2038.
Lester, R. A., and Jahr, C. E. (1990). Quisqualate receptor-mediated depression of calcium currents in hippocampal neurons. Neuron 4, 741.
Lisman, J. E., Raghavachari, S., and Tsien, R. W. (2007). The sequence of events that underlie quantal transmission at central glutamatergic synapses. Nat. Rev. Neurosci. 8, 597.
Liu, G., Choi, S., and Tsien, R. W. (1999). Variability of neurotransmitter concentration and nonsaturation of postsynaptic AMPA receptors at synapses in hippocampal cultures and slices. Neuron 22, 395.
Liu, G., and Tsien, R. W. (1995). Properties of synaptic transmission at single hippocampal synaptic boutons. Nature 375, 404–408.
Mainen, Z. F., Malinow, R., and Svoboda, K. (1999). Synaptic calcium transients in single spines indicate that NMDA receptors are not saturated. Nature 399, 151.
Maycox, P. R., Deckwerth, T., Hell, J. W., and Jahn, R. (1988). Glutamate uptake by brain synaptic vesicles. Energy dependence of transport and functional reconstitution in proteoliposomes. J. Biol. Chem. 263, 15423.
Mozrzymas, J. W., Zarmowska, E. D., Pytel, M., and Mercik, K. (2003). Modulation of GABAA receptors by hydrogen ions reveals synaptic GABA transient and a crucial role of the desensitization process. J. Neurosci. 23, 7981–7992.
Palmer, M. J., Hull, C., Vigh, J., and von Gersdorff, H. (2003). Synaptic cleft acidification and modulation of short-term depression by exocytosed protons in retinal bipolar cells. J. Neurosci. 23, 11332.
Richards, D. A., Bai, J., and Chapman, E. R. (2005). Two modes of exocytosis at hippocampal synapses revealed by rate of FM1-43 efflux from individual vesicles. J. Cell Biol. 168, 929.
Roseth, S., Fykse, E. M., and Fonnum, F. (1995). Uptake of L-glutamate into rat-brain synaptic vesicles - effect of inhibitors that bind specifically to the glutamate transporter. J. Neurochem. 65, 96.
Ryan, T. A., Reuter, H., Wendland, B., Schweizer, F. E., Tsien, R. W., and Smith, S. J. (1993). The kinetics of synaptic vesicle recycling measured at single presynaptic boutons. Neuron 11, 713–724.
Sankaranarayanan, S., and Ryan, T. A. (2000). Real-time measurements of vesicle-SNARE recycling in synapses of the central nervous system. Nat. Cell Biol. 2, 197.
Shioi, J., and Ueda, T. (1990). Artificially imposed electrical potentials drive L-glutamate uptake into synaptic vesicles of bovine cerebral cortex. Biochem. J. 267, 63.
Staal, R. G., Mosharov, E. V., and Sulzer, D. (2004). Dopamine neurons release transmitter via a flickering fusion pore. Nat. Neurosci. 7, 341.
Stevens, C. F., and Williams, J. H. (2000). “Kiss and run” exocytosis at hippocampal synapses. Proc. Natl. Acad. Sci. U.S.A. 97, 12828.
Takahashi, T., and Momiyama, A. (1993). Different types of calcium channels mediate central synaptic transmission. Nature 366, 156.
Tarasenko, A. S., Kostrzhevska, O. G., Storchak, L. G., Linetska, M. V., Borisova, T. A., and Himmelreich, N. H. (2005). Phenylarsine oxide is able to dissipate synaptic vesicle acidic pool. Neurochem. Int. 46, 541.
Tombaugh, G. C., and Somjen, G. G. (1996). Effects of extracellular pH on voltage-gated Na+, K+ and Ca2+ currents in isolated rat CA1 neurons. J. Physiol. 493, 719.
Traynelis, S. F., and Cull-Candy, S. G. (1990). Proton inhibition of N-methyl-D-aspartate receptors in cerebellar neurons. Nature 345, 347.
Traynelis, S. F., and Cull-Candy, S. G. (1991). Pharmacological properties and H+ sensitivity of excitatory amino acid receptor. J. Physiol. 433, 727.
Wadiche, J. I., and Jahr, C. E. (2001). Multivesicular release at climbing fiber-purkinje cell synapses. Neuron 32 301.
Wheeler, D. B., Randall, A., and Tsien, R. W. (1994). Roles of N-type and Q-type Ca2+ channels in supporting hippocampal synaptic transmission. Science 264, 107.
Williams, S. R., and Mitchell, S. J. (2008). Direct measurement of somatic voltage clamp errors in central neurons. Nat. Neurosci. 11, 790–798. http://www.nature.com/neuro/journal/v11/n7/abs/nn.2137.html - a1
Zhang, Q., Cao, Y.-Q., and Tsien, R. W. (2007). Quantum dots provide an optical signal specific to full collapse fusion of synaptic vesicles. Proc. Natl. Acad. Sci. U.S.A. 104, 17843–17848.
Keywords: fusion pore, kiss-and-run, vesicles, synaptic release
Citation: Brown JT, Weatherall KL, Corria LR, Chater TE, Isaac JT and Marrion NV (2010) Vesicular release of glutamate utilizes the proton gradient between the vesicle and synaptic cleft. Front. Syn. Neurosci. 2:15. doi: 10.3389/fnsyn.2010.00015
Received: 11 August 2009;
Paper pending published: 18 October 2009;
Accepted: 20 May 2010;
Published online: 01 July 2010
Edited by:
Reinhard Jahn, Max-Planck Institute for Biophysical Chemistry, GermanyReviewed by:
Christian Rosenmund, Neurocure and Charite Universitaetsmedizin, GermanyReinhard Jahn, Max-Planck Institute for Biophysical Chemistry, Germany
Copyright: © 2010 Brown, Weatherall, Corria, Chater, Isaac and Marrion. This is an open-access article subject to an exclusive license agreement between the authors and the Frontiers Research Foundation, which permits unrestricted use, distribution, and reproduction in any medium, provided the original authors and source are credited.
*Correspondence: Neil V. Marrion, Department of Physiology and Pharmacology, School of Medical Sciences, University of Bristol, University Walk, Bristol, BS8 1TD, UK. e-mail:bi52Lm1hcnJpb25AYnJpcy5hYy51aw==