


- 1 Department of Neurobiology, School of Medicine, University of Pittsburgh, Pittsburgh, PA, USA
- 2 Center for the Neural Basis of Cognition, University of Pittsburgh, Pittsburgh, PA, USA
- 3 Department of Otolaryngology, University of Pittsburgh, Pittsburgh, PA, USA
Before hearing onset, the topographic organization of the inhibitory sound localization pathway from the medial nucleus of the trapezoid body (MNTB) to the lateral superior olive (LSO) is refined by means of synaptic silencing and strengthening. During this refinement period MNTB-LSO synapses not only release GABA and glycine but also release glutamate. This co-released glutamate can elicit postsynaptic currents that are predominantly mediated by NMDA receptors (NMDARs). To gain a better understanding of how glutamate contributes to synaptic signaling at developing MNTB-LSO inhibitory synapses, we investigated to what degree and under what conditions NMDARs contribute to postsynaptic calcium responses. Our results demonstrate that MNTB-LSO synapses can elicit compartmentalized calcium responses along aspiny LSO dendrites. These responses are significantly attenuated by the NMDAR antagonist APV. APV, however, had no effect on somatically recorded electrical postsynaptic responses, indicating little, if any, contribution of NMDARs to spike generation. NMDAR-mediated calcium responses were decreased when increasing extracellular magnesium concentrations to physiological levels indicating that MNTB-LSO synapses activate magnesium sensitive NMDAR on immature LSO dendrites. In Fura-2 AM loaded neurons, blocking GABAA and glycine receptors increased NMDAR contribution to somatic calcium responses suggesting that GABA and glycine, perhaps by shunting backpropagating action potentials, decrease the level of NMDAR activation under strong stimulus conditions.
Introduction
Interaural sound intensity differences are a major cue by which animals determine the azimuth position of incoming sound. These interaural intensity differences are first calculated by principal neurons in the lateral superior olive (LSO) through the integration of tonotopically aligned excitatory and inhibitory inputs (Sanes and Rubel, 1988). The excitatory, glutamatergic inputs arise from the ipsilateral cochlear nucleus (CN), while the inhibitory, glycinergic inputs arise from the medial nucleus of the trapezoid body (MNTB) (Boudreau and Tsuchitani, 1968; Cant and Casseday, 1986). Both excitatory and inhibitory afferent pathways to the LSO are tonotopically organized and aligned such that LSO neurons are excited and inhibited by the same sound frequency (Tollin, 2003).
During development, the topographic organization of the GABA/glycinergic MNTB-LSO pathway is refined by synapse elimination and strengthening, both of which occur before the onset of hearing (Sanes, 1993; Kim and Kandler, 2003; Noh et al., 2010). In rats and mice, LSO neurons become functionally disconnected from about 75% of their initial MNTB inputs while maintained connections become about 10-fold stronger (Kim and Kandler, 2003; Noh et al., 2010). Concurrent with this period of refinement, the properties of synaptic transmission at MNTB-LSO synapses show a number of developmentally transient features. For example, early in the first postnatal week GABA/glycinergic neurotransmission is depolarizing and able to increase postsynaptic calcium concentrations by activating voltage-gated calcium channels (VGCCs), while by the end of the first week, GABA and glycine are hyperpolarizing (Kandler and Friauf, 1995b; Ehrlich et al., 1999; Kullmann and Kandler, 2001). Interestingly, in the period before hearing onset, MNTB neurons also gradually change their neurotransmitter phenotype. In newborn animals, MNTB-LSO synapses not only release both the traditional inhibitory neurotransmitters, glycine and GABA (Kotak et al., 1998; Nabekura et al., 2004), but also the traditional excitatory neurotransmitter, glutamate (Gillespie et al., 2005). This glutamate co-release is crucial for the topographic refinement of the MNTB-LSO pathway. In mice with a genetic deletion of the vesicular glutamate transporter 3 (Seal et al., 2008), which results in impaired glutamate co-release from MNTB-LSO synapses, both synaptic silencing and strengthening are impaired (Noh et al., 2010). However, the mechanisms by which glutamate co-release participates in the topographic refinement of the MNTB-LSO pathway are unknown.
At MNTB-LSO synapses, co-released glutamate activates ionotropic glutamate receptors of the AMPA and NMDA receptor type (AMPAR, NMDAR; Gillespie et al., 2005). In magnesium-free solution, a condition which removes the voltage-dependent Mg2+-block of NMDA receptors (NMDARs) (Nowak et al., 1984), NMDARs carry most of the glutamatergic currents (Gillespie et al., 2005). Calcium influx through NMDAR activation plays a central role in inducing activity-dependent synaptic plasticity not only at excitatory but also at inhibitory synapses (Stelzer et al., 1987; Grunze et al., 1996; McLean et al., 1996; Morishita and Sastry, 1996; Wang and Stelzer, 1996; Ouardouz and Sastry, 2000; Marsden et al., 2007; Nugent et al., 2007). To better understand synaptic signaling in the MNTB-LSO pathway during the time of glutamate co-release and refinement, we first investigated whether MNTB-evoked calcium responses are synapse-specific and second, to what degree and under what conditions activation of NMDARs contributes to these responses. Our results show that MNTB-LSO synapses can elicit compartmentalized Ca2+ responses in aspiny LSO dendrites and that NMDARs significantly contribute to these Ca2+ responses.
Materials and Methods
Slice Preparation
Experiments were performed in accordance with NIH guidelines and approved by IACUC at the University of Pittsburgh. Brainstem slices were prepared from neonatal rats (Sprague–Dawley) and mice (C57Bl/6J and 129S6/SvEv). Data from 5 P2–4 rats and from 68 P1–8 mice are included in this report. Animals were anesthetized by hypothermia or Isoflurane and decapitated. The brain was removed and submerged in artificial cerebrospinal fluid (ACSF; composition in mM: NaCl 124, NaHCO3 26, glucose 10, KCl 5, KH2PO4 1.25, MgSO4 1.3, CaCl2 2, and for slicing kynurenic acid 1; pH 7.3 when aerated with 95% O2/5% CO2). Coronal slices (250–300 μm) were cut with a vibratome (DTK-1500E or Leica VT1000S) and slices containing the MNTB and LSO were allowed to recover for at least 1 h in an interface chamber at room temperature.
Electrophysiological Recording and Experimental Configuration
Slices were continuously perfused with aerated ACSF (∼3 ml/min; composition as above and, for most experiments, with 100 μM Trolox to protect against phototoxicity). Whole-cell patch clamp recordings were obtained from bipolar, principal LSO neurons, visualized with an infrared optical gradient system (Luigs and Neumann, Germany). For confocal experiments, the pipette solution consisted of (in mM): K-gluconate 98, KCl 24, Na2-phosphocreatine 5, HEPES 10, MgCl2 2, GTP-Na2 0.3, ATP-Mg 3, and the Ca2+ indicator, Calcium Green 0.1 (Kd = 190 nM). The calculated Cl− reversal potential ( ) was −40 mV at room temperature. For 2-photon experiments, the pipette solution consisted of (in mM): K-gluconate 60, KCl 60, Na2-phoshocreatine 10, HEPES 10, GTP-Na2 0.3, ATP-Mg 4, the Ca2+ indicator, Oregon Green Bapta 0.1 (Kd = 170 nM), and the sodium channel antagonist, QX314 5;
 = −20 mV. Biocytin (0.2%) was included in the intracellular solution for post-experiment staining to confirm recording location within the LSO.
After gaining whole-cell access in voltage clamp, the cell was held in current clamp and the calcium indicator was allowed to diffuse into the cell for 20 min. Membrane potential changes to hyperpolarizing current steps (200 ms, −100 pA) followed by a single extracellular stimulus were monitored every 10–20 s to control for stability of recording and synaptic input. The MNTB-LSO pathway was stimulated within or just lateral to the ipsilateral MNTB with unipolar (glass electrode with 2- to 4-MΩ input resistance) or bipolar electrodes (two tungsten microelectrodes at 100–200 μm distance; FHC, Bowdoinham, ME, USA).
Calcium Imaging
Confocal imaging was performed with an Olympus Fluoview 300 confocal imaging system on an upright microscope (BX50WI) with a 60× objective (NA 0.9). Fluorescence excitation was elicited with the 488 nm line of an Argon/Krypton laser (Model 643; Ominchrome). Emitted light was high-pass filtered at 510 nm (BA510IF; Olympus). The largest confocal aperture was routinely used to maximize the amount of collected light. Data were collected as framescan images using a rectangular box of 512 × 64 or 640 × 58 pixels and with a frame rate of 5 Hz.
2-photon imaging was performed using a custom-modified Fluoview scanning system (based on Nikolenko et al., 2003) with a Ti: Sapphire laser (Chameleon XR; Coherent). Non-descanned fluorescent emissions were collected with a photomultiplier tube (R6095; Hamamatsu) positioned at the epifluorescence port. FluoView software (Olympus) controlled the scanhead, triggered electrophysiological data acquisition and collected the imaging data.
For 2-photon dendritic Ca2+ imaging experiments (Figures 2 – 4), images were acquired as one-pixel-wide linescans at 100–200 Hz. The linescans were positioned along the dendritic axis (Figures 2A,B). The duration of each trial was 1.4 s with the stimulus (3–5 stimuli at 10 Hz) onset at 0.2 s. To control for slight displacements of the dendritic segment and to ensure that the same region of dendrite was imaged throughout the experiment, linescan images were visually compared with previous images for similar peaks and troughs. If necessary, line placement was adjusted for small shifts in the x, y, or z planes that sometimes occurred during the experiment. For analysis, images were aligned according to the peak of the cross correlograms between spatial profiles of the resting fluorescence from the first trial and each subsequent trial. The spatial profile of the resting fluorescence was calculated from the average fluorescence intensity during the imaging period before stimulus onset along the spatial extent of the linescan. Data were only analyzed from cells in which the major peaks and troughs of the resting fluorescence overlapped following alignment (Figure 2C) and the baseline fluorescence intensity was stable within 20% of values taken in control trials (Figure 3B).
For some imaging experiments, brainstem slices were bulk-labeled with the Ca2+ indicator, Fura-2 AM (100 μM for 3 min; 10 μM for 60 min; at 32°C, as described previously (Ene et al., 2003). Non-ratiometric imaging of Fura-2 was performed by exciting the dye at 810 nm and recording the fluorescence emissions of Fura-2 unbound to Ca2+ (equivalent to measurements made with 380 nm excitation). An increase in [Ca2+]i is thus recorded as a decrease in fluorescence. For consistency with figures of dendritic Ca2+ responses, data are plotted as −(ΔF/F) such that an increase in [Ca2+]i is plotted as a positive value. The MNTB-LSO pathway was stimulated with a train of 10 stimuli at 20 Hz to elicit robust somatic Ca2+ responses. Data were collected in framescan mode with an acquisition rate of 2 Hz and a resolution of 512 × 224 pixels. Five trials were performed for each experimental condition.
Chemicals
The effects of the following pharmacological reagents on MNTB-evoked responses were investigated: DL-2-amino-5-phosphonovaleric acid (APV; 100 μM), 6-cyano-7-nitroquinoxaline-2,3-dione (CNQX; 10 μM), Strychnine (Stry; 1 μM), Bicuculline (Bic; 10 μM), and SR95531 (SR; 10 μM) (Sigma, MO, USA). Stock solutions of these compounds were stored at −20°C until use.
Analysis
Framescan images were median-filtered (3 × 3 kernel), movement-corrected with TillVision (T.I.L.L. Photonics, Germany) and exported for further analysis with scripts custom-written in LabVIEW (National Instruments, TX, USA) or MATLAB (MathWorks, MA, USA). Background-subtracted fluorescence values were converted into changes in fluorescence relative to baseline (ΔF/F). Successful trials, defined as those with increases in ΔF/F greater than 2 SD of baseline, were averaged together within each imaging condition for each region of interest (ROI). Spatial extent of Ca2+ transients was calculated as the length along the dendritic axis of ROI that included all pixels passing the criterion for Ca2+ responses and contiguous with site of largest Ca2+ transient.
Linescan images were aligned (as described above), smoothed (box filter), and analyzed with IgorPro (scripts modified from Dr. N. Urban, Carnegie Mellon University; Wavemetrics, OR, USA). The spatial (dendritic) axis of the linescans was divided into overlapping 3 μm windows and Ca2+ responses were calculated for each window as done for framescan images. The reported Ca2+ responses for each neuron were taken from the window containing the largest Ca2+ response during control conditions and/or the window spanning the dendritic region that was most stable throughout all recording conditions. The soma-dendritic distance of the Ca2+ response was measured from z-stack images.
Results
Subthreshold MNTB Stimulation Elicits Localized Ca2+ Responses in LSO Dendrites
As previously reported (Kullmann and Kandler, 2008), subthreshold stimulation of MNTB-LSO inputs can elicit locally restricted, dendritic Ca2+ responses while suprathreshold stimulation elicits global Ca2+ responses through backpropagating action potentials. We found that across a group of 42 response locations from seven LSO neurons (five from P2 mice, two from P3 rats), subthreshold Ca2+ responses had an average peak amplitude of 0.094 ± 0.01 ΔF/F and an average spatial extent of 4.8 ± 0.5 μm (Figures 1A,B,D,E). In most neurons (6/7), spontaneously occurring Ca2+ responses could be observed along the same dendritic segments. On average, these spontaneous Ca2+ responses had peak amplitudes of 0.10 ± 0.02 ΔF/F and spatial extents of 4.6 ± 0.5 μm (n = 16 locations, N = 6 neurons, four P2 mice and two P3 rats; Figures 1C–E). Thus, evoked and spontaneous Ca2+ responses were indistinguishable in terms of peak amplitude and spatial extent (p = 0.55 and p = 0.79, respectively, Mann–Whitney rank sum test). This suggests that MNTB-elicited, local Ca2+ responses resulted from the activation of single synapses or a small number of very closely spaced release sites.
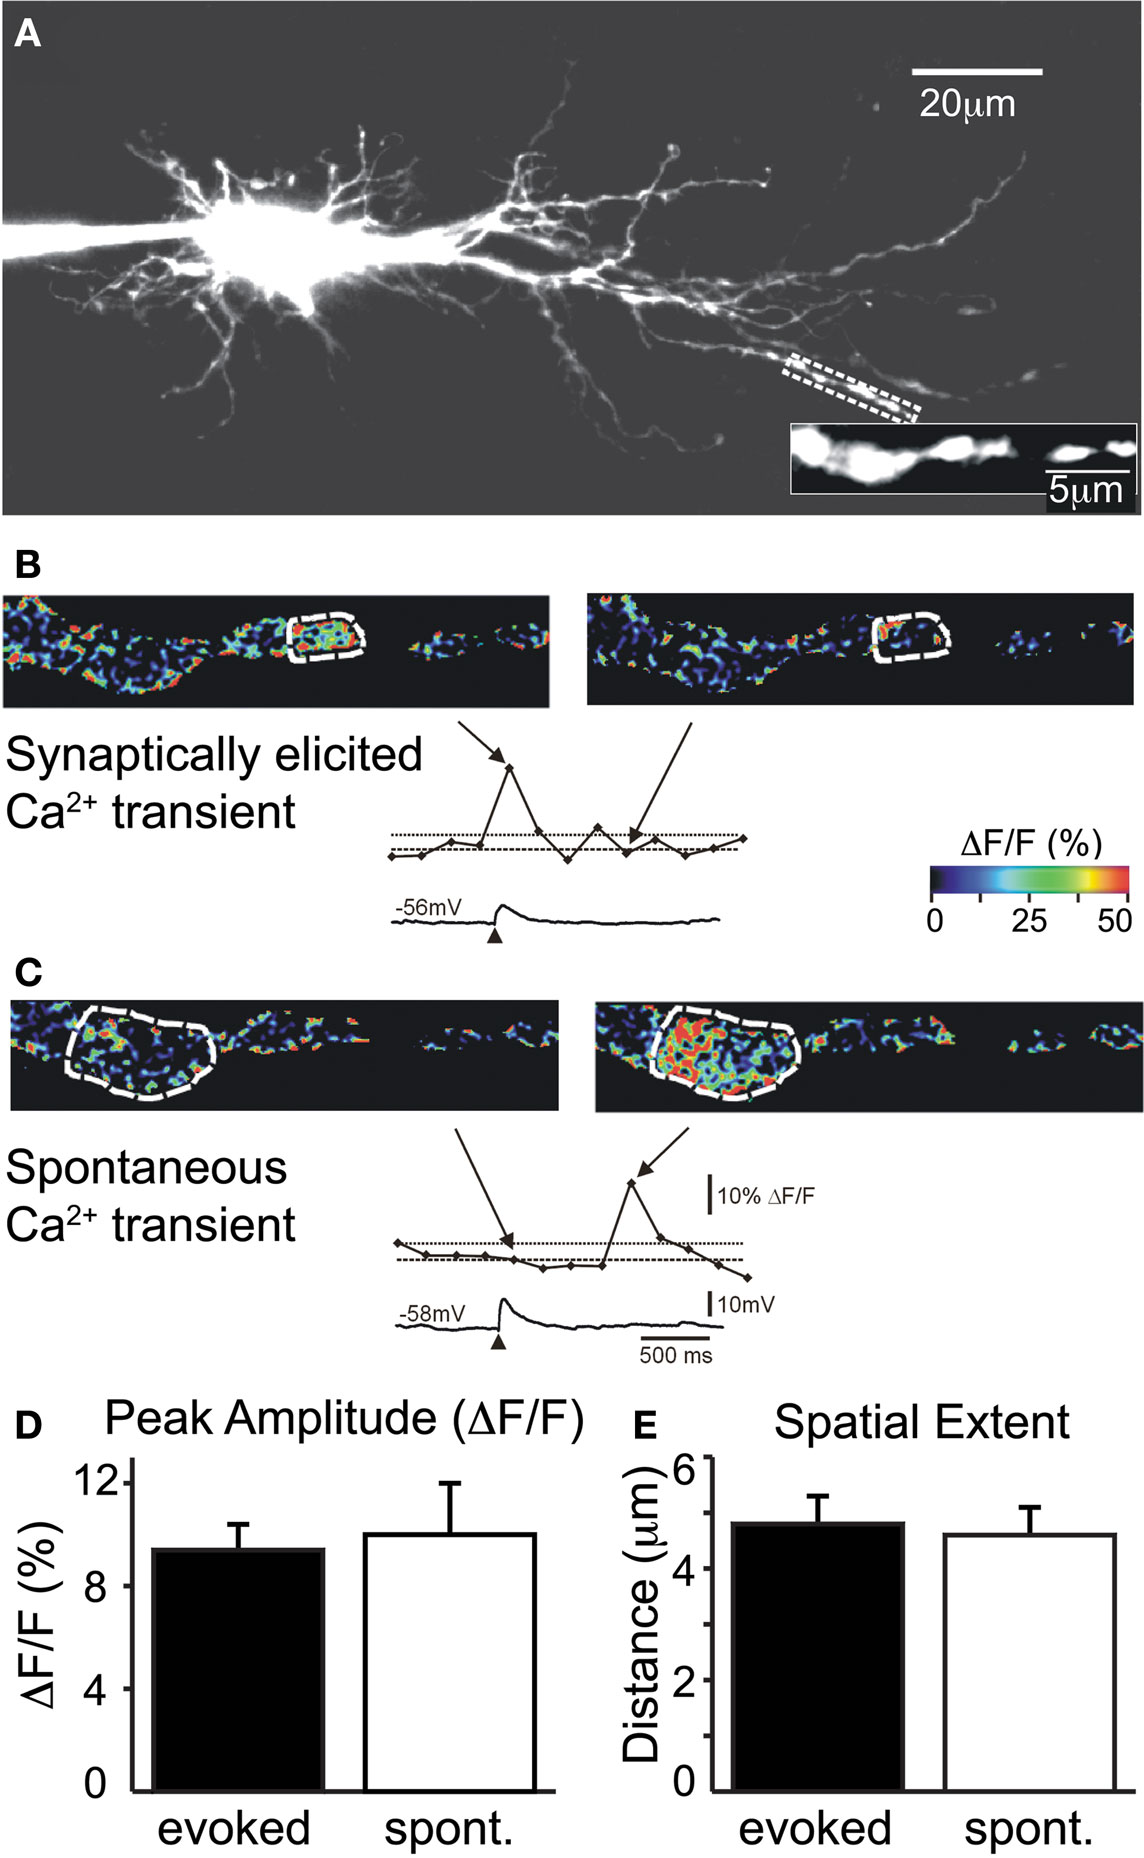
Figure 1. Evoked and spontaneous Ca2+ rises are comparable in amplitude and spatial extent. (A) Image of filled LSO principal neuron (P2 mouse). Region of interest is expanded. (B) Example of synaptically elicited Ca2+ transient (top: pseudo-colored frame scan; and middle: time course of Ca2+ transient for circled region extrapolated from frame scans) and corresponding electrical response (bottom). Arrows point to time points of image frames relative to response. Dashed lines indicate baseline and 2 SD above baseline. (C) Example of spontaneous Ca2+ transient. Scale bars for (B) and (C). Peak amplitude (D) and spatial extent (E) of evoked and spontaneous (spont.) Ca2+ transients are similar.
The likelihood of eliciting a Ca2+ response with a single MNTB stimulation at a particular dendritic location was low even though postsynaptic potentials (PSPs) were reliable and for an imaged dendritic segment usually occurred at the same location. Probability was derived by averaging the probabilities of all 26 locations at which locally restricted, electrically elicited calcium responses were observed. For each location the probability value was calculated by dividing the number of observed responses by the total number of scans performed on that dendrite. Probabilities ranged from 0.06 to 0.6 with a mean value of 0.18 ± 0.02 (26 locations, 70 stimulations). In addition, the somatically recorded electrical response did not correlate with the Ca2+ response amplitude (data not shown). These observations suggest that the recorded MNTB-elicited PSPs result from the activation of several MNTB-LSO axons or synapses onto the recorded LSO cell but that a single fiber or synapse contributes little to the overall response.
NMDAR-Mediated Ca2+ Responses Elicited at Dendritic MNTB-LSO Synapses
In addition to releasing GABA and glycine, immature MNTB axon terminals also co-release glutamate as a third neurotransmitter, and electrophysiological recordings demonstrated that this glutamate can activate both AMPARs and NMDARs on postsynaptic LSO neurons (Gillespie et al., 2005). This glutamate co-release raises the possibility that NMDAR activation significantly contributes to the observed local dendritic Ca2+ responses elicited by MNTB-LSO inputs. To test this hypothesis we recorded from LSO principal neurons with high [Cl−]i ( = −20 mV) to ensure that GABA/glycinergic activation is depolarizing and could relieve Mg2+ block.
Application of the specific NMDAR antagonist, DL-APV (100 μM) significantly reduced dendritic Ca2+ responses elicited by MNTB stimulation (Figures 2D,E and 3A) indicating MNTB-LSO synapses elicit Ca2+ influx through NMDARs. On average activation of NMDARs accounted for about 30% of the amplitude of MNTB-elicited Ca2+ responses (27.5 ± 2.5% reduction in Ca2+ response following APV, n = 13 cells from 13 mice, P4–7, p < 0.01, paired t-test, Figure 3A). NMDARs, thus, significantly contribute to dendritic Ca2+ responses at MNTB-LSO synapses. Because AMPARs in LSO neurons are calcium impermeable at this age (Caicedo et al., 1998; Ene et al., 2003), the remaining calcium responses are most likely due to the activation of voltage-gated l-type calcium channels which are activated due to the depolarizing nature of the primary neurotransmitters GABA and glycine at MNTB-LSO synapses (Kullmann et al., 2002).
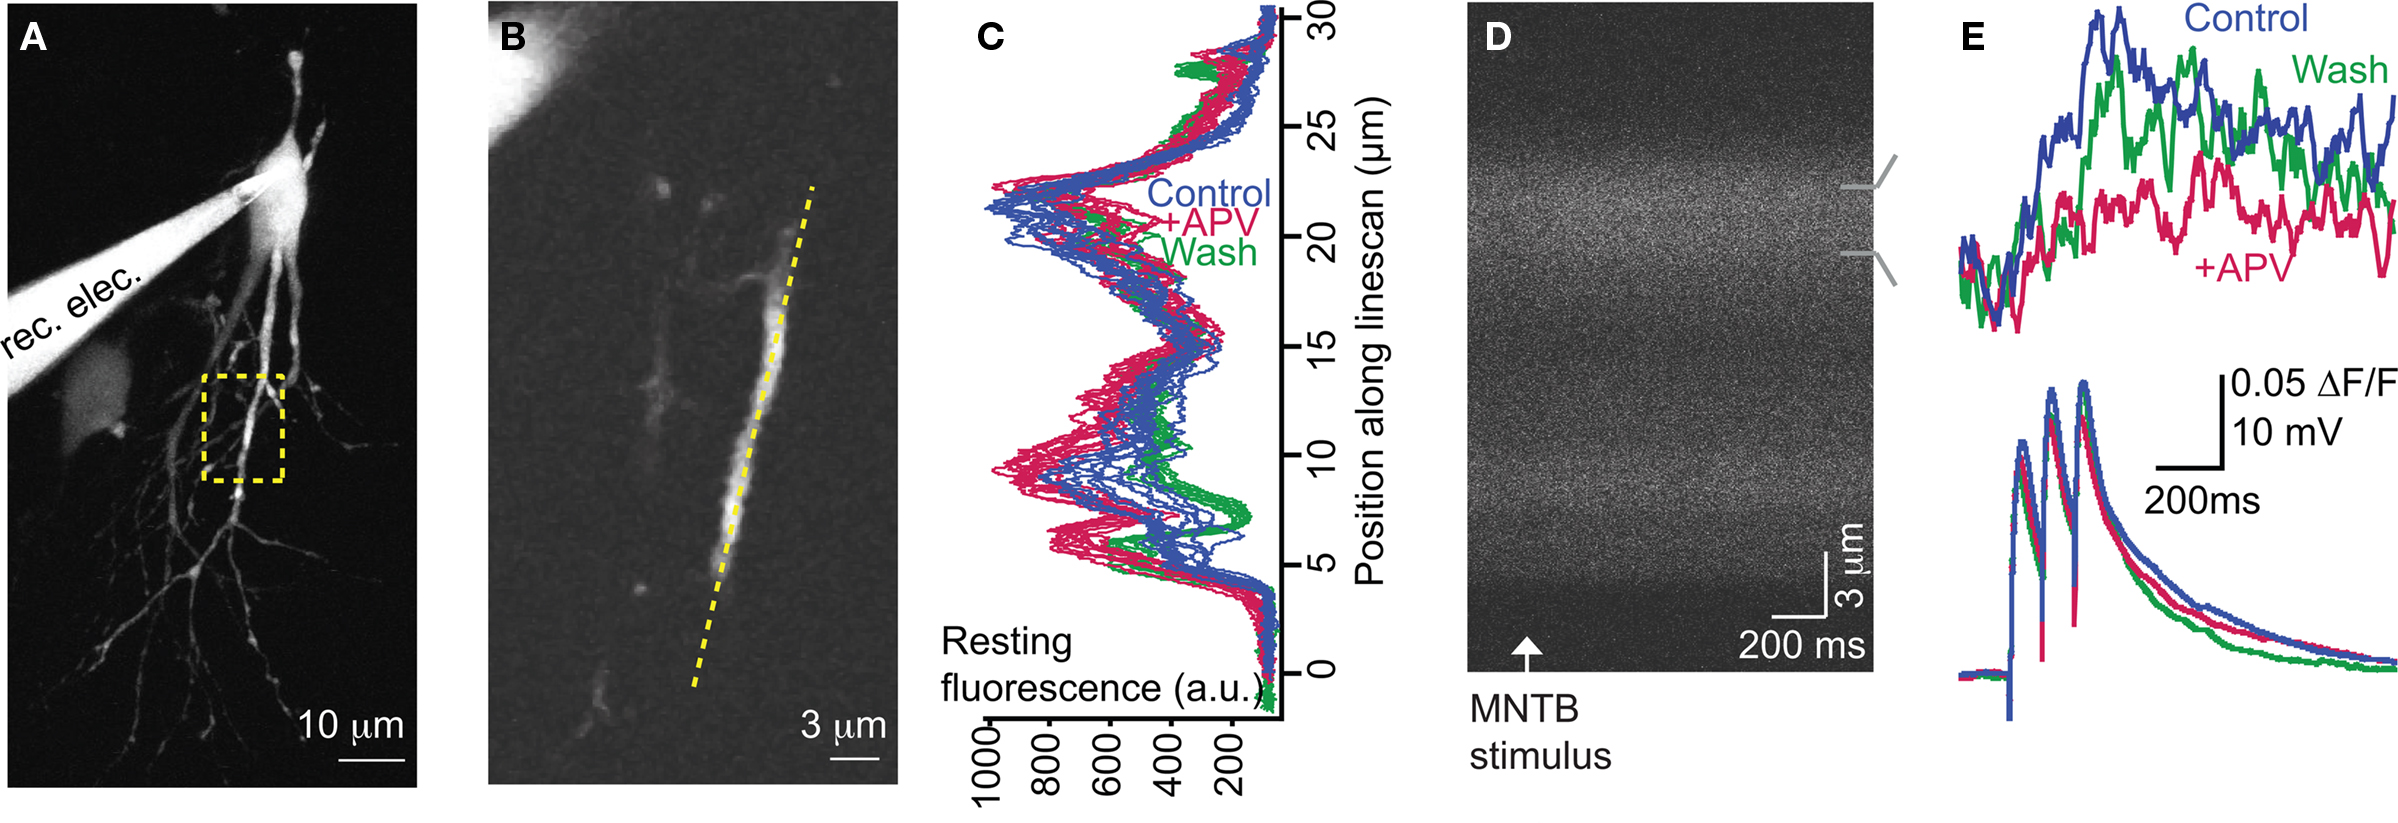
Figure 2. NMDARs significantly contribute to MNTB-elicited Ca2+ responses. (A) Compressed z-stack of recorded neuron (P5). Region of imaging is outlined. (B) Position of linescan (yellow dotted line) relative to dendrite within focal plane. (C) Alignment of baseline fluorescence intensity profiles shows stability throughout experiment. (D) Linescan image of a single trial. Increase in fluorescence after MNTB stimulation indicates an increase in dendritic Ca2+ concentration. (E) Upper traces: MNTB-elicited Ca2+ response is significantly mediated by NMDARs as demonstrated by a reduction following APV application. Lower traces: corresponding electrical responses. Traces are averages of 10 trials/condition.
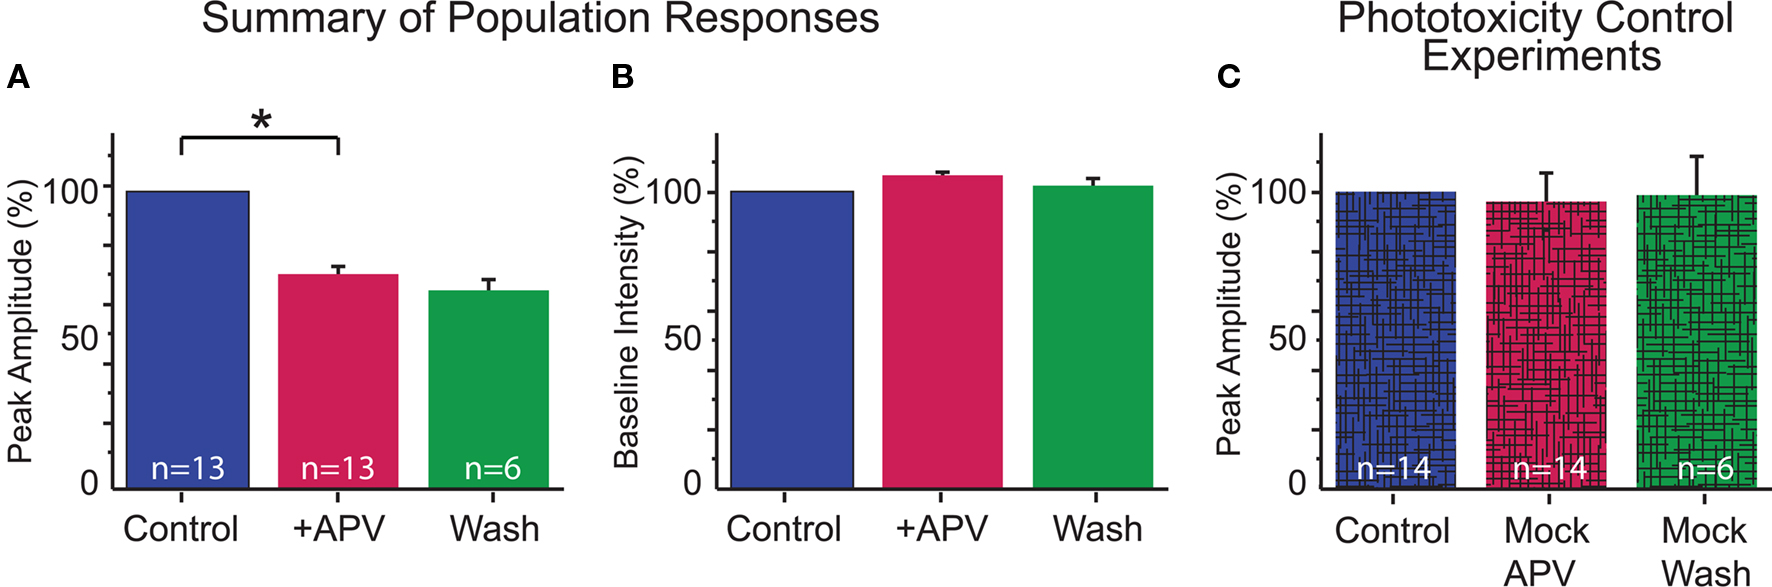
Figure 3. Summary of dendritic Ca2+ responses. (A) MNTB-LSO elicited Ca2+ responses were significantly reduced with application of APV (p < 0.01, paired t-test). Responses are not significantly different between APV and wash conditions (p = 0.7). (B) Baseline fluorescence intensity was stable throughout the recording (Control vs APV: p = 0.6; APV vs Wash: p = 0.2; paired t-test). (C) Lack of washout is not due to phototoxicity: control experiments performed with identical conditions as above except no drug was applied following the first set of trials confirmed that our imaging conditions do not cause phototoxicity (p = 0.45). Similarly, cells held through three conditions had stable Ca2+ responses (p = 0.9).
Phototoxicity control experiments
Although in some experiments the effects of APV were reversible (see Figure 2E), in many cases responses recovered only incompletely or not at all. Therefore, we performed a set of control experiments to determine whether the lack of recovery was due to phototoxicity. In these experiments, we used identical experimental parameters as used in the normal drug experiments (e.g., numbers of stimulations, images, and times between trials) but omitted the application of APV. Under these conditions, Ca2+ responses were always stable throughout the imaging period (mock-APV response normalized to control = 97.0 ± 9.7; n = 14 cells; p = 0.45; normalized mock-wash response = 98.9 ± 13.3%; n = 6; p = 0.9; Figures 3B,C). Furthermore, since partial washout was observed in some experiments (3 of 10 cells held through wash), it is unlikely that the lack of recovery reflects cell damage.
NMDAR-mediated Ca2+ influx is independent of dendritic location
Anatomical studies suggest that in mature LSO neurons inhibitory inputs primarily innervate the somatic and proximal dendritic region (Cant, 1984; Helfert et al., 1992; Friauf et al., 1997). The dendritic location of MNTB-LSO synapses that we observed in our experiments could thus be a developmentally transient state implying a specific elimination of distal MNTB inputs, as has been described in another auditory brainstem nucleus, the medial superior olive (Kapfer et al., 2002). To test the possibility that location-dependent NMDAR activation may contribute to the elimination of distal synapses or strengthening of proximal synapses, we examined whether the magnitude of Ca2+ responses or the contribution of NMDARs correlates with the soma-dendritic distance. We observed no correlation between Ca2+ responses and dendritic locations with respect to either the peak amplitudes both in control and APV conditions (R2 = 0.004, R2 = 0.001. Figures 4A,B respectively) or the percent change in Ca2+ response following APV application (R2 = 0.003, Figure 4C). Additionally, no correlation was observed when the responses were analyzed for each age within the P4–7 age range (data not shown). Therefore, a dendritic gradient of NMDAR-mediated Ca2+ influx is unlikely to serve as an instruction signal for a location-dependent refinement of developing MNTB inputs.
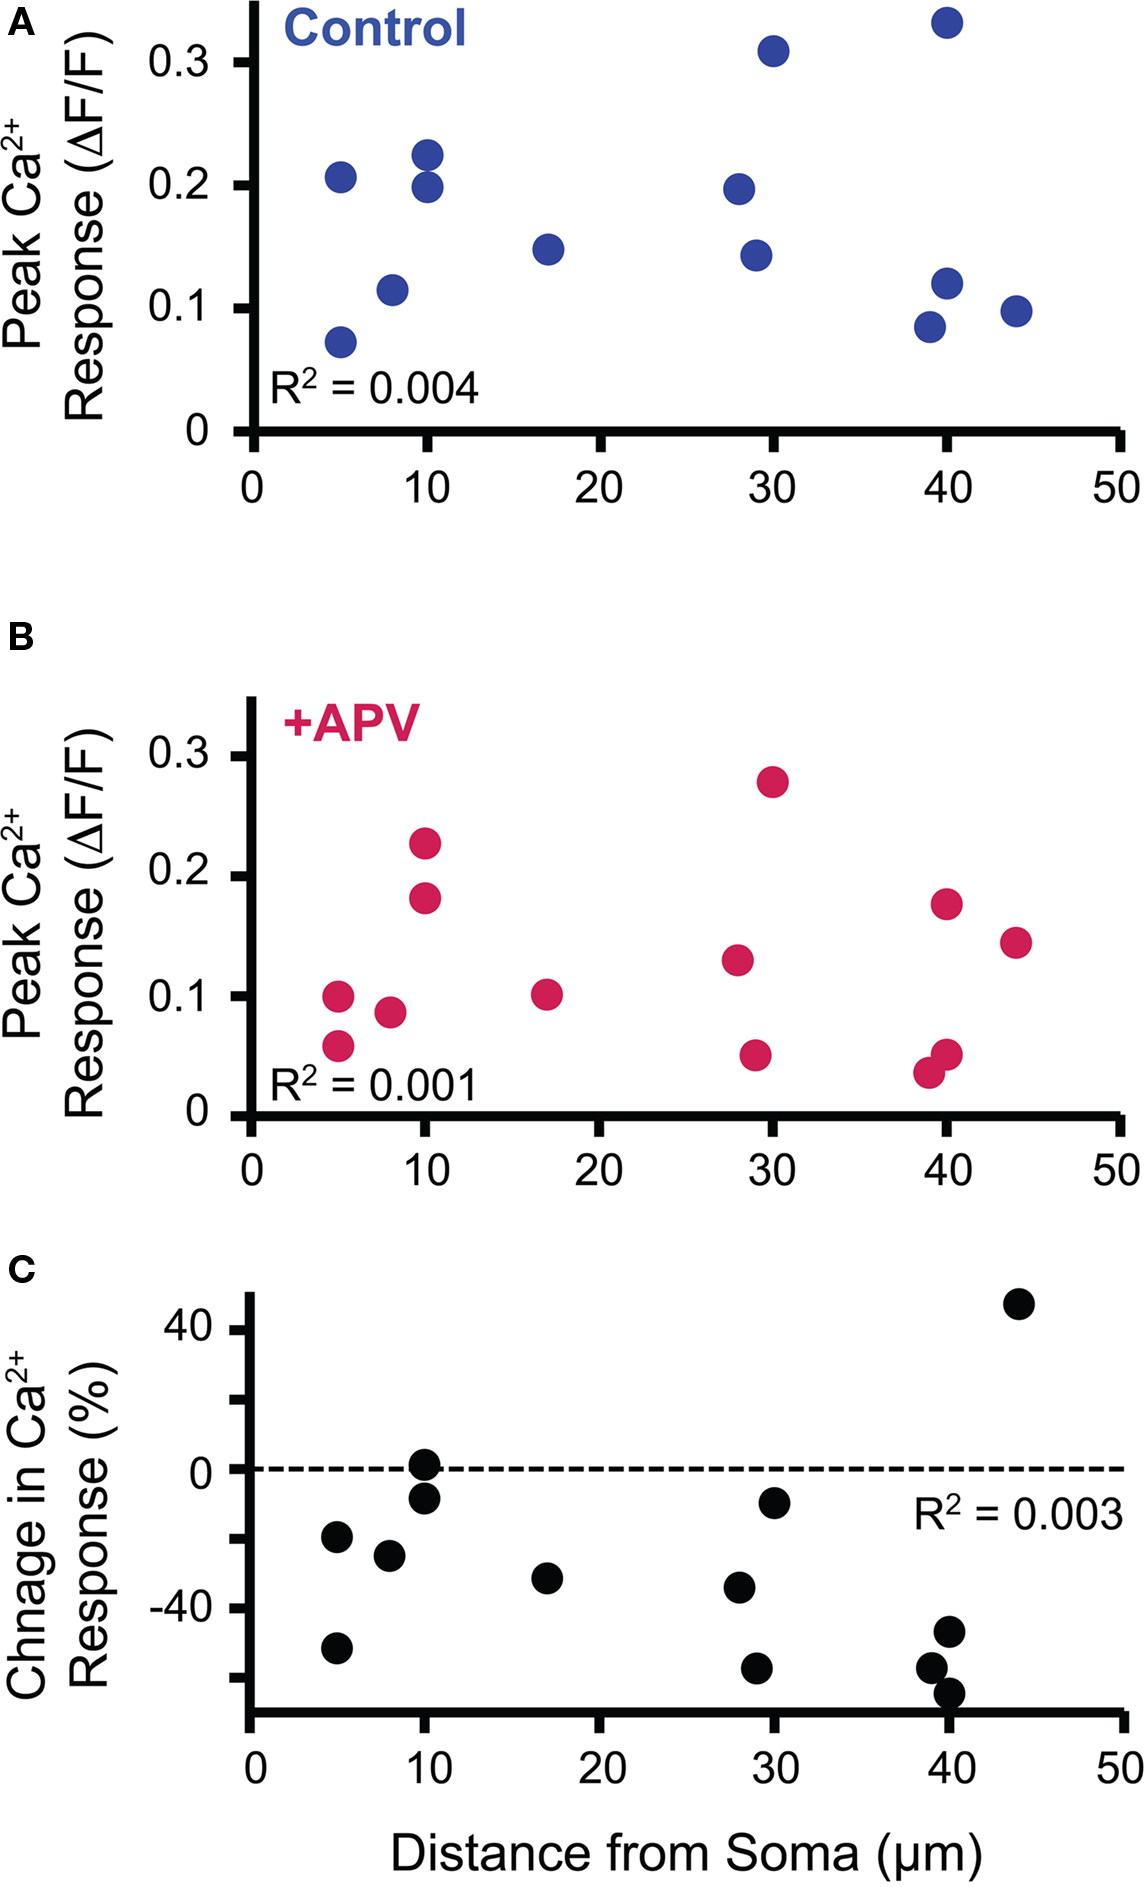
Figure 4. Soma-dendritic distance of imaged dendritic Ca2+ response did not correlate with peak response in control (A) or APV (B) conditions nor with the NMDAR contribution to the Ca2+ response as measured by the change in Ca2+ response following APV application (C).
Activation of NMDARs at dendritic MNTB-LSO synapses does not contribute to somatically recorded PSPs
Although NMDARs contribute to a large portion of MNTB-elicited dendritic calcium influx, they do not contribute to synaptic depolarization at the soma: APV had no effect on the peak amplitudes of the first or last PSPs in the stimulus train (first PSPs: control: 34.1 ± 1.9 mV; APV: 33.8 ± 2.8 mV; wash: 29.0 ± 2.7 mV; control vs APV p = 0.8; APV vs wash p = 0.9, paired t-tests, Figures 5A,D; last PSPs control: 33.4 ± 1.9 mV; +APV: 33.0 ± 1.9 mV; wash: 31.8 ± 2.2; control vs APV p = 0.8; APV vs wash p = 0.8, Figure 5E). Due to the presence of voltage-dependent conductances, changes in decay kinetics were difficult to determine by fitting single or double exponentials to the decays of the electrical responses. Therefore, we tested for possible changes in decay kinetics by measuring the time it takes to pass 70% of the unit area under the last peak in the train. We first normalized the area across a 200-ms time window and integrated this value. We then determined the time point when this integral reached 0.7 of the unit area (Figures 5B,C). We found no change in the decay kinetics following application of APV (control 97.9 ± 4.9 ms; +APV 97.4 ± 6.0 ms; wash 101.7 ± 6.4 ms; control vs APV p > 0.8; APV vs wash p > 0.099, paired t-tests; Figure 5F). The co-release of glutamate and activation of NMDARs, therefore, appears to act locally on the dendrites and not globally through spike generation.
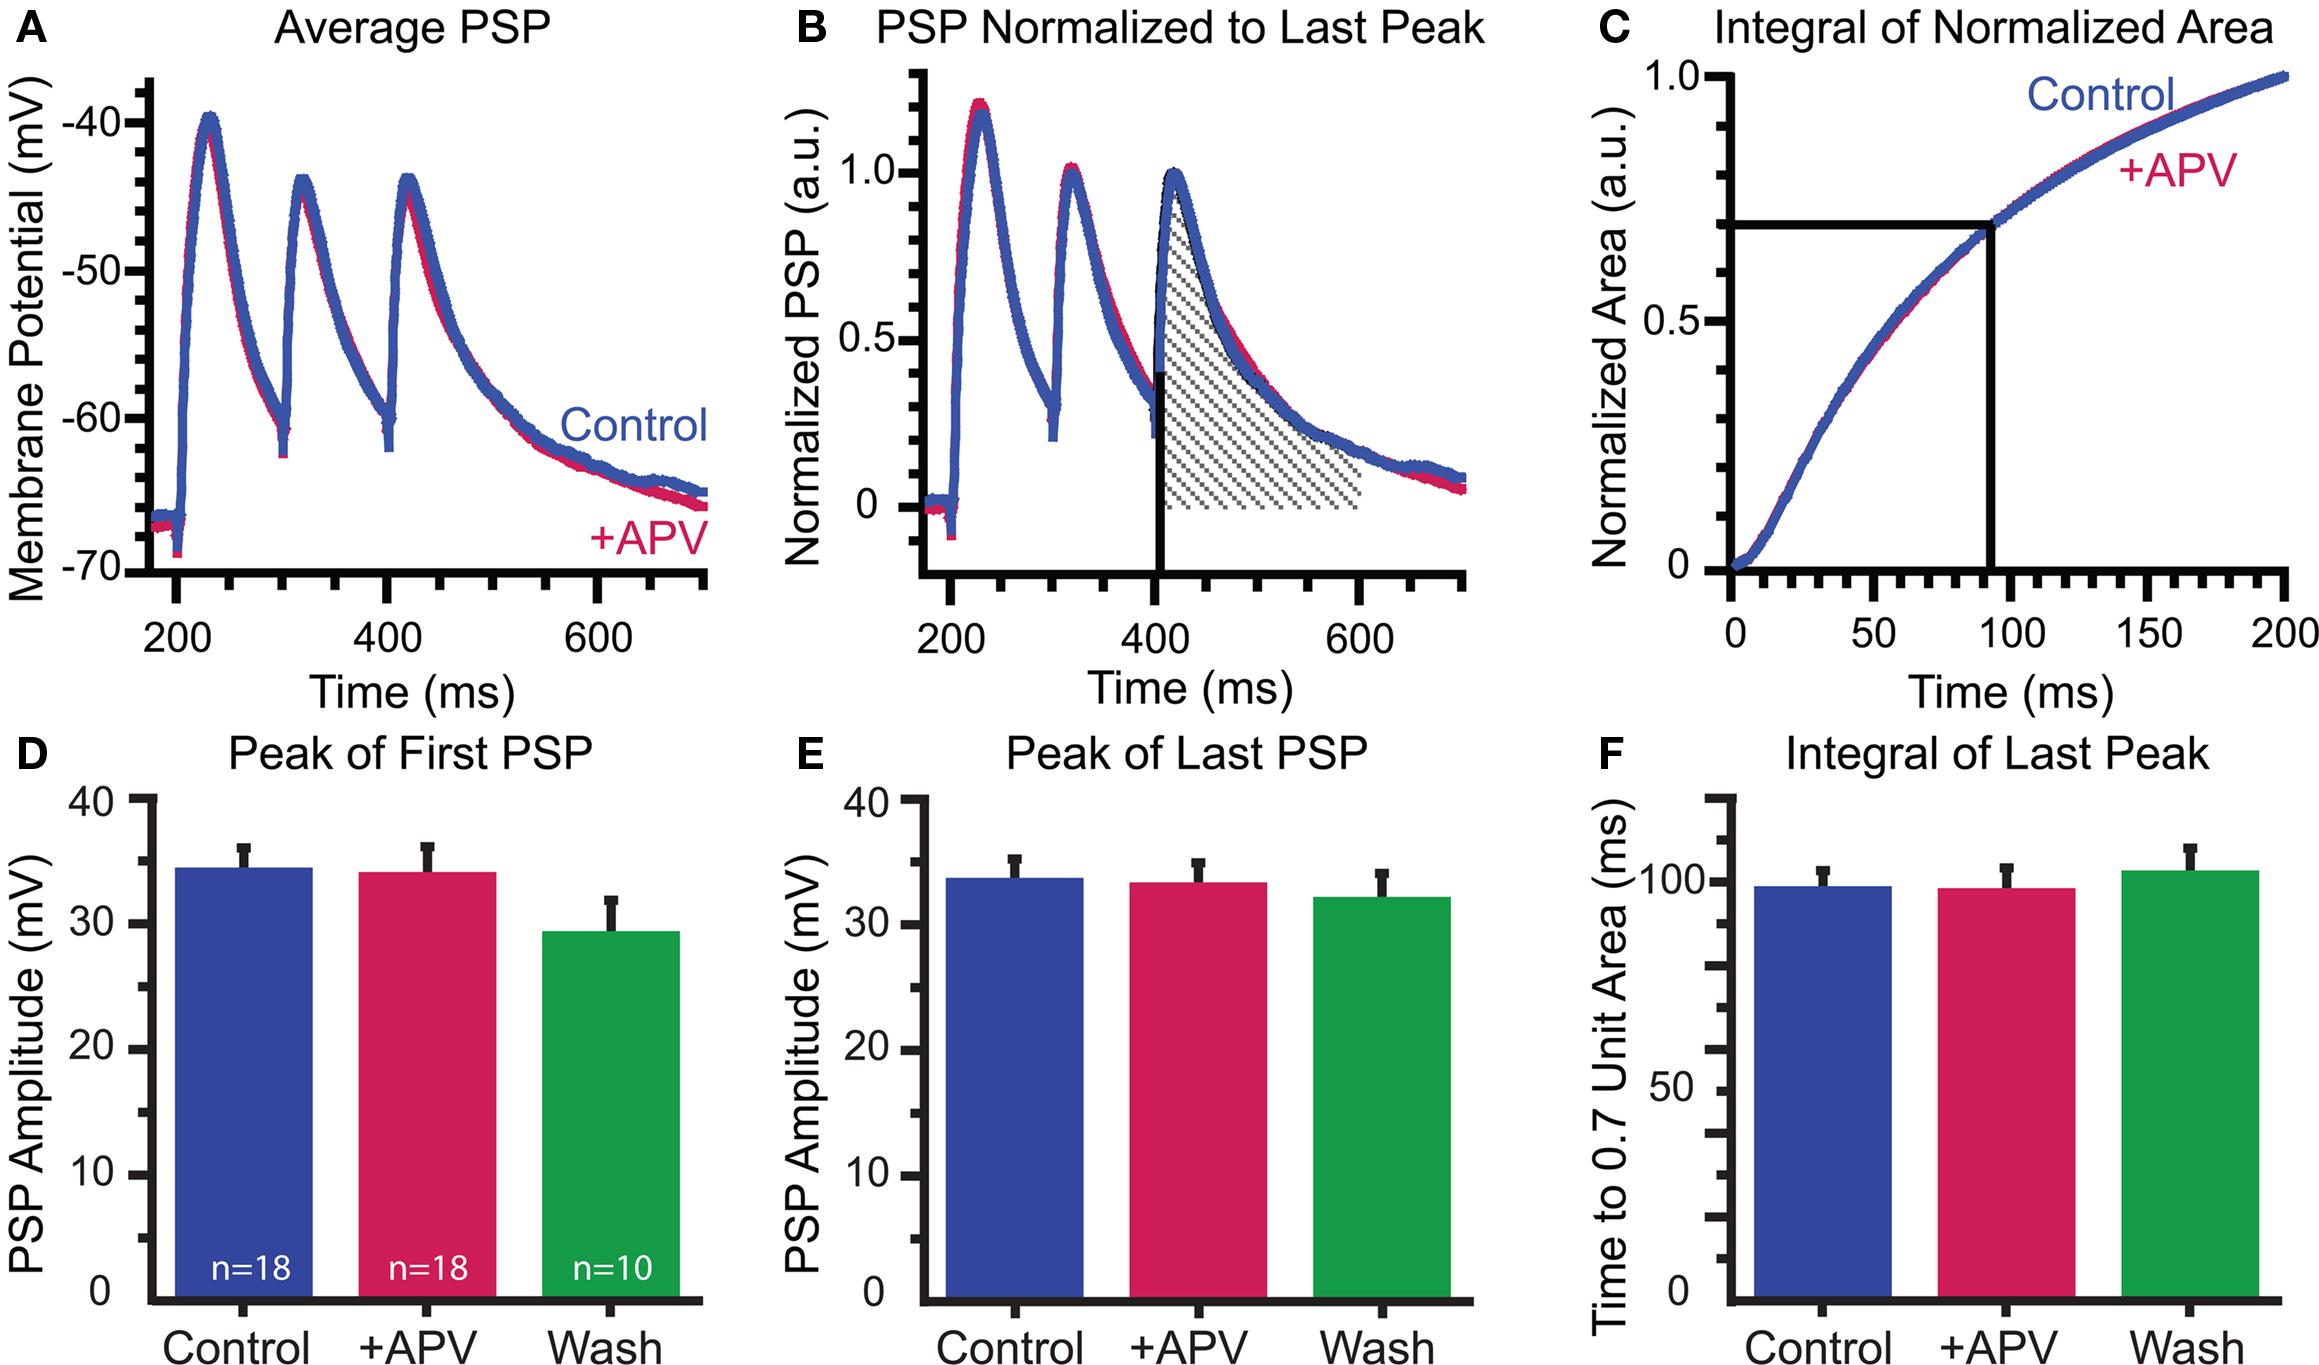
Figure 5. Somatically recorded synaptic potentials are not affected by APV: (A–C) Effect of APV on decay time determined by calculating the unit area of the last PSP (B) and comparing the time to reach 0. 7 unit area in control and drug conditions (C). (D–F) Peaks of first (D) and last (E) PSPs and integral of last peak (F) are consistent throughout recordings.
Somatic Ca2+ Responses with Native Intracellular Cl− Concentration
We next addressed the question of whether MNTB-elicited Ca2+ influx via NMDARs changed during the first postnatal week when MNTB-LSO synapses transition from being depolarizing to hyperpolarizing (Kandler and Friauf, 1995b; Kullmann and Kandler, 2001). To preserve the native intracellular Cl− concentration, LSO neurons were bulk-labeled with Fura-2 AM (Figure 6A). MNTB stimulation in the absence of extracellular Mg2+ elicited robust Ca2+ responses in neurons from animals of all experimental ages (P1–8). These responses were reversibly attenuated or abolished by APV (Figure 6B, upper traces; Figure 7).
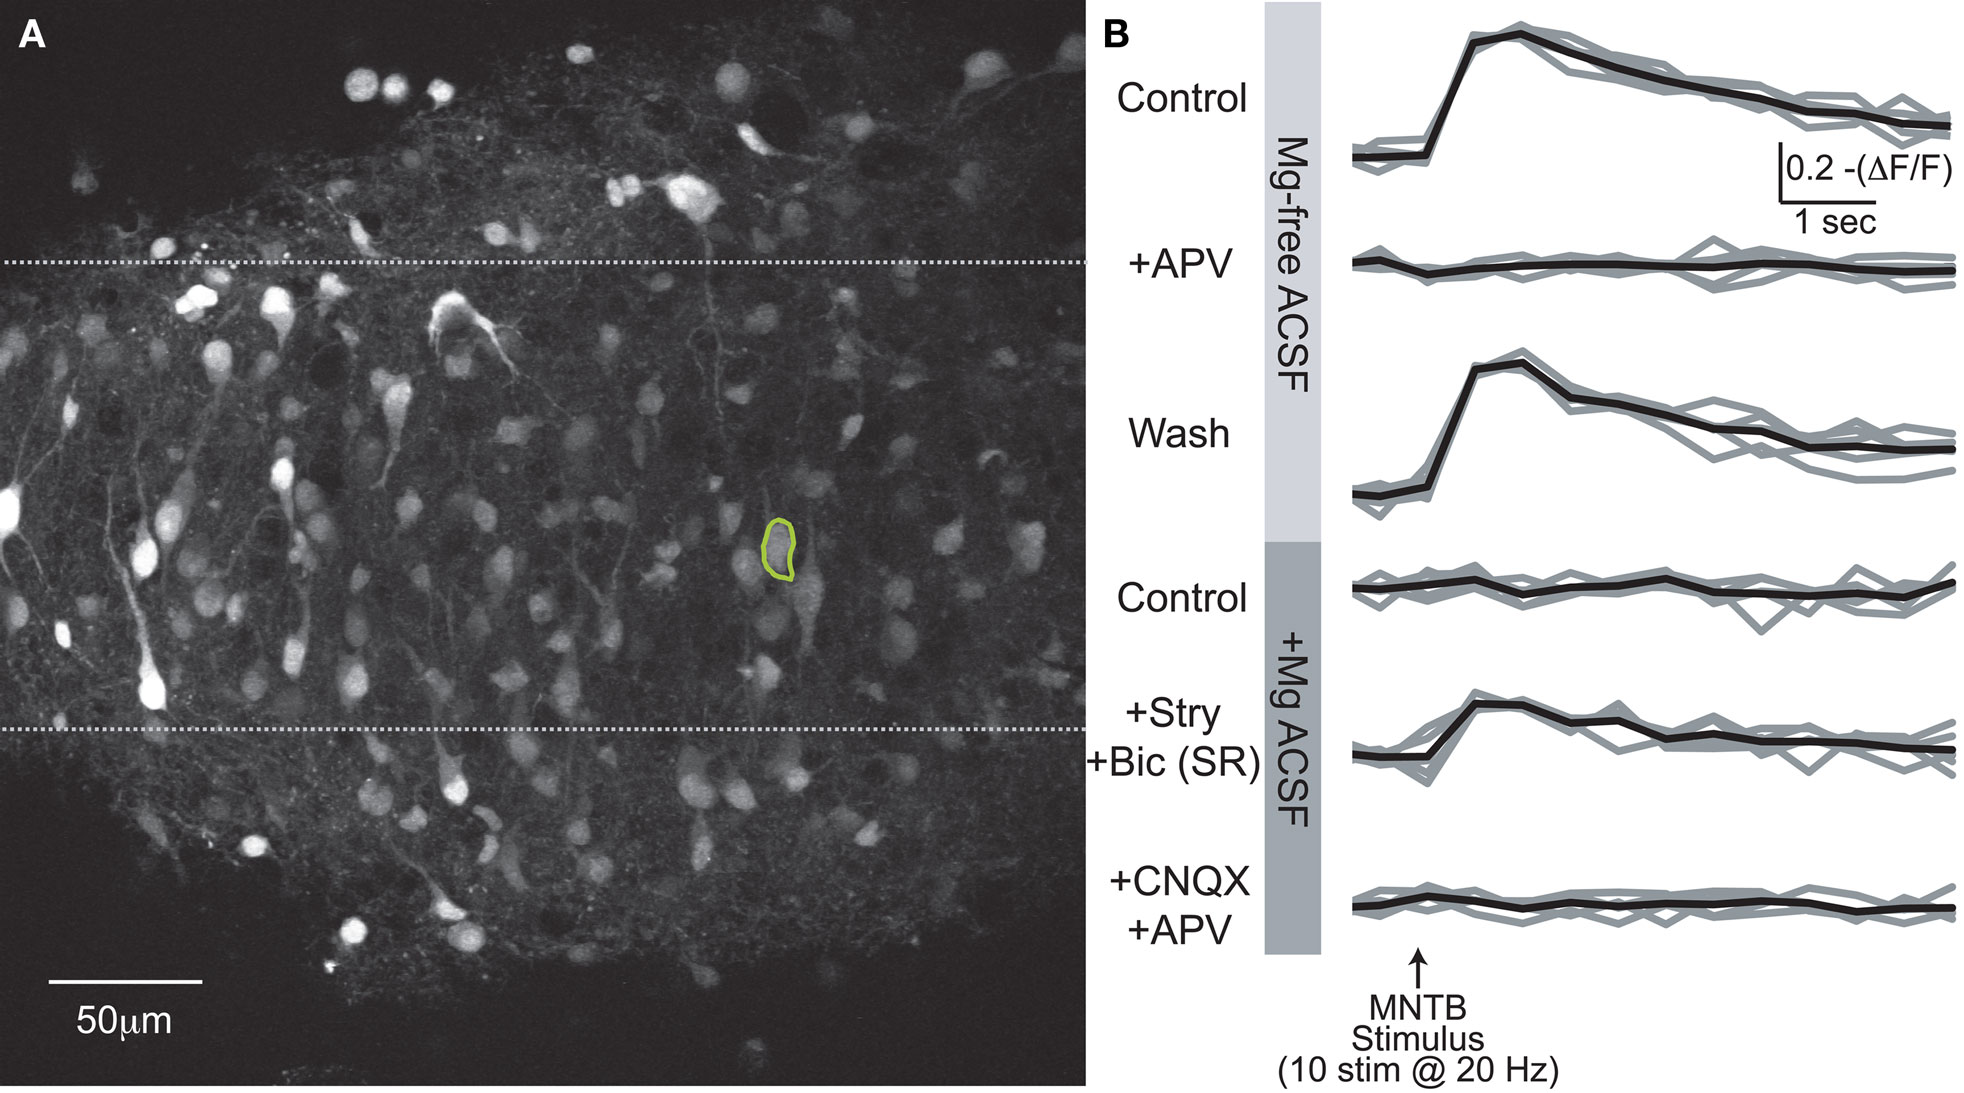
Figure 6. Somatic Ca2+ responses. (A) Compressed z-stack of Fura2-AM stained LSO neurons. (B) Somatic Ca2+ responses from circled cell in (A) for six experimental conditions. Average of five trials/condition in black. In last two conditions, drugs applied additively.
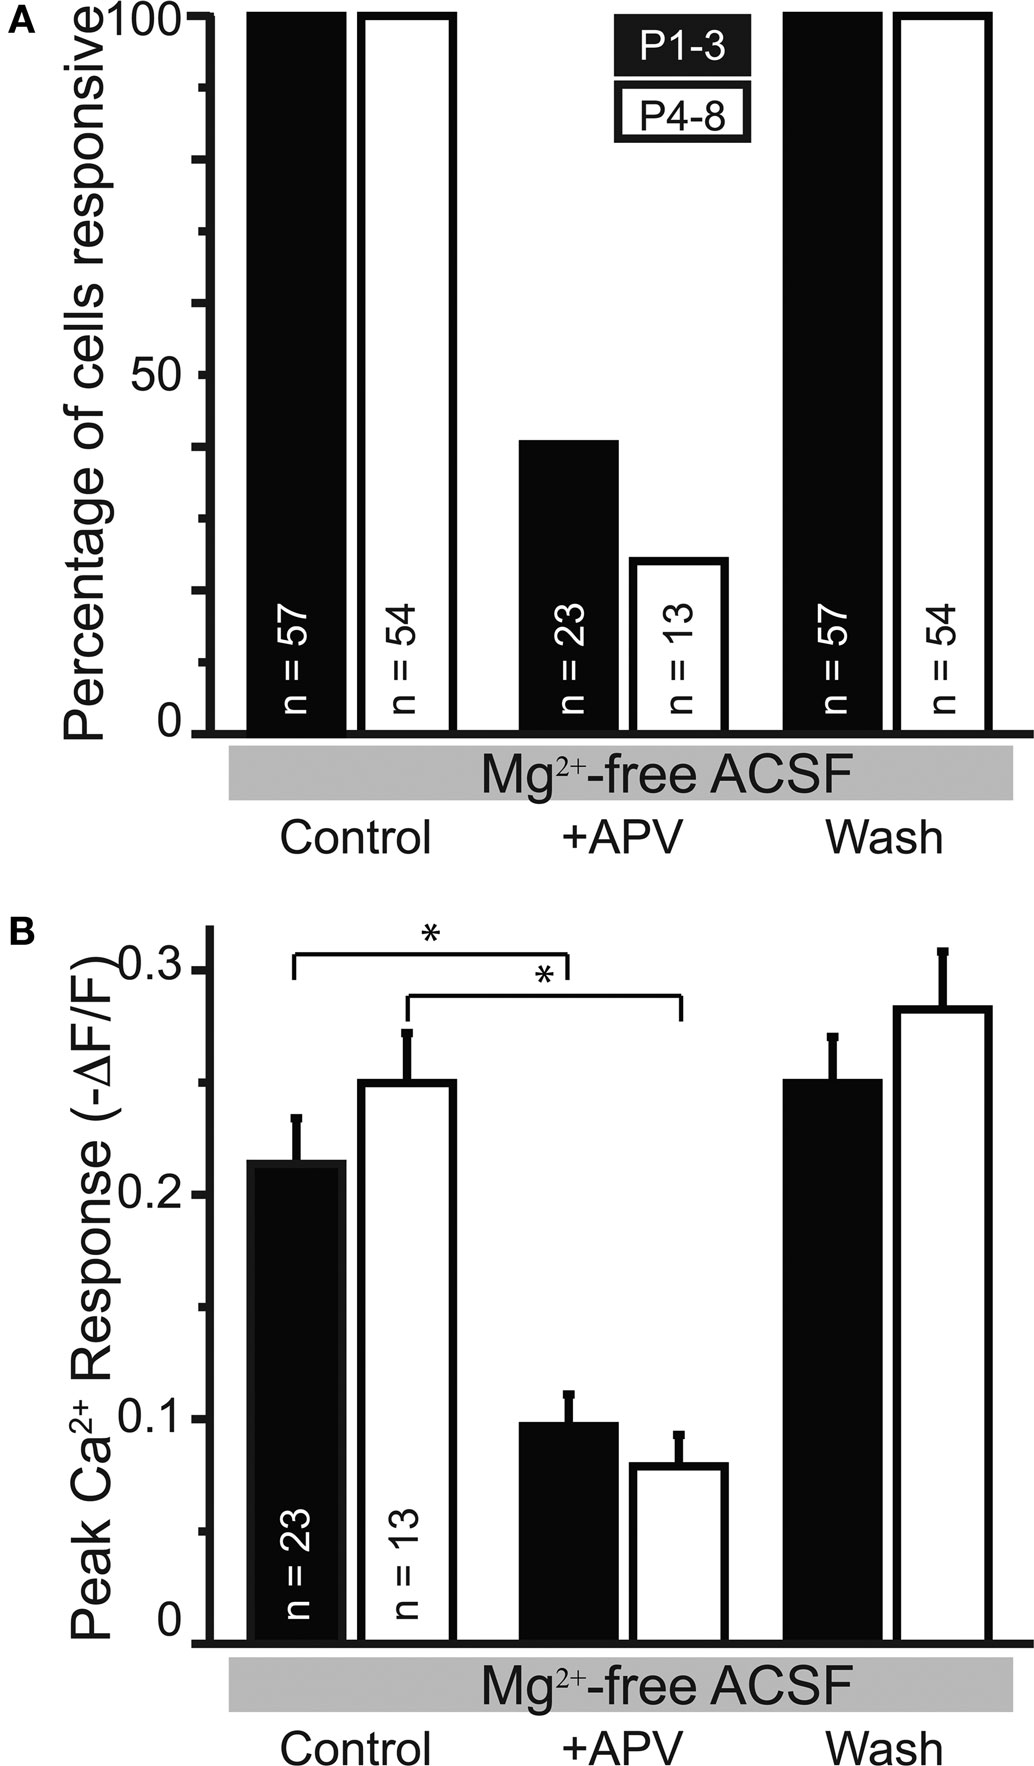
Figure 7. APV-sensitive somatic Ca2+ responses in nominally Mg2+-free ACSF. (A) The percentage of cells responsive to MNTB stimulation following APV application decreased in slices from PI–3 and P4–8 animals. (B) In the cells responsive in APV, the peak amplitude was reduced in APV compared with control conditions in both age groups.
Developmental increase in NMDAR-elicited somatic Ca2+ responses
In the absence of extracellular Mg2+ the peak amplitudes of Ca2+ responses were significantly larger in neurons from animals aged (P4–8) than those from animals aged P1–3 (−ΔF/F = 0.18 ± 0.05, n = 57 cells, five animals; P4–8: 0.27 ± 0.06, n = 54 cells, eight animals; p < 0.0001, KS-test; p < 0.005, t-test; Figure 8A). The average resting fluorescence did not change across age groups in these experiments (average resting fluorescence (a.u.) P1–3 = 1094 ± 46; P4–8 = 1126 ± 34, p > 0.3, t-test). Thus, the increase in peak amplitude is not a result of a smaller “F” in the ΔF/F calculation. The developmental increase of MNTB-LSO synapses to induce somatic, NMDAR-dependent Ca2+ responses appears to be due to either an increase in the recruitment and activation of NMDARs and/or an increase in the membrane excitability of LSO dendrites, perhaps enabling more action potentials per stimulus train and/or permitting more Ca2+ influx through activation of VGCCs.
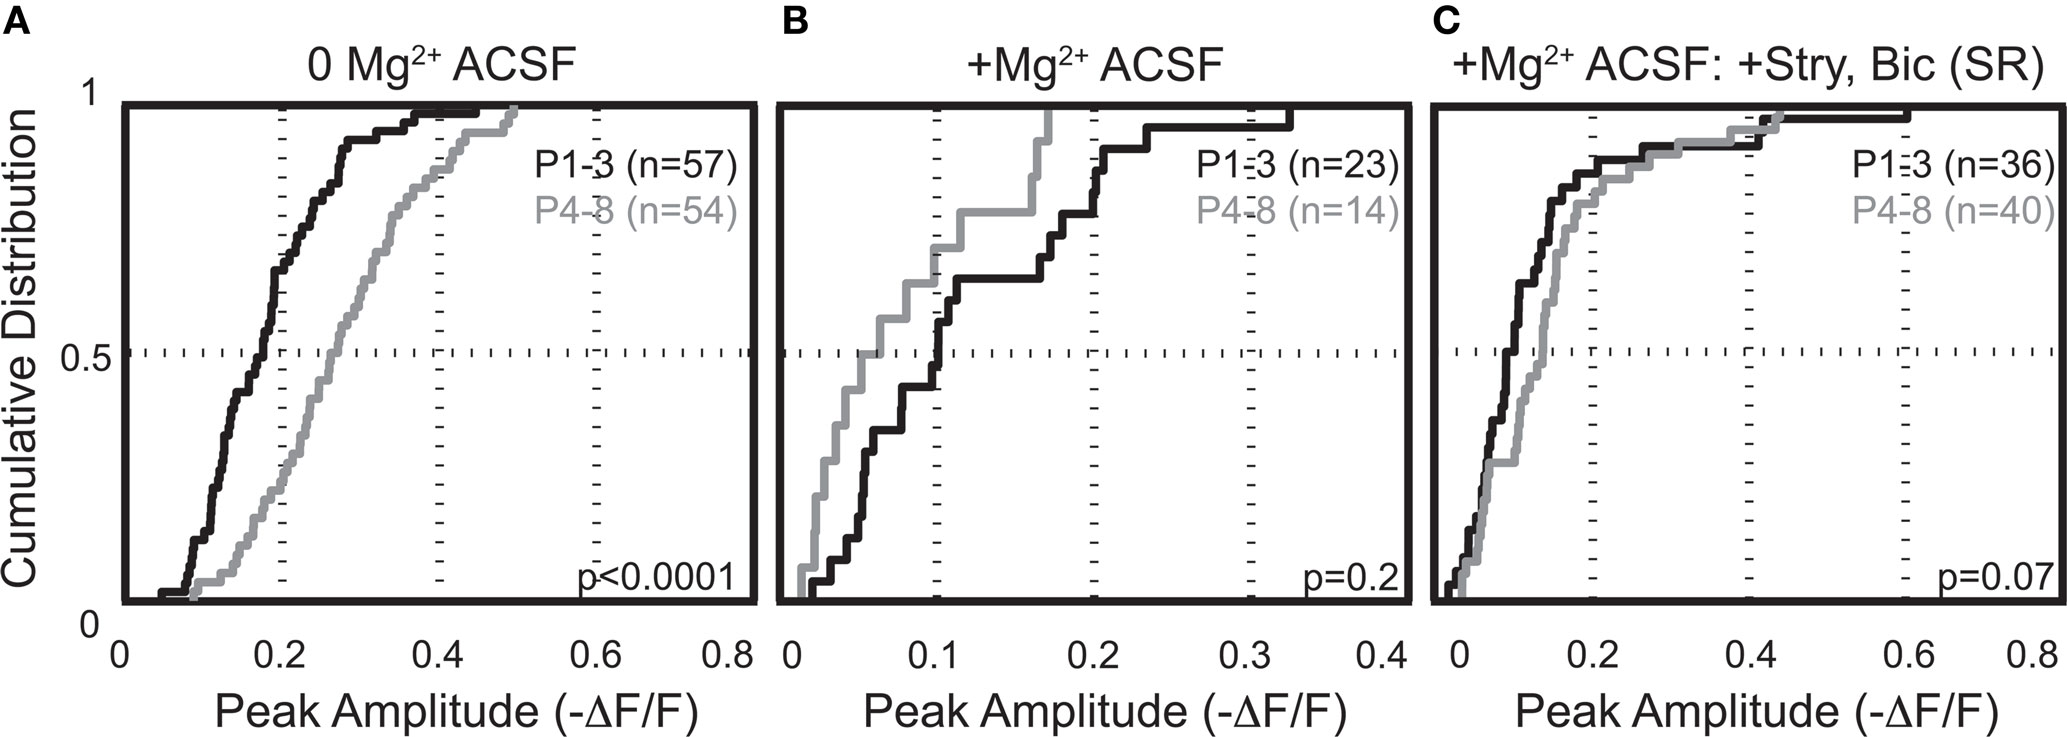
Figure 8. MNTB-elicited somatic Ca2+ responses recorded in 0 Mg2+ (A) increased during the first postnatal week. Responses recorded in physiological Mg2+ with (B) or without (C) glycine/GABAergic conductances are not different developmentally, which suggests a developmental increase in the number of NMDAR-only synapses.
Mg2+-sensitivity of somatic Ca2+ responses
We next investigated the effect of raising extracellular Mg2+ concentration to physiological levels (1.3 mM) on these Ca2+ responses. Physiological Mg2+ abolished Ca2+ responses in 60% (34/57) of neurons at P1–3 and in 74% (39/53) of neurons at P4–8. The percentage of responsive cells was not statistically different between age groups (p > 0.08, Fisher’s exact test). The amplitudes of responses remaining in 1.3 mM Mg2+ were reduced compared with the Mg2+-free control conditions (P1–3: to 47.5 ± 6.6%, n = 23 cells, p < 0.0001, paired t-test; P4–8: to 25.8 ± 5.2%, n = 14 cells; p < 0.0001, Figures 9A,C). The decrease of NMDAR-mediated Ca2+ responses by Mg2+ indicates that glutamate released from GABA/glycinergic MNTB-LSO synapses acts on Mg2+-sensitive NMDARs, which is similar to glutamate released from released “classical” glutamatergic inputs to the LSO from the CN (Ene et al., 2003). In addition, physiological Mg2+ decreased the amplitude of the Ca2+ responses to a larger extent in P4–8 animals than in P1–3 animals (p < 0.02, Wilcoxon rank sum test). The Ca2+ response peaks, however, were similar between neurons from P1–3 and P4–8 animals (Figure 8B). These results suggest that in the older animal group, NMDARs in the LSO are more Mg2+-sensitive or that older LSO neurons contain a higher portion of NMDAR-only (“silent”) MNTB-LSO synapses.
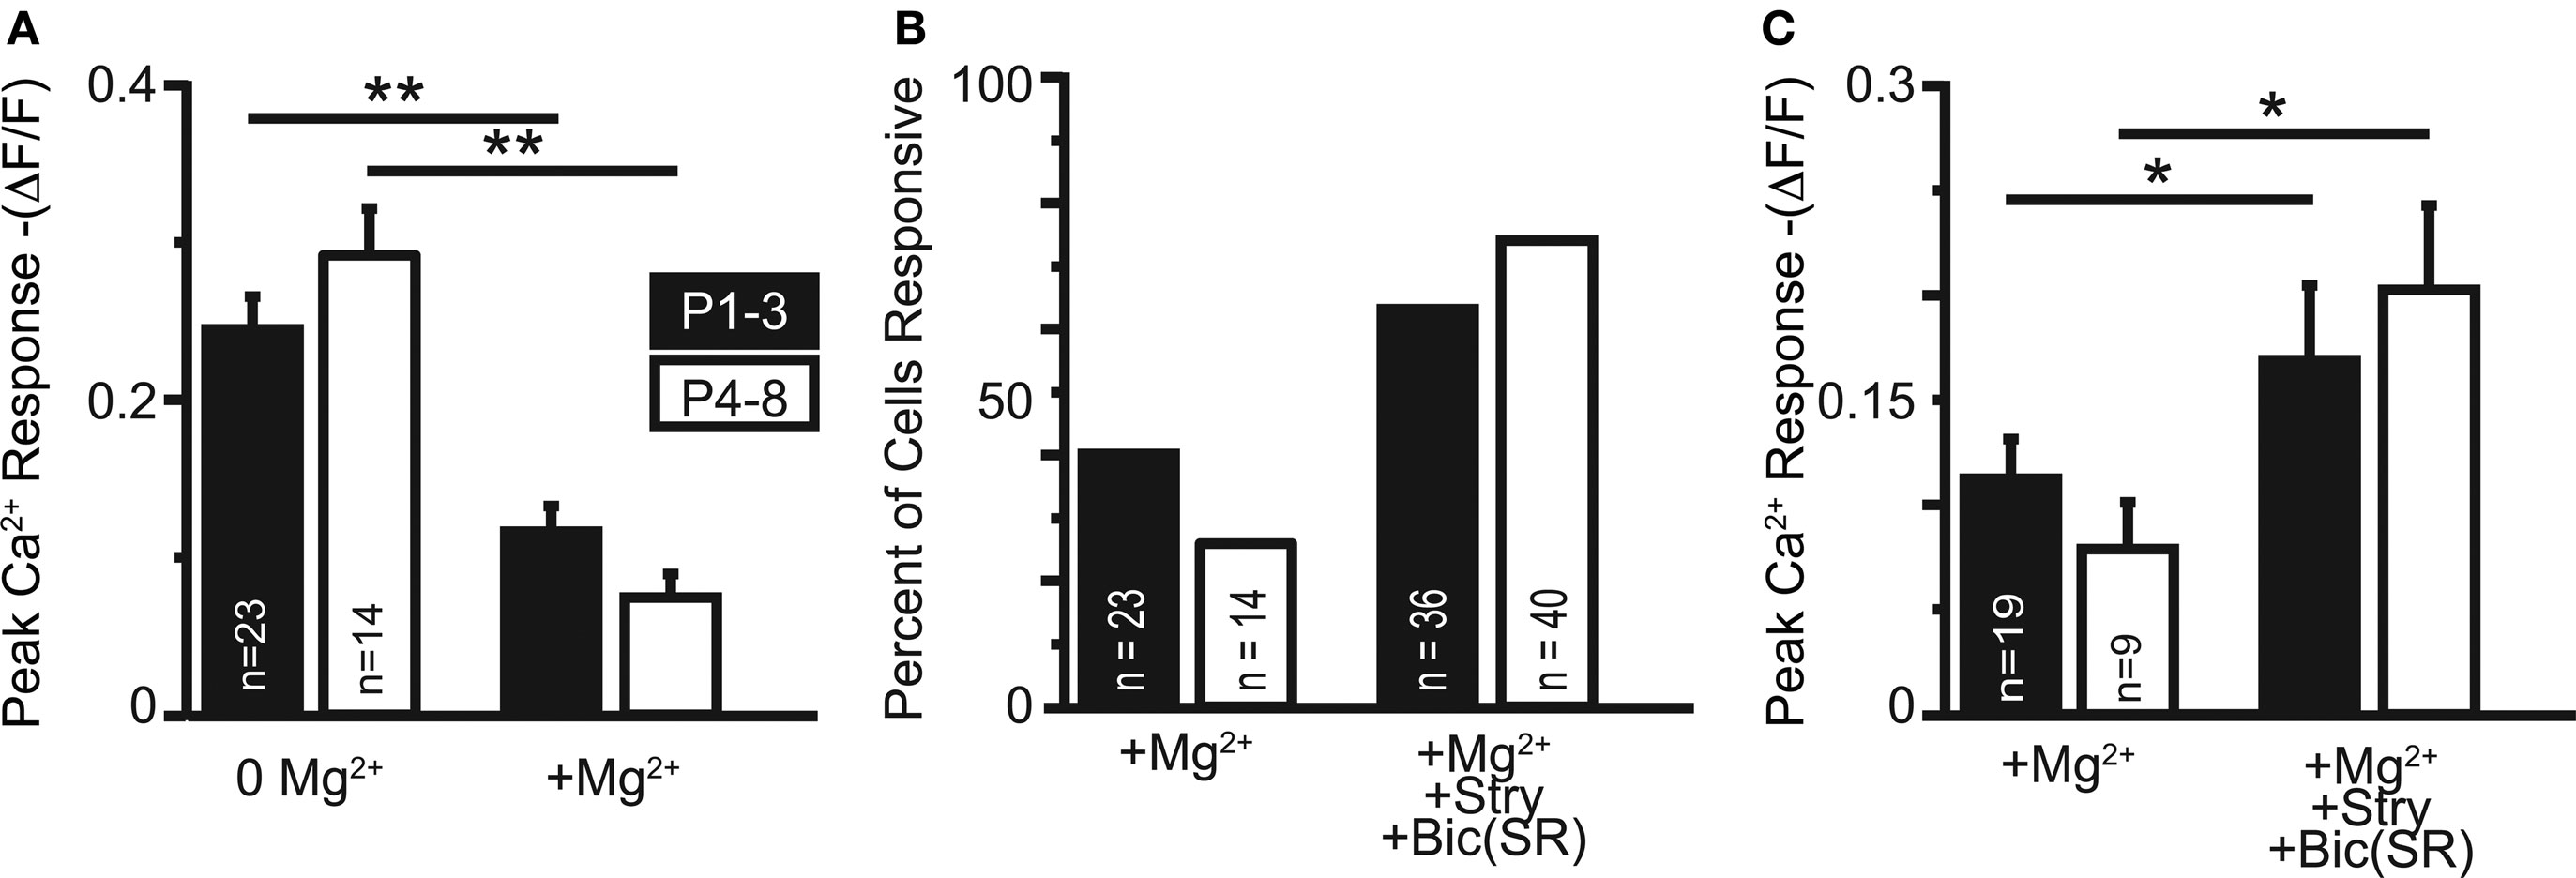
Figure 9. (A) In cells maintaining somatic Ca2+ responses in physiological Mg2+, the responses are significantly reduced (both age groups: p < 0. 001). (B) Application of GlyR and GABAAR antagonists recovered Ca2+ responses in the majority of neurons responsive in 0 Mg2+-ACSF. (C) Ca2+ responses increased in amplitude following application of GlyR and GABAAR antagonists in cells responsive in physiological Mg2+ with and without GlyR and GABAAR antagonists (both age groups: p < 0.05).
GABA/glycinergic shunting of somatic Ca2+ responses
GABA and glycine are depolarizing in the neonatal LSO and become hyperpolarizing around P3/4 to P7/9 (Kullmann and Kandler, 2001; Balakrishnan et al., 2003). To test whether depolarizing GABA/glycine responses are necessary to remove the Mg2+ block from NMDARs, GABAARs and GlyRs were blocked with bicuculline (10 μM) or SR95531 (10 μM) and strychnine (1 μM). Under these conditions, MNTB-elicited Ca2+ responses in normal Mg2+ became significantly larger in both age groups (P1–3: 0.11 ± 0.02 ΔF/F to 0.17 ± 0.04; n = 19 cells, p < 0.05; P4–8: 0.08 ± 0.02 ΔF/F to 0.20 ± 0.04; n = 9 cells, p < 0.02, paired t-tests, Figure 9C), but the amplitudes were similar between age groups (Figure 8C). The percent increase in response was significantly larger in P4–8 animals (p < 0.05, Wilcoxon rank sum test). In addition, many neurons, which became non-responsive after adding extracellular Mg2+, regained their MNTB-elicited Ca2+ responses in the presence of GABAAR and GlyR antagonists (P1–3: increase from 39% to 63.2% responding cells; P4–8, 26% to 74.1% responding cells Figure 9B). These results indicate that in most LSO neurons, GABA and glycine inhibit NMDAR-dependent Ca2+ influx and that this inhibition, likely via shunting of the PSP (Staley and Mody, 1992; Hyson et al., 1995; Lu and Trussell, 2001), is present even during the period when GABA and glycine are still depolarizing. However, in a minority of cells at both age groups [P1–3: 17.4% (4/23 cells); P4–8: 35.7% (5/14 cells)], application of GABAAR and GlyR antagonists eliminated Ca2+ responses, indicating that in these cells, GABAAR and/or GlyR activation underlies the Ca2+ responses either directly via activation of VGCCs or indirectly via removal of Mg2+ block at NMDARs. In these experiments Ca2+ responses were measured from the soma, thus, it remains to be shown whether GABA/glycine shunts glutamatergic MNTB-LSO responses directly or decreases the generation of action potentials in LSO neurons.
Discussion
During the period of functional refinement (Kim and Kandler, 2003), developing MNTB neurons in the auditory brainstem release three different neurotransmitters: glycine, GABA, and glutamate (Gillespie et al., 2005). In this study, we demonstrated that individual or small groups of neighboring MNTB-LSO synapses can elicit locally restricted, dendritic Ca2+ responses in response to subthreshold stimulation. Activation of NMDARs at developing GABA/glycinergic MNTB-LSO synapses can contribute significantly to this dendritic Ca2+ influx although NMDAR-mediated somatic calcium responses are decreased by activation of GABA and glycine receptors.
MNTB-Elicited Ca2+ Responses are Compartmentalized in Aspiny LSO Dendrites
In many neurons, dendritic spines provide the morphological structure for synaptic compartments (see rev. Yuste et al., 2000; Nimchinsky et al., 2002). In aspiny neurons, compartments can be formed by fast kinetics of Ca2+ extrusion pumps, e.g., Na/Ca exchanger (Goldberg et al., 2003), buffering of Ca2+ by Ca2+-binding proteins (CBPs), and by general barriers to small molecule diffusion (Soler-Llavina and Sabatini, 2006). Developing LSO neurons transiently express the Ca2+-binding protein calbindin-D28k with expression levels peaking around P3/4 when calbindin concentrations are especially high in dendritic processes (Friauf, 1993). The high Ca2+ affinity and fast buffering action of calbindin (Nagerl et al., 2000) makes this protein a likely candidate for restricting Ca2+ diffusion along LSO dendrites during the time of synaptic refinement of the MNTB-LSO pathway.
In LSO neurons, the length of the calcium compartments is ∼5 μm, which is larger than the 1–3 μm long compartments in parvalbumin-positive cortical interneurons and cerebellar stellate cells (Goldberg et al., 2003; Soler-Llavina and Sabatini, 2006). Hippocampal calbindin and calretinin positive dendrites receive about one GABAergic synapse every 3.5–5 μm (Gulyas et al., 1999). Assuming a similar synapse density along LSO dendrites, the spatial extent of the Ca2+ compartment that we measured (∼5 μm) could provide isolation of Ca2+-evoked biochemical processes from neighboring inhibitory synapses. Thus, the observed compartmentalization along LSO dendrites seems to be adequate to permit induction of synapse-specific plasticity at individual or closely neighboring MNTB-LSO inputs.
NMDAR-Mediated Ca2+ Influx at Dendritic MNTB-LSO Inputs
Similar to excitatory synapses, many forms of plasticity at inhibitory synapses depend on the activation of NMDARs (Stelzer et al., 1987; Grunze et al., 1996; McLean et al., 1996; Morishita and Sastry, 1996; Wang and Stelzer, 1996; Ouardouz and Sastry, 2000; Marsden et al., 2007; Nugent et al., 2007). In addition, the route of Ca2+ influx can determine the direction of plasticity (Bender et al., 2006; Nevian and Sakmann, 2006). For example, at immature, depolarizing GABAergic synapses in the hippocampus, Ca2+ influx through NMDARs induces long term depression (LTD) while Ca2+ influx through VGCCs induces long term potentiation (LTP) (McLean et al., 1996). In the deep cerebellar nucleus, high frequency simulation elicits NMDAR-dependent LTP (Ouardouz and Sastry, 2000) and lower frequency stimulation elicits l-type Ca2+ channel dependent LTD (Morishita and Sastry, 1996). It remains to be determined whether such bidirectional control of plasticity is also present at immature MNTB-LSO synapses. Currently, only one form of activity-dependent plasticity, LTD, has been described for the developing LSO and this form of LTD is independent of glutamate receptor activation (Kotak and Sanes, 2000).
In addition to participating in topographic refinement, it was hypothesized that glutamatergic signaling at developing MNTB-LSO synapses may also be involved in the subcellular reorganization of inhibitory inputs. In the medial superior olive, a sound localization nucleus that receives prominent inhibition from the MNTB, inhibitory synapses are initially located throughout the dendritic tree but with development become concentrated at the soma and proximal dendrites (Kapfer et al., 2002). A similar reorganization may also occur in LSO neurons as suggested by immunohistochemical studies that indicated an age-dependent perisomatic concentration of glycine receptors (Friauf et al., 1997). This is consistent with results from electron microscope studies, which demonstrated that the majority of inhibitory inputs to mature LSO neurons are found proximal to excitatory inputs (Cant, 1984; Helfert et al., 1992). Our results from this study, however, do not support the notion that the magnitude of Ca2+ responses or the amount of NMDAR contribution to the Ca2+ responses provides an instructive signal that ultimately leads to the elimination of distal synapses and the maintenance or strengthening of proximal ones.
NMDAR-Mediated Somatic Ca2+ Responses in LSO Neurons with Native Intracellular Cl−
To test the question of whether depolarizing GABA/glycine responses are necessary for removing the voltage-dependent Mg2+ block from NMDARs, thus allowing their activation by MNTB-LSO synapses, we labeled LSO neurons with Fura-2 AM to retain the native intracellular Cl− concentration. In Mg2+-free solution, we observed a developmental increase in NMDAR-elicited Ca2+ influx. Interestingly, this age-dependent difference was abolished by raising Mg2+ concentrations to physiological levels which may indicate a developmental increase in NMDAR-only (silent) synapses. In several glutamatergic systems a transition to AMPAR-lacking, NMDAR-only synapses is considered to represent an early step toward synapse elimination (Hanse et al., 2009). The developmental increase in NMDAR-only MNTB-LSO synapses may thus reflect an increase in synapses that have entered the process of elimination. Additionally or alternatively, this increase may reflect a developmental increase in spike generation and dendritic excitability which decreases removal of Mg-block at dendritic sites (Sanes, 1993; Kandler and Friauf, 1995a).
Increasing extracellular Mg2+ concentration to physiological levels (1.3 mM) significantly decreased both the number of responding neurons as well as the amplitude of remaining responses indicating that glutamate released from MNTB-LSO synapses acts primarily on Mg2+-sensitive NMDARS. The decrease was slightly more pronounced at P4–8 than at P1–3 but this age-dependent difference cannot be explained by the age-dependent transition from depolarizing to hyperpolarizing GABA/glycine responses (Kandler and Friauf, 1995b; Kullmann and Kandler, 2001) because at both ages GABAA and glycine receptor antagonists increased rather than decreased the MNTB-elicited calcium responses in the majority of cells. This suggests that at least for somatic calcium responses, the predominant effect of GABA and glycine is to decrease the activation of NMDARs perhaps by shunting, similar to the inhibitory effect of GABAergic conductances in other systems (Staley and Mody, 1992; Hyson et al., 1995; Lu and Trussell, 2001). It should be noted that because somatic calcium responses in LSO neurons most likely reflect the presence of action potentials (MacLean and Yuste, 2009), GABA and glycine may inhibit NMDAR activation more indirectly by shunting backpropagating action potentials (Kullmann and Kandler, 2008) which can relief the Mg2+ block from dendritic NMDARs (Nevian and Sakmann, 2004). Thus, with respect to NMDAR activation, GABA and glycine may have dual functions in the LSO by promoting the activation of NMDAR-mediated dendritic calcium influx with subthreshold stimulation but diminishing large somatic calcium responses accompanying NMDAR activation by suprathreshold inputs.
Author Contribution
Abigail Kalmbach and Karl Kandler designed and Abigail Kalmbach built the custom 2-P imaging system. Paul Kullmann and Karl Kandler designed experiments and Paul Kullmann collected and analyzed data for Figure 1. Abigail Kalmbach and Karl Kandler designed experiments and Abigail Kalmbach collected and analyzed data for Figures 2–9. Abigail Kalmbach and Karl Kandler wrote the manuscript.
Conflict of Interest Statement
The authors declare that the research was conducted in the absence of any commercial or financial relationships that could be construed as a potential conflict of interest.
Acknowledgments
Work supported by NIDCD grant (DC 04199 to Karl Kandler) and Ruth L. Kirschstein NRSA grant (DC 08938 to Abigail Kalmbach).
References
Balakrishnan, V., Becker, M., Lohrke, S., Nothwang, H. G., Guresir, E., and Friauf, E. (2003). Expression and function of chloride transporters during development of inhibitory neurotransmission in the auditory brainstem. J. Neurosci. 23, 4134–4145.
Bender, V. A., Bender, K. J., Brasier, D. J., and Feldman, D. E. (2006). Two coincidence detectors for spike timing-dependent plasticity in somatosensory cortex. J. Neurosci. 26, 4166–4177.
Boudreau, J. C., and Tsuchitani, C. (1968). Binaural interaction in the cat superior olive S segment. J. Neurophysiol. 31, 442–454.
Caicedo, A., Kungel, M., Pujol, R., and Friauf, E. (1998). Glutamate-induced Co2+ uptake in rat auditory brainstem neurons reveals developmental changes in Ca2+ permeability of glutamate receptors. Eur. J. Neurosci. 10, 941–954.
Cant, N. B. (1984). The fine structure of the lateral superior olivary nucleus of the cat. J. Comp. Neurol. 227, 63–77.
Cant, N. B., and Casseday, J. H. (1986). Projections from the anteroventral cochlear nucleus to the lateral and medial superior olivary nuclei. J. Comp. Neurol. 247, 457–476.
Ehrlich, I., Lohrke, S., and Friauf, E. (1999). Shift from depolarizing to hyperpolarizing glycine action in rat auditory neurones is due to age-dependent Cl− regulation. J. Physiol. (Lond). 520, 121–137.
Ene, F. A., Kullmann, P. H. M., Gillespie, D. C., and Kandler, K. (2003). Glutamatergic calcium responses in the developing lateral superior olive: receptor types and their specific activation by synaptic activity patterns. J. Neurophysiol. 90, 2581–2591.
Friauf, E. (1993). Transient appearance of calbindin-D28k-positive neurons in the superior olivary complex of developing rats. J. Comp. Neurol. 334, 59–74.
Friauf, E., Hammerschmidt, B., and Kirsch, J. (1997). Development of adult-type inhibitory glycine receptors in the central auditory system of rats. J. Comp. Neurol. 385, 117–134.
Gillespie, D. C., Kim, G., and Kandler, K. (2005). Inhibitory synapses in the developing auditory system are glutamatergic. Nat. Neurosci. 8, 332–338.
Goldberg, J. H., Tamas, G., Aronov, D., and Yuste, R. (2003). Calcium microdomains in aspiny dendrites. Neuron 40, 807–821.
Grunze, H. C., Rainnie, D. G., Hasselmo, M. E., Barkai, E., Hearn, E. F., McCarley, R. W., and Greene, R. W. (1996). NMDA-dependent modulation of CA1 local circuit inhibition. J. Neurosci. 16, 2034–2043.
Gulyas, A. I., Megias, M., Emri, Z., and Freund, T. F. (1999). Total number and ratio of excitatory and inhibitory synapses converging onto single interneurons of different types in the CA1 area of the rat hippocampus. J. Neurosci. 19, 10082–10097.
Hanse, E., Taira, T., Lauri, S., and Groc, L. (2009). Glutamate synapse in developing brain: an integrative perspective beyond the silent state. Trends Neurosci. 32, 532–537.
Helfert, R. H., Juiz, J. M., Bledsoe, S. C. Jr., Bonneau, J. M., Wenthold, R. J., and Altschuler, R. A. (1992). Patterns of glutamate, glycine, and GABA immunolabeling in four synaptic terminal classes in the lateral superior olive of the guinea pig. J. Comp. Neurol. 323, 305–325.
Hyson, R. L., Reyes, A. D., and Rubel, E. W. (1995). A depolarizing inhibitory response to GABA in brainstem auditory neurons of the chick. Brain Res. 677, 117–126.
Kandler, K., and Friauf, E. (1995a). Development of electrical membrane properties and discharge characteristics of superior olivary complex neurons in fetal and postnatal rats. Eur. J. Neurosci. 7, 1773–1790.
Kandler, K., and Friauf, E. (1995b). Development of glycinergic and glutamatergic synaptic transmission in the auditory brainstem of perinatal rats. J. Neurosci. 15, 6890–6904.
Kapfer, C., Seidl, A., Schweizer, H., and Grothe, B. (2002). Experience-dependent refinement of inhibitory inputs to auditory coincidence-detector neurons. Nat. Neurosci. 5, 247–253.
Kim, G., and Kandler, K. (2003). Elimination and strengthening of glycinergic/GABAergic connections during tonotopic map formation. Nat. Neurosci. 6, 282–290.
Kotak, V. C., Korada, S., Schwartz, I. R., and Sanes, D. H. (1998). A developmental shift from GABAergic to glycinergic transmission in the central auditory system. J. Neurosci. 18, 4646–4655.
Kotak, V. C., and Sanes, D. H. (2000). Long-lasting inhibitory synaptic depression is age- and calcium-dependent. J. Neurosci. 20, 5820–5826.
Kullmann, P. H., Ene, F. A., and Kandler, K. (2002). Glycinergic and GABAergic calcium responses in the developing lateral superior olive. Eur. J. Neurosci. 15, 1093–1104.
Kullmann, P. H. M., and Kandler, K. (2001). Glycinergic/GABAergic synapses in the lateral superior olive are excitatory in neonatal C57Bl/6J mice. Dev. Brain Res. 131, 143–147.
Kullmann, P. H. M., and Kandler, K. (2008). Dendritic Ca2+ responses in neonatal lateral superior olive neurons elicited by glycinergic/GABAergic synapses and action potentials. Neuroscience 154, 338–345.
Lu, T., and Trussell, L. O. (2001). Mixed excitatory and inhibitory GABA-mediated transmission in chick cochlear nucleus. J. Physiol. 535, 125–131.
MacLean, J., and Yuste, R. (2009). Imaging action potentials with calcium indicators. Cold Spring Harb. Protoc. 11. doi: 10.1101/pdb.prot5316.
Marsden, K. C., Beattie, J. B., Friedenthal, J., and Carroll, R. C. (2007). NMDA receptor activation potentiates inhibitory transmission through GABA receptor-associated protein-dependent exocytosis of GABAA receptors. J. Neurosci. 27, 14326–14337.
McLean, H., Caillard, O., Ben-Ari, Y., and Gaiarsa, J.-L. (1996). Bidirectional plasticity expressed by GABAergic synapses in the neonatal rat hippocampus. J. Physiol. (Lond). 496, 471–477.
Morishita, W., and Sastry, B. R. (1996). Postsynaptic mechanisms underlying long-term depression of GABAergic transmission in neurons of the deep cerebellar nuclei. J. Neurophysiol. 76, 59–68.
Nabekura, J., Katsurabayashi, S., Kakazu, Y., Shibata, S., Matsubara, A., Jinno, S., Mizoguchi, Y., Sasaki, A., and Ishibashi, H. (2004). Developmental switch from GABA to glycine release in single central synaptic terminals. Nat. Neurosci. 7, 17–23.
Nagerl, U. V., Novo, D., Mody, I., and Vergara, J. L. (2000). Binding kinetics of calbindin-D28k determined by flash photolysis of caged Ca2+. Biophys. J. 79, 3009–3018.
Nevian, T., and Sakmann, B. (2004). Single spine Ca2+ signals evoked by coincident EPSPs and backpropagating action potentials in spiny stellate cells of layer 4 in the juvenile rat somatosensory barrel cortex. J. Neurosci. 24, 1689–1699.
Nevian, T., and Sakmann, B. (2006). Spine Ca2+ signaling in spike-timing-dependent plasticity. J. Neurosci. 26, 11001–11013.
Nikolenko, V., Nemet, B., and Yuste, R. (2003). A two-photon and second-harmonic microscope. Methods 30, 3–15.
Nimchinsky, E. A., Sabatini, B. L., and Svoboda, K. (2002). Structure and function of dendritic spines. Annu. Rev. Physiol. 64, 313–353.
Noh, J., Seal, R. P., Garver, J. A., Edwards, R. H., and Kandler, K. (2010). Glutamate co-release at GABA/glycinergic synapses is crucial for the refinement of an inhibitory map. Nat. Neurosci. 13, 232–238.
Nowak, L., Begestovski, P., Ascher, P., Herbet, A., and Prochiantz, A. (1984). Magnesium gates glutamate-activated channels in mouse central neurones. Nature 307, 462–465.
Nugent, F., Penick, E., and Kauer, J. A. (2007). Opiods block long-term potentiation of inhibitory synapses. Nature 446, 1086–1090.
Ouardouz, M., and Sastry, B. R. (2000). Mechanisms underlying LTP of inhibitory synaptic transmission in the deep cerebellar nuclei. J. Neurophysiol. 84, 1414–1421.
Sanes, D. (1993). The development of synaptic function and integration in the central auditory system. J. Neurosci. 13, 2627–2637.
Sanes, D., and Rubel, E. (1988). The ontogeny of inhibition and excitation in the gerbil lateral superior olive. J. Neurosci. 8, 682–700.
Seal, R. P., Akil, O., Yi, E., Weber, C. M., Grant, L., Yoo, J., Clause, A., Kandler, K., Noebels, J. L., Glowatzki, E., Lustig, L. R., and Edwards, R. H. (2008). Sensorineural deafness and seizures in mice lacking vesicular glutamate transporter 3. Neuron 57, 263–275.
Soler-Llavina, G. J., and Sabatini, B. L. (2006). Synapse-specific plasticity and compartmentalized signaling in cerebellar stellate cells. Nat. Neurosci. 9, 798–806.
Staley, K. J., and Mody, I. (1992). Shunting of excitatory input to dentate gyrus granule cells by a depolarizing GABAA receptor-mediated postsynaptic conductance. J. Neurophysiol. 68, 197–212.
Stelzer, A., Slater, N., and ten Bruggencate, G. (1987). Activation of NMDA receptors blocks GABAergic inhibition in an in vitro model of epilepsy. Nature 326, 698–701.
Tollin, D. J. (2003). The lateral superior olive: a functional role in sound source localization. Neuroscientist 9, 127–143.
Keywords: lateral superior olive, medial nucleus of the trapezoid body, calcium imaging, auditory brainstem, VGLUT3, refinement
Citation: Kalmbach A, Kullmann P and Kandler K (2010) NMDAR-mediated calcium transients elicited by glutamate co-release at developing inhibitory synapses. Front. Syn. Neurosci. 2:27. doi: 10.3389/fnsyn.2010.00027
Received: 12 March 2010;
Paper pending published: 12 April 2010;
Accepted: 11 June 2010;
Published online: 07 July 2010
Edited by:
Susana Cohen-Cory, University of California, USAReviewed by:
Anna Magnusson, Karolinska Institutet, SwedenCopyright: © 2010 Kalmbach, Kullmann and Kandler. This is an open-access article subject to an exclusive license agreement between the authors and the Frontiers Research Foundation, which permits unrestricted use, distribution, and reproduction in any medium, provided the original authors and source are credited.
*Correspondence: Karl Kandler, Department of Otolaryngology, University of Pittsburgh School of Medicine, Biomedical Science Tower 3, Rm 10016, 3501 Fifth Avenue, Pittsburgh, PA 1526, USA. e-mail:a2thcmxAcGl0dC5lZHU=