- 1 Department of Physiology and Biophysics, University of Mississippi Medical Center, Jackson, MS, USA
- 2 Department of Emergency Medicine, University of Mississippi Medical Center, Jackson, MS, USA
- 3 University of Medicine and Pharmacy “Gr. T. Popa”, Iasi, Romania
Mathematical models and simulations are important tools in discovering key causal relationships governing physiological processes. Simulations guide and improve outcomes of medical interventions involving complex physiology. We developed HumMod, a Windows-based model of integrative human physiology. HumMod consists of 5000 variables describing cardiovascular, respiratory, renal, neural, endocrine, skeletal muscle, and metabolic physiology. The model is constructed from empirical data obtained from peer-reviewed physiological literature. All model details, including variables, parameters, and quantitative relationships, are described in Extensible Markup Language (XML) files. The executable (HumMod.exe) parses the XML and displays the results of the physiological simulations. The XML description of physiology in HumMod’s modeling environment allows investigators to add detailed descriptions of human physiology to test new concepts. Additional or revised XML content is parsed and incorporated into the model. The model accurately predicts both qualitative and quantitative changes in clinical and experimental responses. The model is useful in understanding proposed physiological mechanisms and physiological interactions that are not evident, allowing one to observe higher level emergent properties of the complex physiological systems. HumMod has many uses, for instance, analysis of renal control of blood pressure, central role of the liver in creating and maintaining insulin resistance, and mechanisms causing orthostatic hypotension in astronauts. Users simulate different physiological and pathophysiological situations by interactively altering numerical parameters and viewing time-dependent responses. HumMod provides a modeling environment to understand the complex interactions of integrative physiology. HumMod can be downloaded at http://hummod.org
Introduction
Mathematical simulations of physiological processes are an important tool in understanding normal and pathophysiological processes within the body. There are numerous physiological simulations, ranging from detailed simulation of cardiac metabolism during cardiac ischemia (Beard, 2006) to microcirculatory hemodynamics in vascular networks (Secomb et al., 2007) and publications describing mathematical simulations of individual organ systems. Unfortunately, despite numerous efforts around the world to develop integrative models, there are no comprehensive models demonstrating integration across different organ systems or “physiomes.”
The International Union of Physiological Sciences (IUPS) Physiome Project provides software for computational models of cell function and software to interact with organ models. The SimBios project aims for multi-scale modeling, focusing on RNA folding, protein folding, neuromuscular dynamics, drug target dynamics, and neural prosthetic interactions. The SAPHIR Project, supported by the French National Research Agency, hopes to develop a comprehensive modeling environment around regulation of blood pressure and body fluids. These projects have not been able to integrate physiological responses across different organs.
In the late 1960s, Guyton and Coleman demonstrated the use of computer simulations for education and the development and testing of hypotheses concerning physiological systems (Guyton and Coleman, 1969; Guyton et al., 1972). Two well known historical models of integrative physiology are the Guyton model of 1972 (Guyton et al., 1972) and the Coleman HUMAN model (Coleman and Randall, 1983).
HUMAN is available at Skidmore College, where it is used as a web-based teaching tool http://placid.skidmore.edu/human/index.php. Quantitative circulatory physiology (QCP) is an extension of HUMAN that was developed at the University of Mississippi Medical Center by Dr. Thomas Coleman (Abram et al., 2007). QCP incorporates cardiovascular, renal, respiratory, endocrine, and nervous systems. QCP is written and compiled in C++, which limits the ability to change or add equations. To overcome this limitation we developed HumMod. This paper describes HumMod, an integrative model of human physiology, and its use as a modeling environment.
Materials and Methods
HumMod includes a series of files describing physiology, display characteristics of the simulations, and an executable file (HumMod.exe). The executable file is written in C++ using standard libraries. The compiled code generates a fast Extensible Markup Language (XML) parser, a numerical solver for algebraic and differential equations, and a screen updater. The executable runs in Windows and allows the XML representation of the model to be solved and displayed to the user.
XML Structure Files and Schema
For organizational purposes, the XML files describing the physiological responses are located in a folder called “Structure”. The Structure folder contains a series of subfolders containing files with a .DES filename extension. These files contain physiological descriptors characterizing organs or physiological responses. Placing physiological equations in the Structure folder simplifies finding particular files.
The .DES files are XML files. XML files are simple text files that may be edited in any text editor. Further, XML is generic because the writer defines a paradigm or schema detailing types, arrangement, and handling of data (Harold and Means, 2004).
A basic knowledge of XML is necessary to understand the HumMod schema. XML uses names in angle brackets (< and >) to identify data. The names and brackets form a tag. Data in a tag-data-tag sequence is an element. The data within an element is content. An XML document is a collection of nested and parallel elements that are enclosed by a unique top element, which is the root element. All parts of the document are not required in every file, which allows complex physiological responses to be split into smaller, more manageable segments. These segments are then assimilated together at run-time. HumMod involves some 2900 files.
Model components in HumMod that require a unique identifier have local and global names. Local names are the data between the tags <name> Local Name </name>. Global names are derived from the file name that defines the element and the local name to yield File.LocalName. For example, the local element ElapsedTime in the Exercise file has the global name Exercise.ElapsedTime. Names begin with letters and cannot contain spaces or special characters (<, >, &, ‘, “). Further, only the global names may contain a dot.
A token is a sequence of characters representing a single object in a mathematical expression (i.e., literal numbers, punctuation, and mathematical operators). Tokens are separated by whitespace (tab, enter, or space) to allow for efficient parsing. HumMod uses tokens more efficiently than MathML. MathML treats each mathematical token as a distinct element, forcing a mathematical expression into a nested tree of elements. As a result, an equation with 10 tokens requires a tree with 10 children in MathML. HumMod requires one element whose content is a linear sequence of mathematical tokens.
To aid in parsing speed, HumMod does not maintain mathematical order of operations, which results in 3 + 5 × 10 returning 80, not 53. All values are floating point numbers. All standard binary and unary operators are part of HumMod: algebraic functions, exponential functions, trigonometric, inverse trigonometric functions, Boolean functions, Min/Max, rounding, and norm functions. In addition, HumMod defines a special type of element called curve, which is discussed later.
HumMod’s workhorse element is the block. Blocks appear in definitions as natural groupings of calculations and allow the efficient ordering of calculations. Blocks may be any size. The equations element defines a model’s algebraic and differential equations. HumMod supports implicit algebraic equations, Euler equations, backward Euler equations, and stiff differential equations. Equations are enhanced with delay or lag operators.
The curve element is the only function in the schema. The schema for defining a curve is shown in Figure 1A. The curve element uses X, Y defined data points and along with the slope at each X, Y data point to form a cubic spline that represents a function. There must be at least two data points and increasing X values for a function to be generated. The function is used to give values in a definition block (Figure 1B). Note the spaces between each token in the <val> element. Figure 1C demonstrates the use of curve in defining the relationship between blood glucose and insulin secretion. The XML establishes a cubic spline of three points given and their slopes. The function now exists within the internal representation of the model and can be called like any other operator (Figure 1D).
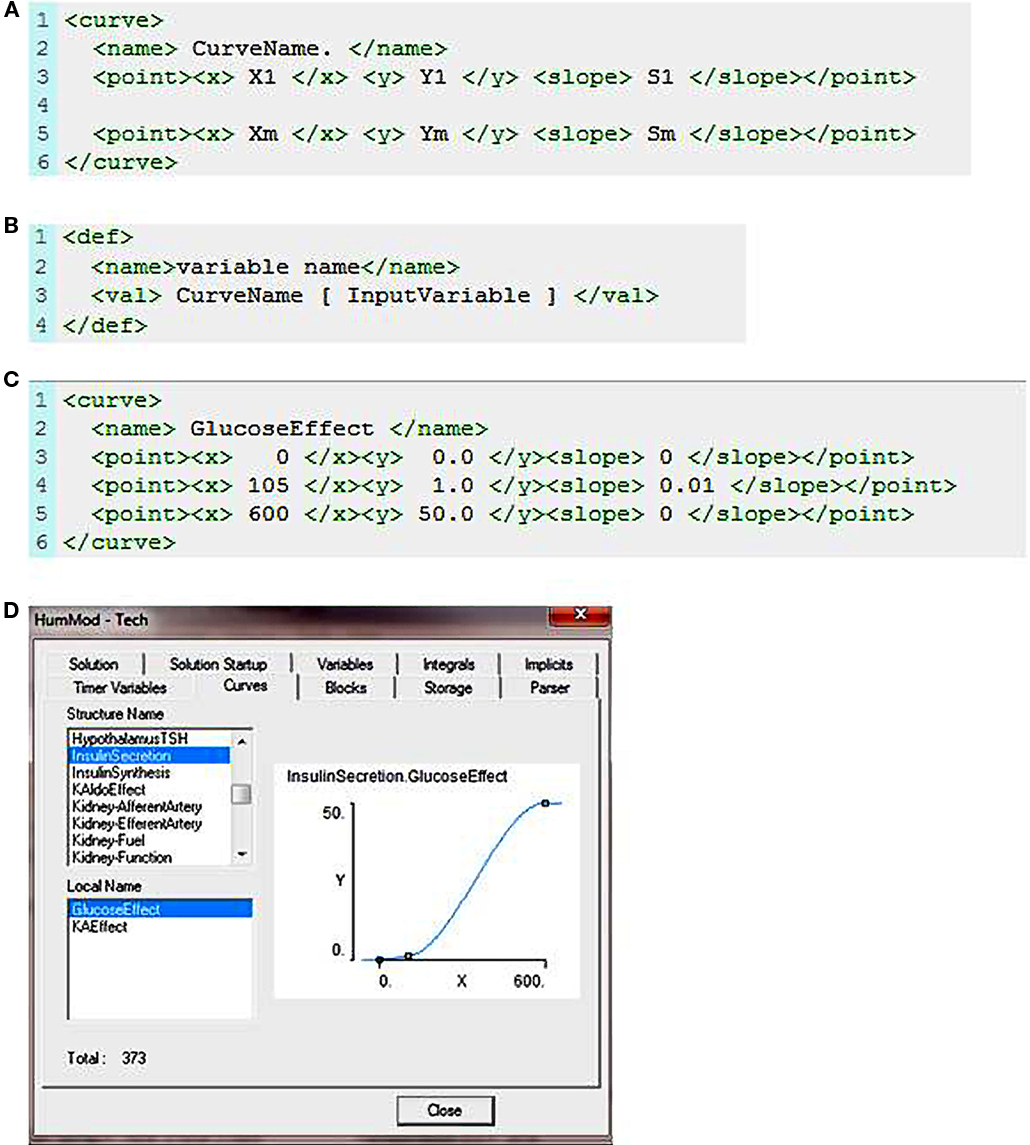
Figure 1. (A) The XML code used to describe a curve function. Xm is an X value, Ym is the associated Y value, and Sm is the slope of the curve at the Xm, Ym data point. (B) This demonstrates how the curve function is called in the XML code. “Variable name” is the output value returned following evaluation of the curve function at a given input value. (C) Describes the relationship between blood glucose and insulin release. (D) Shows the sigmoid fit based on the X, Y, and slope data presented in (C).
The Display elements described in the files located in the “Display” folder are used to define HumMod’s user interface. The element has two primary children: panel and tree. Panel provide output screens. Tree organizes panels in a pull-down menu by declaring branch and leaf elements. Leaf contains a name that corresponds uniquely to the name of a panel. Panels contain curves, parametric plots, lists of data values, or interface elements. An example of interface element is the edit box element. Editbox allows a user to change the value of parm or radiobox element allowing the user to assign a value from a previously defined list.
The complete HumMod XML schema is located on the www.//HumMod.org site under “Help.”
Hummod Documentation and Model Navigator
HumMod is the product of over 40 years of basic physiology research. Over those years, a database of documents and files was amassed. These documents and files support model assumptions and equations. To help users understand the mathematical relationship used to create the mathematical model we include two components to the HumMod environment, model documentation, and the Model Navigator.
Model Documentation
The model documentation is a series of XML files that describe the underlying physiology used to create the model. The files are found in the “Docs” folder as part of the HumMod package. XML files may contain normal concentrations, volumes, secretion rates, pressures, or any relevant physiological data for a variable. Further, XML files may contain a list of the publications used to determine the physiological values. The following is an example of the documentation files for erythropoietin (EPO) physiology.
Erythropoietin (EPO) is a hormone which increases red blood cell production in response to decreases in tissue oxygenation. HumMod has 19 variables associated with EPO. The four structure names and associated local names are listed below. The variables are used to calculate the EPO pool/mass in the body at any given time. EPO mass is a function of EPO secretion and EPO clearance. The pump feature allows users to alter [EPO] levels with varied infusion rates, which allows the beneficial effects of EPO administration on patients with anemia associated with chronic renal disease to be examined.
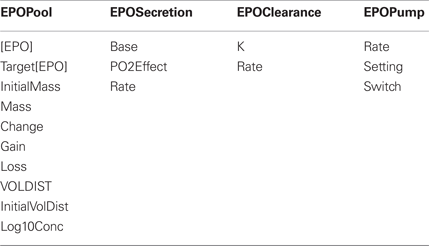
At a minimum, documentation for each variable includes:
• Definition of the local name.
• A general overview of the physiology of each variable, including historical background and references.
• Fundamental assumptions made by the model writer.
• Units – including normal values and supporting references.
• Physiologic relationships and their supporting references.
• Other areas of the model which may be relevant to understanding of that particular variable.
The first section in documentation defines local variables. For example, VOLDIST is a constant that defines the volume of distribution for EPO as a percentage of extracellular fluid volume (ECFV). References pertaining to the definition are listed here as well as any assumptions regarding that particular variable.
Initial values are variables with the prefix “initial.” Prior to simulation, the user defines the patient’s traits (i.e., gender, body size, age, muscularity, adiposity, etc.) that influence body volumes, especially ECFV. HumMod assumes that volumes may change with traits but initial concentrations do not; therefore, initial volumes are calculated at startup. Hormones have a target concentration specified – Target[EPO] in this case. Target[EPO] is multiplied by the initial volume of distribution to give the initial mass. The initial mass is the initial value of the mass integral. Documentation provides references for initial values defined in programming.
Users may check the foundations of a model by consulting model documentation. The majority of HumMod’s supporting documentation is cataloged in a Zotero database (http://www.zotero.org ). Zotero is an open-sourced bibliographic database plug-in for the Firefox web browser. Our database contains 5424 unique records. Not all records were used to develop HumMod. The Model Navigator is used for current and direct documentation. The Zotero records are accessed via the HumMod References Zotero group at http://www.zotero.org/groups/hummod_references.
Model Navigator
Users should understand physiological interactions behind HumMod. Guyton’s original model (Guyton et al., 1972) used a diagram to describe the physiological interactions of 150 variables. The small scope made it relatively easy to visualize relationships in a block diagram. Since HumMod contains more than 5000 variables and has the ability to easily expand, a static block diagram of HumMod is impractical. To elucidate the complex relationships we developed Model Navigator. Model Navigator is an executable program that parses the XML files and displays the relationships between variables and provides the supporting documentation. Figures 2 and 3 provide an example of the use of the Navigator to understand the basis for erythropoietin physiology.
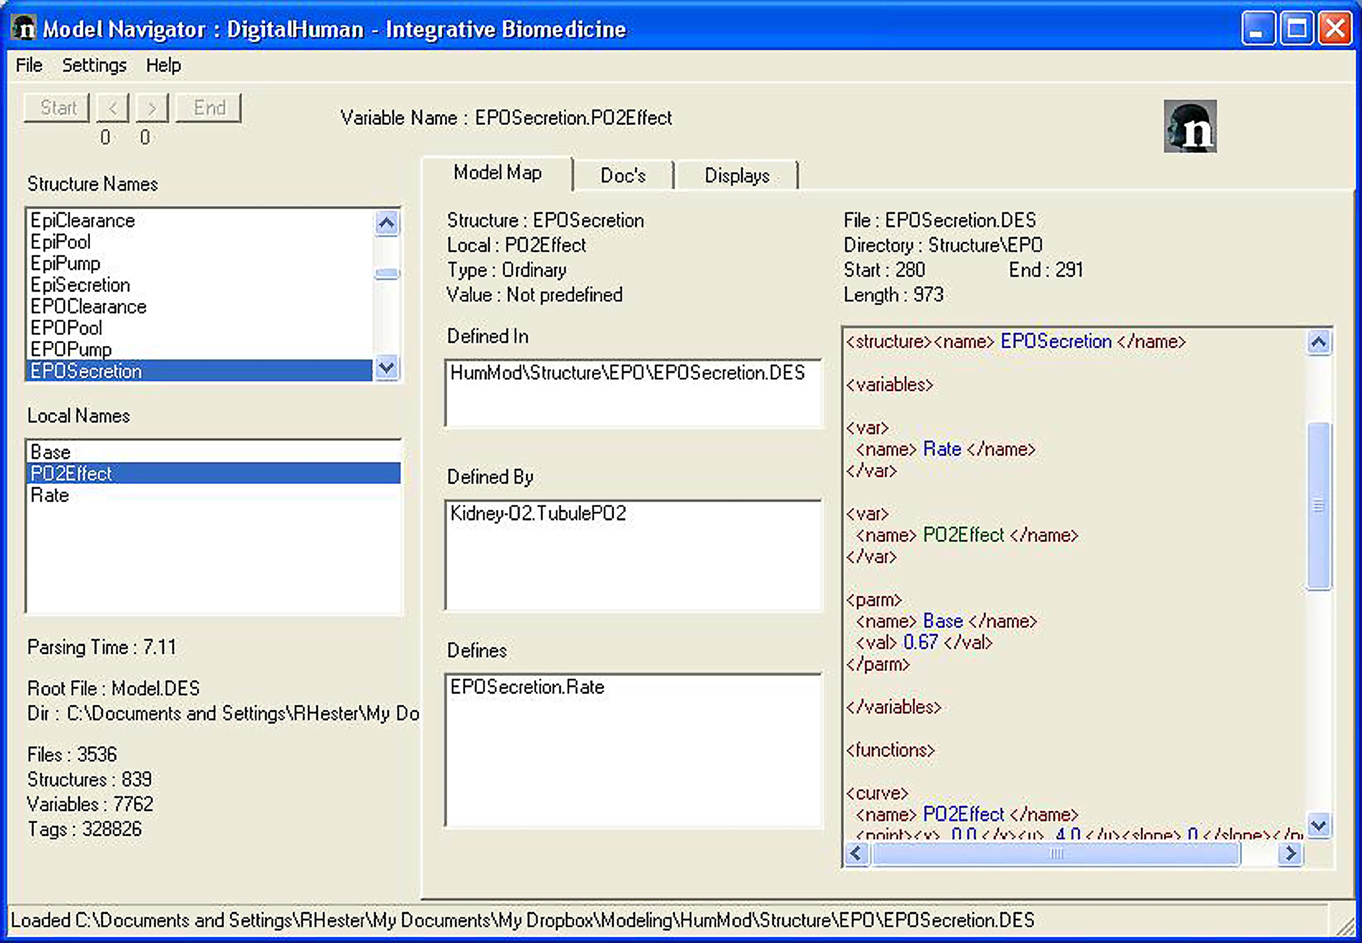
Figure 2. The Model Navigator is used to understand the physiological interactions and the documentation of HumMod. The left side panels list all of the variables in HumMod. The Center panels describe the interactions between each variable. The right panel shows the file location where a variable is defined.
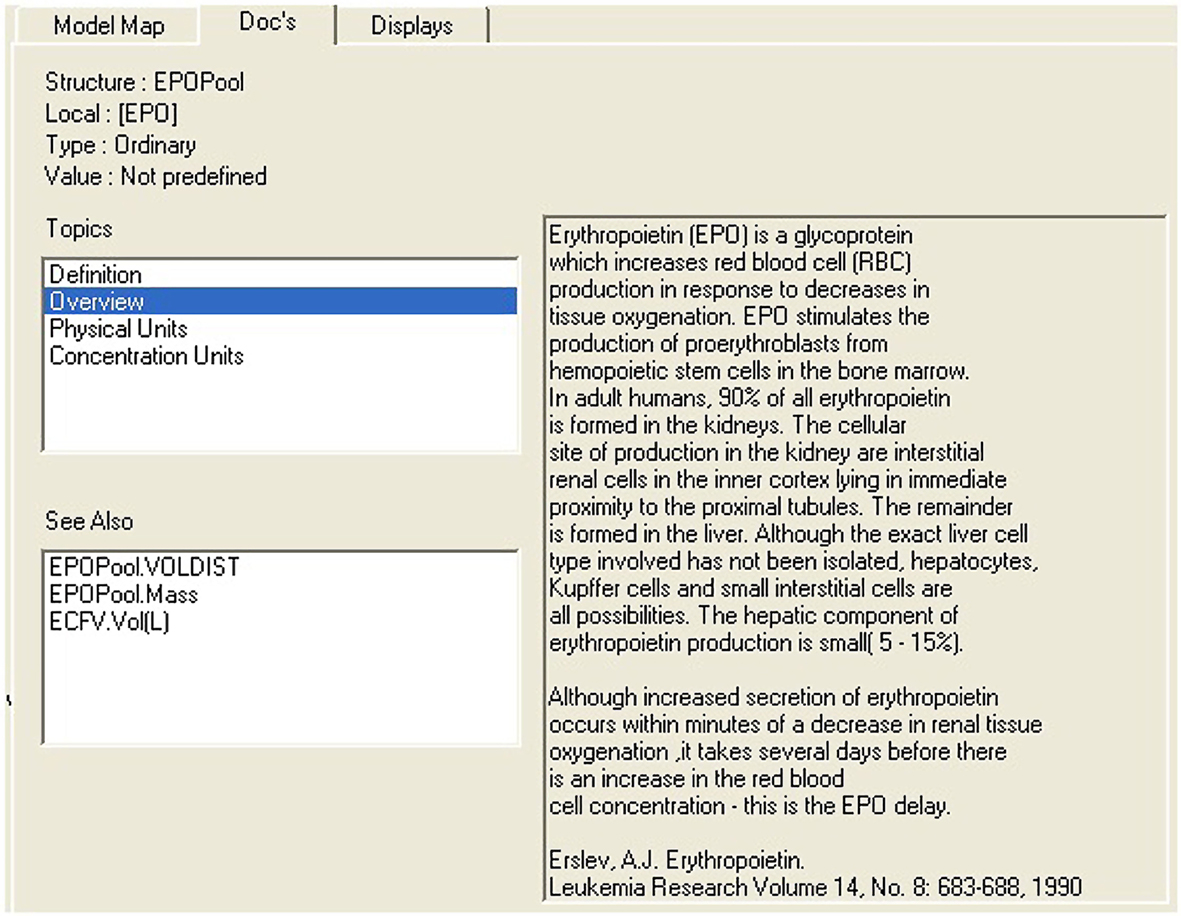
Figure 3. This Figure provides an example of how the Model Navigator displays the background documentation. The “Docs” tab on the center panel of the Model Navigator is selected. In this example the right panel displays an overview of erythropoietin.
Most navigating activity takes place in the Model Navigator’s main window (Figure 2). Activity typically flows from left to right and top to bottom. The functional areas of the main window can be divided into four main parts.
1. Top Area – Shows the name of the variable that is currently being investigated.
2. Left Area – Provides a list of all the variable names.
3. The Center Area – Details related to cause and effect.
4. Right Area – File Content.
The Model Navigator organizes both the Structure Names and the Local Names alphabetically in two separate display boxes in the left hand side of the screen (Figure 3). Clicking on the structure name first (EPOPool) followed by the local name [EPO] selects a variable for further analysis. This is achieved by using the three informational tabs in the center area. The function in the center and right areas of the main window is determined by the tabs: Model Map, Docs, and Displays.
Model map
The center area for Model Map displays four items. At the top is the name of the variable being analyzed – in this case Structure Name: EPOPool and Local Name: [EPO].
The next box down displays the name of the files or file where the variable is defined. Some variables, such as parameters and constants are defined when they are declared. Other variables are defined in remote locations. Some variables are defined in more than one location – typically in conditional math.
Clicking on the file name takes you directly to the file and location where the definition is taking place. This is shown in the display box on the right area of Figure 2. You can see the math used in the definition.
Next down is a list of all the variables involved in the definition. In this example, EPOPool.[EPO] is defined by EPOPool.Mass and EPOPool.VolDist. Clicking on a (defined by) name selects that variable for analysis. The entire display box on the right area is updated after the click.
Finally at the bottom is a list of all the variables that our variable helps to define. As stated above, clicking on a (defines) name selects that variable (in our example EPOPool.Log10Conc) for analysis. The entire display box in the right area is updated after the click.
Doc’s
Model documentation in XML schema is divided into internal and external components. Internal documentation is contained in the model’s variables, equations, and other definitions. Internal documentation is extracted and displayed by the Model Navigator. External documentation is additional information supplied by the model’s authors. It is displayed using the Doc’s tab (Figure 3). When the Doc’s tab is clicked, the center area displays two boxes: The first is a Topics box – a list of documentation topics which have been assigned to the variable being analyzed. Click on a topic and it is displayed in the box in the right area of the Model Navigator. In the example shown in Figure 3 clicking on Overview gives the user a brief description of erythropoietin.
The second box is a See Also box which lists variables that are related to the variable being analyzed. Clicking on a name selects that variable for analysis and updates the right hand display box.
Display
When the Displays tab is clicked, the center area describes where the analyzed variable is displayed. This is useful when a user wants to view the values of a variable during a simulation and cannot remember where it is displayed. The other occasion is when the user is deleting or renaming a variable. Reference to that variable in the displays must also be deleted or edited. This service provides the display filenames and intra-file locations.
Results
Physiological Responses
HumMod can simulate a patient’s normal physiology with time dependent responses ranging from seconds to years. Pathophysiological states (i.e., myocardical infarction, hemorrhage, renal artery stenosis, Type 1 diabetes, etc.) are created by radio buttons and slider bars that allow values to be changed or fixed. Panels listed in the Physiology and Organs pop down menus allow users to investigate and adjust physiological parameters in more detail. Panel features include graphical data displays, information buttons, and adjustable variables. The “Chart” panel provides graphical description of blood pressure, body temperature, heart rate, and respiratory rate.
Users may incorporate global (i.e., altitude) or local (i.e., temperature, humidity, and barometric pressure) environmental parameters. Further, users can manipulate partial pressures of individual gases in inspired air, nutritional composition of food, and amount of ingested food and fluids. Users can adjust a patient’s hour-to-hour basic functions (i.e., sleeping, working, and feeding) by controlling the daily routine. Further, the Exercise panels facilitate studying the effects of exercise.
HumMod allows users to administer pharmacological agents to treat a patient. Current drugs available: chlorothiazide, digoxin, furosemide, midodrine, insulin, and epinephrine. Additional drugs are added when quantitative pharmacodynamic and pharmacokinetic relationships are known. Additional treatment options (i.e., placing the patient on a ventilator, administering fluids via an IV drip, or performing a blood transfusion) are available.
To run a simulation, start HumMod. There is approximately a 5- to10-s delay (depending on the speed of the computer) while the program parses the XML code. The simulation is initiated once the user activates the drop-down menu under “Go,” and “brings the person to life” for a period of time, from 1 s to many months depending on the desire to observe acute or chronic physiological changes. Each 10 min of simulation takes approximately 2 s of real time.
Figure 4 demonstrates the cardiovascular responses upon standing, followed by a period of exercise. The simulation has the patient lying down for 10 min, with then standing up for 10 min, and then exercising for 20 min. Note the increase in heart rate upon standing. For exercise, we make the patient ride an exercise bike at a level of 200 W for 30 min. Note the rapid increase in blood pressure, heart rate, and respiratory rate. Some examples of the multilevel detail in HumMod is shown in Figures 5–7, including cardiac output (Guyton et al., 1972), muscle blood flow (Harold and Means, 2004), and distal nephron sodium (Iliescu and Lohmeier, 2010). HumMod saves the values of all variables along with the state of the timer variables. You may save complete solutions, which can be reloaded for reviewing or continued. The saved solution for Figure 7 is ∼10 MB.
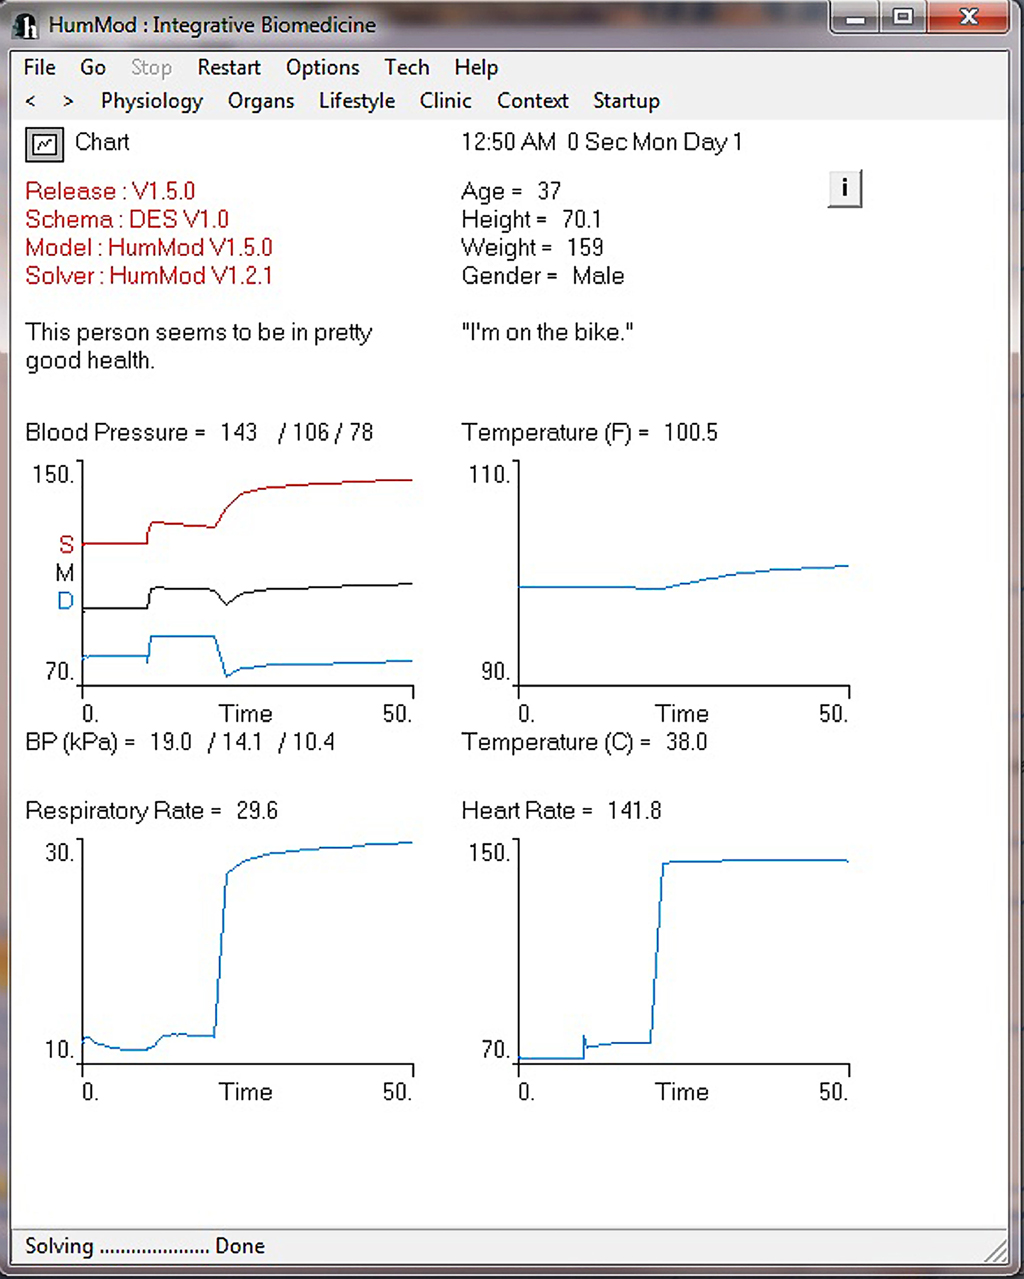
Figure 4. This figure provides an example of the ability of HumMod to simulate time dependent physiological responses. In this example the “person” is initially lying down for 10 min, then stands for 10 min, followed by 30 min of exercise.
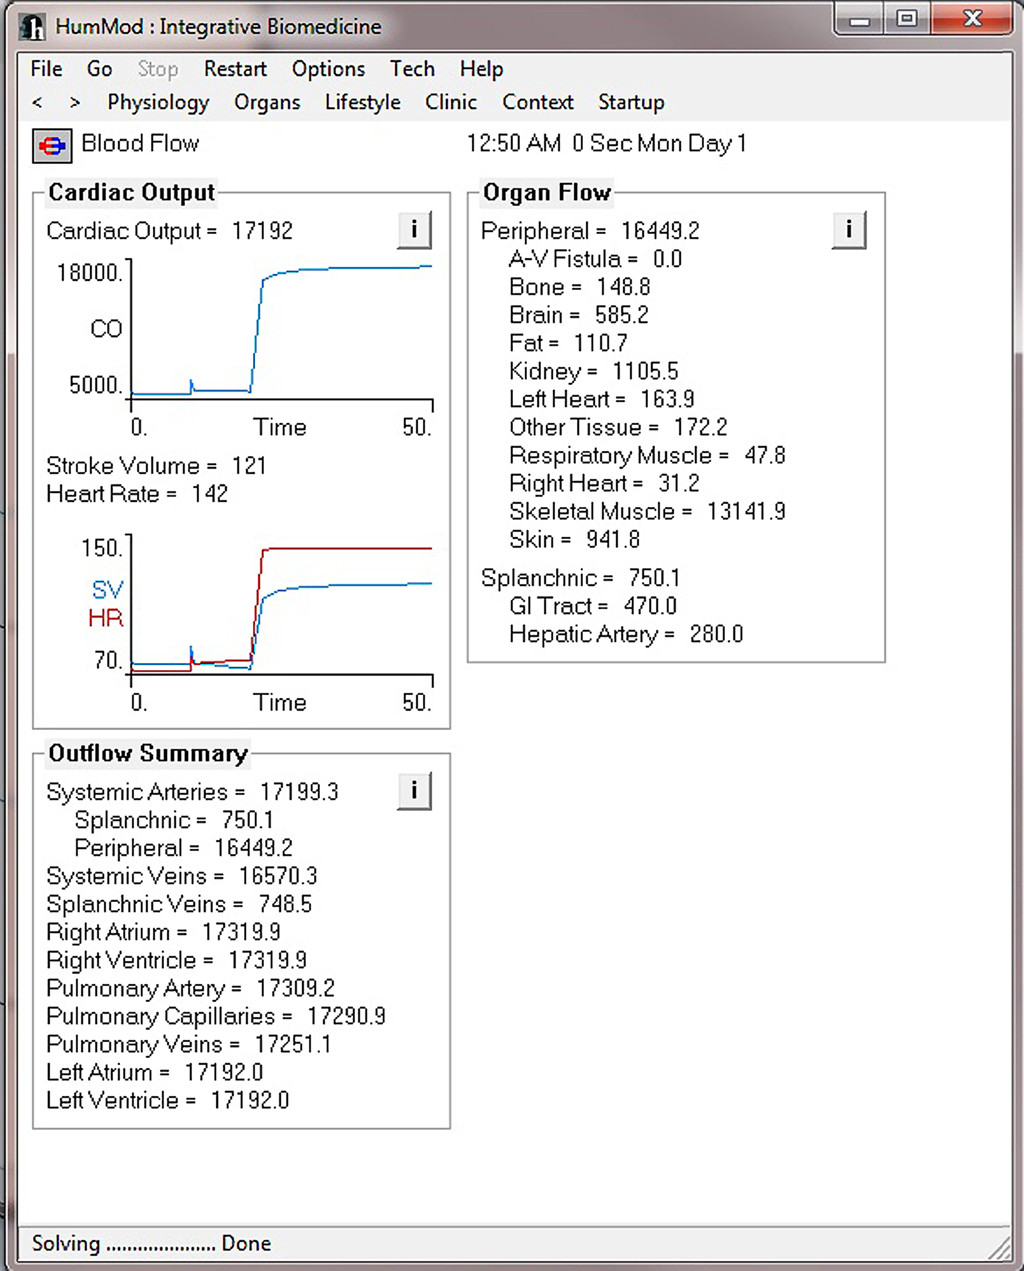
Figure 5. This figure demonstrates the cardiac output and blood flow responses before and during the exercise period shown in Figure 4.
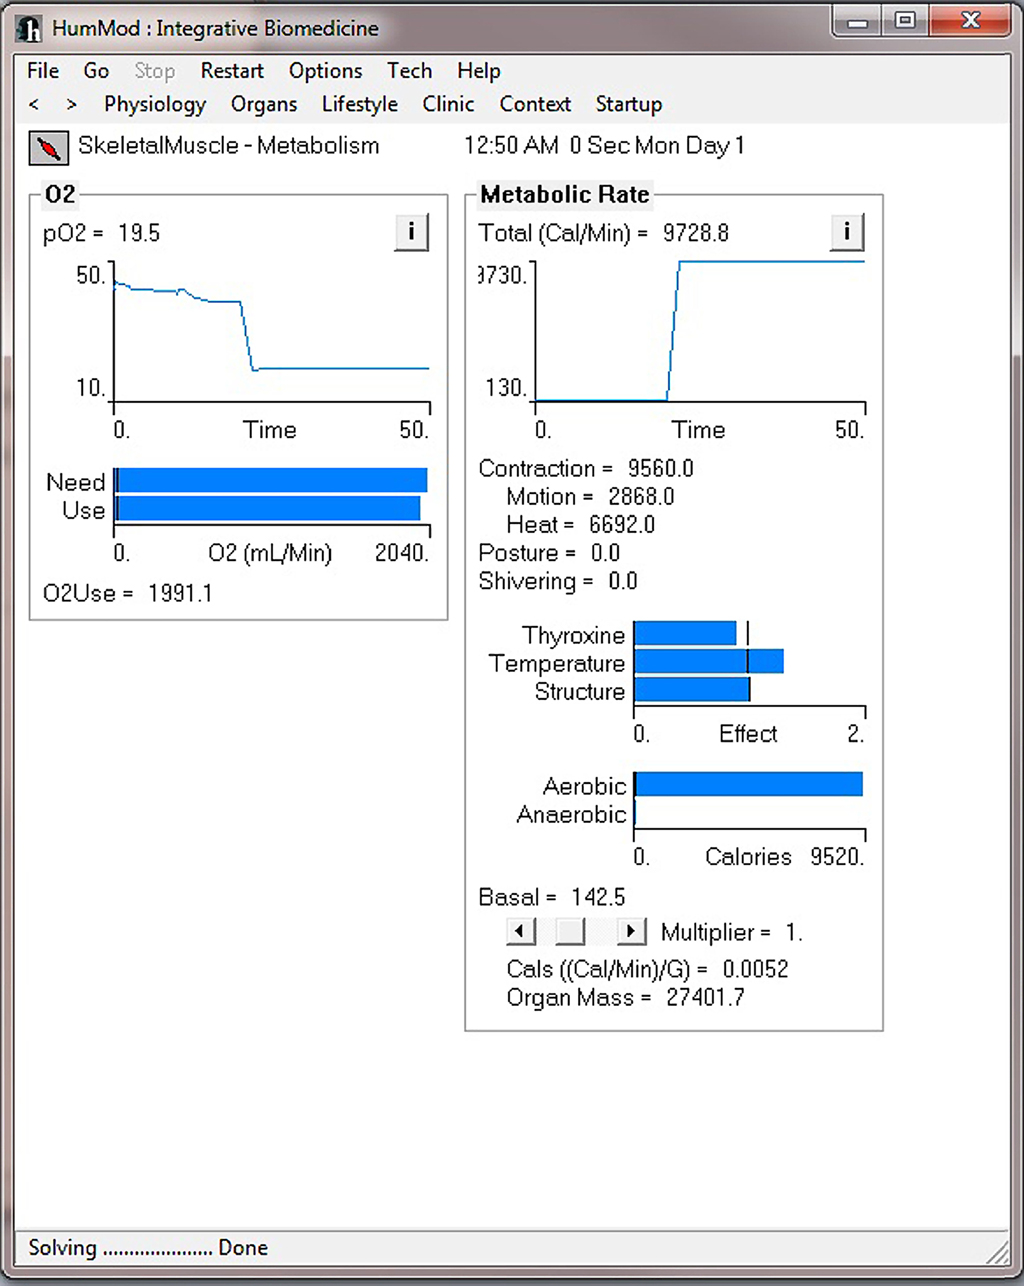
Figure 6. This figure demonstrates the skeletal metabolism responses before and during the exercise period shown in Figure 4.
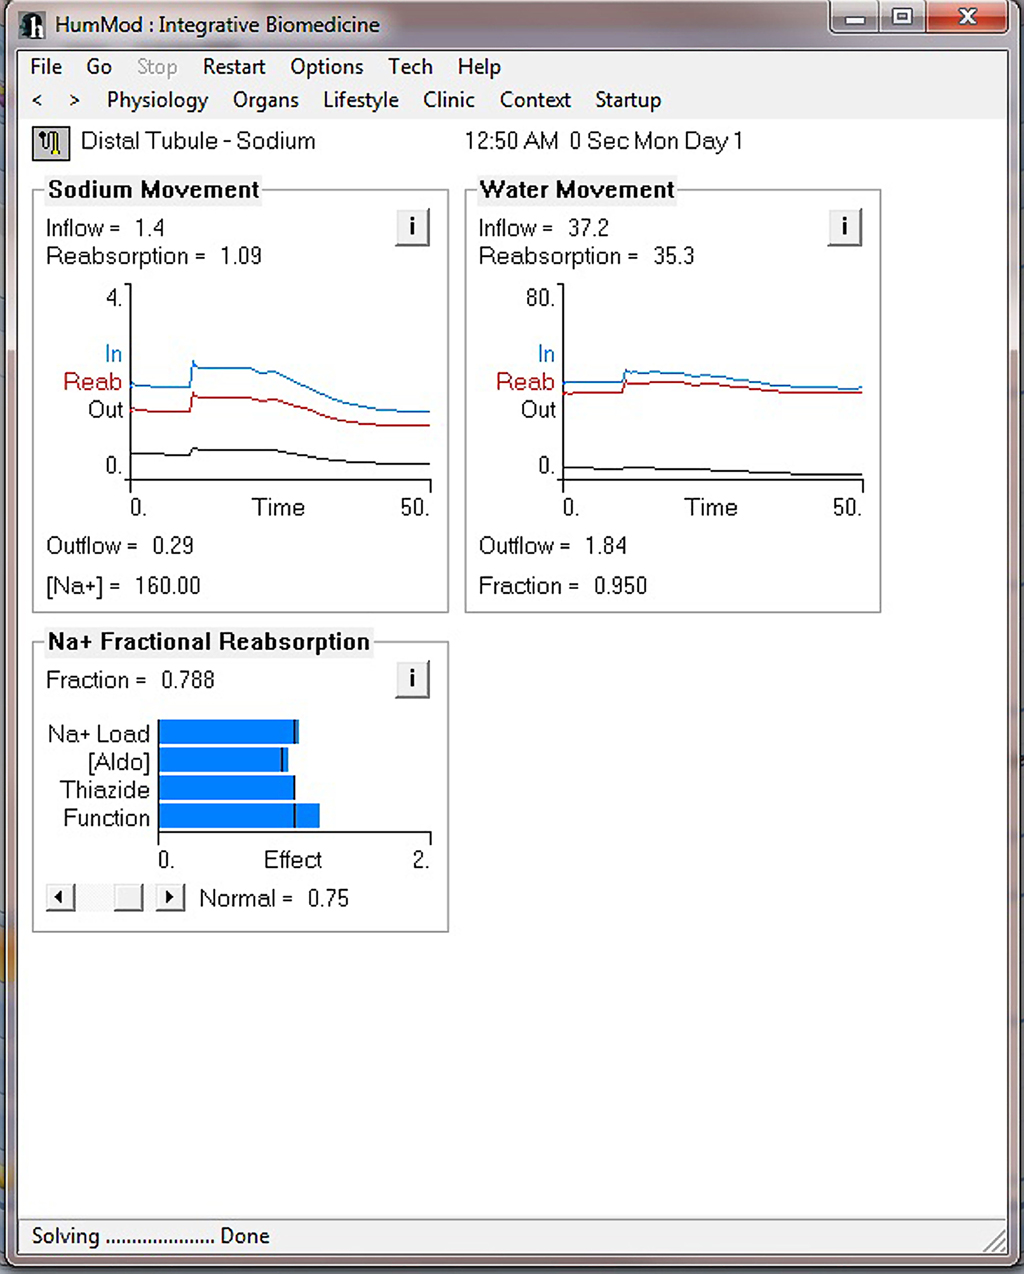
Figure 7. This figure demonstrates the multilevel aspects of HumMod. This figure displays the renal distal tubule sodium responses before and during the exercise period as described in Figure 4.
Gender Specific Hummod Model
Currently HumMod is based on the physiology of an approximately 160 lb man. We are developing the framework for HumMod to have scaling of both gender and body size. At present, HumMod has the detail and scaling to simulate certain aspects of female physiology. The parsing of the female physiology XML is conditional depending on the criteria set in a simple text file. Figure 8 shows the simulation results for ovarian secretion of estradiol under cyclic LH control for 1 month. HumMod is developed so that additional content can be added to fully simulate female physiology.
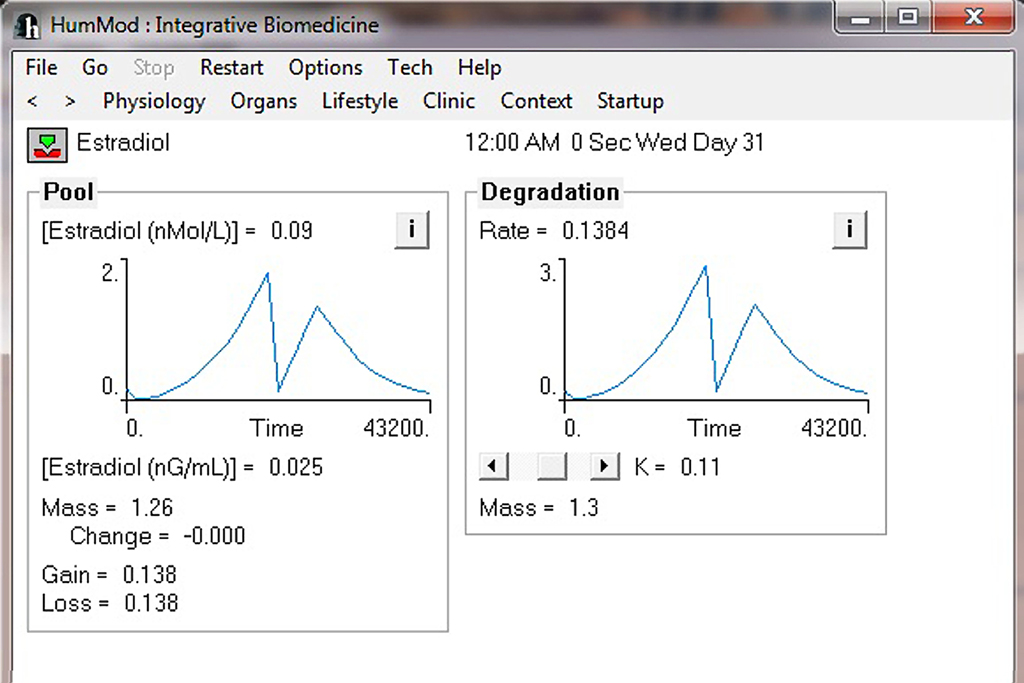
Figure 8. This figure demonstrates the ability of scaling in HumMod. The current version of HumMod has the ability to simulate female physiological function. Future scaling will include body composition and obesity.
Use of Hummod for Research Hypothesis Generation and Testing
Multilevel integrated mathematical models of physiology allow the examination of variables that are not easily observed by direct experimental testing or measurement. The set of variables and relationships described by HumMod is not exhaustive, but provides a backbone for refinement. In this regard, performing simulations with HumMod under different conditions provides a way to identify research hypotheses. The rest of this section will discuss the basic approaches for identifying novel research hypotheses by using HumMod and the use of the generated information for experimental design.
Normal Steady-State Behavior
To describe normal time-dependent behavior of the integrated physiological system under constant external conditions (temperature, physical activity, nutrient, and liquid intake, etc.), variables describing the state of the system are calculated through numerous iterations. Therefore, the relationships between variables must be valid and generate stable solutions to ensure the system is stable over time (as expected in real life).
Example: Angiotensin II
Based on experimental data, the normal concentration of Angiotensin II (AII) in the plasma is ∼20 pg/mL. HumMod displays plasma AII under steady-state conditions of constant, continuous salt intake while in the recumbent position. How is this value calculated? Plasma concentration of AII is determined by its endogenous formation rate, which depends on plasma renin (PRA) and converting enzyme activity (CEA). PRA is calculated as circulating renin mass divided by its volume of distribution, and CEA is obtained empirically. Renin mass results from a differential equation linking secretion rate to clearance rate (constant under normal conditions). Renin secretion rate depends, in turn, on Na+ delivery at the macula densa and activity of the macula densa β-adrenoreceptors. The volume of distribution for renin is the ECFV, which is influenced directly by AII concentration and its effects on proximal tubular reabsorption of Na+, as well as its effects on glomerular filtration rate and the diameter of various vascular beds. These effects affect renal perfusion pressure and glomerular filtration rate.
Any inconsistency in calculation of the variables would lead to incorrect plasma AII concentration values through continuous decreases, increases, or oscillations. Of the above variables, Na+ delivery at the macula densa is extremely difficult to measure experimentally, but correct modeling provides consistent end-points (blood pressure, PRA, or GFR).
System Behavior Following Step Perturbations
The most widely used experimental method to describe a physiological system is to study its behavior following perturbations. Both dynamic responses and new equilibrium states provide useful information about the system. This approach is amenable to mathematical modeling, in order to focus the experiment on the relevant variables. In other words, a hypothesis about the functioning of the system can be inferred, and an experiment designed to test the hypothesis.
Example: Baroreflex Mechanism
One of the controllers of blood pressure is the sympathetic nervous system activity. It is widely believed that the baroreflex feedback mechanism governing the relationship between blood pressure and sympathetic outflow operates on a narrow time scale, since it adapts rapidly to the prevailing blood pressure level. However, baroreflexes could have long-term effects on blood pressure. The following provides the details of a HumMod simulation to determine the long-term effects of baroreflexes on blood pressure.
Chronic activation of the afferent limb of the baroreflex causes sustained reductions in sympathetic outflow, as evidenced by reduced whole body norepinephrine (NE) spillover (Lohmeier et al., 2010). This indicates the reduction in sympathetic outflow as the mechanism for observed reductions in blood pressure and indicates that the central nervous system does not adapt to continuous baroreflex afferent inputs. We modeled baroreflex neural activation (Baroreflex.NA) as a variable that can take user-defined values (1 = no effect to 2 = maximal activation; Iliescu and Lohmeier, 2010). Under control conditions, Baroreflex.NA maintains a linear relationship of a positive slope with CarotidSinus.Pressure. Baroreflex.NA negatively affects sympathetic neural activity (SympsCNS.NA). Although present in the model, any other reflex influences on SympsCNS.NA, such as input from atrial receptors, were fixed in our simulations to baseline values of one. We used a parameter switch in the XML to control Baroreflex.NA.
We fixed sodium intake to mimic experimental conditions. The simulation ran for 3 months to reach a steady-state then ran for 3 days of baseline simulation. Arterial baroreceptor input into the CNS was increased by 70% and fixed for the next week to mimic the constant electrical stimulation of the carotid sinus (Iliescu and Lohmeier, 2010).
Blood pressure and heart rate decreased after baroreflex activation and remained at lower levels as long as baroreflex activation was applied. Sodium excretion decreased initially but progressively returned to control levels by the end of the first week of activation. Plasma NE concentration decreased. Despite the pronounced reduction in blood pressure, PRA did not increase because β-adrenoceptor activity at the macula densa decreased as a result of reduced central sympathetic outflow. These results mirror experimental observations (Lohmeier et al., 2004). HumMod was developed independently of these experimental studies.
To investigate possible mechanisms by which activation of baroreflexes lead to chronic reductions in blood pressure, several variables were successively “clamped” at control levels (i.e., not allowed to vary in response to simulation of baroreflex activation) while the end-point (blood pressure) was evaluated. The “clamped” variables were, initially, renal sympathetic nerve activity, then atrial natriuretic peptide, AII and aldosterone, and finally renal venous pressure. These simulations indicate that reduction in renal sympathetic nerve activity is a necessary mechanism to allow sustained reductions in blood pressure during baroreflex activation. However, when renal nerve activity was “clamped” at normal levels other natriuretic factors came into play. First were the above mentioned hormones. When they are “clamped,” renal venous pressure becomes the dominant natriuretic mechanism at the expense of a massive increase in ECFV. These simulations have pointed to new working hypotheses involving the mechanisms responsible for the blood pressure lowering effects of baroreflex activation.
System Behavior Under Progressive Perturbations
Most chronic diseases lack a clearly defined initiating event. Moreover, chronic changes usually intensify over time. HumMod can simulate a change of controlled magnitude in many variables (i.e., hormone levels, organ function, etc.). In the example above, the system reacts to constant “step” changes and moves toward a new equilibrium. The changes are applied with radio buttons and slider bars that are coupled to parameter values encoded in the display section. The parameters are linked to calculations in the structure files. In order to produce time-dependent changes, a simple approach is to multiply a parameter value by the single independent variable of the system, time (System.X). As the simulation runs, increases in time will lead to a progressive change (either increase or decrease) of the respective parameter.
Example: Progressive Heart Failure
Excluding some clearly defined clinical situations, heart failure is progressive in nature; therefore, adaptations in the body are progressive. HumMod can generate a working hypothesis of the mechanisms underlying the progression from compensated to decompensated heart failure.
In HumMod, left ventricle contractility is a parameter that affects the pressure-volume relationship of the left ventricle and therefore stroke volume and cardiac output. In order to model progressive isolated systolic left ventricular failure, display-related “Failure” and “Degree” parameters is added. These parameters are multiplied by the System.X variable. The resulting value is subtracted from the basic contractility parameter described in the respective XML structure file.
Depending on the chosen value of the “Degree” parameter, there is a progressive decrease in left ventricle contractility with controllable steepness and magnitude. If failure were simulated as a sudden 30% decrease in left ventricle, HumMod either becomes unstable or yields variable values that are incompatible with life. However, a progressive 3 week decrease of left ventricular contractility to 70% of normal will yield the expected changes in cardiac output, stroke volume, blood pressure, atrial pressures, and pulmonary capillary pressures. Further, HumMod predicts an increase in ECFV as a result of decreased urinary sodium output and glomerular filtration rate and activation of the renin-angiotensin system due to a decrease in Na+ delivery at the macula densa and an increase in renal sympathetic nerve activity. However, the model also displays increased natriuretic factors, which compensate for excessive fluid retention from cardiac failure and renal venous pressure. The balance between the antinatriuretic and natriuretic mechanisms that are activated by the progressive failure of the heart likely dictates the transition to decompensated failure as found in the clinical setting. Specific factors can be investigated for targeting therapeutic efforts by using “clamping tests.”
Summarizing hypothesis generation and testing, HumMod can be used for HumMod can be used for an integrated understanding of complex physiological processes. HumMod can be used for the identification of boundaries and transition to pathology, identification of major end-points for experimentation, and identification of therapeutic targets.
Discussion
HumMod is an integrative model of human physiology that uses XML to define its quantitative relationships, variables, and parameters. HumMod executes complex and stable integrative physiological simulations. The use of XML, a rapidly parsed and readable computer language, allows users to easily expand model functionality. From the perspective of the researcher, this is the feature that most distinguishes HumMod: familiarity with the schema gives the ability to modify code to fit one’s needs. The schema can be used to generate an independent model that may be inserted into the larger HumMod framework. For example, the cardiovascular-renal feedback loop, can be excised and examined on its own. Scaling will allow HumMod to simulate male and female physiological responses with many other traits.
Validity is an obvious concern of any simulation framework. We judge validity on the criteria established by Summers et al. (2009). As such, a model is considered valid when its output is directionally appropriate, stabilizes near experimental values, and responds to dynamic situations. According to the criteria, an exact match with experimental data is unnecessary; the outcome of such a fit would likely be too stiff. General trend matching allows a model to fit data loosely enough to provide valid, stable results. HumMod is proven to meet these criteria. To validate a model, one must find relevant experimental data from published journals, preferably a meta-analysis, to compare model output. The user should simulate an equivalent experiment in HumMod, then compare the output to experimental data. If the model output satisfies Summers’ three criteria, then the model is valid. Larger HumMod validations will be published in the literature and smaller validations on the HumMod website.
The possibilities of HumMod are near limitless. Since HumMod is the only stable integrative model of physiology, it offers a new method to perform extensive analysis of physiological responses of the human body. Further, because the physiological dynamics are defined within an XML library, it is simple to expand HumMod’s functionality. The stability, integration, and extensibility provide far reaching usefulness and applicability to science and medicine, which is strengthened by defined criteria for validation.
HumMod can also be used for physiological education. HumMod provides students with the ability to understand the integrative aspects of human physiology. We and others around the world have used QCP, the older version of HumMod, for both undergraduate and medical education. HumMod’s unique design will allow for the development of new formats for physiological education, such as web-based on-line courses.
The long term goal for the HumMod project is to model physiology, from birth to death, whether the subject is male or female. The XML format will allow continual addition of more detailed physiological content. The development of this complete physiological model will require continuous rescaling of an extremely stable model.
Conflict of Interest Statement
The authors declare that the research was conducted in the absence of any commercial or financial relationships that could be construed as a potential conflict of interest.
Acknowledgments
Free downloads of the software are available at http://hummod.org. This work was supported by a NSF EPSCoR grant, National Institutes of Health grant HL-51971and NASA. The work was also supported by NIH 1T32HL105324.
References
Abram, S. R., Hodnett, B. L., Summers, R. L., Coleman, T. G., and Hester, R. L. (2007). Quantitative circulatory physiology: an integrative mathematical model of human physiology for medical education. Adv. Physiol. Educ. 31, 202–210.
Beard, D. A. (2006). Modeling of oxygen transport and cellular energetics explains observations on in vivo cardiac energy metabolism. PLoS Comput. Biol. 2, e107. doi: 10.1371/journal.pcbi.0020107
Coleman, T. G., and Randall, J. E. (1983). HUMAN. A comprehensive physiological model. Physiologist 26, 15–21.
Guyton, A. C., and Coleman, T. G. (1969). Quantitative analysis of the pathophysiology of hypertension. Circ. Res. 24, 1–19.
Guyton, A. C., Coleman, T. G., and Granger, H. J. (1972). Circulation: overall regulation. Annu. Rev. Physiol. 34, 13–46.
Harold, E. R., and Means, W. S. (2004). XML in a Nutshell: A Desktop Quick Reference. Sebastopol, CA: O’Reilly Media, Inc.
Iliescu, R., and Lohmeier, T. E. (2010). Lowering of blood pressure during chronic suppression of central sympathetic outflow: insight from computer simulations. Clin. Exp. Pharmacol. Physiol. 37, e24–e33.
Lohmeier, T. E., Iliescu, R., Dwyer, T. M., Irwin, E. D., Cates, A. W., and Rossing, M. A. (2010). Sustained suppression of sympathetic activity and arterial pressure during chronic activation of the carotid baroreflex. Am. J. Physiol. Heart Circ. Physiol. 299, H402–H409.
Lohmeier, T. E., Irwin, E. D., Rossing, M. A., Serdar, D. J., and Kieval, R. S. (2004). Prolonged activation of the baroreflex produces sustained hypotension. Hypertension 43, 306–311.
Secomb, T. W., Styp-Rekowska, B., and Pries, A. R. (2007). Two-dimensional simulation of red blood cell deformation and lateral migration in microvessels. Ann. Biomed. Eng. 35, 755–765.
Keywords: integrative physiology, HumMod, physiome, model
Citation: Hester RL, Brown AJ, Husband L, Iliescu R, Pruett D, Summers R and Coleman TG (2011) HumMod: a modeling environment for the simulation of integrative human physiology. Front. Physio. 2:12. doi: 10.3389/fphys.2011.00012
Received: 21 January 2011; Accepted: 23 March 2011;
Published online: 13 April 2011.
Edited by:
Scott L. Diamond, University of Pennsylvania, USACopyright: © 2011 Hester, Brown, Husband, Iliescu, Pruett, Summers and Coleman. This is an open-access article subject to a non-exclusive license between the authors and Frontiers Media SA, which permits use, distribution and reproduction in other forums, provided the original authors and source are credited and other Frontiers conditions are complied with.
*Correspondence: Robert L. Hester, Department of Physiology and Biophysics, University of Mississippi Medical Center, Jackson, MS 39216-4505, USA. e-mail:cmhlc3RlckB1bWMuZWR1


