- 1 Department of Biomedical Engineering, Politecnico di Milano, Milano, Italy
- 2 Forenap R&D, Rouffach, France
Sleep is a complex state characterized by important changes in the autonomic modulation of the cardiovascular activity. Heart rate variability (HRV) greatly changes during different sleep stages, showing a predominant parasympathetic drive to the heart during non-rapid eye movement (NREM) sleep and an increased sympathetic activity during rapid eye movement (REM) sleep. Respiration undergoes important modifications as well, becoming deeper and more regular with deep sleep and shallower and more frequent during REM sleep. The aim of the present study is to assess both autonomic cardiac regulation and cardiopulmonary coupling variations during different sleep stages in healthy subjects, using spectral and cross-spectral analysis of the HRV and respiration signals. Polysomnographic sleep recordings were performed in 11 healthy women and the HRV signal and the respiration signal were obtained. The spectral and cross-spectral parameters of the HRV signal and of the respiration signal were computed at low frequency and at breathing frequency (high frequency, HF) during different sleep stages. Results attested a sympatho-vagal balance shift toward parasympathetic modulation during NREM sleep and toward sympathetic modulation during REM sleep. Spectral analysis of the HRV signal and of the respiration signal indicated a higher respiration regularity during deep sleep, and a higher parasympathetic drive was also confirmed by an increase in the coherence between the HRV and the respiration signal in the HF band during NREM sleep. Our findings about sleep stage-dependent variations in the HRV signal and in the respiratory activity are in line with previous evidences and confirm spectral analysis of the HRV and the respiration signal to be a suitable tool for investigating cardiac autonomic modulation and cardio-respiratory coupling during sleep.
Introduction
Although cardiac automaticity is intrinsic to various pacemaker tissues, it is well established that the heart rate variability (HRV), i.e., the oscillation in the interval between consecutive heart beats (RR intervals), is under the control of the autonomic nervous system (ANS), the main regulation circuit of internal body functions (Pagani et al., 1986; Vanderlei et al., 2009). Thus, the study of the HRV represents one of the most reliable and widely used tools to investigate the cardiac autonomic modulation (Task Force of the European Society of Cardiology and the North American Society of Pacing and Electrophysiology, 1996). HRV measurements, thanks to their relatively easy derivation and non-invasivity, are useful to provide additional valuable insight into physiological and pathological conditions (Pumprla et al., 2002). By analyzing the HRV in the time and in the frequency domains, information about autonomous activity can be obtained; three main spectral components can be identified on the HRV signal spectrum: very low frequency (VLF: 0.01–0.04 Hz), low frequency (LF: 0.04–0.15 Hz), and high frequency (HF: 0.15–0.4 Hz) components. The HF is considered as a quantitative marker of parasympathetic activity, while in the LF frequency band, both sympathetic and parasympathetic contributions have been recognized. However, as the power in the LF band always increases with sympathetic stimulation, a rise in the LF band is considered as a marker of a sympathetic drive to the heart. The LF/HF ratio is therefore thought to reflect the sympatho-vagal balance controlling the heart rate (HR; Rajendra et al., 2006). Physiological interpretation of the VLF component has not been completely elucidated yet (Task Force of the European Society of Cardiology and the North American Society of Pacing and Electrophysiology, 1996), but it seems to be related to slow regulation mechanisms that cannot be studied in the time intervals typically considered for the spectral analysis of the HRV signal.
The distribution of the power and the central frequency of the HRV spectral components are not fixed, but vary in relation to changes in autonomic modulation of the HR and depending on the central nervous system state.
In recent years, a growing interest has been manifested on the cardiovascular control during sleep, also given the fact that many sleep disorders, including insomnia and sleep apnea, have been proved to be associated with cardiovascular disorders (Caples et al., 2007). Sleep is a complex state characterized, in physiological conditions, by important changes in the autonomic regulation of the cardiovascular activity (Viola et al., 2011). HRV is largely affected during sleep by sleep stage organization: specifically, evidence suggests a predominant parasympathetic drive to the heart and a reduced sympathetic efferent vasomotor tone during non-rapid eye movement (NREM) sleep and an increased sympathetic modulation, with remarkable fluctuations between parasympathetic and sympathetic influences, during rapid eye movement (REM) sleep (Scholz et al., 1997; Lanfranchi et al., 2007).
Respiration undergoes important modifications during sleep as well, becoming deeper and more regular with synchronization of sleep (deep sleep) and shallower and more frequent during REM sleep (Lanfranchi et al., 2007). The association between cardiac and respiratory rhythms has been widely recognized (Kabir et al., 2010). Respiratory sinus arrhythmia (RSA), which consists in rhythmic HR modifications that oscillate around the respiratory frequency, has been reported in healthy humans (Lotric and Stefanovska, 2000), both during wakefulness and sleep (Cysarz et al., 2004). It is one of the main contributors to HRV, whose spectral analysis typically reveals a HF component centered around the respiratory frequency (Penttilä et al., 2001). Although the mechanisms underlying the cardio-respiratory interaction and its physiological significance have not been elucidated yet, there is clinical evidence that reduced RSA is a prognostic indicator for cardiac mortality (Casolo et al., 1992). The aim of the present study was to assess autonomic cardiac regulation, respiratory variations, and cardio-respiratory coupling during different sleep stages and along the whole night in healthy subjects, using spectral analysis of HRV and respiration variability signals.
Materials and Methods
Subjects
Eleven healthy women, with age ranging between 18 and 45 years, participated in the study. None of them suffered from any psychiatric disorders, neither did any of them have a history of, or family history of psychiatric disorders. None of them was undergoing chronic medication. All participants provided their informed and written consent to participate in the study.
Polysomnographic Acquisition
The acquisition protocol was implemented within the PSYCHE European project and performed at Forenap R&D sleep laboratory. For each subject several signals were recorded simultaneously through standard polysomnography during a night of sleep. The electrocardiogram (ECG) and the respiratory activity were recorded with a sampling rate of 256 Hz. The electroencephalogram (EEG), the electrooculogram (EOG), and the electromyogram (EMG) were also recorded. The study was approved by the local independent Ethical Committee.
Signal Processing
For each subject the hypnogram was obtained by visual scoring performed on the EEG, EOG, and EMG signals by an expert physician according to the standardized procedure presented in the American Academy of Sleep Medicine (AASM) Manual for the Scoring of Sleep and Associated Events (Iber et al., 2007). Concerning sleep stages visual scoring, these new rules are intended to replace those introduced in 1968 by Rechtschaffen and Kales and worldwide accepted. According to the AASM classification, sleep stages S1 to S4 are referred to as N1, N2, and N3, with N3 comprising slow-wave sleep stages S3 and S4. REM and wakefulness states are referred to as stage R and stage W, respectively. Following the AASM indications, wakefulness and sleep stages were scored by 30-s epochs.
The RR-interval signal was extracted from the ECG signal. Peaks were detected from the ECG through the Pan–Tompkins algorithm (Pan and Tompkins, 1985), which reliably recognizes QRS complexes based upon the analyses of the signal slope, amplitude, and width. As the original ECG signal might contain outliers due to movement, noise, ectopic beats, or arrhythmias, in order to identify and eliminate them, the following procedure was performed: the ECG derived RR sequence was analyzed and samples were considered as outliers when the following condition was met:

where RRi is the ith sample in the tachogram and Average100 and Std100 are the mean and the SD values, respectively, of the previous 100 samples without outliers. A filtered signal was obtained by applying a moving average filter with a 1000 sample window to the original RR sequence and identified outliers were replaced with the value of the corresponding sample in the filtered RR sequence (Kemper et al., 2007).
The respirogram was extracted from the respiration signal by sampling it in correspondence of each R peak identified in the ECG (Baselli et al., 1988).
Analysis
Stationary and free of artifacts signal portions were manually selected within different sleep stages on both the tachogram and the respirogram; autoregressive (AR) analysis was performed on each portion of the signals in order to obtain an AR model, whose general expression is as follows:

where y(t) is the series under investigation, ak are the autoregressive coefficients and ε(t) is the residual term, whose whiteness was always verified.
The model order was chosen using the AKAIKE information criterion (AIC) and the model coefficients were obtained using the least squares method based upon the Yule–Walker equations (Kay and Marple, 1981).
The AR model was used to calculate the power spectral density (PSD) of each signal portion, which can be expressed as follows:

where H(ω) is the model transfer function, z is defined as exp(2πifT), C(z) is the function bearing the zeros of the system, Δt is the sampling period and pk are the poles of the process. The poles were identified in order to decompose the PSD into single spectral components, according to the method described in Baselli et al. (1997). The frequency and power values associated to each rhythmic component were calculated. The values of the normalized power of the LF and the HF components [LF n. u. and HF n. u., obtained as LF power/(total power–VLF power) and as HF power/(total power–VLF power)], along with the LF/HF ratio, were calculated for each analyzed signal portion of the tachogram, while for the respirogram only the main peak, corresponding to the HF component (respirogram HF%, obtained as HF power/respirogram total power), was taken into account.
For each stationary portion of the tachogram and of the respirogram a bivariate analysis was also performed, in order to obtain the cross-spectrum between the two variability signals.
According to the method described in Bianchi et al. (1990) a bivariate AR model was estimated, whose general expression is as follows:

where Y(t) is the vector of the series under investigation y(t) and x(t), A is the autoregression coefficient matrix and W(t) is the vector of the residual terms ε(t) and η(t).
The AR bivariate model was used to calculate the cross-spectrum of each signal portion, which can be expressed as follows:

where X(ω) and Y(ω) are the autospectra of the signals.
The quadratic coherence between the signals in the LF and in the HF bands was calculated as:

where the cross-spectrum between the signals is normalized with regard to the signals’ PSDs. The percentages of coherent and not-coherent power between the signals were calculated for each analyzed signal portion. An example of signals, spectra, and cross-spectrum is illustrated in Figure 1. The parameters of interest (LF n. u., HF n. u., LF/HF ratio, HF band coherence, % of tachogram power coherent, and not-coherent with respiration) were studied within each sleep cycle and their average value was calculated on all subjects, for the whole night. For each subject the variation of the LF/HF ratio for the tachogram and the tachogram–respirogram coherence in the HF band were studied during the whole night in relation with the subject’s hypnogram; average values over the whole night were also calculated on all subjects. Analysis of Variance (ANOVA) was performed on the data in order to identify statistically significant differences in the tachogram LF n. u., HF n. u. and LF/HF ratio values, in the respirogram HF% power and in the tachogram–respirogram coherence in the HF band values during deep NREM sleep (stage N3) and REM sleep stages, during the whole night.
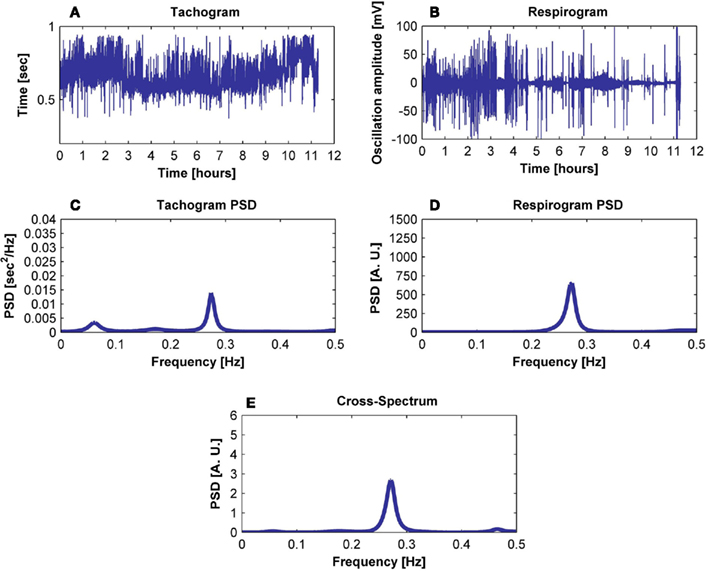
Figure 1. Exemplification of the procedure followed to obtain (E) the cross-spectrum of (A) the tachogram and (B) the respirogram of a subject using (C) the tachogram spectrum and (D) the respirogram spectrum.
Results
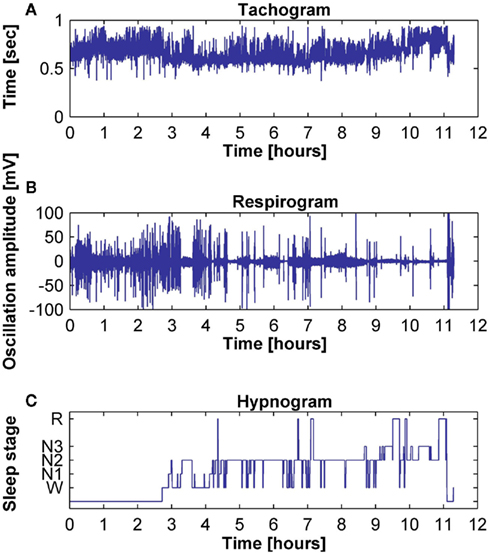
The tachogram and respirogram were studied for each subject. A typical example of the signals for one subject, along with the hypnogram, is shown in Figure 2. PSDs for both the tachogram and the respirogram were calculated and the cross-spectrum between the two signals was computed for different sleep stages, according to the clinical classification summarized in the hypnogram. Figure 3 shows the results obtained for a single subject, during wakefulness and different sleep stages, during the first NREM–REM cycle. The tachogram PSD shows that the LF component, larger during wakefulness, decreases during NREM sleep periods, and increases during the REM period; the HF component, after an initial decrease during sleep stage 1, increases during deep sleep stages, with the characteristic peak becoming narrower and more pronounced, and decreases during REM sleep, when the peak is only slightly visible. The VLF component, very large during wakefulness, decreases during NREM sleep, and greatly increases during REM sleep. A similar trend is followed by the respirogram PSDs, which show an increase in the HF component during NREM sleep, with the characteristic peak progressively becoming more pronounced as sleep deepness increases, and decreases during REM sleep, when a less pronounced and more widely distributed peak can be observed. The cross-spectra between the tachogram and the respirogram show an increase in the synchronization between the two signals during NREM periods, which reaches its highest value during sleep stage N3, and a decrease during the REM period, when synchronization is hardly visible. For the tachogram, the average values of the VLF power, LF n. u. and HF n. u. power, and of the LF/HF ratio were calculated for wakefulness and for each sleep stage, over the whole night, for each subject. The average values of the respirogram HF% power, of the maximum of the coherence between the tachogram and the respirogram in the HF band and of the coherent and not-coherent power percentages between the two signals were also calculated. The results for a typical subject, along with corresponding SD values, are plotted in Figure 4. The average values of the same parameters calculated for all subjects during wakefulness and different sleep stages, during the whole night, along with corresponding SD values, are plotted in Figure 5. The results obtained from the tachogram indicate that the LF n. u. and the HF n. u. show an opposite behavior, with the LF n. u. power increasing during sleep stage N1, progressively decreasing with synchronization of sleep and increasing during REM sleep and with the HF n. u. component decreasing during sleep stage N1, progressively increasing during deeper sleep stages and finally decreasing during REM sleep.
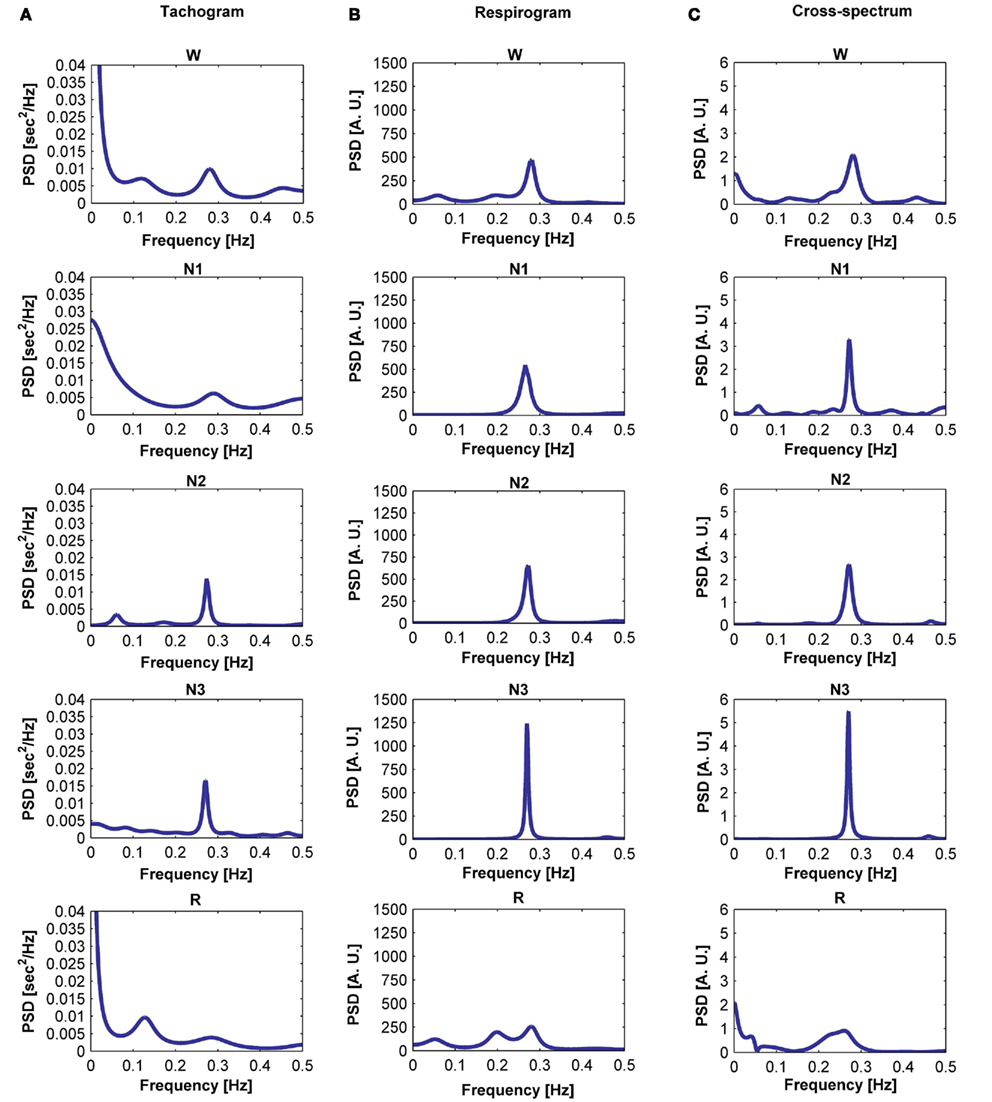
Figure 3. Power spectral density (PSD) computed from the tachogram of a subject during wakefulness, sleep stages N1, N2, and N3 and REM sleep, during the first sleep cycle (A); PSD computed from the respirogram of the same subject during wakefulness, sleep stages N1, N2, and N3 and REM sleep, during the first sleep cycle (B); cross-spectrum between the tachogram and the respirogram of the same subject during wakefulness, sleep stages N1, N2, and N3 and REM sleep, during the first sleep cycle (C).
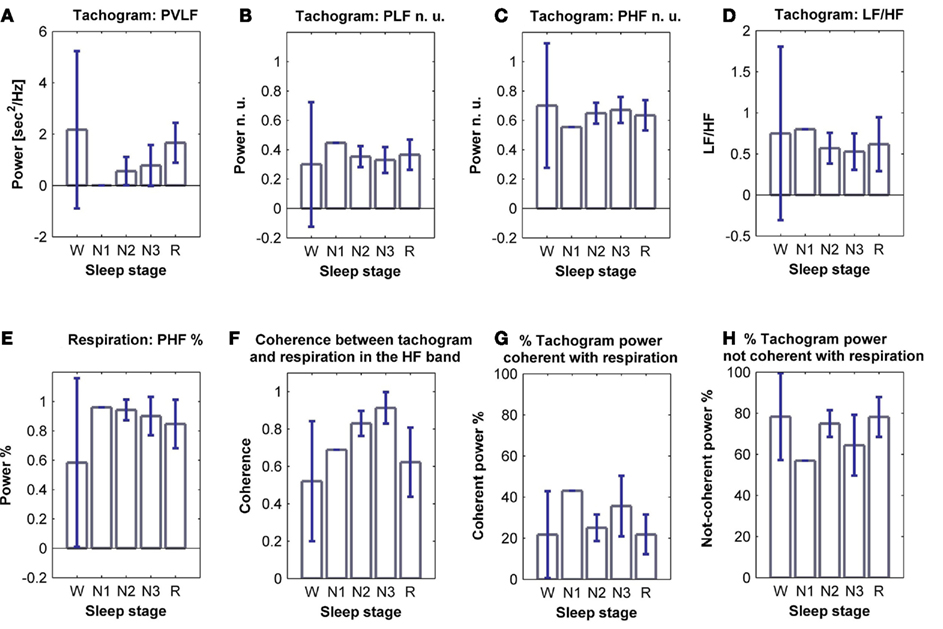
Figure 4. Power of (A) VLF, (B) LF n. u. and (C) HF n. u. power, and (D) LF/HF ratio calculated from the tachogram of one subject, for wakefulness and the different sleep stages, for the whole night; (E) HF % power calculated from the respirogram of the same subject, for wakefulness and the different sleep stages, for the whole night; (F) coherence between the tachogram and the respirogram in the HF band, tachogram power % (G) coherent and (H) not-coherent with the respirogram, calculated on the same subject for wakefulness and the different sleep stages, for the whole night. SD values are indicated in blue.
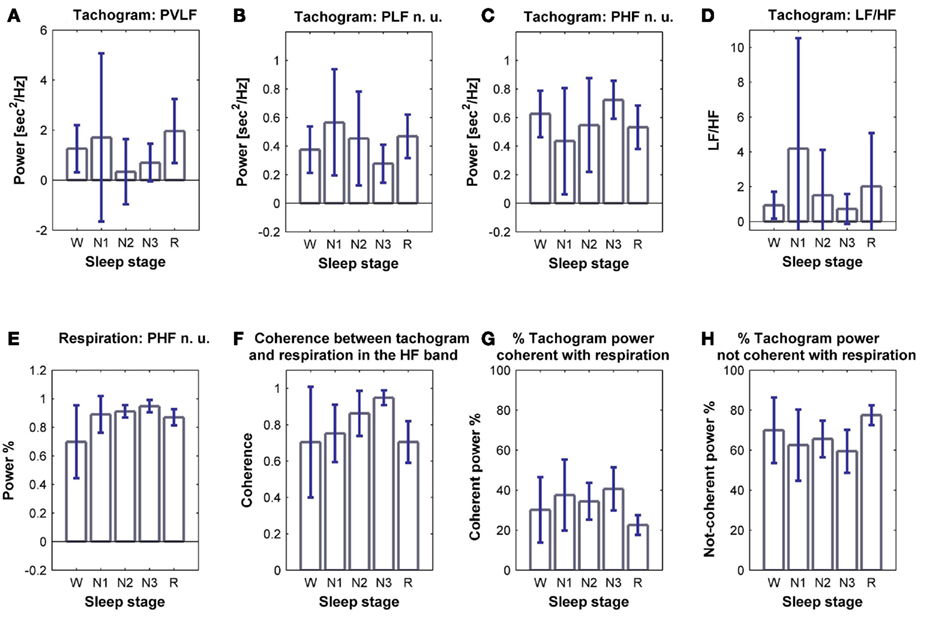
Figure 5. Average power of (A) VLF, (B) LF n. u. and (C) HF n. u. power, and (D) LF/HF ratio calculated from the tachogram, on all subjects, for wakefulness and the different sleep stages, for the whole night; (E) average HF % power calculated from the respirogram, on all subjects, for wakefulness and the different sleep stages, for the whole night; (F) coherence between the tachogram and the respirogram in the HF band, tachogram power % (G) coherent and (H) not-coherent with the respirogram, calculated on all subjects for wakefulness and the different sleep stages, for the whole night. SD values are indicated in blue.
The LF/HF ratio, an index of sympathetic activation, after an initial increase during sleep stage N1, decreases with synchronization of sleep (deep sleep), and increases during REM sleep. The results obtained from the elaboration of the respirogram show that the HF% power increases during deep sleep and decreases during REM sleep.
The bivariate analysis results show that the coherence between the tachogram and the respirogram in the HF band progressively increases with synchronization of sleep and decreases during REM sleep.
The behavior of the LF/HF ratio and that of the coherence between the tachogram and the respirogram in the HF band were studied during the whole night to investigate the changes among the different sleep cycles. Results obtained on two different subjects are presented in Figures 6 and 7. For the first subject the tachogram LF/HF ratio increases during the REM phase of every sleep cycle and the increase becomes slightly more pronounced during the last part of the night, with the LF/HF ratio reaching its highest value during the last sleep cycle REM phase. An opposite behavior was observed for the second subject, with the LF/HF ratio increase during the REM stage becoming less pronounced as the night progresses. Table 1 summarizes the average values of the tachogram normalized power in the LF and HF bands, of the LF/HF ratio, of the respirogram power in the HF band and of the tachogram–respirogram coherence in the HF band observed on all subjects during each stage of each sleep cycle. The results obtained from the ANOVA analysis between the values observed during deep NREM sleep periods (stage N3) and during REM sleep periods are also reported in Table 1.
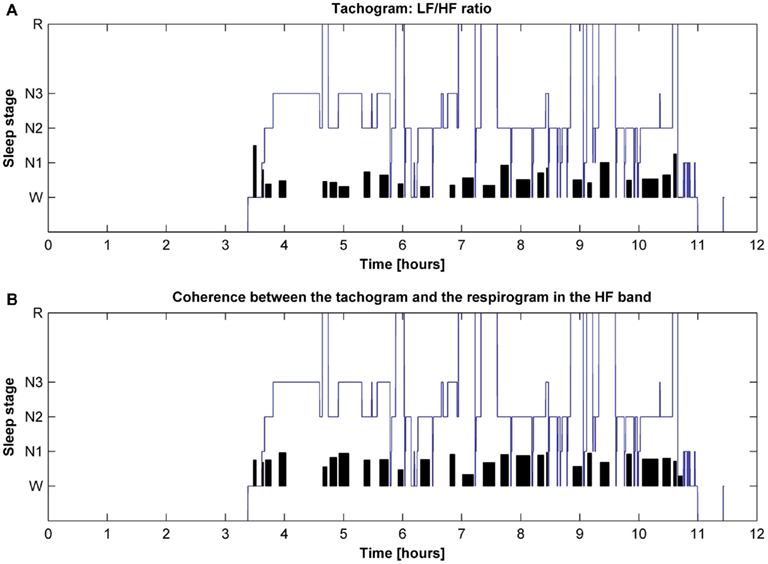
Figure 6. Hypnogram of one subject with indication in black of (A) the trend of the tachogram LF/HF ratio for the whole night and of (B) the trend of the coherence between the tachogram and the respirogram in the HF band.
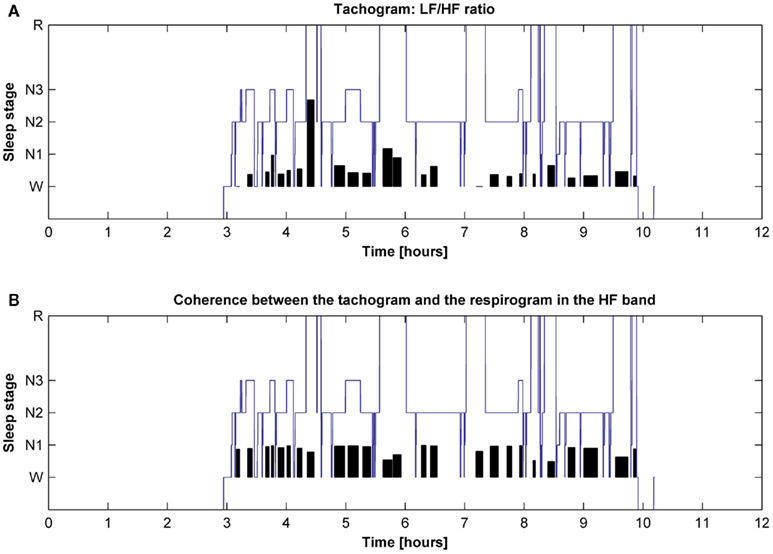
Figure 7. Hypnogram of one subject with indication in black of (A) the trend of the tachogram LF/HF ratio for the whole night and of (B) the trend of the coherence between the tachogram and the respirogram in the HF band.
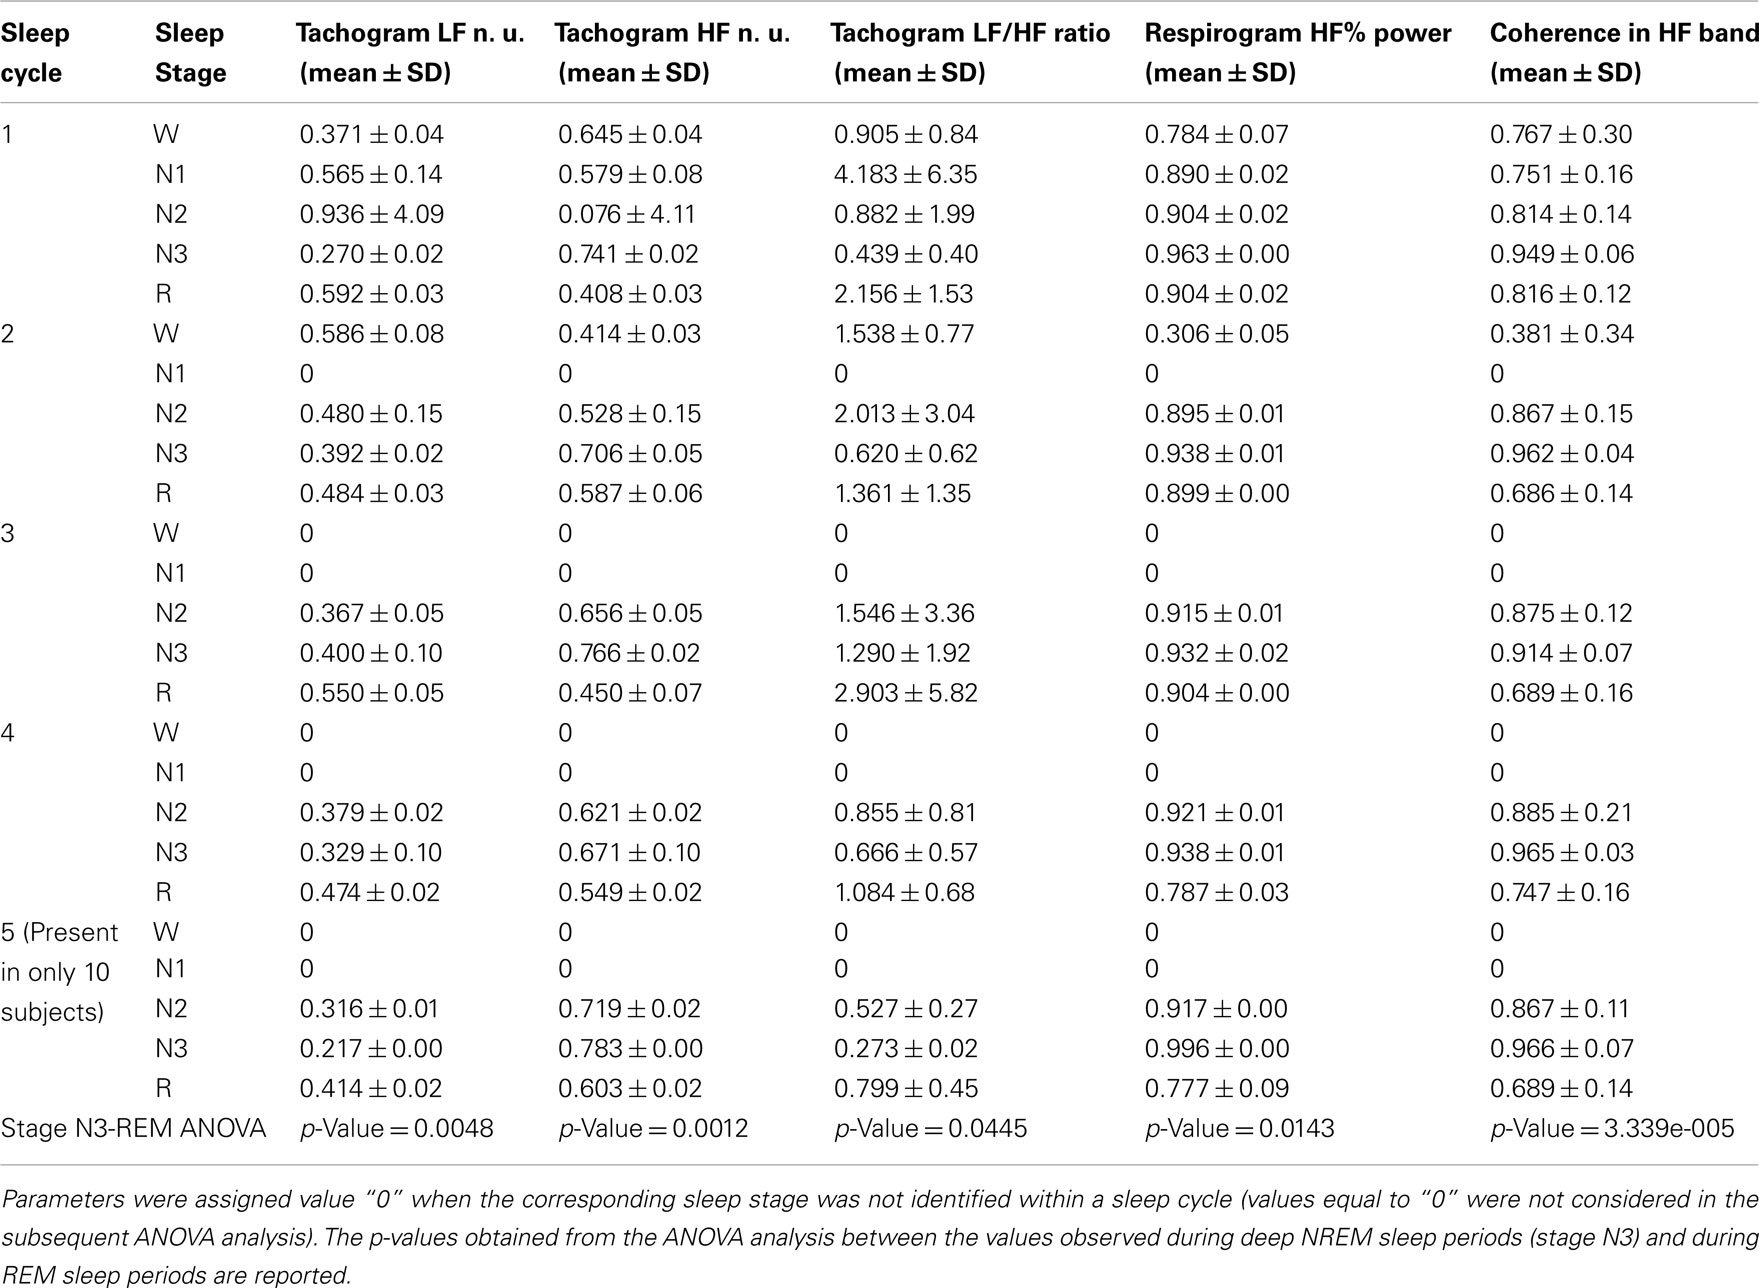
Table 1. Average values of the tachogram normalized power in the LF and HF bands, of the LF/HF ratio values, of the respirogram % power in the HF band and of the tachogram–respirogram coherence in the HF band values observed on all subjects during each stage of each sleep cycle.
Discussion
During the past decades a number of studies demonstrated that fluctuations in the autonomic modulation on the HR are reflected in changes in the spectral distribution of the HRV signal (Pagani et al., 1986; Task Force of the European Society of Cardiology and the North American Society of Pacing and Electrophysiology, 1996; Pumprla et al., 2002). This was confirmed to be an accurate indicator of the ANS activity, with the LF and the HF components being considered as representative of the sympathetic and parasympathetic activity, respectively, and the LF/HF ratio providing information about the sympatho-vagal balance (Task Force of the European Society of Cardiology and the North American Society of Pacing and Electrophysiology, 1996; Rajendra et al., 2006).
In the present study the HRV signal and the respiration signal recorded from 11 healthy subjects during sleep were studied to investigate the effects of the autonomic nervous modulation during different sleep stages. Stage-dependent changes in the autonomic modulation of cardiac activity were observed.
The LF n. u. power decrease during deep sleep and increase during REM sleep suggested a diminished sympathetic modulation during deep sleep as compared to the wakefulness state and an augmented sympathetic tone toward the end of each sleep cycle. The HF n. u. behavior was indicative of an increased vagal drive to the heart during sleep, which decreased during REM sleep.
The sympatho-vagal balance drift toward the sympathetic component during deep sleep and toward the parasympathetic component during REM sleep was confirmed by the LF/HF ratio behavior. The LF/HF ratio decreased during sleep, reaching its minimum in correspondence of sleep stage N3 and increasing in correspondence of the REM phase. Altogether, the observed behavior is in accordance with previous studies (Scholz et al., 1997; Viola et al., 2011). The changes in the sympatho-vagal balance could be driven by oscillations in the metabolic demand during sleep, which markedly decreases during deep sleep (Wilde-Frenz and Schulz, 1983), and increases during REM sleep.
A bivariate analysis was conducted in order to take into account also the cardio-respiratory coupling during the different sleep stages. The correlation between cardiac and respiratory rhythms has been widely acknowledged (Kabir et al., 2010). The HF range of the HRV signal coincides with the respiratory rhythm; thus, the HF component is able to provide information about respiration frequency and its modulation (Kobayashi, 2009). The cross-spectrum between the tachogram and the respirogram presents a more pronounced peak centered in the HF band during sleep stages N1, N2, and N3 as compared to that of the wake state, whereas the peak practically disappears during REM sleep. The peak becoming more pronounced and more narrowly distributed during deep sleep stages is indicative of a more regular respiratory rhythm, synchronized with heart activity; the presence of a less pronounced peak during REM sleep indicates that a less regular respiratory rhythm and a less marked synchronization between respiration and heart rhythm characterize this sleep stage, in line with the results obtained from previous studies (Kabir et al., 2010). The coherence value between the tachogram and the respirogram in the HF band increases during deep sleep and decreases during REM sleep. This confirms that a more pronounced synchronization between respiration and heart beat is acquired with progression of sleep, with them becoming less synchronized during the REM phase, in accordance with a previous study (Unbehaun et al., 1996). Cardiac and respiratory rhythms have been long known to interact with each other and the investigation of their synchronization can provide useful indications about the way they interact. Synchronization was demonstrated to change during specific states, such as during mechanical ventilation (Mangin et al., 2009), anesthesia (Galletly and Larsen, 2001), physical exercise (Kenwright et al., 2008), and sleep (Kabir et al., 2010). Cardio-respiratory coordination during sleep changes in pathological conditions, as demonstrated in patients affected by Obstructive Sleep Apnea (Kabir et al., 2010) or Sleep Disordered Breathing (Guo et al., 2011). Furthermore, it changes depending on the general health status of a subject, resulting, e.g., more pronounced in athletes than in non-athletes (Kenwright et al., 2008). Thus, although the functional role and physiological origin of such interaction remain uncertain, synchronization analysis could be used as a tool to obtain information about the health status of an individual. To summarize, strong evidence was found of a drift of the sympatho-vagal balance toward the parasympathetic activity during deep sleep and toward the sympathetic activity during REM sleep, in line with previous experimental evidence (Scholz et al., 1997; Lanfranchi et al., 2007). Regularization of respiration was found to go along with synchronization of sleep, with respiration becoming more irregular during REM sleep.
A statistically significant difference (p-value ≤ 0.05) was found between the values of the tachogram normalized power in the LF and HF bands, of the tachogram LF/HF ratio values, of the respirogram % power in the HF band and of the tachogram–respirogram coherence in the HF band values recorded during deep sleep NREM periods and REM sleep periods, during the whole night, as the ANOVA results show. The global results presented in Table 1 show that, with progression of sleep, sleep stage N1 tends to disappear, suggesting a better quality of sleep is progressively reached along the night. Anyway, a clear trend in the sympatho-vagal balance during the night could not be identified for the whole group: a shift toward the sympathetic component during REM sleep was more evident during the final sleep cycles for some subjects and during the initial ones for others. Disagreement exists about whether the sympathetic drive to the heart during REM sleep becomes more or less intense along the night (Cajochen et al., 1994; Marciani et al., 2003; Lanfranchi et al., 2007). Discordant results might be due to differences in experimental protocols and analysis methodologies and the sympatho-vagal behavior with progression of the night needs to be further investigated.
In the present work sophisticated biosignal processing methods were applied to assess autonomic cardiac and respiratory regulation during different sleep stages. Spectral analysis has long been applied to the HRV signal; the authors presented the results of the application of spectral analysis methods to the respiration signal, aimed to investigate the cardiopulmonary coupling during sleep.
Our findings affirm spectral analysis of HRV and respiration signals to be a useful tool to non-invasively and accurately investigate the autonomous modulation of not only the cardiac activity, but also of the respiratory activity and to assess the cardio-respiratory coupling variations during sleep.
Conflict of Interest Statement
The authors declare that the research was conducted in the absence of any commercial or financial relationships that could be construed as a potential conflict of interest.
Acknowledgments
The research presented in this paper was supported by the EU project PSYCHE, Grant Agreement: 247777.
References
Baselli, G., Cerutti, S., Civardi, S., Malliani, A., and Pagani, M. (1988). Cardiovascular variability signals: towards the identification of a closed-loop model of the neural control mechanisms. IEEE Trans. Biomed. Eng. 35, 1033–1046.
Baselli, G., Porta, A., Rimoldi, O., Pagani, M., and Cerutti, S. (1997). Spectral decomposition in multichannel recordings based on multivariate parametric identification. IEEE Trans. Biomed. Eng. 44, 1092–1101.
Bianchi, A., Bontempi, B., Cerutti, S., Gianogli, P., Comi, G., and Natali Sora, M. G. (1990). Spectral analysis of heart rate variability signal and respiration in diabetic subjects. Med. Biol. Eng. Comput. 28, 205–211.
Cajochen, C., Pischke, J., Aeschbach, D., and Borbely, A. A. (1994). Heart rate dynamics during human sleep. Physiol. Behav. 55, 769–774.
Caples, S. M., Garcia-Touchard, A., and Somers, V. K. (2007) , Sleep-disordered breathing and cardiovascular risk. Sleep 30, 291–303.
Casolo, G. C., Stroder, P., Signorini, C., Calzolari, F., Zucchini, M., Balli, E., Sulla, A., and Lazzerini, S. (1992). Heart rate variability during the acute phase of myocardial infarction. Circulation 85, 2073–2079.
Cysarz, D., Bettermann, H., Lange, S., Geue, D., and van Leeuwen, P. (2004). A quantitative comparison of different methods to detect cardiorespiratory coordination during night-time sleep. Biomed. Eng. Online 3, 44.
Galletly, D. C., and Larsen, P. D. (2001). Inspiratory timing during anaesthesia: a model of cardioventilatory coupling. Br. J. Anaesth. 86, 777–788.
Guo, D., Peng, C. K., Wu, H. L., Mietus, J. E., Liu, Y., Sun, R. S., and Thomas, R. J. (2011). ECG-derived cardiopulmonary analysis of pediatric sleep-disordered breathing. Sleep Med. 12, 384–389.
Iber, C., Ancoli-Israel, S., Chesson, A. L., and Quan, S. F. (2007). The AASM Manual for the Scoring of Sleep and Associated Events: Rules, Terminology, and Technical Specifications. Westchester, IL: American Academy of Sleep Medicine.
Kabir, M. M., Dimitri, H., Sanders, P., Antic, R., Nalivaiko, E., Abbott, D., and Baumert, M. (2010). Cardiorespiratory phase-coupling is reduced in patients with obstructive sleep apnea. PLoS ONE 5, 10602. doi:10.1371/journal.pone.0010602
Kay, S. M., and Marple, S. L. (1981). Spectrum analysis: a modern perspective. Proc. IEEE 69, 1380–1429.
Kemper, K. J., Hamilton, C., and Atkinson, M. (2007). Heart rate variability: impact of differences in outlier identification and management strategies on common measures in three clinical populations. Pediatr. Res. 62, 337–342.
Kenwright, D. A., Bahraminasab, A., Stefanovska, A., and McClintock, P. V. (2008). The effect of low-frequency oscillations on cardio-respiratory synchronization: observations during rest and exercise. Eur. Phys. J. B 65, 425–433.
Kobayashi, H. (2009). Does paced breathing improve the reproducibility of heart rate variability measurements? J. Physiol. Anthropol. 28, 225–230.
Lanfranchi, P. A., Fradette, L., Gagnon, J. F., Colombo, R., and Montplaisir, J. (2007). Cardiac autonomic regulation during sleep in idiopathic REM sleep behavior disorder. Sleep 30, 1019–1025.
Lotric, M. B., and Stefanovska, A. (2000). Synchronization and modulation in the human cardiorespiratory system. Physica A 283, 451–461.
Mangin, L., Clerici, C., Similowski, T., and Poon, C. S. (2009). Chaotic dynamics of cardioventilatory coupling in humans: effects of ventilatory modes. Am. J. Physiol. Regul. Integr. Comp. Physiol. 296, R1088–R1097.
Marciani, M. G., Placidi, F., Aquilani, S., Romigi, A., Tombini, M., Massaro, M., Galante, A., and Iellamo, F. (2003). Sleep-related changes in baro reflex sensitivity and cardiovascular autonomic modulation. J. Hypertens. 21, 1555–1561.
Pagani, M., Lombardi, F., Guzzetti, S., Rimoldi, O., Furlan, R., Pizzinelli, P., Sandrone, G., Malfatto, G., Dell’Orto, S., Piccaluga, E., Turiel, M., Baselli, G., Cerutti, S., and Malliani, A. (1986). Power spectral analysis of heart rate and arterial pressure variabilities as a marker of sympatho-vagal interaction in man and conscious dog. Circ. Res. 59, 178–193.
Pan, J., and Tompkins, W. J. (1985). A real-time QRS detection algorithm. IEEE Trans. Biomed. Eng. 32, 230–236.
Penttilä, J., Helminen, A., Jartti, T., Kuusela, T., Huikuri, H. V., Tulppo, M. P., Coffeng, R., and Scheinin, H. (2001). Time domain, geometrical and frequency domain analysis of cardiac vagal outflow: effects of various respiratory patterns. Clin. Physiol. 21, 365–376.
Pumprla, J., Howorka, K., Groves, D., Chester, M., and Nolan, J. (2002). Functional assessment of heart rate variability: physiological basis and practical applications. Int. J. Cardiol. 84, 1–14.
Rajendra, A. U., Paul, J. K., Kannathal, N., Lim, C. M., and Suri, J. S. (2006). Heart rate variability: a review. Med. Biol. Eng. Comput. 44, 1031–1051.
Scholz, U. J., Bianchi, A. M., Cerutti, S., and Kubicki, S. (1997). Vegetative background of sleep: spectral analysis of the heart rate variability. Physiol. Behav. 62, 1037–1043.
Task Force of the European Society of Cardiology and the North American Society of Pacing and Electrophysiology. (1996). Heart rate variability. Standards of measurement, physiological interpretation and clinical use. Eur. Heart J. 17, 354–381.
Unbehaun, A., Mrowka, R., Schubert, E., Patzak, A., and Schwarz, V. (1996). Interaction of heart-rate fluctuations and respiration in 12 to 14-year-old children during sleeping and waking. J. Auton. Nerv. Syst. 57, 141–143.
Vanderlei, L. C., Pastre, C. M., Hoshi, R. A., Carvalho, T. D., and Godoy, M. F. (2009). Basic notions of heart rate variability and its clinical applicability. Rev. Bras. Cir. Cardiovasc. 24, 205–217.
Viola, A. U., Tobaldini, E., Chellappa, S. L., Casali, K. R., Porta, A., and Montano, N. (2011). Short-term complexity of cardiac autonomic control during sleep: REM as a potential risk factor for cardiovascular system in aging. PLoS ONE 6, e19002. doi:10.1371/jour-nal.pone.0019002
Keywords: heart rate variability signal, respiration, autonomic modulation, sympatho-vagal balance, sleep
Citation: Cabiddu R, Cerutti S, Viardot G, Werner S, and Bianchi AM (2012) Modulation of the sympatho-vagal balance during sleep: frequency domain study of heart rate variability and respiration. Front. Physio. 3:45. doi: 10.3389/fphys.2012.00045
Received: 14 December 2011; Accepted: 20 February 2012;
Published online: 09 March 2012.
Edited by:
Riccardo Barbieri, Harvard Medical School, USAReviewed by:
Ramakrishna Mukkamala, Michigan State University, USAThomas Penzel, Charite Universitätsmedizin Berlin, Germany
Copyright: © 2012 Cabiddu, Cerutti, Viardot, Werner and Bianchi. This is an open-access article distributed under the terms of the Creative Commons Attribution Non Commercial License, which permits non-commercial use, distribution, and reproduction in other forums, provided the original authors and source are credited.
*Correspondence: Sergio Cerutti, Department of Biomedical Engineering, Politecnico di Milano, Piazza L. da Vinci 32, Milano 20133, Italy. e-mail:c2VyZ2lvLmNlcnV0dGlAcG9saW1pLml0

 Sergio Cerutti1*
