- 1 Department of Medicine (Cardiology), David Geffen School of Medicine University of California, Los Angeles, CA, USA
- 2 Department of Mathematics, Loyola Marymount University, Los Angeles, CA, USA
Intracellular calcium (Ca) cycling dynamics in cardiac myocytes is regulated by a complex network of spatially distributed organelles, such as sarcoplasmic reticulum (SR), mitochondria, and myofibrils. In this study, we present a mathematical model of intracellular Ca cycling and numerical and computational methods for computer simulations. The model consists of a coupled Ca release unit (CRU) network, which includes a SR domain and a myoplasm domain. Each CRU contains 10 L-type Ca channels and 100 ryanodine receptor channels, with individual channels simulated stochastically using a variant of Gillespie’s method, modified here to handle time-dependent transition rates. Both the SR domain and the myoplasm domain in each CRU are modeled by 5 × 5 × 5 voxels to maintain proper Ca diffusion. Advanced numerical algorithms implemented on graphical processing units were used for fast computational simulations. For a myocyte containing 100 × 20 × 10 CRUs, a 1-s heart time simulation takes about 10 min of machine time on a single NVIDIA Tesla C2050. Examples of simulated Ca cycling dynamics, such as Ca sparks, Ca waves, and Ca alternans, are shown.
1. Introduction
Calcium (Ca) signaling is fundamental to many biological functions (Berridge et al., 2000). In cardiac myocytes, Ca cycling is regulated by a diffusively coupled network of Ca release units (CRUs), which plays a central role in cardiac excitation-contraction coupling and heart rhythms (Bers, 2002; Lakatta et al., 2010). The elementary Ca cycling event is a Ca spark (Cheng et al., 1993; Cheng and Lederer, 2008). Ca sparks are discretized Ca release events due to random and collective openings of the ryanodine receptor (RyR) channels clustered in a CRU. A typical cardiac myocyte includes about 10,000–20,000 CRUs, and the spatial arrangement of CRUs varies widely across different myocyte types and changes in diseased conditions (Franzini-Armstrong et al., 1999; Soeller and Cannell, 1999; Chen-Izu et al., 2007; Soeller et al., 2007; Wei et al., 2010). The mathematical modeling of subcellular Ca cycling presents many numerical challenges that are unique to the Ca subsystem.
One challenge is the fact that Ca concentration gradients between the myoplasmic space and other intra and intercellular subspaces are extremely large. Ca concentrations outside the cell in the extracellular space are roughly 1.8 mM, but prolonged exposure to high Ca concentrations in the myoplasm are toxic to the cell. Thus, intracellular Ca is highly buffered (Bers, 2002) and the cell expends energy through membrane pumps to maintain a steady state free Ca level of about 0.1 μM in the myoplasm. However, high Ca levels are necessary (and need to be accessed quickly) in order to interact with the myofibrils and cause contraction. The cell’s solution is an intracellular storage space called the sarcoplasmic reticulum (SR). Steady state levels of free Ca in the SR are in the range of 1 mM, about the same order of magnitude of Ca concentration that exists outside the cell in the extracellular space, and around four orders of magnitude larger than in the myoplasm. The large concentration gradient results is an extremely high Ca flux whenever a Ca channel opens to connect the myoplasm to the SR or extracellular spaces. This is optimal for cellular function since a large amount of Ca enters the myoplasm quickly, as is necessary for contraction. But this causes problems for numerical simulation as the high fluxes cause the differential equations to be numerically stiff, requiring a very small time step. In addition, there exist multiple time scales in the various fluxes, and Ca is released into subspaces of the myoplasm which have extremely small volumes, presenting further numerical challenges.
Another challenge is that the dynamics of subcellular Ca are spatially dependent. Unlike other ionic concentrations, such as sodium (Na) and potassium (K), for which whole-cell averages provide reasonable approximations, subcellular Ca release is locally controlled through Ca-induced Ca release (CICR). This becomes especially important when trying to understand arrhythmogenic phenomena such as delayed afterdepolarizations which are triggered by Ca waves. To gain insight into the initiation of Ca waves through local Ca releases and to understand the complex wave dynamics that ensue, any realistic mathematical model of Ca dynamics must include the underlying spatial structure of the Ca signaling network. This implies that instead of ordinary differential equations (ODEs) one must resort to partial differential equations (PDEs) in order to capture the spatial diffusion of Ca in both the myoplasm and the SR spaces.
A third major challenge is that subcellular Ca release is inherently stochastic. A CRU consists of 50–200 RyR channels and 5–10 L-type Ca channels (LCCs) (Soeller et al., 2007; Bers, 2008). The small number of channels involved means that averages do not well approximate the dynamics governed by the law of mass action. This suggests that instead of deterministic differential equations, one should use continuous-time discrete-state Markov models, which are notorious for their cost to solve numerically. Furthermore, the transition rates are typically dependent on state variables such as Ca concentrations in the myoplasm and SR, and are thus implicitly time-dependent, further adding to the difficulty in numerical simulation.
Despite the challenges in modeling cardiac Ca cycling and excitation-contraction coupling, mathematical, and computational models have been developed at many scales using different mathematical and computational means (Luo and Rudy, 1994; Jafri et al., 1998; Greenstein and Winslow, 2002; Sobie et al., 2002; Shiferaw et al., 2003; Wang et al., 2005; Izu et al., 2006; Groff and Smith, 2008; Restrepo et al., 2008; Williams et al., 2008, 2011; Huertas et al., 2010; Ramay et al., 2010; Rovetti et al., 2010; Wasserstrom et al., 2010), including: (1) low-dimensional deterministic models described by ODEs; (2) single CRU models with stochastically simulated individual RyRs; (3) ODE models with stochastically simulated individual RyRs coupled to a common myoplasmic pool; (4) high-dimensional deterministic models described by PDEs and stochastically simulated CRU firing (fire-diffusion-fire type models), and (5) coupled CRU network models with stochastically simulated individual RyRs. As the complexity of the model increases, the computational demands also increase tremendously due to the aforementioned issues. However, most of the above models have been implemented on central processing units (CPUs) and have used direct numerical methods for the simulation of stochastic channel openings. These numerical methods limit the use of highly resolved spatial discretizations and scale of simulations (for example, to simulate 20,000 CRUs in a whole-cell with accurate spatial diffusion of Ca). Therefore, the development of computationally efficient models and advanced numerical algorithms is important.
Here we present a recently developed three-dimensional (3D) spatially distributed Ca cycling model in which CRUs are locally coupled by Ca diffusion throughout the myoplasmic (Myo) and sarcoplasmic reticulum (SR) domains, improved from our previous CRU network model (Rovetti et al., 2010). The Ca cycling model has been coupled to the action potential (AP) model of the rabbit ventricular myocyte (Mahajan et al., 2008), allowing for the study of excitation-contraction coupling. The major improvements to the Ca cycling model from Rovetti et al. (2010) include: (1) 100 × 20 × 10 CRUs which corresponds to the number of CRUs in a typical myocyte and the Myo and SR spaces are modeled as true 3D spaces. (2) The phenomenological LCC model (Rovetti et al., 2010) has been replaced by a 7-state model based on experimental patch-clamp data obtained in isolated rabbit ventricular myocytes (Mahajan et al., 2008). In addition, we used a time-dependent version of Gillespie’s method for the fast computation of the stochastic opening of the RyRs and LCCs. All numerical algorithms were implemented using graphical processing units (GPUs). These advanced numerical and computational methods allow us to use highly resolved Myo and SR spaces for accurate Ca diffusion. We first present the mathematical details of the model, and then the advanced numerical algorithms we developed and/or employed for their solution. Finally we show how these algorithms are implemented using GPUs and the computational efficacy is discussed. Simulation results of Ca cycling and excitation-contraction coupling are shown as examples.
2. Materials and Methods
2.1. Mathematical Model
A ventricular myocyte is composed of a spatially distributed complex network of consisting of the SR, mitochondria, and myofibrils, among other organelles, as in Figure 1A. A t-tubular system (Figure 1B) facilitates effective communication of this network with the extracellular space. Ca diffuses in both the Myo and the SR, the latter of which is an interconnected network inside the cell distinguished as junctional SR (jSR) and network SR (Figure 1A). A unifying cardiac excitation-contraction picture is illustrated in Figure 1C (Bers, 2002). In a normal action potential (see Figure 1D), voltage-dependent opening of the LCCs brings Ca into the dyadic space (DS), a very small space between the LCC cluster and jSR (shaded area in Figure 1C). Elevated Ca concentrations in the vicinity of the LCCs causes their inactivation. The RyR channels open stochastically and their open probability is sensitive to Ca in the DS, a process called CICR. Therefore, the RyR channels can be triggered by Ca entry from the LCCs, high Myo and SR Ca, and Ca diffusing from neighboring CRUs. Ca entered from the LCCs and released from the SR diffuses to the myofibrils to signal contraction and participates in many other signaling processes in the myocytes. Ca is pumped back into the SR by the sarcoplasmic-endoplasmic reticulum Ca ATPase (SERCA) pump, and extruded by Na-Ca exchange (NCX). Ca is also uptaken by mitochondria through the mitochondrial uniporter and released from mitochondria via NCX in the mitochondrial membrane and opening of other channels, such as the mitochondrial permeation transition pore. LCC and NCX couple Ca and voltage bi-directionally, but all other currents also affect this coupling either indirectly via their effects on voltage or directly via Ca regulation of the ion channels.
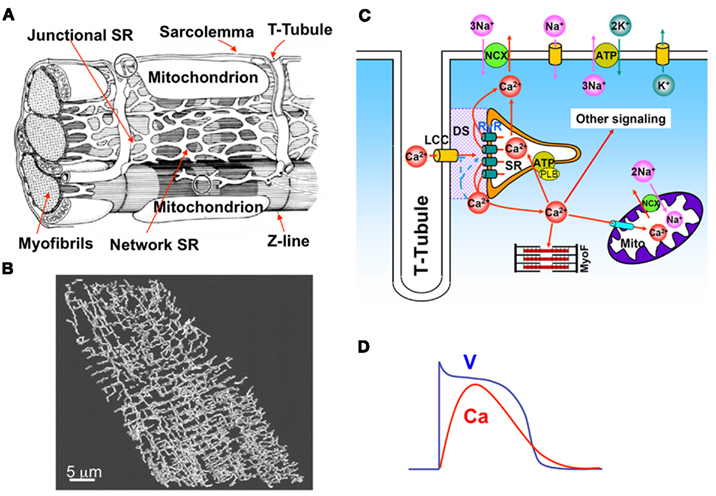
Figure 1. (A) Detailed intracellular structure in a cardiac myocyte (Katz, 2011). (B) T-tubule network of a rat ventricular myocyte (Soeller and Cannell, 1999). (C) Illustration of cardiac excitation-contraction system. (D) A typical action potential and Ca transient.
Modeling the complete detailed structure and Ca signaling of a myocyte is much too complicated and challenging, even using the most advanced computational technologies. Instead of modeling the complex detailed structure of the cell, we used a simplified approach in which we model the cell using a two-domain structure, the Myo and SR domains (see Figure 2). We assume Ca freely diffuses throughout Myo and SR domains, which is mathematically modeled by the diffusion equation. In computer simulation, the Myo and SR domains are discretized depending upon the spatial accuracy desired (see Section 2). The Myo and SR domains are coupled via SR release and uptake. Each CRU contains a Myo space, a SR space, a jSR which is diffusively connected to the SR, and a DS which is diffusively connected to the Myo. Extracellular Ca enters the DS through voltage-gated LCCs, which open stochastically and are simulated by a Markov model (see Figure 3). Ca is released from the jSR through its associated cluster of RyRs to the DS. The RyRs also open stochastically and are simulated using a Markov model in which activation and inactivation of RyRs are regulated by Ca in the DS (see Figure 3). Ca is either extruded from the cell via the Na-Ca exchanger, or taken back up into the SR via the SERCA pump.
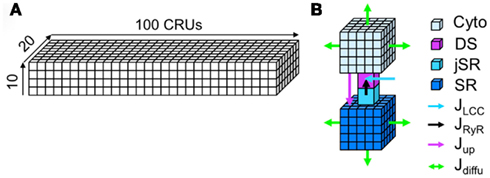
Figure 2. The spatially distributed Ca cycling model. (A) Plot of a 3D coupled CRU network. (B) Detailed illustration of a CRU.
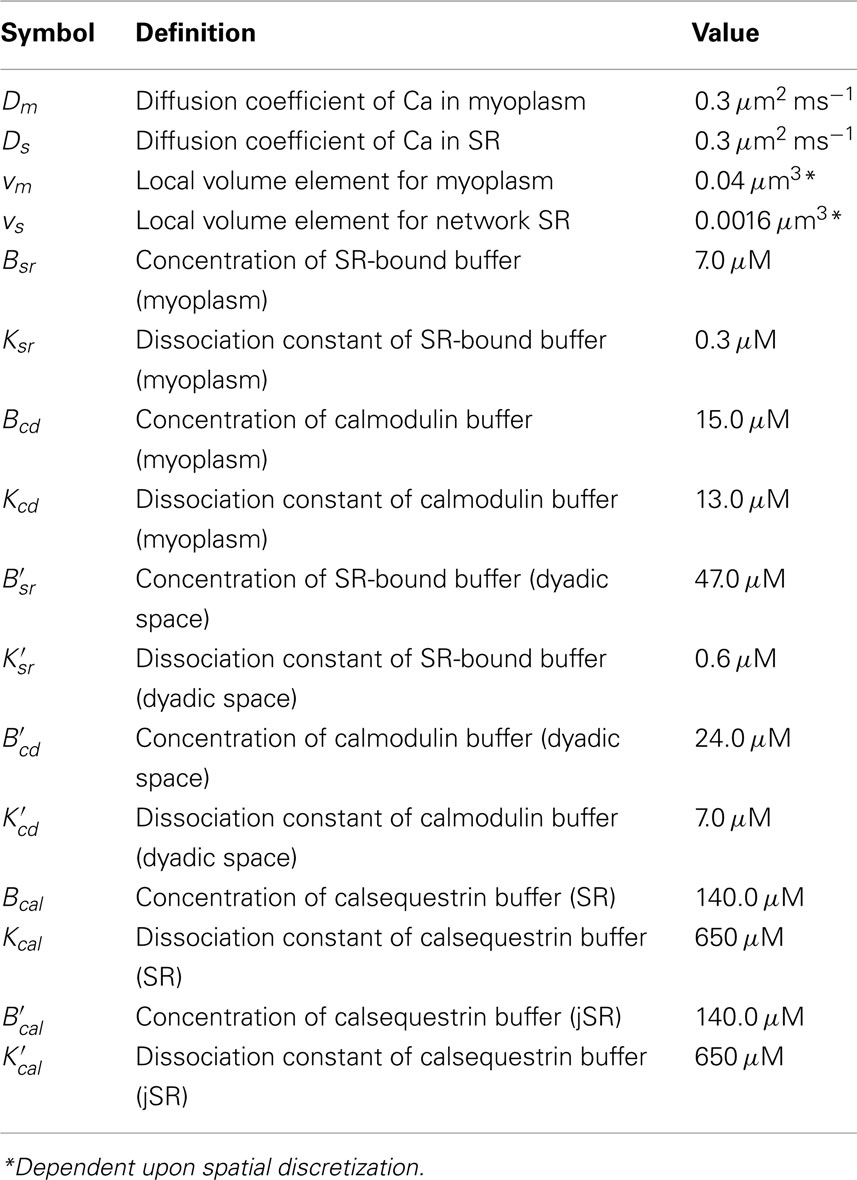
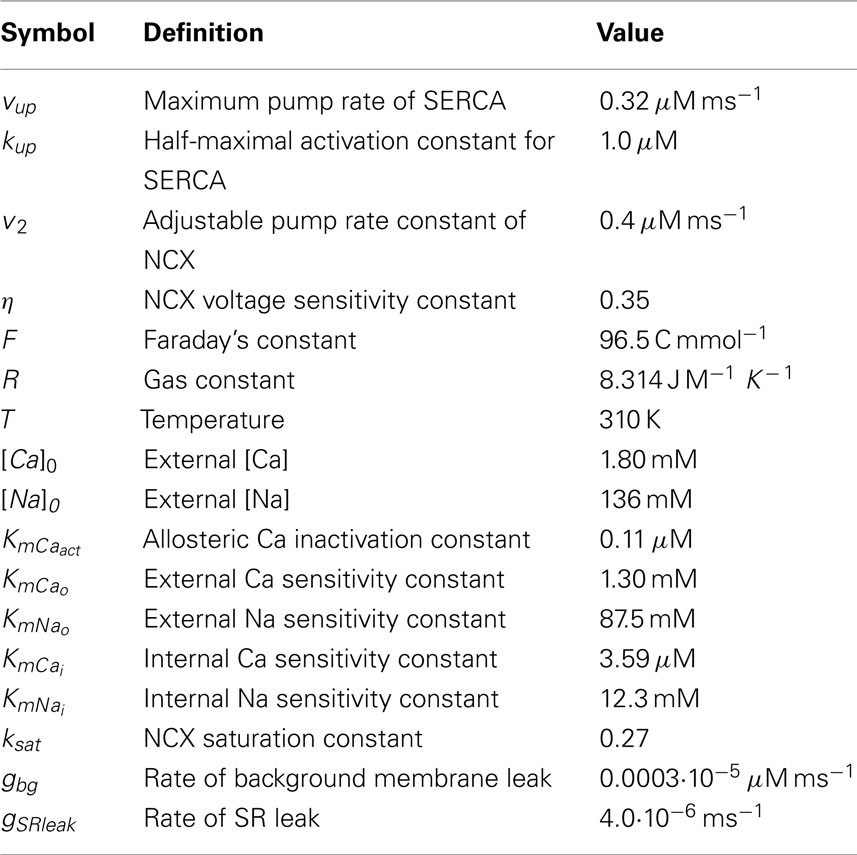
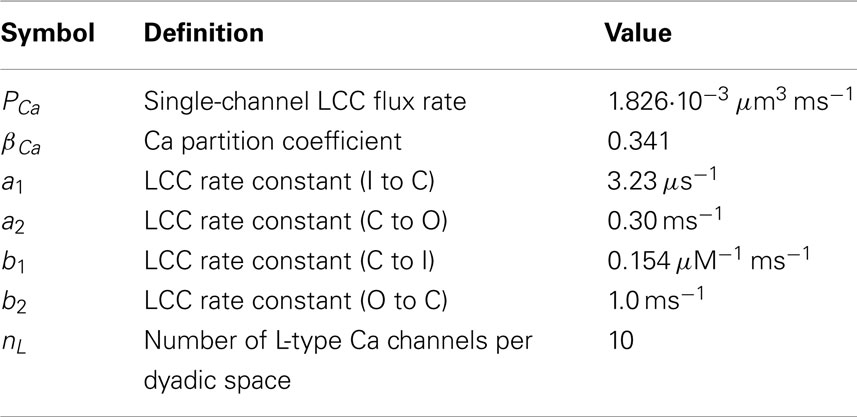
To couple the Ca cycling to voltage dynamics, we assume that the voltage is uniform across the cell membrane. The ionic currents are taken from the Mahajan model (Mahajan et al., 2008), except the Ca related currents which are computed through summing the local Ca currents from the spatial Ca cycling model. The Ca cycling parameters are mainly based on Rovetti et al. (2010) with modifications to account for the 3D geometry (see Tables 1–5). The parameters for the ionic currents used in the AP model and transition rates used in the LCC model are from Mahajan et al. (2008).
2.1.1. Ca cycling model
The time evolution of the concentration of Ca in the 3D Myo and SR domains is modeled using a system of reaction-diffusion equations. Reaction terms come in two types: continuous flux terms couple the two domains and extrude Ca from the Myo domain. Flux terms at discrete locations couple the two domains via the CRUs through a jSR compartment and a DS compartment.
The system of equations for the evolution of Ca in the cell is
where cm(x, y, z, t) and cs(x, y, z, t) are the local Ca concentrations in the Myo and SR, respectively, and and are the Ca concentration in the ith DS and ith jSR, respectively. The Myo and SR domains have diffusion coefficients Dm and Ds. We assume Ca is buffered in the Myo (βm), SR (βs), DS (βd), and jSR (βj) by both calmodulin and SR-bound proteins in the Myo and DS, and calsequestrin in the SR and jSR (Shannon et al., 2004). We also assume that such buffering occurs rapidly enough to be modeled with instantaneous capacity functions (Wagner and Keizer, 1994)
The terms Jm, Js, and represent the net current for each Ca space and are specified below. In order to account for the different volumes of the Myo, DS, SR, and jSR, the magnitudes of various fluxes between spaces are rescaled by the ratio of the appropriate volume elements vm, vd, vs, and vj, the local volumes of the Myo, DS, SR, and jSR respectively.
Myoplasm flux. Ca enters and leaves the Myo due to uptake, exchange, and background leak fluxes, with net flux
The proteins mediating the SR uptake, NCX, and cell background and SR leak fluxes are generally found distributed evenly throughout their respective regions, thus we model the corresponding fluxes as spatially continuous functions of position.
The SERCA uptake pump is modeled to be driven solely by the Myo Ca with the simple Hill function
with a maximum velocity vup and a half-maximal concentration kup.
The Ca flux through the NCX pump, JNCX, known to be a reversible flux sensitive to both Myo Ca and membrane voltage, is modeled following the physiological model of Weber et al. (2001):
where V is the net membrane potential and [Na]i is the intracellular Na concentration, both of which are dynamic variables (see Section 2). The symbols [Ca]o and [Na]o represent the extracellular Ca and Na concentrations, respectively, which are assumed to be constant.
A background Ca leak flux Jbg is driven by the membrane potential and Myo and external Ca concentrations in the form of the Nernst equation taken from Luo and Rudy (1994)
It has been shown experimentally that there is little to no voltage drop across the SR membrane and the Myo, therefore a passive Ca leak flux JSRleak out of the SR and into the Myo is modeled by a simple diffusive current dependent upon the Ca gradient
The ionic flux between the local Myo and the ith DS, defined below, is a spatially discrete flux, present only at position (x(i), y(i), Z(i)).
SR flux. Ca enters and leaves the network SR due to uptake, leak, and diffusion, with net value
The equation for the spatially discrete jSR flux is given below.
Junctional SR flux. The net flux of Ca for the ith jSR is
in which is described below, and
gives a first-order refilling of Ca form the network SR to the jSR with refilling rate gjsr.
Dyadic space flux. The net flux of Ca for the ith DS, including the fluxes through the RyRs and LCCs, is
The flux from the DS to the local Myo is dependent on the local Ca gradient with flux rate gds:
Ca flux into the DS, via either the LCC or RyR channel, is the major route of entry of Ca into the Myo. Due to the fact that this entry is governed by a small number of interacting ion channels in each DS, we represent the opening of both types of channels as simple Markov models, as described below.
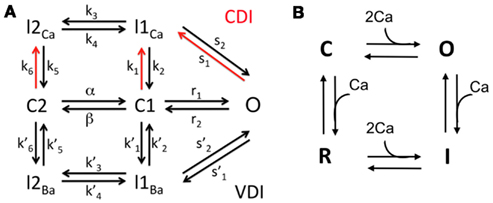
L-type Ca channel model. Each DS contains a cluster of LCCs. The kinetics of each channel are represented with a 7-state Markov model, developed in Mahajan et al. (2008) based on experimental data from rabbit ventricular myocytes (see Figure 3). It includes 4 inactive states (I2Ca, I1Ca, I2Ba, I1Ba), 2 closed states (C2, C1), and one open state (O). The transition rates are dependent upon the membrane potential V and the Ca concentration in the local DS, as opposed to an averaged Ca concentration in the submembrane space as in the original model (Mahajan et al., 2008). There are nL LCCs in a single DS, and we assume that each channel operates independently of the others. Let be a stochastic variable indicating the number of LCCs in the open state (O) at any given time in the ith DS. Then the total current through all open LCCs in the ith DS is given by the voltage-dependent Goldman-Hodgkin-Katz equation
where is the Ca concentration in the ith dyadic space (in units of nM). The current is converted to the flux with units of μM/ms, through
The dynamics of the stochastic variable are described in Section 4.
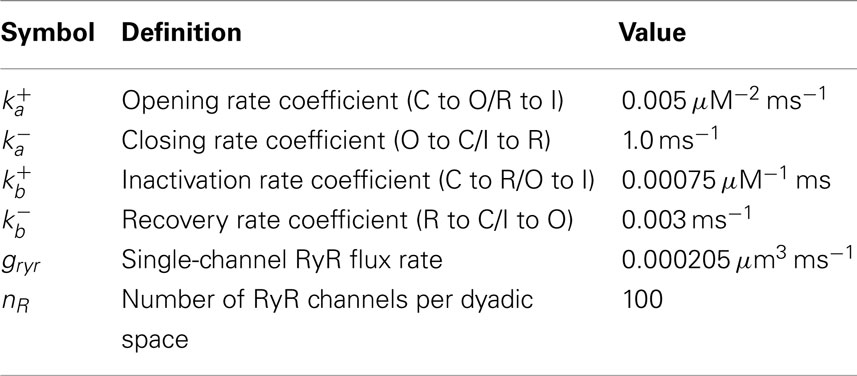
RyR channel model. Each jSR contains a cluster of RyR channels, facing the DS. The kinetics of each channel are represented with a 4-state Markov model, adapted from Stern et al. (1999; see Figure 3). The model describes the channel as having closed (C), open (O), inactivated (I), and refractory (R) states. The transition rates for the two horizontal components (C to O, and R to I) are equivalent, with forward rate dependent on the square of the DS Ca, and constant reverse rate Similarly, the transition rates for the two vertical transitions (O to I, and C to R) are equivalent, with forward rate and reverse rate In this model the RyR open probability is regulated explicitly by the Ca concentration in the DS.
There are nR RyR channels in a single jSR, and we assume that each channel operates independently of the others. Let be a stochastic variable indicating the number of RyR channels in the open state (O) at any given time in the ith DS. We model the total flux flowing through the RyR cluster as dependent on the Ca gradient between the local jSR and DS given by
where gryr is the single RyR channel flux rate. The dynamics of the stochastic variable are described in Section 4.
2.1.2. Ca and voltage coupling
We couple the above Ca cycling model with voltage by using the ionic current formulation of the rabbit ventricular myocyte model by Mahajan et al. (2008). The voltage, assuming it is uniform across the cell membrane, is described by the differential equation
where Cm is the cell membrane capacitance. The currents INa, Ito,f, Ito,s, IKr, IKs, IK1, INaK, and Istim are assumed to be uniform across the cell membrane and are taken directly from their formulation in Mahajan et al. (2008). The current IKs depends on Ca and, for simplicity, we use the average whole-cell Ca which we compute directly from the spatial Ca cycling model. The currents Ilcc, INCX, and Ibg represent the average LCC, NCX, and Ca background currents, respectively. We compute these from the local LCC, NCX, and background fluxes in the Ca cycling model through and where vcru is the cytosolic volume (in units of μm3) of a single CRU and Ncru is the total number of CRUs. Here the fluxes in equations (21) and (11) are converted to currents by the conversion factor α = −aFvcell/Cm, where a is the ionic charge of the current carrier, vcell is the volume of the myocyte in μl, and F is Faraday’s constant.
2.2. Numerical Algorithms
To integrate the reaction-diffusion system described by equation (1), we use an operator splitting scheme, described in Qu and Garfinkel (1999), applying first the flux terms and then the diffusion terms. The remaining state variables in the model are the stochastic ion channel states which are updated using Gillespie’s method (Gillespie, 2007), a new formulation of which is introduced here to handle time-dependent rates. We use the first-order forward Euler method to integrate the fluxes and diffusion (adapted to the multiple time scales involved). For the AP model, we first employ the standard Rush-Larson method (Rush and Larsen, 1978) to the quasi-linear ODEs before applying the Euler step. We choose this brute force approach because of its ease of implementation on GPUs. This is due to the fact that forward Euler is explicit and thus easily parallelized in an efficient manner. More complex implicit methods (see Strang, 1968; Qu and Garfinkel, 1999), for instance) are typically used in a non-GPU setting, however, for most problems the speed gained through implementation on a GPU typically outweighs the speed gained from a larger time step allowed by a higher-order method (Sato et al., 2009). For example, we found that the implicit second-order accurate Crank-Nicholson method (Haberman, 2004) allowed for a much larger time step than that imposed by the stability condition of the forward Euler discretization, and was thus much faster on a normal CPU. However, this method involves the inversion of a tridiagonal matrix which does not lend itself to an efficient parallelization, thus, the explicit method of forward Euler remains faster in the GPU setting.
2.2.1. Flux and diffusion
For a time step of size Δt, the Ca fluxes are updated according to the rule
Assuming a uniform spatial discretization (x, y, z) = (iΔx, jΔx, kΔx), and defining
the spatial diffusion step is applied to cm and cs according to
with c = cm, cs, respectively. We found a mesh spacing of Δx = 0.2 μm to provide a good realization of Ca diffusion.
There exist multiple time scales in the reaction-diffusion system described by equation (1): time scales associated with the spatially dependent Ca fluxes, time scales associated with Ca diffusion, time scales associated with the spatially independent ionic concentrations and membrane potential in the AP model, and time scales associated with the stochastic opening and closing of the RyR and L-type Ca channels. Thus, we would like our numerical integration scheme to take advantage of the multiple time scales involved. We choose a global time step Δtg equal to the largest time scale involved, and introduce the smaller time steps (which are evenly divisible into the global time step Δtg):
for some integers mJ, mD, and mAP. During each global time step, we update the AP variables mAP times, apply the Ca flux mJ times according to equation (25), and apply the Ca diffusion mD times according to equation (32), with each smaller time step nested within the next larger time step. The time step associated with the stochastic Ca channels is more complicated and is discussed in Section 4. The fastest time scale involved in the Ca fluxes is the flux into the DS, which we are able to eliminate using a quasi-steady state approximation (see Section 3 below). We find that taking a global time step of Δtg= 0.01 ms and mAP= 1, mD= 1, and mJ= 1 provide stable and fairly accurate results, while mAP= 1, mD= 2, and mJ= 10 provide very accurate results while maintaining reasonable simulation times (see Section 3 for performance details). Note: not only does the size of the Ca diffusion time step depend on Δx, but so does the size of the Ca flux time step since the local volume elements for the Myo and SR, vm and vs, depend upon the spatial discretization.
2.2.2. Boundary conditions
We assume that Ca cannot diffuse past the cell membrane, and thus impose first-order no flux boundary conditions. For a rectangular cell 0 ≤ x ≤ Nx, 0 ≤ y ≤ Ny, 0 ≤ z ≤ Nz this amounts to the conditions if x = 0, if x = Nx, if y = 0, if y = Ny, if z = 0, and if z = Nz.
2.2.3. Quasi-steady state approximation
Due to the small volume of the DS, fluxes into this space are typically large and thus numerically costly to integrate. This can be seen directly by letting Vd → 0 in the flux equation for the DS. A standard way to overcome this issue (Murray, 2002) is to assume that the DS equilibrates on a much faster time scale than that of the other fluxes, known as a quasi-steady state approximation. Thus, instead of numerically integrating the equation for the DS, one sets the DS flux equal to zero
which can be analytically solved for the DS concentration
2.2.4. Ion channel kinetics
The state variables NR and NL, representing the number of RyRs and LCCs in the open state for a single CRU, are modeled as continuous-time discrete-state Markov process. In what follows we drop the index i (which denoted the ith CRU) with the understanding that the algorithm is independently executed for each CRU.
Each dyadic space is treated as a single-pool element, thus, each ion channel (of a given type) in the same CRU experiences the same dyadic space environment. Therefore, each channel in a cluster has identical transition rates and we can treat each channel type as a group, tracking only the number of channels in each possible state (Gillespie, 2007). Let Ns represent the number of states in the underlying Markov model with Nt possible transitions between states. Furthermore, let λjk with l ≤ j, k ≤ Ns, j ≠ k, denote the transition rate between state j and state k, and let Nj be the number of channels in the jth state.
Direct stochastic simulation method. The most direct method for the simulation of the above Markov process is to assume a sufficiently small time step dt such that at most one transition will take place during time dt, i.e., there exists exactly one j and one k such that Nj → Nj− 1 and Nk → Nk+ 1 or no change takes place. One then partitions the unit interval into Nt− 1 partitions of length Njλjkdt and one partition of length 1 − ΣNjλjkdt, where Njλjkdt represents the transition probability from state j to state k during time dt. Finally, one chooses a number uniformly distributed on the unit interval to determine which transition takes place.
There are two problems with the above method. First, it requires the choice of a small time step dt, which must be small enough to handle the fastest time scale involved. For time-dependent rates this is inefficient since it does not allow one to take advantage of possible time periods for which the transition rates are low. For example, the local Ca concentrations during a Ca spark can be as much as 200 times higher than during periods of inactivity, thus, the Ca dependent transition rates (some of which depend on the square of the Ca concentration in the dyadic space) can vary by 4 orders of magnitude. In Rovetti et al. (2010), a modified version of the direct method was introduced which allows for a variable time step during a single global time step, however, the method still requires one to chose a small time scale, and thus still suffers from the second problem which affects the efficiency of every direct method: it only converges to the appropriate statistics in the limit dt → 0. Therefore, we would like to use a better approach known as Gillespie’s method. Gillespie’s method is exact in the sense that it does not require the choice of a small time step dt, yet it reproduces the appropriate statistics exactly. However, the classic version of Gillespie’s method only applies to time-independent processes.
Below we introduce a modification of Gillespie’s method to handle time-dependent transition rates in an efficient manner based on an integral formulation. A similar method based on the integral approach was first used to simulate single-channel kinetics in the Hodgkin and Huxley model of nerve membrane ion conductances (Clay and DeFelice, 1983). Here we provide an explicit algorithm for the integral approach along with a new formulation which makes use of the total transition rate to calculate the wait time to the first transition, as opposed to keeping track of the state of each channel separately. In the setting of subcellular Ca modeling, other (non-direct) methods have been implemented to account for time-dependent transition rates (see, for instance, Restrepo et al., 2008; Williams et al., 2008).
Time-adaptive Gillespie’s method. Suppose the above Markov chain with time-dependent total transition rate λ(t) = ΣNiλij is in a given state at time t = 0, and let T be the random variable representing the wait time from t = 0 to the first transition out of the current state. Then it is straight forward to show that the wait time T is exponentially distributed with probability density function
It follows from the standard inversion generating method of Monte Carlo theory (Gillespie, 2007) that one can generate a realization of T satisfying the above density function by selecting a random number r that is uniformly distributed on the unit interval, and solving the equation
for T. For time-independent transition rates the above can be explicitly solved for T
the classic wait time in Gillespie’s method for time-independent rates.
The above method is exact in the sense that no approximations have been made in the derivation of equation (38), thus, T exactly follows the statistics given by the probability density function in equation (37). In practice, however, the total transition rate λ is an implicit function of time through its dependence on other time-dependent state variables, and we must numerically approximate the integral in equation (38) in order to solve for T. Therefore, assume that we are using a global time step of size Δt to numerically integrate the Ca fluxes in our operator splitting scheme. Over a time step of length Δt we can treat λ(t) as a constant and use the normal Gillespie algorithm to calculate the wait time to the next transition. Let tloc represent the local time during a single global time step Δt (see Figure 4). For tloc< Δt, we continue to update the local time step according to Gillespie’s algorithm using equation (39). Once we the local time exceeds Δt we must then numerically integrate equation (38).
The details of the algorithm are as follows:
1. Draw a random number r uniformly distributed on the unit interval and let Lr= −ln(r).
2. Set tloc= 0. Numerically solve equation (38), which is equivalent to evaluating the quantity
If m ≤ 0 then a transition occurs during the current global time step after a local time step of length
Let tloc= T and proceed to Step 4. Otherwise proceed to Step 3.
3. Since m > 0, the local wait time is greater than the global time step Δt. On the next global time step continue to numerically solve equation (38), which is equivalent to letting
If m ≤ 0 then a transition occurs during the current global time step after a local time step of length
Let tloc= T and proceed to Step 4. Otherwise repeat the current step.
4. Calculate the individual transition probabilities Niλij and the total transition probability λ = ΣNiλij. Partition the interval [0,λ] into Nt partitions of length Niλij. Draw a random number s uniformly distributed on the interval [0, λ]. Make the transition corresponding to where s falls. Go to the next step.
5. Draw a random number r uniformly distributed on the unit interval and calculate
If tloc+ T < Δt then let tloc → tloc+ T and go back to Step 4. Otherwise, integrate what remains in the interval by letting
and start at Step 2 on the next global time step.
There are many advantages to the above method. For example, there may be times for which a transition does not take place for multiple global time steps, thus this method is numerically efficient.
2.3. GPU computation
2.3.1. Hardware
The integration of the complete mathematical model was done on GPUs. We performed simulations on single NVIDIA Tesla C2050 high-performance Fermi-based GPGPU supporting ECC and double precision. Four Tesla cards were installed in a system with two quad-core 2.53 GHz Intel Xeon processors and 16 GB of RAM. The programs were written in C++ using the CUDA API and we used the GNU C++ compiler version 4.4.3 and NVIDIA CUDA version 4.0.
For the implementation of the model we started from the basic approach outlined in our previous study on the use of GPU to simulate cardiac tissue.
2.3.2. Single precision versus double precision
One potential problem with previous generations of GPU cards was that they could only handle single precision problems. The single precision did not pose any problem in our previous study on cardiac tissue simulation, apart from some measures that had to be introduced to avoid the singularity in the Goldman-Hodgkin-Katz equation, whenever this expression was used to coumpute the equilibrium potential of an ion channel.
In the subcellular Ca cycling model however it can happen in some special cases, e.g., when very accurate results are required, that the time step becomes too small for single precision computation. In these cases we used the double precision capability of the Fermi-based GPUs. We found the use of double precision to increase simulation time by approximately 20%.
2.3.3. Coupling to the action potential model
To couple the subcellular Ca cycling model to the action potential model in Mahajan et al. (2008), we have to compute the average of the various Ca fluxes and Ca concentrations (see Sec. 2.2) for each time step of the AP model. When this averaging is performed on the CPU the simulation time is completely dominated by this computation (>86% of the simulation time is spent in computing the averages). We therefore used the parallel reduction algorithm provided in NVIDIA’s CUDA SDK (Harris, 2007) to compute the averages on the GPU. The ODEs of the AP model are evaluated on the CPU. Taking advantage of the fact that the CPU can compute parallel to GPU computations, the actual solution of the AP model does not add to the simulation time, therefore the simulation time taken by the AP model (see below; Sec. 4) is equal to the execution time of the parallel reduction algorithm.
2.3.4. Performance
One second of simulated subcellular Ca cycling with uniform time step equal to 0.01 ms, including computation of the whole-cell action potential model, took 466.8 s to run on a single Tesla C2050. In Figure 5 we tested the accuracy and speed of the simulations with respect to different time steps. We took a uniform time step equal to 0.0001 ms as the benchmark (smaller time steps produced virtually no change in the results) to which we compared the accuracy and simulation speed with respect to other time step schemes. We found that for all time steps smaller than 0.01 ms the steady state Ca concentration was extremely accurate, to within 0.001% of the benchmark steady state. However, depending upon the time step used, the accuracy in the peak Ca concentration during depolarization varied. We found that taking a uniform time step of 0.001 gave highly accurate results to within 3% of the benchmark peak Ca concentration while the speed increased by a factor of 10. Taking a time step of 0.01 ms produced results that were within 18% of the benchmark peak Ca concentration while the speed increased by a factor of 94. Taking advantage of the multiple time scales that exist within the system, we found that taking an AP time step of 0.01 ms, a diffusion time step of 0.005 ms, and a Ca flux time step of 0.001 ms gave accurate results (within 5% of the benchmark peak Ca concentration) while maintaining a reasonable simulation speed (17 times speed up from benchmark). For all time steps tested we found the voltage to be nearly identical to the benchmark except for sleight variations in the AP duration due to the differences in peak Ca transients (see Figure 5B). It should be noted that for time steps on the order of 0.0001 ms the use of double precision is required, which causes a 20% reduction in speed. For all time steps greater than or equal to 0.001 we found single precision to be adequate, though we used double precision for the time comparisons above.
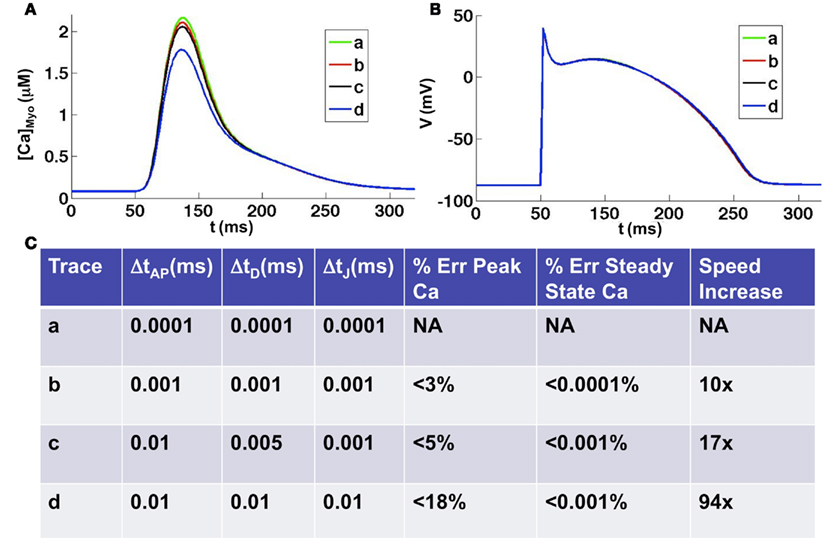
Figure 5. Comparison of various time discretization schemes. (A) Average whole-cell Ca concentrations for four different time discretization schemes [see (C) for details of schemes]. (B) Corresponding voltage traces. (C) Errors and simulation speeds for each of the time discretization schemes. Note: double precision is necessary when using a time step equal to 0.0001 ms, which slows the simulation time by 20% when compared to single precision.
Contrary to our 2D and 3D cardiac tissue simulations (Sato et al., 2009), the diffusion part of the problem was no longer the absolute bottleneck, with the simulation time spread over diffusion, reaction, and the whole-cell current computation. In our Ca cycling simulations, 50% of the simulation time was spent in the (intracellular) reaction part, of which 70% computing the Ca flux and 30% updating the Ca channels; 31% of the total time was spent in the diffusion computation and 15% in the whole-cell current computation (due to the parallel reduction algorithm), including the computation of whole-cell Ca concentration by reduction. The remaining 4% was spent in data transfer. Figure 6 shows a comparison between the 2D cardiac tissue simulation reported in Sato et al. (2009) and our new subcellular Ca dynamics simulations.

Figure 6. Ratio of the execution time of different parts of the code of the subcellular Ca cycling model, compared to our implementation of cardiac tissue simulation on a GPU (Sato et al., 2009).
For the cardiac tissue simulations reported in Sato et al. (2009) we were able to speed up the simulations considerably by using texture memory for large two-dimensional problems (by up to 27% for 1000 × 1000 cells). For our subcellular calcium simulations however the use of texture memory only sped up the simulations by about 2.5%. The explanation is that the individual dimensions (500 × 100 × 50) of the subcellular calcium simulations are too small for texture memory to be efficient.
3. Results
We implemented the 3D Ca cycling model with 100 × 20 × 10 = 20,000 identical CRUs (500 × 100 × 50 grid points), simulating the CRU network corresponding to a complete cardiac myocyte with dimensions of 100 μm × 20 μm × 10 μm. Using this model, we were able to generate well-known features of Ca and AP dynamics of cardiac myocytes. For example, we could replicate the well-known Ca signaling hierarchy (Cheng and Lederer, 2008; Weiss et al., 2011): Ca quarks, Ca sparks, macrosparks (clusters of Ca sparks), and Ca waves (see Figure 7). Under pacing, we were able to reproduce the transition from regular Ca transients and AP durations at slow pacing cycle lengths to Ca and AP duration alternans during rapid pacing, see Figure 8 (parameter values can be found in the Tables 1–5).
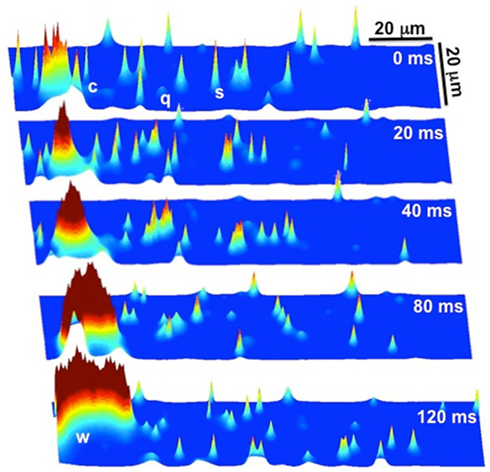
Figure 7. Ca signaling hierarchy reproduced by the Ca cycling model. At t = 0 ms there are quarks (q), sparks (s), and clusters of sparks (c), commonly referred to as macrosparks. The cluster of sparks (c) at t = 0 ms eventually evolves into a Ca wave (w) by t = 120 ms. Note that it is a random process, as not all clusters of sparks evolve into Ca waves.
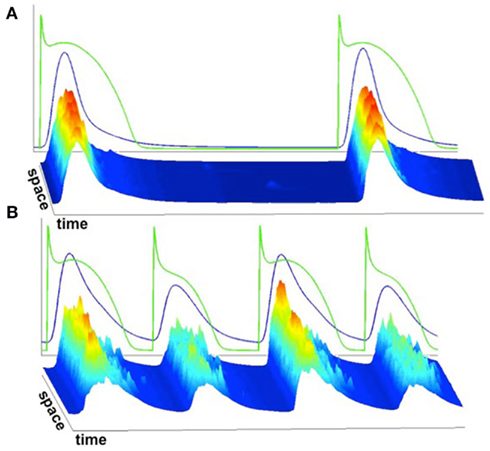
Figure 8. Average whole-cell Ca concentration and voltage superimposed on linescans of subcellular Ca. (A) Slow pacing resulting in spatially uniform Ca release and consistent Ca release from beat to beat. (B) Rapid pacing resulting in spatially non-uniform Ca release and alternans.
4. Discussion
In this manuscript, we presented a mathematical model of Ca cycling and its coupling to membrane voltage, as well as numerical algorithms for effective computer simulation. Our model is spatially detailed, simulating a CRU network that represents a ventricular myocyte. Using this model, we are able to recapitulate the well-known Ca signaling hierarchy and excitation-contraction coupling dynamics. With advanced numerical algorithms and computational technologies, we can perform simulations at the cellular scale, while maintaining a fine spatial resolution at the intracellular scale, with reasonable computational speed.
However, we would like to note that there are several limitations. (1) Our model is a CRU network arranged in a regular 3D grid, which is much simpler than the real structure of a ventricular myocyte. (2) Mitochondria and myofibrils, which are also spatially distributed in the cell, play important roles in Ca cycling dynamics (O’Rourke and Blatter, 2009), but are not included in the model. (3) We used a RyR model that includes dyadic space Ca dependent inactivation, which may not be physiologically correct (Liu et al., 2012). Different RyR models (Sobie et al., 2002; Restrepo et al., 2008; Chen et al., 2009) have been developed for simulating Ca sparks and whole-cell Ca dynamics. Although our model can reproduce Ca alternans and the well-known Ca signaling hierarchy in general, different RyR models may affect specific predictions of Ca dynamics. (4) The formulation of certain Ca fluxes may need to be improved. For example, the explicit SR leak term, such as equation (15), may not be needed since there is evidence that random RyR openings are sufficient to account for SR leak in real myocytes (Williams et al., 2011). (5) The RyR distribution inside a cell is heterogeneous (Baddeley et al., 2009), and new Ca dynamics may emerge due to the heterogeneous firing properties of the CRUs. To overcome these limitations, our model needs to be improved through corroboration with experimental data and the incorporation of more physiological details.
Nonetheless, our present study has developed advanced mathematical and computational methods, which can be used to effectively simulate spatially detailed Ca cycling and its coupling to membrane voltage over long time scales. We hope to further improve the model and the computational algorithms to allow for the study of intracellular Ca cycling in a tissue-scale environment, and eventually contribute to the development of multi-scale modeling approaches to cardiac excitation-contraction coupling and arrhythmias (Hunter and Nielsen, 2005; Bassingthwaighte and Chizeck, 2008; Qu et al., 2011), a grand challenge in biological modeling.
Conflict of Interest Statement
The authors declare that the research was conducted in the absence of any commercial or financial relationships that could be construed as a potential conflict of interest.
Acknowledgments
This work is supported by NIH/NHLBI P01 HL078931 and a fellowship award for advanced researchers from the Swiss Foundation for Grants in Biology and Medicine (Enno de Lange).
References
Baddeley, D., Jayasinghe, I. D., Lam, L., Rossberger, S., Cannell, M. B., and Soeller, C. (2009). Optical single-channel resolution imaging of the ryanodine receptor distribution in rat cardiac myocytes. Proc. Natl. Acad. Sci. U.S.A. 106, 22275–22280.
Bassingthwaighte, J., and Chizeck, H. (2008). The physiome projects and multiscale modeling. IEEE Signal Process. Mag. 25, 121–144.
Berridge, M., Lipp, P., and Bootman, M. (2000). The versatility and universality of calcium signalling. Nat. Rev. Mol. Cell Biol. 1, 11–21.
Chen, W., Wasserstrom, J. A., and Shiferaw, Y. (2009). Role of coupled gating between cardiac ryanodine receptors in the genesis of triggered arrhythmias. Am. J. Physiol. Heart Circ. Physiol. 297, H171–H180.
Cheng, H., Lederer, W., and Cannell, M. (1993). Calcium sparks: elementary events underlying excitation-contraction coupling in heart muscle. Science 262, 740–744.
Chen-Izu, Y., Ward, C. W., Stark, W., Banyasz, T., Sumandea, M. P., Balke, C. W., Izu, L. T., and Wehrens, X. H. T. (2007). Phosphorylation of RyR2 and shortening of RyR2 cluster spacing in spontaneously hypertensive rat with heart failure. Am. J. Physiol. Heart Circ. Physiol. 293, H2409–H2417.
Clay, J., and DeFelice, L. (1983). Relationship between membrane excitability and single channel open-close kinetics. Biophys. J. 42, 151–157.
Franzini-Armstrong, C., Protasi, F., and Ramesh, V. (1999). Shape, size, and distribution of Ca2+ release units and couplons in skeletal and cardiac muscles. Biophys. J. 77, 1528–1539.
Greenstein, J. L., and Winslow, R. L. (2002). An integrative model of the cardiac ventricular myocyte incorporating local control of Ca2+ release. Biophys. J. 83, 2918–2945.
Groff, J. R., and Smith, G. D. (2008). Ryanodine receptor allosteric coupling and the dynamics of calcium sparks. Biophys. J. 95, 135–154.
Haberman, R. (2004). Applied Partial Differential Equations with Fourier Series and Boundary Value Problems. Upper Saddle River: Pearson Prentice Hall.
Huertas, M. A., Smith, G. D., and Györke, S. (2010). Ca2+ alternans in a cardiac myocyte model that uses moment equations to represent heterogeneous junctional SR Ca2+. Biophys. J. 99, 377–387.
Hunter, P., and Nielsen, P. (2005). A strategy for integrative computational physiology. Physiology 20, 316–325.
Izu, L. T., Means, S. A., Shadid, J. N., Chen-Izu, Y., and Balke, C. W. (2006). Interplay of ryanodine receptor distribution and calcium dynamics. Biophys. J. 91, 95–112.
Jafri, M. S., Rice, J. J., and Winslow, R. L. (1998). Cardiac Ca2+ dynamics: the roles of ryanodine receptor adaptation and sarcoplasmic reticulum load. Biophys. J. 74, 1149–1168.
Lakatta, E. G., Maltsev, V. A., and Vinogradova, T. M. (2010). A coupled system of intracellular Ca2+ clocks and surface membrane voltage clocks controls the timekeeping mechanism of the heart’s pacemaker. Circ. Res. 106, 659–673.
Liu, O. Z., Lederer, W., and Sobie, E. A. (2012). Does the goldilocks principle apply to calcium release restitution in heart cells? J. Mol. Cell. Cardiol. 52, 3–6.
Luo, C., and Rudy, Y. (1994). A dynamical model of the cardiac ventricular action potential: I. Simulations of ionic currents and concentration changes. Circ. Res. 74, 1071–1096.
Mahajan, A., Shiferaw, Y., Sato, D., Baher, A., Olcese, R., Xie, L.-H., Yang, M.-J., Chen, P.-S., Restrepo, J. G., Karma, A., Garfinkel, A., Qu, Z., and Weiss, J. N. (2008). A rabbit ventricular action potential model replicating cardiac dynamics at rapid heart rates. Biophys. J. 94, 392–410.
O’Rourke, B., and Blatter, L. A. (2009). Mitochondrial Ca2+ uptake: tortoise or hare? J. Mol. Cell. Cardiol. 46, 767–774.
Qu, Z., and Garfinkel, A. (1999). An advanced algorithm for solving partial differential equations in cardiac conduction. IEEE Trans. Biomed. Eng. 46, 1166–1168.
Qu, Z., Garfinkel, A., Weiss, J. N., and Nivala, M. (2011). Multi-scale modeling in biology: how to bridge the gaps between scales? Prog. Biophys. Mol. Biol. 107, 21–31.
Ramay, H. R., Jafri, M. S., Lederer, W. J., and Sobie, E. A. (2010). Predicting local SR Ca2+ dynamics during Ca2+ wave propagation in ventricular myocytes. Biophys. J. 98, 2515–2523.
Restrepo, J. G., Weiss, J. N., and Karma, A. (2008). Calsequestrin-mediated mechanism for cellular calcium transient alternans. Biophys. J. 95, 3767–3789.
Rovetti, R., Cui, X., Garfinkel, A., Weiss, J. N., and Qu, Z. (2010). Spark-induced sparks as a mechanism of intracellular calcium alternans in cardiac myocytes. Circ. Res. 106, 1582–1591.
Rush, S., and Larsen, H. (1978). A practical algorithm for solving dynamic membrane equations. IEEE Trans. Biomed. Eng. 25, 389–392.
Sato, D., Xie, Y., Weiss, J., Qu, Z., Garfinkel, A., and Sanderson, A. (2009). Acceleration of cardiac tissue simulation with graphic processing units. Med. Biol. Eng. Comput. 47, 1011–1015.
Shannon, T. R., Wang, F., Puglisi, J., Weber, C., and Bers, D. M. (2004). A mathematical treatment of integrated ca dynamics within the ventricular myocyte. Biophys. J. 87, 3351–3371.
Shiferaw, Y., Watanabe, M., Garfinkel, A., Weiss, J., and Karma, A. (2003). Model of intracellular calcium cycling in ventricular myocytes. Biophys. J. 85, 3666–3686.
Sobie, E. A., Dilly, K. W., dos Santos Cruz, J., Lederer, W. J., and Jafri, M. S. (2002). Termination of cardiac Ca2+ sparks: an investigative mathematical model of calcium-induced calcium release. Biophys. J. 83, 59–78.
Soeller, C., and Cannell, M. B. (1999). Examination of the transverse tubular system in living cardiac rat myocytes by 2-photon microscopy and digital image processing techniques. Circ. Res. 84, 266–275.
Soeller, C., Crossman, D., Gilbert, R., and Cannell, M. B. (2007). Analysis of ryanodine receptor clusters in rat and human cardiac myocytes. Proc. Natl. Acad. Sci. U.S.A. 104, 14958–14963.
Stern, M. D., Song, L.-S., Cheng, H., Sham, J. S., Yang, H. T., Boheler, K. R., and Ros, E. (1999). Local control models of cardiac excitation contraction coupling. J. Gen. Physiol. 113, 469–489.
Strang, G. (1968). On the construction and comparison of difference schemes. SIAM J. Numer. Anal. 5, 506–517.
Wagner, J., and Keizer, J. (1994). Effects of rapid buffers on Ca2+ diffusion and Ca2+ oscillations. Biophys. J. 67, 447–456.
Wang, K., Tu, Y., Rappel, W.-J., and Levine, H. (2005). Excitation-contraction coupling gain and cooperativity of the cardiac ryanodine receptor: a modeling approach. Biophys. J. 89, 3017–3025.
Wasserstrom, J. A., Shiferaw, Y., Chen, W., Ramakrishna, S., Patel, H., Kelly, J. E., O’Toole, M. J., Pappas, A., Chirayil, N., Bassi, N., Akintilo, L., Wu, M., Arora, R., and Aistrup, G. L. (2010). Variability in timing of spontaneous calcium release in the intact rat heart is determined by the time course of sarcoplasmic reticulum calcium load. Circ. Res. 107, 1117–1126.
Weber, C. R., Ginsburg, K. S., Philipson, K. D., Shannon, T. R., and Bers, D. M. (2001). Allosteric regulation of Na/Ca exchange current by cytosolic Ca in intact cardiac myocytes. J. Gen. Physiol. 117, 119–132.
Wei, S., Guo, A., Chen, B., Kutschke, W., Xie, Y.-P., Zimmerman, K., Weiss, R. M., Anderson, M. E., Cheng, H., and Song, L.-S. (2010). T-tubule remodeling during transition from hypertrophy to heart failure. Circ. Res. 107, 520–531.
Weiss, J. N., Nivala, M., Garfinkel, A., and Qu, Z. (2011). Alternans and arrhythmias. Circ. Res. 108, 98–112.
Williams, G. S., Chikando, A. C., Tuan, H.-T. M., Sobie, E., Lederer, W., and Jafri, M. (2011). Dynamics of calcium sparks and calcium leak in the heart. Biophys. J. 101, 1287–1296.
Keywords: calcium cycling, ventricular myocyte, mathematical modeling, graphical processing unit computing
Citation: Nivala M, de Lange E, Rovetti R and Qu Z (2012) Computational modeling and numerical methods for spatiotemporal calcium cycling in ventricular myocytes. Front. Physio. 3:114. doi: 10.3389/fphys.2012.00114
Received: 28 October 2011; Accepted: 06 April 2012;
Published online: 08 May 2012.
Edited by:
Mohsin Saleet Jafri, George Mason University, USAReviewed by:
Omer Berenfeld, University of Michigan, USAMohsin Saleet Jafri, George Mason University, USA
Sima Setayeshgar, Indiana University, USA
Copyright: © 2012 Nivala, de Lange, Rovetti and Qu. This is an open-access article distributed under the terms of the Creative Commons Attribution Non Commercial License, which permits non-commercial use, distribution, and reproduction in other forums, provided the original authors and source are credited.
*Correspondence: Michael Nivala and Zhilin Qu, Department of Medicine (Cardiology), David Geffen School of Medicine, University of California, Los Angeles, CA 90095-1679, USA. e-mail:bWljaGFlbC5uaXZhbGFAZ21haWwuY29t
†Michael Nivala and Enno de Lange have contributed equally to this work.


