- 1 Department of Chemical Engineering and Applied Chemistry, University of Toronto, Toronto, ON, Canada
- 2 The Institute of Biomaterials and Biomedical Engineering, University of Toronto, Toronto, ON, Canada
The metabolic behavior of cancer cells is adapted to meet their proliferative needs, with notable changes such as enhanced lactate secretion and glucose uptake rates. In this work, we use the Ensemble Modeling (EM) framework to gain insight and predict potential drug targets for tumor cells. EM generates a set of models which span the space of kinetic parameters that are constrained by thermodynamics. Perturbation data based on known targets are used to screen the entire ensemble of models to obtain a sub-set, which is increasingly predictive. EM allows for incorporation of regulatory information and captures the behavior of enzymatic reactions at the molecular level by representing reactions in the elementary reaction form. In this study, a metabolic network consisting of 58 reactions is considered and accounts for glycolysis, the pentose phosphate pathway, lipid metabolism, amino acid metabolism, and includes allosteric regulation of key enzymes. Experimentally measured intracellular and extracellular metabolite concentrations are used for developing the ensemble of models along with information on established drug targets. The resulting models predicted transaldolase (TALA) and succinyl-CoA ligase (SUCOAS1m) to cause a significant reduction in growth rate when repressed, relative to currently known drug targets. Furthermore, the results suggest that the synergistic repression of transaldolase and glycine hydroxymethyltransferase (GHMT2r) will lead to a threefold decrease in growth rate compared to the repression of single enzyme targets.
Introduction
Metabolic regulation plays a key role in fulfilling the metabolic demands of proliferative vs. quiescent tissue. While differentiated tissue catabolize nutrients to meet bioenergetic needs (i.e., ATP synthesis), proliferating cells channel much of the glucose derived carbon to anabolic pathways to meet biosynthetic needs (i.e., lipid, protein, and nucleic acids synthesis; Christofk et al., 2008). The distinguished metabolism of cancer cells compared to differentiated tissue was first observed by Otto Warburg in the 1920s where he noted high rates of glucose consumption and lactate secretion, regardless of oxygen availability. This metabolic behavior in cancer cells is termed aerobic glycolysis or the “Warburg effect.” (Vander Heiden et al., 2009). Thus, the problem remains is that how aerobic glycolysis affects the cancer cell phenotype and how knowledge of this differed metabolism can be used to target cancer cells for therapeutic purpose.
In the presence of oxygen, differentiated cells (non-proliferating cells) metabolize glucose through glycolysis to pyruvate (Figure 1). Pyruvate subsequently enters the TCA cycle in the mitochondria and is oxidized to produce carbon dioxide. This oxidation in the TCA cycle generates NADH, which fuels oxidative phosphorylation for the maximal production of ATP with minimal lactate production. Oxygen is essential for the complete oxidization of glucose as it is the final electron acceptor during oxidative phosphorylation. In the absence of oxygen, however, differentiated cells produce minimal ATP through the process of anaerobic glycolysis. During anaerobic glycolysis pyruvate is channeled away from the TCA cycle and is used for lactate production. Generation of lactate allows for glycolysis to continue (by cycling NADH back to NAD+). Cancer cells display “aerobic glycolysis” and convert most of the glucose into lactate regardless of the presence of oxygen (Vander Heiden et al., 2009).
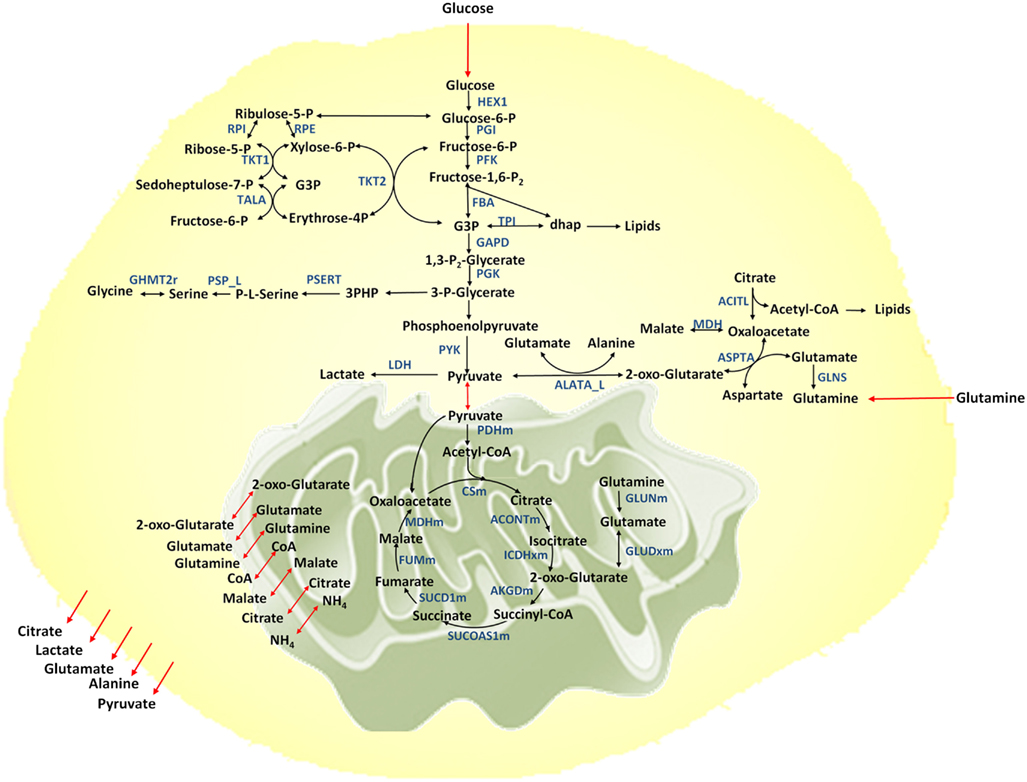
Figure 1. Metabolic network considered. Metabolic reactions are show in black arrows, transport reactions between compartments are shown in red. Selected enzymes are shown in blue.
The importance of aerobic glycolysis for cancer cell growth has been proven experimentally (Schulz et al., 2006) and this metabolic adaptation has been thought to facilitate the incorporation of nutrients into the biomass necessary to produce new cells (Vander Heiden et al., 2009) as many of the glycolytic intermediates (e.g., PEP) are precursors for biomass production. However, the biosynthetic benefits obtained through high glycolytic fluxes do not explain why such high lactate production rates are observed when more pyruvate could be more efficiently utilized for ATP production through oxidative phosphorylation (DeBerardinis et al., 2008). Otto Warburg proposed that damage in oxidative metabolism caused the high rates of glycolysis, however later studies have proven otherwise and revealed the mitochondria to be functional (Moreno-Sánchez et al., 2007). It has been suggested that there is a limitation in the maximal velocity of pyruvate oxidation and hence cells must eliminate pyruvate by conversion to lactate (Curi et al., 1988). In terms of control, it has been suggested that the high glycolytic flux allows the biosynthetic pathways, which stem from glycolytic intermediates, to be fine tuned and thereby, high lactate production rates compensate for the maintenance of biosynthetic fluxes during proliferation (Newsholme et al., 1985).
The metabolic switch that occurs in cancer cells suggests that computational modeling approaches could provide insight and further understanding of the complex metabolic interactions. Previous computational work on cancer metabolism has demonstrated that aerobic glycolysis enables the maximal production of the biomass precursor palmitate considering the stoichiometry of only a few central metabolic pathways (Vander Heiden et al., 2009). Another study considering two lumped reactions representing aerobic glycolysis and oxidative phosphorylation constrained by the cell’s glucose uptake capacity and solvent capacity showed that at high glucose uptake rates, aerobic glycolysis provides the cell with the highest rate of ATP production (Vazquez et al., 2010). Recently, Folger et al. developed the first genome-scale model of cancer metabolism based on the genome-scale human metabolic network (Duarte et al., 2007). This model was used to predict cytostatic drug targets, of which 40% were known targets and 60% new targets. In addition, combinations of synthetic legal drug targets were identified (Folger et al., 2011). More recently, Frezza et al. (2011) used the genome-scale model of cancer metabolism to identify a synergistic interaction between fumarate hydratase (Fh) and haem oxygenase, which was verified experimentally. Genome-scale flux balance based models, however, have the limitation of only capturing steady state metabolic behavior. In addition, key features of metabolic regulation due to allosteric control of enzymatic activity cannot be represented in the steady state flux balance framework. In this work, we aim to develop the first dynamic model of cancer metabolism in order to gain further insight into their metabolism and determine potential enzymatic drug targets.
To develop the kinetic models we used an ensemble modeling (EM) approach, which has been successfully used in the past to improve L-lysine production in E. coli (Contador et al., 2009) and identify regulatory mechanisms in hepatic cells (Dean et al., 2010). EM generates kinetic models while bypassing the need for detailed kinetic parameters (Tan et al., 2011) which are often unknown or difficult to determine experimentally (Lee et al., 2006). EM generates an ensemble of models by sampling for kinetic parameters under thermodynamic and steady state constraints. Each model that is generated has a unique set of kinetic parameters and displays unique dynamic behavior; however, all models are anchored to the same steady state. The models in the ensemble are computationally perturbed and the model-predicted steady state fluxes are compared to experimental perturbation results. Models that capture the experimental results are retained. Continual screening of the models as further experimental data becomes available allows for the convergence to an increasingly realistic and predictive sub-set of models (Contador et al., 2009). In EM, the reactions in the network are formulated in the elementary reaction form, which allows the true mechanism of the enzymatic reactions to be captured. Furthermore, because of the elementary reaction formulation, regulatory information can also be incorporated in the models (Dean et al., 2010).
Materials and Methods
Cell Culture
We used the colo205 (human colorectal adenocarcinoma) cell line (ATCC, Cat. #CCL222) between passages 9 and 10. Cells were cultured in RPMI-1640 medium (Sigma-Aldrich) supplemented with 10% FBS (Sigma-Aldrich) and 1% Penicillin/Streptomycin (Invitrogen) and maintained in an incubator at 5% CO2. Cells were sub-cultured whenever they reached 80% confluence.
Metabolite Quantification
Both intracellular and extracellular metabolites were quantified. In brief, colo205 cells were placed in spinner flasks at a concentration of 2 × 10⁵ cells/mL containing 150 mL of Minimum Essential Medium Eagle Spinner Modification (SMEM) supplemented with 0.292 g/L L-glutamine, 10% FBS, and 1% Penicillin/Streptomycin. For extracellular metabolite measurements, 1.1 mL samples were collected every 12 h and centrifuged at 0°C. The supernatant was collected and carbohydrate metabolites were quantified using high-performance liquid chromatography (HPLC), while amino acid metabolites were quantified using nuclear magnetic resonance (NMR) spectroscopy (Chenomx Inc., Edmonton, Canada). While NMR is perhaps not as sensitive as other metabolomics methods, it is valuable for identifying and quantifying the absolute concentrations. For intracellular metabolite measurements, 40 mL of cell solution (∼15 million cells) was collected at the 72nd hour (during growth phase) and centrifuged at 0°C. The supernatant was removed and the cells were resuspended in 1 mL of supernatant solution. Cells were lysed and intracellular metabolites were quantified using NMR spectroscopy (Chenomx Inc., Edmonton, Canada).
Cell Growth Kinetics
To determine the growth kinetics of the cells we quantified cell numbers in our cultures over time by manual counting. About 0.3 mL samples were collected in triplets every 12 h from each spinner flask and were well mixed by pipetting. Ninety microliters of the cell suspension solution was then removed, mixed with 10 μL of trypan blue, and cell counts were made by counting manually using a hemocytometer. Only non-blue (live) cells were counted to give a measure of changes in the number of viable cells in the culture over time.
Ensemble Modeling
The theory of EM is described previously (Tran et al., 2008) and is briefly summarized in this section. The goal of EM is to generate a set of kinetic models whereby each model is described by different kinetic parameters but all models retain the same mathematical structure and are anchored to the same steady state reference state. If each enzymatic reaction in the model is represented as a non-linear ordinary differential equation with the following mathematical representation:
where xi represents the concentration of species/metabolites in the model, and vi and vj are the enzyme kinetic functions for the production and consumption of species xi respectively, then the EM problem is stated mathematically as sampling and obtaining all the different sets of kinetic parameters such that,
where is the known steady state flux, xss is the steady state concentration of the metabolites in the model, and k is the kinetic rate constant (Dean et al., 2010). In this study is obtained from the steady state fluxes calculated through flux balance analysis (FBA), and xss is obtained from the experimentally measured metabolite concentrations.
Determining Steady State Fluxes
The internal steady state fluxes of the system are calculated using FBA. In FBA the metabolic reactions are represented by an m × n stoichiometric matrix, S, of m metabolites and n reactions (Schilling et al., 1999). The flux through the reactions in the network are represented by the n × 1 vector, v. The internal fluxes are calculated by solving the system of mass balance equations at steady state:
The solution space is constrained by upper and lower flux bounds, vub and vlb. Moreover, through optimization of an objective function, c, FBA identifies a single optimal flux distribution amongst the many flux distributions within the solution space. These constraints are mathematically represented as follows (Orth et al., 2010):
Constructing the Initial Ensemble of Models
The first step in EM involves breaking down each enzymatic reaction into its corresponding set of elementary reactions. Elementary reactions are the most fundamental form of an enzymatic reaction and represent events at the molecular level. This formulism, gives the enzymatic reaction saturable behavior and allows for the inclusion of regulatory steps such as inhibition and activation. For a simple enzymatic reaction, where metabolite Xi is converted by enzyme Ei to metabolite Xi+1,
the reactions is broken down to six elementary reactions illustrated by:
Each elementary reaction, vi,k, follows mass action kinetics,
where ki,1 is the rate constant for the first elementary reaction, [Xi] is the concentration of metabolite i, and [Ei] is the concentration of enzyme i (Dean et al., 2010). Equation 9 is normalized by scaling the concentration of metabolites with the steady state metabolite concentration, and by scaling the concentration of the free enzyme and enzyme complexes with the total enzyme concentration at steady state, (Tran et al., 2008). Equation 9 then becomes
which in the log-linear form is
At reference steady state, and therefore Eq. 11 then simplifies to (Tran et al., 2008)
The kinetic parameters are obtained by sampling for reversibilities and enzyme fractions. A Monte Carlo algorithm is used to sample reversibilities which range from 0, a completely irreversible reaction, to 1, a completely reversible reaction at equilibrium. The reversibility is defined as the ratio of the smaller value for the forward and reverse reaction rates over the larger value,
where, vi,2j−1 and vi,2j are the forward and backward rates of step j in reaction i. From the reversibilities, the forward and backward elementary reaction rates can be calculated using the additional constraint,
where is the net flux of reaction i at reference steady state (Tran et al., 2008). The reversibilities are constrained by Gibbs free energy to ensure that the steady state is thermodynamically feasible,
where ni represents the number of elementary steps present in the enzymatic reaction i and sign(Vi,net) is the direction of the reaction: +1 for forward reactions and −1 for reverse reactions. Equation 17 ensures that for each reaction, the net flux is positive if ΔG < 0 and is negative if ΔG > 0. Since the value for the Gibbs free energy depends on the metabolite concentrations, an exact value cannot be calculated and a range is used (Dean et al., 2010),
The enzyme fractions are sampled using a Monte Carlo algorithm with the constraint that the total enzyme amount is conserved. In other words, the sum of the enzyme fractions of the elementary reactions for each enzymatic reaction must equal one (Contador et al., 2009),
Once the reversibilities and enzyme fractions are sampled, the kinetic parameters, can be determined. The rates of elementary reactions are computed from the reversibilities as follows:
Finally is calculated from Eq. 12 based on the elementary reaction rates and enzyme fractions (Tran et al., 2008).
The process of calculating kinetic variables based on sampled reversibilities and enzyme fractions can be repeated thousands of times to obtain thousands of models. Once the kinetic parameters are calculated, the net steady state fluxes are calculated. To calculate the net steady state flux, the metabolic network is first described as a system of ordinary differential equations, with the metabolite concentrations, and the enzyme fractions , i,j, as the ODE variables:
The ODEs are solved using ode15s solver in MATLAB and the concentrations obtained are input into Eq. 10 to calculate the steady state fluxes (Contador et al., 2009).
In silico Enzyme Tuning
After generating the ensemble of models, the models are perturbed to study the behavior of each model under the perturbations. Perturbations involved overexpressing or repressing specific enzymes in the network by a factor of n. In this study the enzymes of interest are cancer drug targets and are therefore repressed with an n value of 0.1 to study their respective effects on the growth rate of cancer cells. The models which display a reduction in growth rate after enzymatic repression are retained and as such the ensemble of models are screened. For the perturbation case Eq. 11 is rewritten as follows:
where Ei,r represents the fold change in the total enzyme concentration over the reference steady state value (Ei,r = 0.1 for this study). Furthermore, for the perturbation studies, if the metabolic network contains moiety conservation relationships such as cofactors, the initial conditions are set such that the sum of the cofactors and their intermediates are conserved before and after the perturbation (Contador et al., 2009).
Results
Growth Rate and Metabolite Measurements
The experimental growth rate for the colo205 cells was used as biomass production rate in the FBA model (Figure 2A). The shape of the growth curve obtained agrees with the sigmoidal behavior for growth of mammalian cells cultured in suspension previously reported in the literature (Jakoby, 1979). Assuming an average colorectal adenocarcinoma cell density of 1.15 ng/cell during the growth phase (Park et al., 2010) the growth rate was determined to be 0.0224 gDWhr−1.
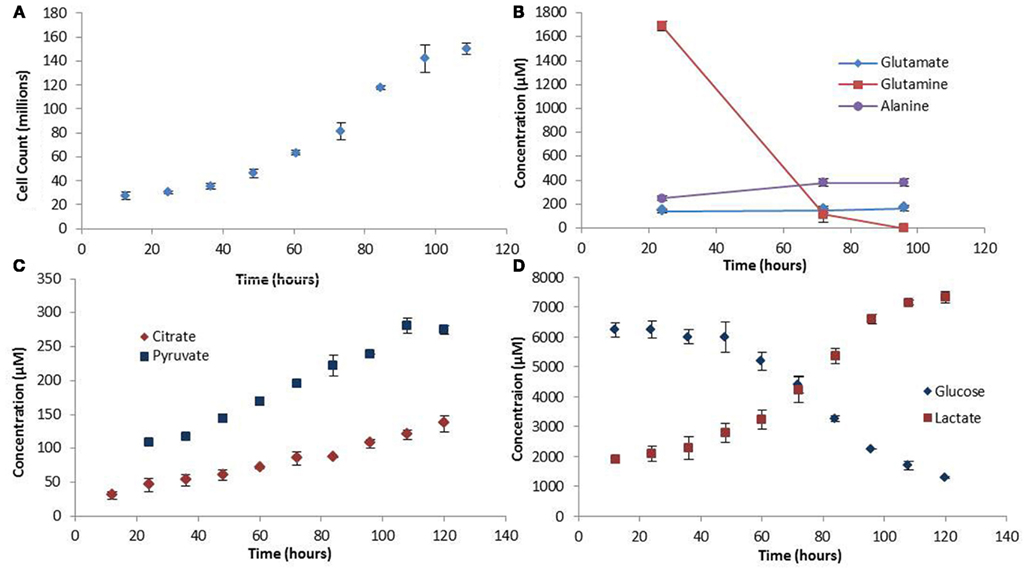
Figure 2. Growth rate and extracellular metabolite profiles. (A) The growth curve showing cell counts made every 12 h. (B) Extracellular amino acid metabolite profiles measured at three time points in the medium. (C,D) Extracellular carbohydrate concentration profiles. Error bars represent the standard deviation between triplicate samples.
Extracellular and intracellular measurements of metabolites were made in triplicates. The values for the extracellular metabolites concentrations are presented in Figure 2. Notable trends include the high rates of glutamine and glucose uptake, consistent with the idea that these are the main source of nutrient uptake in cancer cells (DeBerardinis et al., 2008). Glucose is the major lipogenic substrate in cancer cells and therefore high uptake rates are essential (DeBerardinis et al., 2008). Glutamine is an anaplerotic source during cell proliferation, replenishing the TCA cycle carbon that is used for biosynthesis, and therefore is proposed to be an essential nutrient for cancer metabolism (DeBerardinis et al., 2008). In addition, the high secretion rate of lactate, the prominent indicator of the Warburg effect, was also observed in our experiments. Another interesting finding was the accumulation of pyruvate in the medium. The high rates of glycolysis in cancer cells result in high pyruvate production. However, paradoxically, most of the pyruvate does not enter the TCA cycle for ATP production, but is converted to lactate by the highly expressed enzyme LDH-A which is induced by oncogenes during proliferation (Vander Heiden et al., 2009). The experimentally observed pyruvate secretion rate out of the cell further strengthens the hypothesis made by Curi et al. (1988) that there is a limitation to the maximum rate of pyruvate oxidation. However, in terms of LDH-A activity the question of whether there is a limitation also in the maximum rate of lactate production from pyruvate could be addressed, and further experiments conducted to verify this model-predicted observation.
The intracellular metabolites used in the study were measured by NMR spectroscopy (Chenomx Inc., Edmonton, Canada). The metabolite concentrations used in this study for developing the model include pyruvate, glutamine, malate, lactate, glucose, citrate, fumarate, succinate, alanine, and glutamate (Figure 3). The standard deviation associated with the metabolite measurements (error bars in Figure 3) was less than 18% suggesting that there is significant consistency among biological replicates.
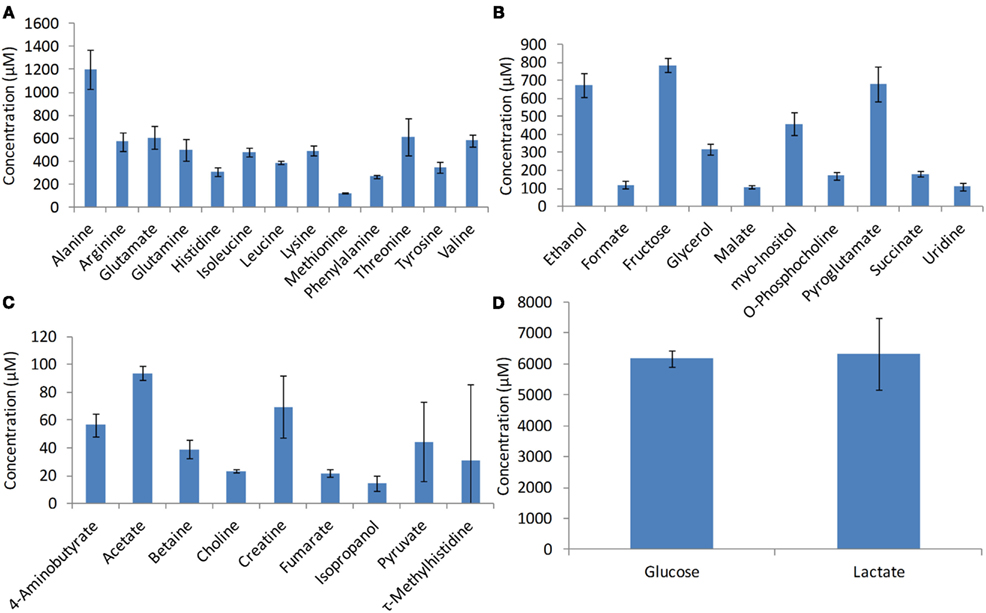
Figure 3. Intracellular metabolite profiles. Metabolites were measured using NMR spectroscopy during the growth phase at the 72nd hours of growth. Error bars represent standard deviation between triplicate samples.
Model Construction and Steady State Fluxes
A metabolic network for cancer is reconstructed based on the previously developed genome-scale human metabolic network (Duarte et al., 2007). The network includes 58 reactions and 57 metabolites, representing the major metabolic pathways essential for growth and cell maintenance. These pathways include glycolysis, TCA cycle, pentose phosphate pathway, pyruvate metabolism, amino acid metabolism for selective amino acids, lipid biosynthesis, and nucleotide biosynthesis. The model is compartmentalized to account for the extracellular, cytosolic, and mitochondrial compartments (Figure 1). Metabolites are exchanged between compartments through exchange reactions. However in this model cofactors are assumed to be freely transported between compartments and no exchange reactions are considered for them. Furthermore, balancing of cofactors (ATP/ADP, NADH/NAD, NADPH/NADP, GTP/GDP, and FADH2/FAD) is taken into account.
The internal fluxes were calculated using the COBRA toolbox in the MATLAB programming environment. These fluxes were calculated such that the simulated values for the biomass, uptake, and secretion fluxes met the experimentally measured vales. This was done by selecting biomass, as well as the uptake and secretion reactions as the objective function and maximizing the objective fluxes while constraining the upper bounds to the experimentally measured values. The steady state fluxes of the reference state are reported in Figure 4.
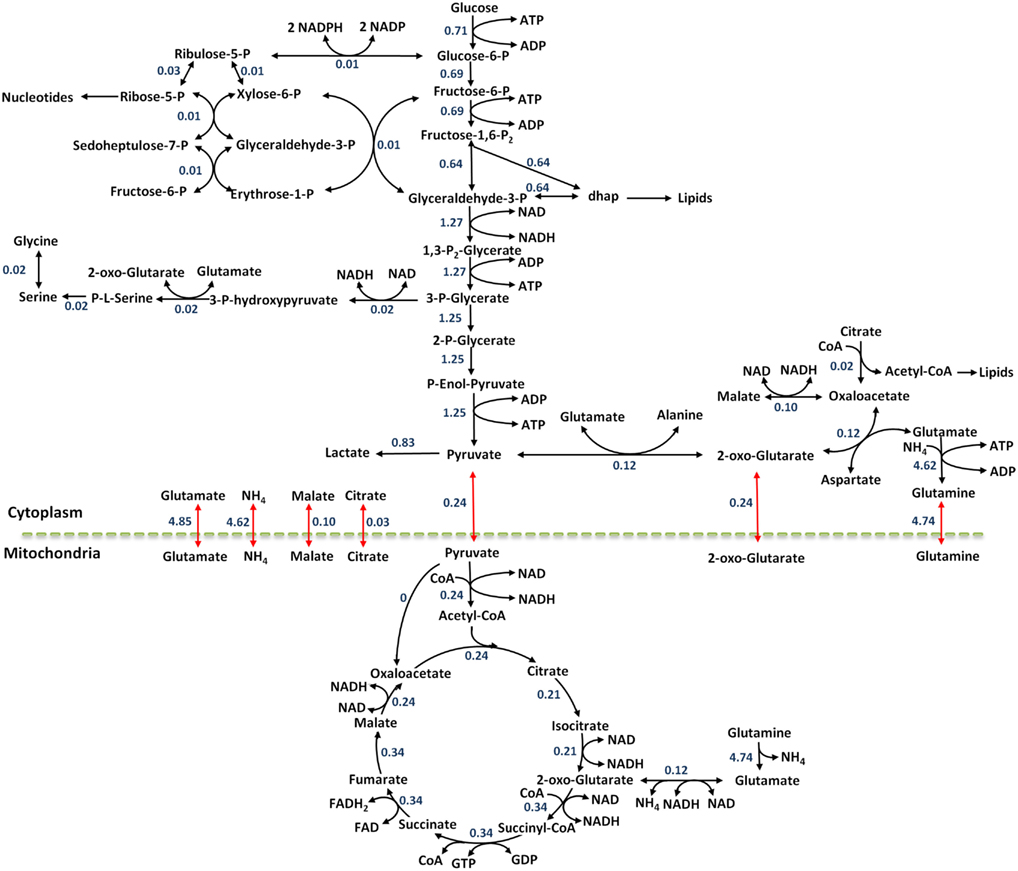
Figure 4. The flux map at reference steady state for the colo205 cells. Black arrows show metabolic reactions and red arrows show transport reactions between compartments. Flux values are reported in units of mmol/gDWhr.
As demonstrated in Figure 4, the highest numerical flux values in the metabolic network are observed in glycolysis, and agree with the aerobic glycolysis metabolism seen in cancer cells. The pyruvate produced through glycolysis can enter many pathways: lactate production, amino acid synthesis, TCA cycle, and secretion out of the cell. The numerical results demonstrate this split quantitatively and suggest that 19.3% of the pyruvate enters the TCA cycle, 9.4% is used for synthesis of the amino acid alanine, 66.1% of the pyruvate is converted to lactate, and 5.2% is secreted out of the cell. It is clear that most of the pyruvate is converted to lactate as described by the Warburg effect.
Construction of the Initial Ensemble
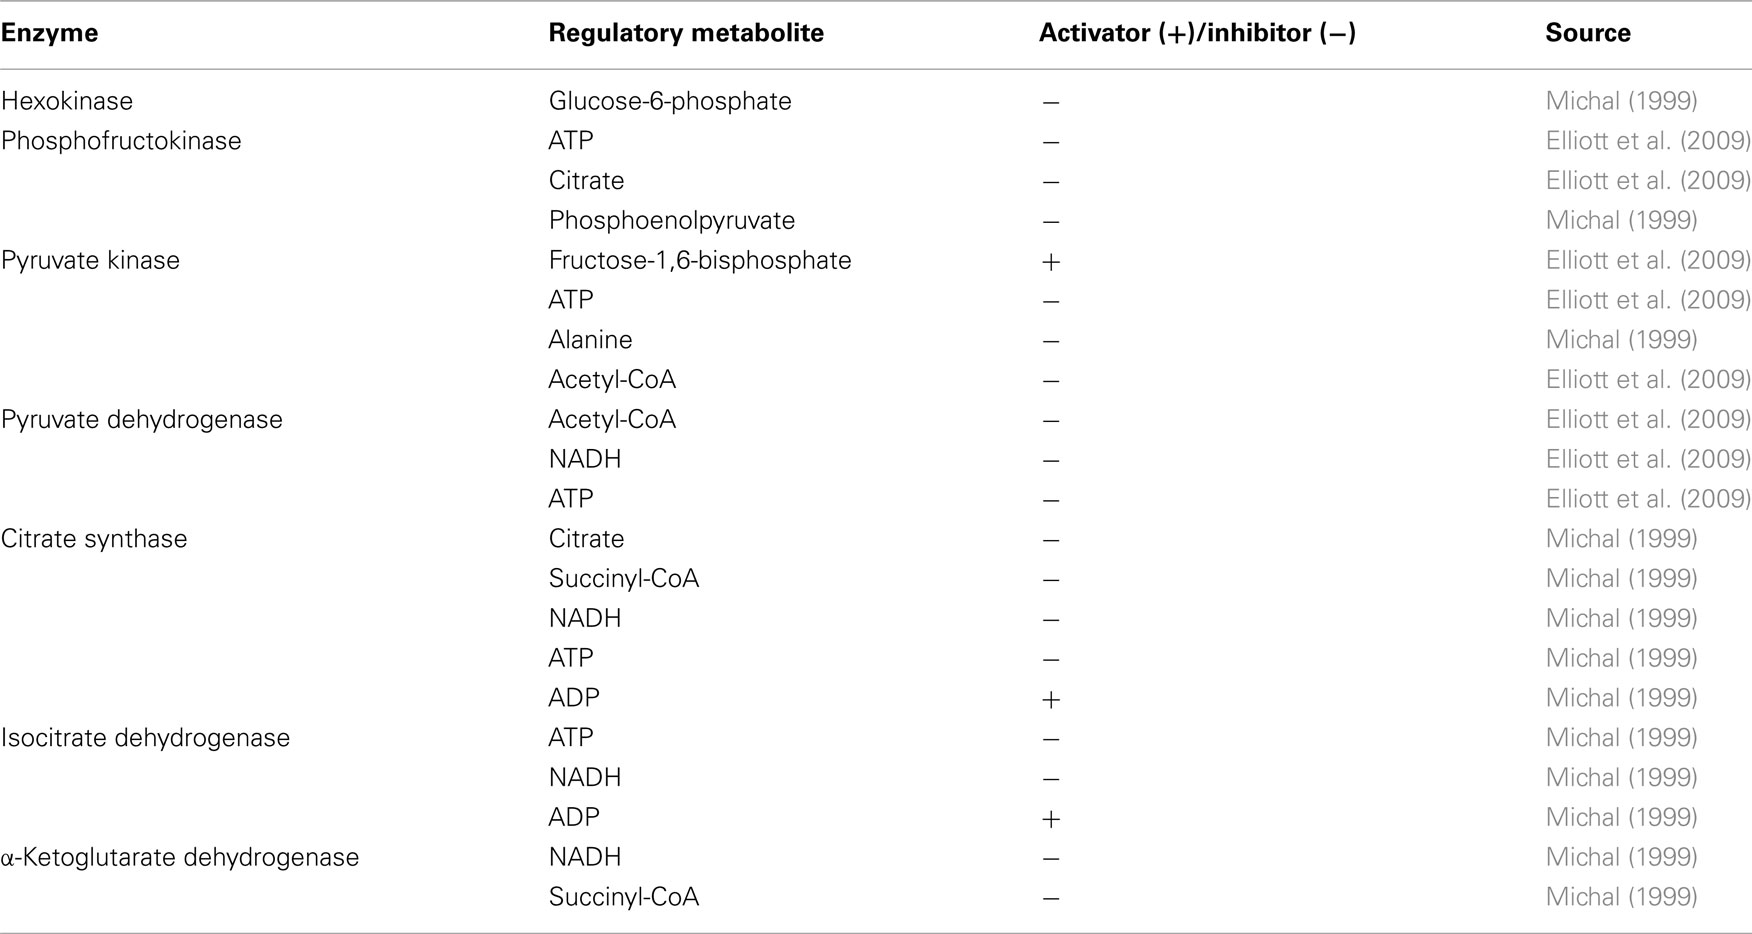
An ensemble of 1000 models was constructed as described in the Section “Materials and Methods.” In addition to the steady state input obtained through FBA, other input include Gibbs free energies for each net reaction that were collected form literature (Jankowski et al., 2008) as well as experimentally measured intracellular metabolite concentrations at reference state (Figure 3). Allosteric regulation is also included in the model, a list of which is presented in Table 1. When all the allosteric regulations in Table 1 were initially included, the models did not describe the cancer phenotype and did not converge to the steady state reference flux values. Each of the regulatory components was then examined individually and we found that the models would not converge when the activation of pyruvate kinase by fructose-1,6-bisphosphate was included. In mathematical terms, none of the kinetic parameter sets generated using the Monte Carlo algorithm would result in steady state flux distribution values similar to experimental results when the ordinary differential equations were solved. Indeed studies have shown that in cancer cells the growth factor signaling pathway activates the protein tyrosine kinases which bind to pyruvate kinase and result in the release of the otherwise tightly bound fructose-1,6-bisphosphate. The low activity form of pyruvate kinase has shown to be essential for aerobic glycolysis (Christofk et al., 2008). The ensemble of models were then generated with the allosteric regulators listed in Table 1 except for activation of pyruvate kinase by fructose-1,6-bisphosphate.
Perturbation and Screening of the Ensemble
The ensemble of models is screened based on experimental drug target data (Table 2) available in the literature (Wishart et al., 2008). The models are perturbed by under-expressing each of the enzymes listed in Table 2 by a factor of 0.1. As demonstrated by Figure 5 the ensemble of 1000 models converges to a set of 4 models capable of describing the perturbation phenotypes. It should be noted that the perturbation data used are experimental drug targets and are not yet approved drug targets. As targeting the enzymes listed in Figure 2 would reduce the tumor size it is assumed that targeting the enzymes in this study reduces biomass production.
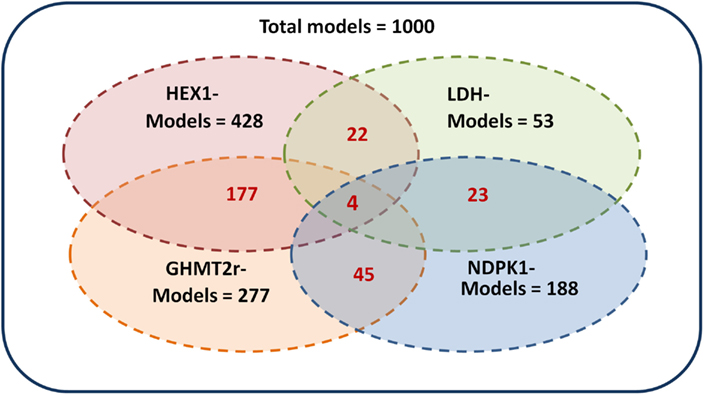
Figure 5. Screening of the ensemble of models. The 1000 models were screened by repressing each of the enzymes hexokinase (HEX1), lactate dehydrogenase (LDH), glycine hydroxymethyltransferase (GHMT2r), and nucleoside-diphosphate kinase (NDPK1) by a factor of 0.01. The models which remained after screening by each enzyme are shown in black. The corresponding models which are common between multiple perturbations are shown in red. The four perturbations resulted in four remaining models.
Predicting Cancer Drug Targets
The models obtained through screening of the ensemble were used to identify potential drug targets. This step was accomplished by perturbing every enzyme in the network and identifying enzymes that showed a greater decrease in biomass production rate compared to the previously identified drug targets used for screening the models (Table 2). Two enzymes were identified to cause a greater decrease in biomass production, when their enzyme activity was repressed, compared to glycine hydroxymethyltransferase (GHMT2r). Transaldolase (TALA) was the enzyme target predicted to cause the greatest reduction in growth rate (Figure 6A). The gene encoding transaldolase, Taldo1, has not been previously reported as a known, approved, or experimental anticancer drug target. Transaldolase is a key enzyme in the non-oxidative pentose phosphate pathway that provides ribose-5-phosphate for nucleic acid synthesis and NADPH for lipid biosynthesis (Ma et al., 2009). In addition, the product of the transaldolase reaction, erythrose-4-phosphate, is used for the synthesis of the three amino acids, tyrosine, phenylalanine, and tryptophan (Samland and Sprenger, 2009). Furthermore, this enzyme has been found to be overexpressed in all cancer cells (Lee et al., 2006) and has been suggested as a cancer biomarker specifically for colon cancer (Ma et al., 2009). These results highlight the potential of transaldolase as a cancer target. Further experimental studies are required to evaluate the impact of repressing the enzyme in normal proliferating cells in vivo.

Figure 6. Targets identified showing reduction in cell growth rate. (A) Each of the enzymes in the remaining models were individually perturbed and enzyme targets with higher reductions in growth rate relative to the previously known experimental drug targets are presented. (B) Effect of simultaneously repressing two enzyme targets on growth rate. Error bars represent standard deviation between the four perturbed models.
The enzyme that showed the second highest decrease in biomass production is succinyl-CoA ligase (SUCOAS1m). Like transaldolase, succinyl-CoA ligase has not been reported as a known, approved, or experimental drug target (Wishart et al., 2008) however the gene associated with the enzyme has been shown to be overexpressed in cancer cells (Lee et al., 2006).
The effect of a simultaneous repression of enzymes was studied by repressing two enzymes at a time. The effect of TALA–SUCOAS1m repression and TALA–GHMT2r repression was studied (Figure 6B). It was found that the TALA–SUCOAS1m combination did not result in a much greater decrease in growth rate compared to TALA alone. However the combination of TALA and GHMT2r showed about a three time greater decrease in growth rate.
Discussion
In this work intracellular and extracellular metabolite concentrations were experimentally measured along with the growth rate of colo205 cells to develop a kinetic model of cancer metabolism using the EM computational approach. An ensemble of 1000 models was initially generated, whereby each of the models in the ensemble consisted of different kinetic parameters, but all models were anchored to the same steady state flux. The steady state reference flux values were computed by FBA using experimentally measured uptake and secretion rates. The ensemble of 1000 models was then screened for models, which more accurately represented the system under study, using perturbation data. Four enzymes (LDH, GHMT2r, HEX1, and NDPK1) have previously been noted in literature to show a reduction in cancer cell proliferation rate when their activity was repressed (Wishart et al., 2008). In this work, we computationally reduced the activity for each of these enzymes to analyze the effect of this repression on growth rate. Four models out of the 1000 initial models were able to accurately display a reduction in growth rate when the aforementioned enzymes were repressed.
The four models that remained after screening and determined to be most representative of the actual metabolic behavior in cancer cells were used for predictive studies. These models predicted that repressing the activity of the transaldolase enzyme would result in the greatest reduction in growth rate. Transaldolase is a key enzyme in the pentose phosphate pathway and takes part in nucleotide, lipid, and amino acid synthesis. As biomass production is also a function of nucleotide, amino acid, and lipid production rates, it seems reasonable that transaldolase has a substantial role in biosynthesis. Transaldolase has not previously been reported as an experimental or approved drug target (Wishart et al., 2008). Previous computational studies on cancer metabolism using FBA alone have also not identified transaldolase as a potential drug target (Folger et al., 2011). Interestingly, the gene associated with the transaldolase enzyme is overexpressed in all cancer cell lines (Lee et al., 2006) and has been established as a cancer biomarker for colon cancer patients (Ma et al., 2009).
The four remaining kinetic models differ from each other in the values for their kinetic rate constants (Table A1 in Appendix). This variation was quite large for some of the reactions in the models, while some reactions displayed similar kinetics. Ideally, only one unique set of kinetic parameters would most accurately capture the “true” dynamics of the system. In this study the kinetic parameters of the four models differ due to many factors: (1) the model developed is a quite simplistic model accounting for only 58 reactions, therefore not enough constraints are imposed on the system and many sets of kinetic parameters could capture this simplistic system (2) the starting number of models in the ensemble is 1000 models. As kinetic parameters are sampled using a Monte Carlo algorithm, increasing the number of initial models generated would introduce kinetic parameter sets which could more accurately match the experimentally observed cancer cell phenotypes (3) the criteria used to screen the models was only concerned with relative changes such as an increase or decrease in growth rate. Increasing the stringency of the criteria (e.g., quantitative values for the percent change in growth rate) could further screen the ensemble to a smaller more accurate set of models.
To enhance the predictive capability of the models developed in our study, the most significant improvement would be to measure the steady state fluxes using 13C labeling. As the ensemble of models that is initially generated is anchored to the steady state fluxes, it is critical that these fluxes be as close to their real values as possible. The assumptions inherent in FBA are responsible for the greatest fraction of uncertainty in the overall uncertainty present in the methodology used in this study. FBA is based on mass balance constraints and does not account for regulatory constraints (Shlomi et al., 2011). In addition, enzyme capacity constraints are usually unknown. Moreover, there is a possibility that due to the redundancies in the metabolic pathways, multiple optimal steady states could exist. However, when experiments are conducted, the steady state fluxes measured would capture the metabolic behavior of the cells most accurately. In this study, the models generated were used to predict potential enzymatic drug targets. There are many other studies that can be conducted using these models. For example, kinetic models can be used for understanding the mode of action of a drug under study. If the mode of action of a drug is unknown, or the exact target of the drug is unknown, EM could predict which perturbations would result in the experimentally observed phenotype. Furthermore, if the target of the drug is known the efficacy of the drug can be determined by comparing the steady state fluxes observed after perturbing the enzyme target computationally to the steady state fluxes observed experimentally. This could then give insight into possible side effects by showing what other pathways are affected. Finally, the extension of such modeling approaches to analyze the metabolism of normal proliferating cells will provide an opportunity to compare and contrast their metabolism with cancer cells and could provide valuable insights on potential metabolic differences between these cell types.
Conclusion
Metabolic profiling provides information on the end results of the transcriptional and enzymatic changes that occur in the cell (Boros et al., 2002). In this study, we used experimentally measured metabolomic data obtained from a colon cancer cell line to construct a kinetic model of cancer metabolism using the EM methodology. The kinetic models were used to predict potential enzymatic drug targets to target cancer metabolism. Two enzymatic targets, transaldolase and succinate-CoA ligase, computationally showed a greater potential decrease in growth rate compared to current experimental or approve enzymatic drug targets (Wishart et al., 2008). Furthermore, we studied the effect of simultaneous targeting of the enzymes identified and found a threefold increase in effectiveness when transaldolase and glycine hydroxymethyltransferase were synergistically repressed but no difference when transaldolase and succinate-CoA ligase were synergistically repressed. This suggests that transaldolase and succinate-CoA ligase do not interact significantly within the metabolic network in the cancer cell.
We have demonstrated that the EM methodology is suitable for studying metabolic perturbations such as repression targets for drug discovery. Further experimental work is necessary to determine the accuracy of our approach and to complement the computational predictions made in this study. The greatest sensitivity in the computational predictions lies in the steady state fluxes that are input to the EM algorithm (Tran et al., 2008). The 1000 models generated are anchored to this set of fluxes and therefore any discrepancy between the actual flux values and the values input would reduce the predictive ability of the resulting ensemble of models. In this work, FBA was used to determine the steady state fluxes. FBA has many assumptions inherent in the methodology that introduce uncertainty to the values it calculates. FBA is based on mass balance constraints and does not account for regulatory constraints. In addition, enzyme capacity constraints are usually unknown. Moreover, there is a possibility that due to the redundancies in the metabolic pathways, multiple optimal steady states exist (Mahadevan and Schilling, 2003). Experimentally measured steady state fluxes could overcome these uncertainties. Current methodologies for experimentally measuring internal reaction fluxes involve 13C labeling. Furthermore, expansion of the metabolic and regulatory network considered would allow for a more precise representation of the metabolic system of interest and hence increasingly realistic model predictions. However, this expansion highlights the limitation in the EM methodology in terms of the computation time (hours to days) that is involved due to the large parameter spaces involved. This limitation could be overcome by improvements in the EM algorithm and enhanced computing capabilities (Dean et al., 2010).
Notwithstanding this limitation, the model presented here provides the first step toward the development of detailed models that account not only for the stoichiometry but also the effect of metabolite concentrations and the associated concentration dependent regulation of the enzymes in the metabolic network. We anticipate that in the future, such an approach could be extended to represent large-scale models of cancer metabolism, which will be valuable for the improved understanding of the metabolic dysregulation in cancers and suggest strategies for targeting these metabolic changes while maintaining homeostasis in normal proliferating cells. Finally, another important component of metabolism in higher level organisms is the 3-D organization of cells into tissues and the inherent spatio-temporal heterogeneity in the local environment, particularly in the tumor. Hence, the extension of these kinetic models of cellular metabolism to represent metabolism in such 3-D environments will be critical to further our understanding of the role of microenvironment in tumor metabolism and the efficacy of chemotherapy in solid tumors. We believe that our work presented here represents the first step toward achieving an improved understanding of the kinetics of cancer metabolism and constitutes an important advance to the field of systems biology of cancer metabolism.
Conflict of Interest Statement
The authors declare that the research was conducted in the absence of any commercial or financial relationships that could be construed as a potential conflict of interest.
Acknowledgments
This project was funded by the Natural Sciences and Engineering Research Council of Canada (NSERC) Discovery Grant as well as the Ontario Graduate Scholarship (OGS). We would like to acknowledge Dr. Darren Baker for his valuable input and guidance in designing the project. We would like to thank the labs of Dr. Peter Zandstra, Dr. Milica Radisic, and students in the McGuigan lab for the experimental equipment used in the study.
References
Boros, L. G., Cascante, M., and Lee, W. N. (2002). Metabolic profiling of cell growth and death in cancer: applications in drug discovery. Drug Discov. Today 7, 364–372.
Christofk, H. R., Vander Heiden, M. G., Wu, N., Asara, J. M., and Cantley, L. C. (2008). Pyruvate kinase M2 is a phosphotyrosine-binding protein. Nature 452, 181–186.
Contador, C. A., Rizk, M. L., Asenjo, J. A., and Liao, J. C. (2009). Ensemble modeling for strain development of L-lysine-producing Escherichia coli. Metab. Eng. 11, 221–233.
Curi, R., Newsholme, P., and Newsholme, E. A. (1988). Metabolism of pyruvate by isolated rat mesenteric lymphocytes, lymphocyte mitochondria and isolated mouse macrophages. Biochem. J. 250, 383.
Dean, J. T., Rizk, M. L., Tan, Y., Dipple, K. M., and Liao, J. C. (2010). Ensemble modeling of hepatic fatty acid metabolism with a synthetic glyoxylate shunt. Biophys. J. 98, 1385–1395.
DeBerardinis, R. J., Lum, J. J., Hatzivassiliou, G., and Thompson, C. B. (2008). The biology of cancer: metabolic reprogramming fuels cell growth and proliferation. Cell Metab. 7, 11–20.
Duarte, N. C., Becker, S. A., Jamshidi, N., Thiele, I., Mo, M. L., Vo, T. D., Srivas, R., and Palsson, B. O. (2007). Global reconstruction of the human metabolic network based on genomic and bibliomic data. Proc. Natl. Acad. Sci. U.S.A. 104, 1777–1782.
Elliott, W. H., Elliott, D. C., Jefferson, J. R., and Wheldrake, J. (2009). Biochemistry and Molecular Biology. Oxford: Oxford University Press.
Folger, O., Jerby, L., Frezza, C., Gottlieb, E., Ruppin, E., and Shlomi, T. (2011). Predicting selective drug targets in cancer through metabolic networks. Mol. Syst. Biol. 7, 527.
Frezza, C., Zheng, L., Folger, O., Rajagopalan, K. N., MacKenzie, E. D., Jerby, L., Micaroni, M., Chaneton, B., Adam, J., Hedley, A., Kalna, G., Tomlinson, I. P. M., Pollard, P. J., Watson, D. G., Deberardinis, R. J., Shlomi, T., Ruppin, E., and Gottlieb, E. (2011). Haem oxygenase is synthetically lethal with the tumour suppressor fumarate hydratase. Nature 477, 225–228.
Jankowski, M. D., Henry, C. S., Broadbelt, L. J., and Hatzimanikatis, V. (2008). Group contribution method for thermodynamic analysis of complex metabolic networks. Biophys. J. 95, 1487–1499.
Lee, D. Y., Yun, C., Cho, A., Hou, B. K., Park, S., and Lee, S. Y. (2006). WebCell: a web-based environment for kinetic modeling and dynamic simulation of cellular networks. Bioinformatics 22, 1150–1151.
Ma, Y., Peng, J., Huang, L., Liu, W., Zhang, P., and Qin, H. (2009). Searching for serum tumor markers for colorectal cancer using a 2-D DIGE approach. Electrophoresis 30, 2591–2599.
Mahadevan, R., and Schilling, C. H. (2003). The effects of alternate optimal solutions in constraint-based genome-scale metabolic models. Metab. Eng. 5, 264–276.
Michal, G. (1999). Biochemical Pathways: An Atlas of Biochemistry and Molecular Biology. New York: Wiley.
Moreno-Sánchez, R., Rodríguez-Enríquez, S., Marín-Hernández, A., and Saavedra, E. (2007). Energy metabolism in tumor cells. FEBS J. 274, 1393–1418.
Newsholme, E. A., Crabtree, B., and Ardawi, M. S. (1985). The role of high rates of glycolysis and glutamine utilization in rapidly dividing cells. Biosci. Rep. 5, 393–400.
Orth, J. D., Thiele, I., and Palsson, B. Ø. (2010). What is flux balance analysis? Nat. Biotechnol. 28, 245–248.
Park, K., Millet, L. J., Kim, N., Li, H., Jin, X., Popescu, G., Aluru, N. R., Hsia, K. J., and Bashir, R. (2010). Measurement of adherent cell mass and growth. Proc. Natl. Acad. Sci. U.S.A. 107, 20691–20696.
Samland, A. K., and Sprenger, G. A. (2009). Transaldolase: from biochemistry to human disease. Int. J. Biochem. Cell Biol. 41, 1482–1494.
Schilling, C. H., Edwards, J. S., and Palsson, B. O. (1999). Toward metabolic phenomics: analysis of genomic data using flux balances. Biotechnol. Prog. 15, 288–295.
Schulz, T. J., Thierbach, R., Voigt, A., Drewes, G., Mietzner, B., Steinberg, P., Pfeiffer, A. F., and Ristow, M. (2006). Induction of oxidative metabolism by mitochondrial frataxin inhibits cancer growth: Otto Warburg revisited. J. Biol. Chem. 281, 977–981.
Shlomi, T., Benyamini, T., Gottlieb, E., Sharan, R., and Ruppin, E. (2011). Genome-scale metabolic modeling elucidates the role of proliferative adaptation in causing the Warburg effect. PLoS Comput. Biol. 7, e1002018. doi:10.1371/journal.pcbi.1002018
Tan, Y., Rivera, J. G., Contador, C. A., Asenjo, J. A., and Liao, J. C. (2011). Reducing the allowable kinetic space by constructing ensemble of dynamic models with the same steady-state flux. Metab. Eng. 13, 60–75.
Tran, L. M., Rizk, M. L., and Liao, J. C. (2008). Ensemble modeling of metabolic networks. Biophys. J. 95, 5606–5617.
Vander Heiden, M. G., Cantley, L. C., and Thompson, C. B. (2009). Understanding the Warburg effect: the metabolic requirements of cell proliferation. Science 324, 1029–1033.
Vazquez, A., Liu, J., Zhou, Y., and Oltvai, Z. N. (2010). Catabolic efficiency of aerobic glycolysis: the Warburg effect revisited. BMC Syst. Biol. 4, 58. doi:10.1186/1752-0509-4-58
Wishart, D. S., Knox, C., Guo, A. C., Cheng, D., Shrivastava, S., Tzur, D., Gautam, B., and Hassanali, M. (2008). DrugBank: a knowledgebase for drugs, drug actions and drug targets. Nucleic Acids Res. 36, D901–D906.
Appendix
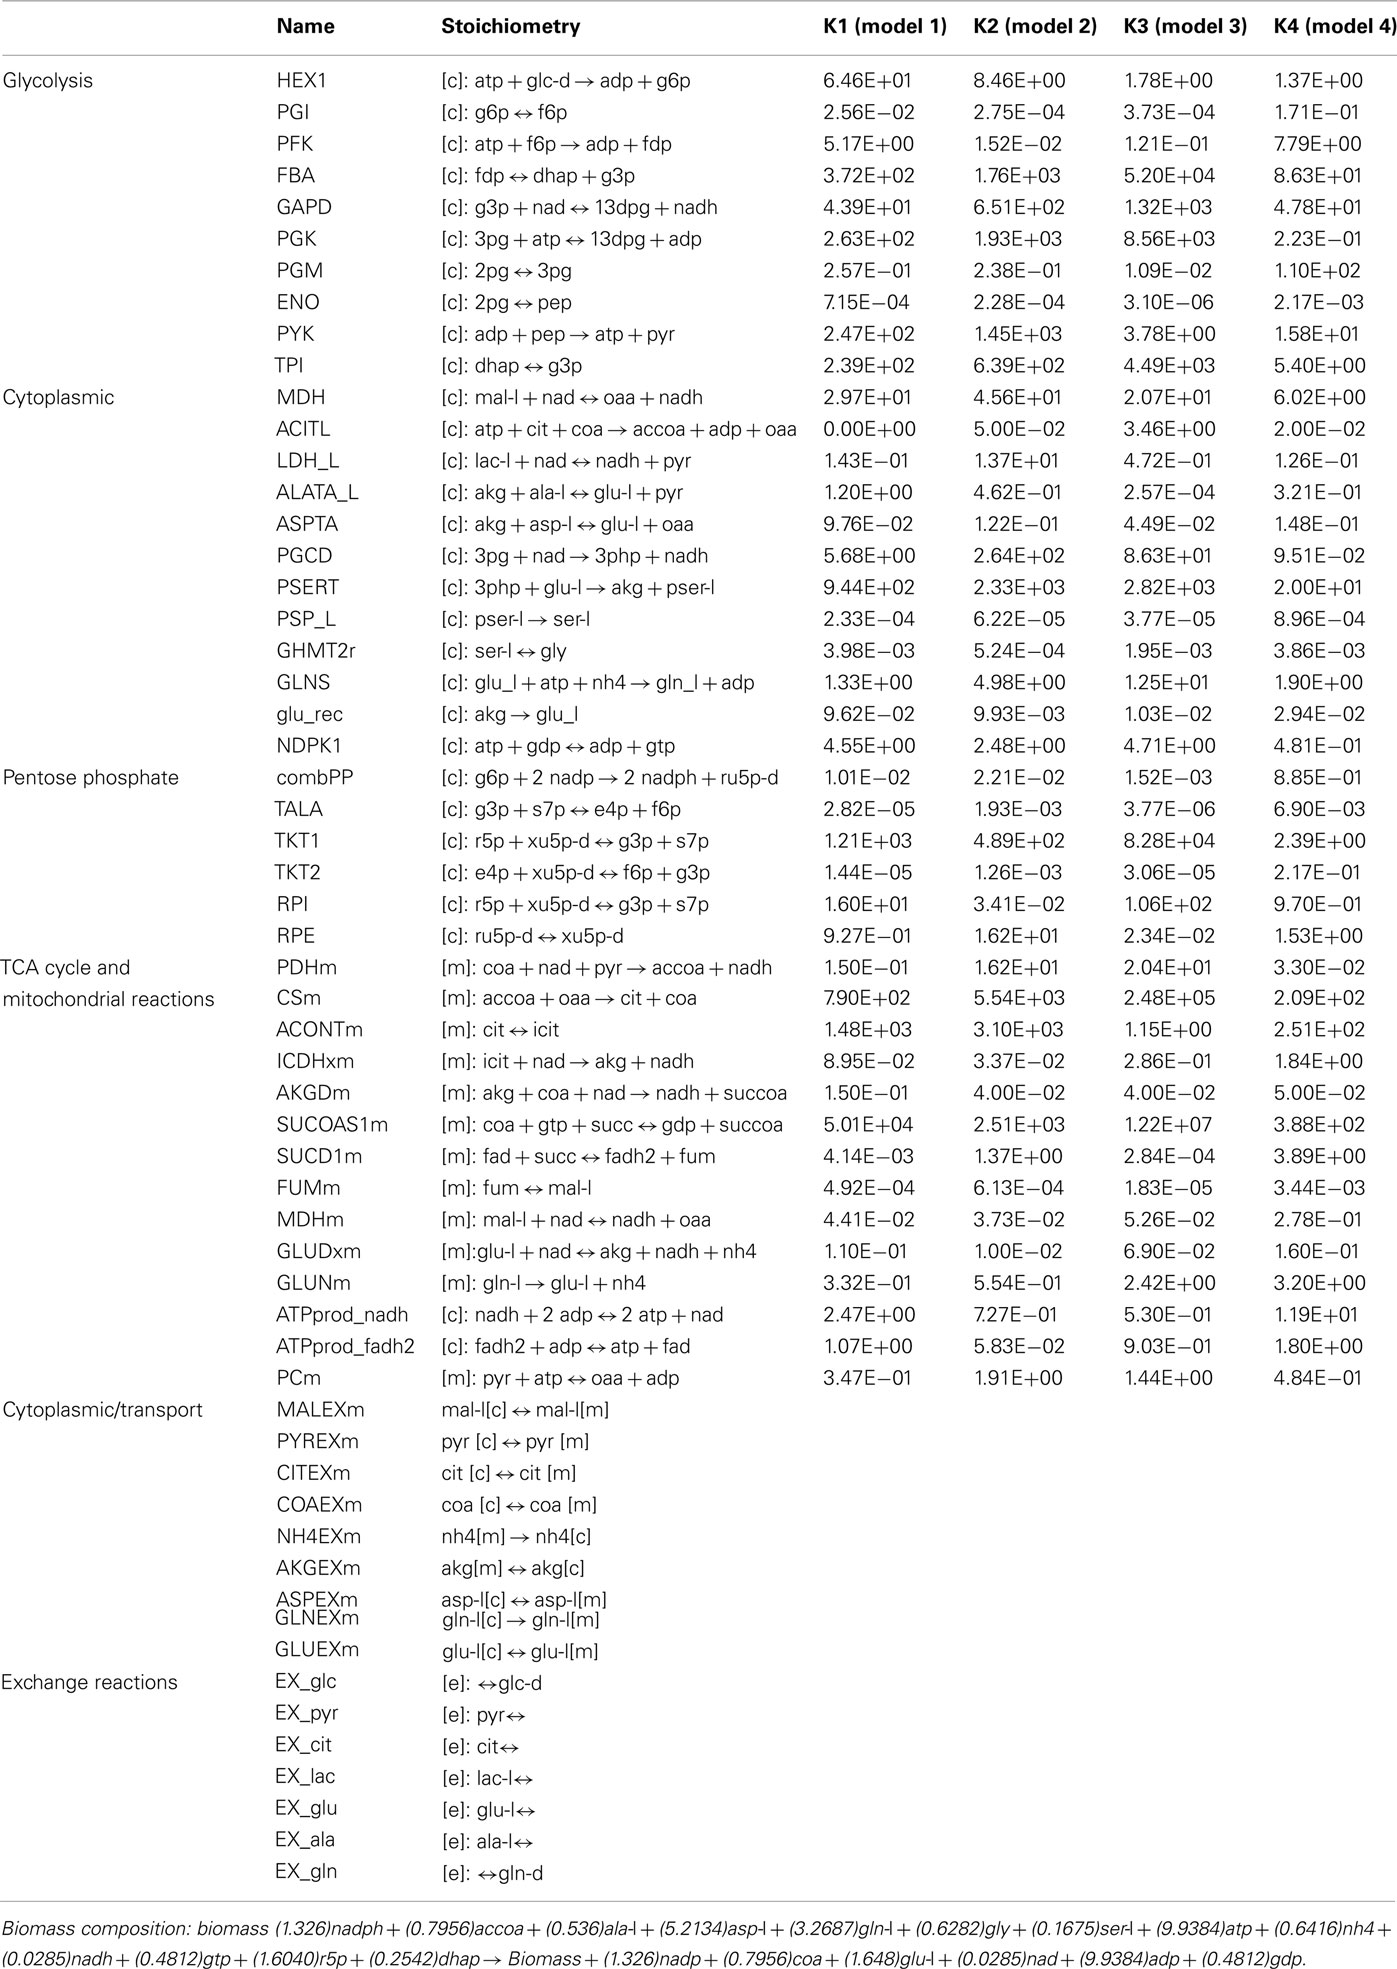
Table A1. The overall lumped kinetic parameter values for the 4 models remaining after screening of the ensemble. Detailed steps for the calculation of the overall lumped kinetic parameter values from the kinetic rate constants for the elementary reactions are outlined in Tran et al. (2008).
Keywords: ensemble modeling, flux balance analysis, cancer metabolism, Warburg effect
Citation: Khazaei T, McGuigan A and Mahadevan R (2012) Ensemble modeling of cancer metabolism. Front. Physio. 3:135. doi: 10.3389/fphys.2012.00135
Received: 26 December 2011; Accepted: 22 April 2012;
Published online: 16 May 2012.
Edited by:
Erwin Gianchandani, Computing Research Association, USAReviewed by:
Matthias Reumann, International Business Machines, AustraliaJason Papin, University of Virginia, USA
Ravi Radhakrishnan, University of Pennsylvania, USA
Copyright: © 2012 Khazaei, McGuigan and Mahadevan. This is an open-access article distributed under the terms of the Creative Commons Attribution Non Commercial License, which permits non-commercial use, distribution, and reproduction in other forums, provided the original authors and source are credited.
*Correspondence: Radhakrishnan Mahadevan, Department of Chemical Engineering and Applied Chemistry, University of Toronto, 200 College Street, Toronto, ON, Canada M5S3E5. e-mail:a3Jpc2huYS5tYWhhZGV2YW5AdXRvcm9udG8uY2E=

 Alison McGuigan1,2
