- Institute of Cardiovascular and Medical Sciences, University of Glasgow, Glasgow, UK
Introduction: Clinically in ventricular fibrillation (VF), ECG amplitude, and frequency decrease as ischemia progresses and predict defibrillation success. In vitro ECG amplitude declines without ischemia, independent of VF frequencies. This study examines the contribution of cellular electrical activity and global organization to ECG amplitude changes during VF. Methods and Results: Rabbit hearts were Langendorff-perfused (40 mL/min, Tyrode’s solution) and loaded with RH237. During VF, ECG, and epicardial optical action potentials were recorded (photodiode array; 256 sites, 15 mm × 15 mm). After 60 s of VF, perfusion was either maintained, global ischemia produced by low-flow (6 mL/min), or solution [K+]o raised to 8 mM. Peak-to-peak amplitude was determined for all signals. During VF, in control, ECG amplitude decreased to a steady-state (∼57% baseline), whereas in low-flow steady-state was not reached with the amplitude continuing to fall to 33% of baseline by 600 s. Optically, LV amplitude declined more than RV, reaching significance in control (LV vs. RV; 33 ± 5 vs. 63 ± 8%, p < 0.01). During VF in 8 mM [K+]o, amplitude changes were more complex; ECG amplitude increased with time (105 ± 13%), whilst LV amplitude decreased (60 ± 15%, p < 0.001). Microelectrode studies showed amplitude reduction in control and 8 mM [K+]o (to ∼79 and ∼93% baseline, respectively). Evaluation of electrical coordination by cross-correlation of optical signals showed as VF progressed coordination reduced in control (baseline 0.36 ± 0.02 to 0.28 ± 0.003, p < 0.01), maintained in low-flow (0.41 ± 0.03 to 0.37 ± 0.005, p = NS) and increased in 8 mM [K+]o (0.36 ± 0.02 to 0.53 ± 0.08, p < 0.05). Conclusion: ECG amplitude decline in VF is due to a combination of decreased systolic activation at the cellular level and increased desynchronization of inter-cellular electrical activity.
Introduction
Ventricular fibrillation (VF) is the major cause of sudden death in the western world; the annual incidence of out-of-hospital VF arrests in USA is ∼50,000 with a median survival to discharge of only 6.4% (Nichol et al., 1999). The rate of successful resuscitation in these arrests diminishes with time and is associated with a reduction in the frequency and amplitude of the oscillations of the surface ECG (Stewart et al., 1992; Callaway and Menegazzi, 2005). Indeed many clinical (Weaver et al., 1985; Strohmenger et al., 1997, 2001; Eftestol et al., 2004) and animal (Noc et al., 1994; Achleitner et al., 2000, 2001; Kolarova et al., 2003) studies have shown that the amplitude of ECG oscillation in VF just prior to defibrillation can predict the likelihood of defibrillation success and may be the most useful ECG parameter to assess optimal timing of defibrillation in out-of-hospital arrests (Strohmenger et al., 2001).
Although many of these studies have correlated the reduction in amplitude with factors such as delay to instigation of cardiopulmonary life support (Weaver et al., 1985) or the degree of coronary perfusion (Noc et al., 1994; Achleitner et al., 2000), the underlying cause of the reduction in ECG amplitude is unknown. Modeling studies show that VF becomes increasingly disorganized with time (Plank et al., 2005) and this in itself could result in reduction of amplitude in global electrical assessments such as the ECG as the incoherent electrical vectors cancel each other. In comparison, transmembrane recordings in single cell studies show reduction in amplitude of action potentials in ischemic conditions (Tissier et al., 2002). Therefore the aim of this study was to evaluate the various contributions of reduced coordination and cellular electrical activity to the reduction in amplitude of the global ECG amplitude changes in VF.
Materials and Methods
Langendorff Perfusion
New Zealand White rabbits (adult male weighing 3–3.5 kg) were sacrificed by intravenous injection of 0.5 ml/kg Euthatal (sodium pentobarbitone 200mg/kg, Rhône Mérieux) with 500 IU of heparin. All procedures were approved by the local ethical committee (University of Glasgow) and complied with Home Office (UK) regulations. Hearts were rapidly excised, then Langendorff-perfused at constant rate of 40 ml/min with Tyrode’s solution at 37°C [composition (mM): Na 134.5, Mg 1.0, K 5.0, Ca 1.9, Cl 101.8, SO4 1.0, H2PO4 0.7, HCO3 20, acetate 20, glucose 50, and pH 7.4 (95% O2/5% CO2)].
Optical Mapping
Hearts were placed into a custom-made Plexiglas chamber (Figure 1A) which allowed control of bathing solution temperature, and recording of global ECG from fixed electrodes. Optical mapping was performed as previously published (Caldwell et al., 2007). Briefly, hearts were loaded with 100 μL of RH237 (Molecular Probes), dissolved in DMSO (1 mg/ml). No excitation-contraction uncoupler was used in VF experiments. Hearts were briefly immobilized mechanically for optical recordings. Light at 535 ± 25nm (interference filter, Comar Instruments Ltd, UK) illuminated the anterior surface of the heart. Fluorescent light was focused at ×1.2 magnification onto a 16 × 16 photodiode array (C4675-102, Hamamatsu Photonics UK Ltd) after passing through a 695 nm long-pass filter. Each photodiode detected light from 0.8 mm × 0.8 mm area of epicardium with the full array recording from a ∼15 mm × 15mm area. Digitized data (1 kHz) was stored and analyzed offline using locally developed software written in Delphi (Borland Software Corp, CA, USA).
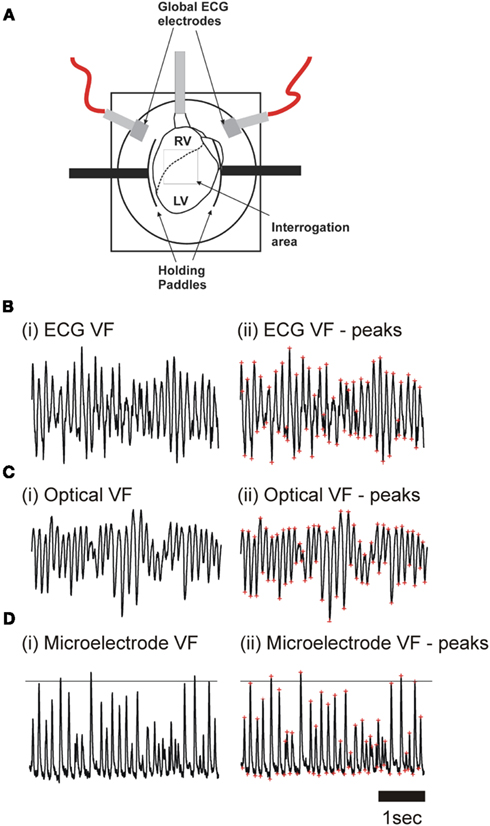
Figure 1. (A) Langendorff-perfused rabbit heart in optical mapping chamber. The superimposed grid represents the area of the myocardium (16 × 16 pixel) visualized by the photodiode array. (B) ECG recording during (i) ventricular fibrillation (VF), and (ii) VF with peaks identified (red asterisks). (C) Optical pixel recordings from LV epicardium during (i) in VF, and (ii) in VF with peaks identified (red asterisks). (D) Transmembrane recordings of the LV epicardium during (i) in VF, and (ii) VF with systolic and diastolic peaks identified.
After initial loading of voltage-sensitive dye, emission fluorescence can be affected by factors other than the membrane potential, including dye concentration (i.e., washout), internalization to the inner leaflet of the cell membrane and photobleaching (Salama, 2001). A progressive change in any of these factors could result in optical amplitude decline. Assuming that these changes occurred equivalently in sinus rhythm and VF the effect of these uncontrollable factors on the spontaneous degradation in the optical amplitude was investigated in preparations in which VF was not induced. In these experiments, 3 μM cytochalasin D was administered to reduce motion artifact as previously described (Caldwell et al., 2007). This allowed accurate measurement of AP amplitude during atrial pacing.
Floating Microelectrode
As previously described, a number of hearts were prepared for floating microelectrode impalement (Caldwell et al., 2007). Briefly, after insertion of an LV balloon, hearts were placed in a chamber adapted for microelectrode impalement of the LV epicardium by boring a 5 mm diameter hole in the Plexiglas front-plate. The chamber was rotated 90° to allow impalement of the epicardium with vertical microelectrodes suspended in an adjustable clamp. Microelectrodes of borosilicate glass (WPI, Sarasota, FL, USA) were pulled using a P-97 Flaming/Browning pipette puller (Sutter Instruments, Novato, CA, USA) and filled with 2 M KCl before the tips were mounted onto silver chloride coated silver wire (total resistance 20–25 MΩ). Transmembrane potentials [recorded via Microprobe Model 750 (WPI, Sarasota, FL, USA)] were taken during RV pacing with a cycle length (CL) of 180 ms and VF (Figure 1D). This allowed measurement of the resting membrane potential, or the maximum negative potential in VF (diastolic potential), and the maximum positive potential (systolic potential). Signals were also analyzed in the frequency domain.
VF Protocol and Analysis
Using platinum hook electrodes placed in the posterior aspect of the RV, VF was induced by burst pacing (50 Hz stimulation for 8 s). In all protocols hearts were perfused with normal Tyrode’s solution at 40 ml/min for the first 60 s of VF. Perfusion was maintained at 40 ml/min during control protocols, whereas in experimental protocols, either the perfusion rate (global ischemia – 6 ml/min) or solution composition was altered ([K+]o = 8 mM) at 60 s; raised [K+]o = 8 mM was chosen as this best reproduced the frequency changes observed in low-flow ischemia in our previous work (Caldwell et al., 2007). Solution change in both the perfusate and the chamber was completed by 90 s. In optical mapping experiments, ECG and optical recordings were taken for 4 s periods, ECGs were recorded every 30 s (Figure 1B) and optical measurements every minute (Figure 1C). In microelectrode experiments fresh impalements were achieved approximately every 30 s (Figure 1D). As impalement was lost the resting membrane potential started to depolarize. Care was taken only to analyze stable impalements.
As previously published (Caldwell et al., 2007), frequency power spectra were derived for all ECG, optical and microelectrode signals recorded during VF using Fast Fourier Transform. From these power spectra, the dominant frequency (DF) was identified as the frequency with the greatest power between 3 and 50 Hz. The power spectra of all pixels were summed to produce a global optical power spectra which is commonly known as the pseudoECG (psECG; Chen et al., 2000). The peak-to-peak amplitude was determined using locally developed software in all ECG, optical, and microelectrode signals recorded during VF. This software first filtered the raw signal by third-order polynomial subtraction, high pass (50 Hz), and low pass (3 Hz) filters. As shown in Figure 1B–D, the VF extrema were then identified.
Cross-Correlation
Optical resolution with the 256 pixel PDA is insufficient to allow accurate determination of activation sequences and identification of point singularities which requires the higher resolution of CCD cameras. Hence we determined the coordination of the optical signals across the optical field using a technique described by Choi et al. (2003). As shown in Figure 2 the coordination of optical signals during VF was assessed by calculating the correlation coefficient between pairs of signals after shifting one signal by a variable time lag. The correlation coefficient between normalized signals from two pixels was calculated as a function of the lag time and the maximum correlation coefficient (CCmax) determined. The process was repeated for all pairs of pixels and the mean correlation coefficient calculated for the whole field.
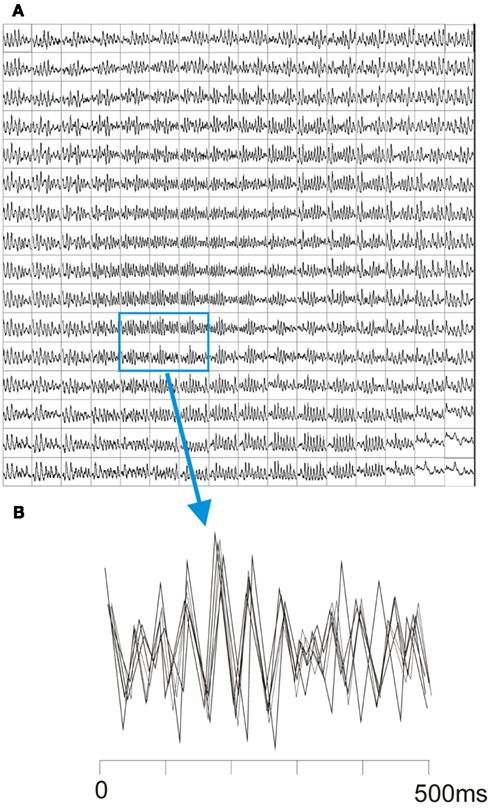
Figure 2. Optical traces during VF and assessment of coordination. (A) Shows typical optical traces by the PDA during VF. (B) Shows overlaying of six adjacent signals from the highlighted area. The signals are superimposed with time off-set to allow maximum cross-correlation.
Statistical Analysis
Data are expressed as mean ± SEM. Significance testing with repeated ANOVA and paired t-test were performed using Instat3 (GraphPad Software Inc., USA). For ECG, optical signal and microelectrode amplitude data were compared between (i) immediately after VF induction and (ii) the time interval of 420–540 s. Spatiotemporal changes were assessed at 480 s representing the mid-point of this time period.
Results
VF Amplitude in Control Conditions
As shown in Figure 3A, in VF during control conditions (40 ml/min, n = 7), the ECG amplitude reduced over the first 240 s, after this there was no significant change in amplitude with a more “steady-state” with a reduction to ∼55% of baseline amplitude. The simultaneous optical signal amplitude declined more markedly to ∼45% of baseline at 240 s and thereafter continued to decline at a slower rate (Figure 3A). Figure 3B demonstrates how this slower decline paralleled the linear optical signal amplitude decline observed with time in control non-VF preparations. This suggests that the continued slow reduction in optical signal amplitude after 240 s results from reduction in the fluorescence signal with time. Indeed, correcting the optical signal amplitude during control VF resulted in identical fractional changes to the ECG amplitude (Figure 3C).
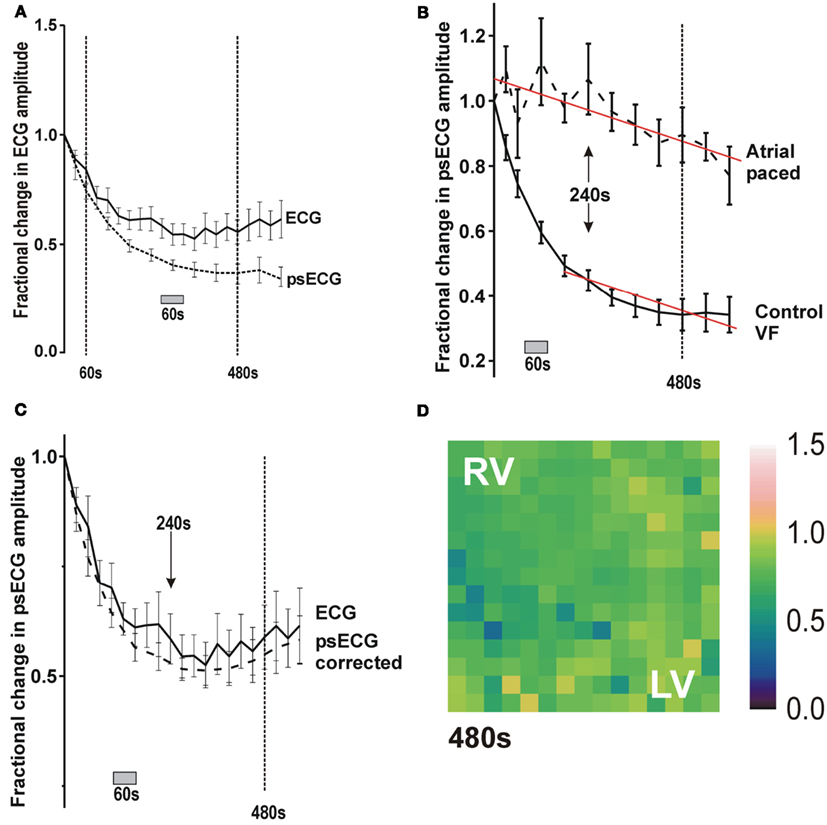
Figure 3. Change in ECG and optical signal amplitude in control conditions and effect of signal degradation on optical signal amplitude. (A) Plot of fractional change in ECG and optical signal amplitude with time in control perfused VF. (B) Plot of change in optical signal amplitude with time during atrial pacing and during VF in control conditions. (C) Plot of amplitude changes in ECG and corrected optical signal in control conditions. (D) Color map of the fractional change in amplitude during RA pacing after 480 s.
Spatiotemporally, the reduction in optical amplitude was not homogeneous across the anterior surface of the heart (Figure 4A). Rather, there was a more profound amplitude reduction in the LV than the RV (Table 1). This LV/RV heterogeneity in amplitude reduction was not observed in control non-VF preparations where the fractional amplitude reduction was homogeneous across the interrogated area (Figure 3D).

Table 1. Change in signal amplitude during VF in LV and RV expressed as a percentage of the baseline amplitude.

Figure 4. Color-coded maps of fractional change in optical signal amplitude during VF at 480 s. (White dotted lines = LV/RV boundary, white squares = standardized areas to determine ventricular optical amplitude). (A) Fractional change under control conditions (perfused) (B) during low flow ischaemia (C) during perfusion with 8mM K.
VF Amplitude in Low-Flow Ischemia
In Figure 5A i and ii, the ECG and optical signal show similar patterns of amplitude change in VF during the low-flow ischemia (n = 7). On reducing the flow rate to 6ml/min, there was an immediate increase in the amplitude which reached a peak at 120 s (black arrows in Figure 5A). After this peak, both amplitudes decreased in a near linear fashion until the protocol end at 600 s with amplitude reductions to ∼33%. From previous work this peak coincides with the dramatic fall in DF to a steady-state that occurs immediately on flow reduction (Caldwell et al., 2007).
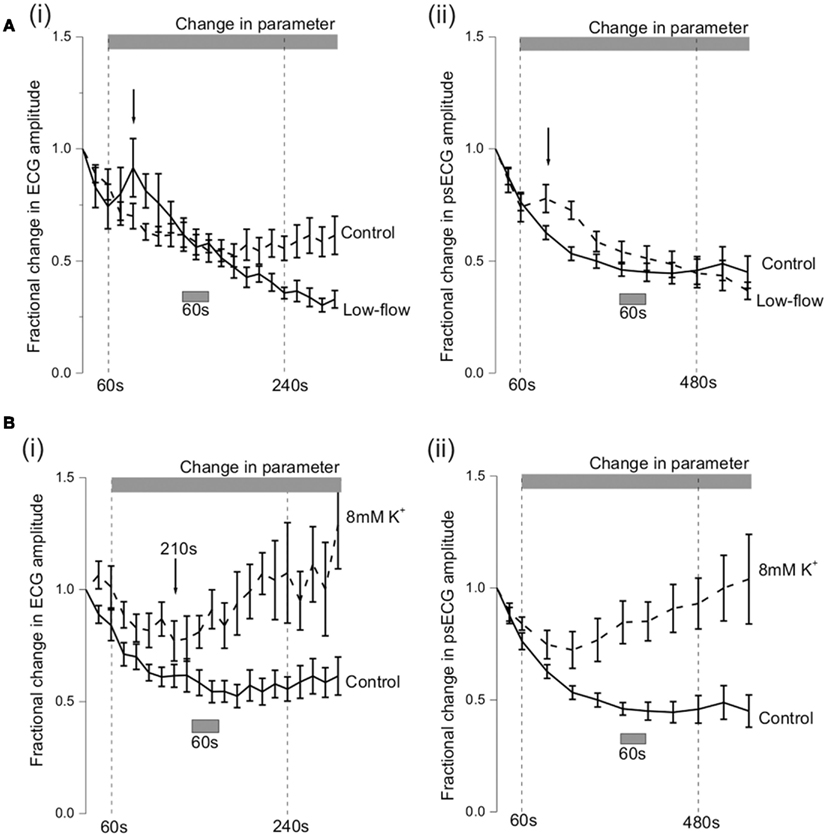
Figure 5. Amplitude changes during VF. (A) Shows the fractional amplitude changes that occurred in control (n = 7) and low-flow ischemia (n = 7). (A)(i) Changes in ECG amplitude with time. (A) (ii) Changes in optical signal amplitude with time after correction for optical signal degradation. (B) Shows the ECG and optical signal amplitude during VF in 8 mM (n = 6) and 10 mM (n = 5) [K+] solutions. (B) (i) Changes in ECG amplitude with time (**p < 0.01). (B) (ii) Changes in optical signal amplitude with time (***p < 0.001). (All optical data corrected for signal degradation.)
In low-flow ischemia, the spatiotemporal distribution of the fractional amplitude changes at 480 s was not significantly different from control, although there was a tendency for a greater reduction in RV optical amplitude (Figure 4B, Table 1).
VF Amplitude in Raised [K+]o
During VF in raised [K+]o (n = 5) the fractional change in ECG amplitude initially decreased to a trough at 210 s of 0.77 ± 0.09 in 8 mM [K+]o (Figure 5Bi). This was not significantly different from the fractional change of 0.62 ± 0.05 in control conditions at the same time point. After the trough, there was a steady increase in ECG amplitude so that by the 420–540 s observation period the fractional change in 8 mM [K+]o was 1.05 ± 0.13**.
Over the same period the fractional change in optical signal amplitude increased to 0.78 ± 0.09*** in 8 mM [K+]o (***p < 0.001 c.f. control of 0.37 ± 0.04; Figure 5Bii). In raised [K+]o, the spatiotemporal amplitude alterations were also different from that observed during VF in control conditions (Table 1, Figure 4C). At 480 s, the RV amplitude is maintained in 8 mM [K+]o.
Epicardial Transmembrane Potential in VF
Figure 1Di shows a typical transmembrane potential recorded with a floating microelectrode on the LV epicardial surface of a Langendorff-perfused rabbit heart during VF induction. As previously reported (Caldwell et al., 2007) the averaged signals of membrane potential from the epicardial surface of the LV revealed a similar DF progression to those of ECG and psECG under control conditions, low-flow ischemia and 8 mM [K+] (Figure 6A). Figure 6B shows that under control conditions, the maximum systolic membrane potential decreased in VF compared to immediately post VF induction values (initial VF, −9 ± 5 mV; VF 420–540 s, −24 ± 6 mV, p < 0.05) whilst the diastolic membrane potential remained stable (initial VF, −61 ± 2 mV; VF 420–540 s, −65 ± 3 mV) resulting in an amplitude reduction to 79% compared to the VF amplitude immediately after induction. Figure 6C shows that the systolic and diastolic membrane potentials during low-flow ischemia were not significantly different from control. Perfusion with 8 mM [K+]o during VF tended to depolarized the diastolic membrane potential (control VF, −65 ± 3 mV; 8 mM [K+] VF, −59 ± 5 mV) and resulted in an amplitude reduction to 93% compared to that immediately after induction (Figure 6D).
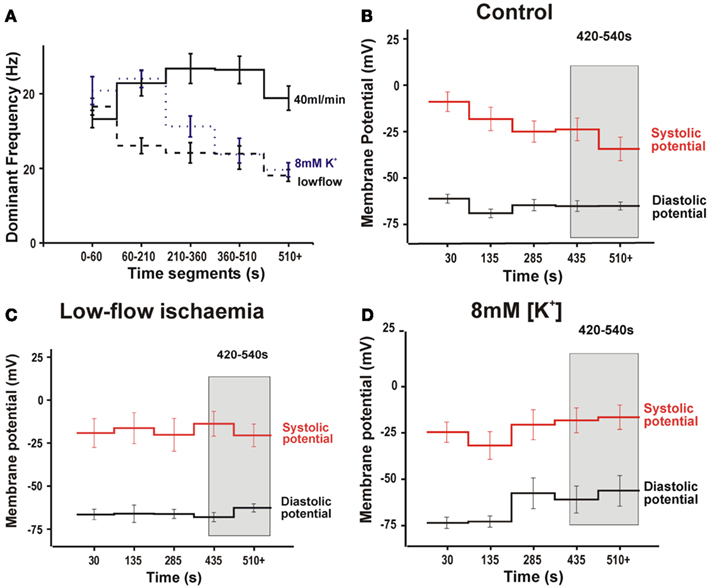
Figure 6. Results from epicardial transmembrane recordings from the LV during VF. (A) Microelectrode DF during VF. (B) Membrane potential during VF in control conditions. (C) Membrane potential during during VF in low-flow ischemia. (D) Membrane potential during VF in 8 mM [K+] solution. (Gray bar highlights time interval of 420–540 s used for statistical comparison).
Cross-Correlation of Optical Signals
Figure 7 shows the progression of mean correlation coefficient across the optical field with time. In control conditions the decreasing organization is reflected in a fall in the mean correlation coefficient from at 0.36 ± 0.02 to 0.28 ± 0.003 at 600 s (p < 0.01). By comparison, the level of coordination was relatively constant over time in low-flow ischemia with the correlation coefficient at baseline of 0.41 ± 0.03 not significantly different from 0.37 ± 0.005 at 600 s. In contrast, at [K+]o = 8 mM, the local signals became more co-ordinated as VF progressed and the correlation coefficient increased from 0.36 ± 0.02 at baseline to 0.53 ± 0.08 at 600s (p < 0.05).
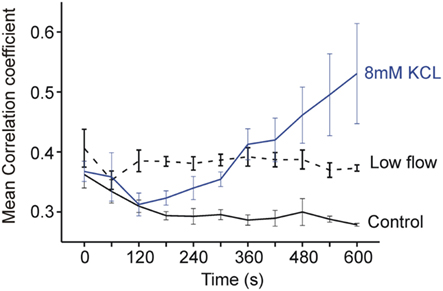
Figure 7. Plot of mean correlation coefficient across the optical field with time. The correlation coefficient is seen to fall with time in control conditions, to be conserved in low-flow ischemia and to increase with time in [K+]o 8 mM.
Conduction Velocity and Optical Signal Amplitude
Figure 8 uses sample recordings from floating microelectrodes to illustrate the effect of the change in shape of the action potential and slowing of conduction velocity on the optical signal averaged across a pixel. Dimensions of pixel and conduction velocity are based on measurement system and conduction velocity obtained during the study. Shorter duration APs and slower conduction velocity results in a greater change in the optical signals compared to the transmembrane signals from which they are derived.
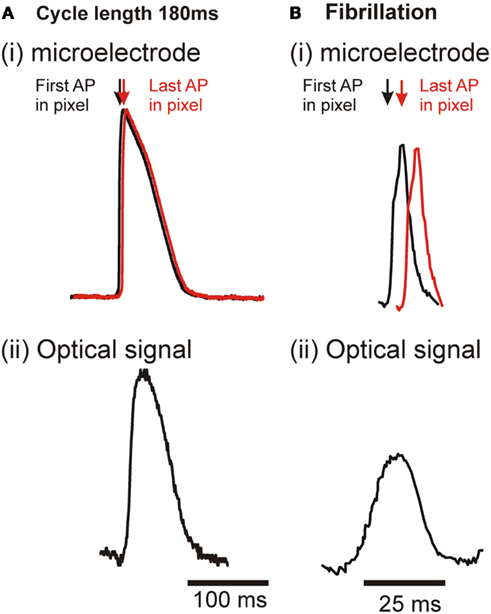
Figure 8. Illustration of earliest and latest activation within a single pixel in regular pacing and VF and the effect on resultant optical signal. (A) During regular pacing. (i) transmembrane AP – assuming CV = 50 cm/s across the ∼1 mm2 pixel, the maximal delay between the first and last activation would be ∼2 ms. (ii) Resultant optical signal from a single pixel. (B) During VF. (i) transmembrane AP – with greatly reduced APD. The reduced CV of ∼35 cm/s increases the maximal delay to ∼3.5 ms. (ii) Resultant optical signal from a single pixel.
Discussion
The aim of this to study was to examine the contribution of reduced spatial organization and reduction in cellular action potential (AP) amplitude to the global and spatiotemporal amplitude changes during VF. This study is the first to document a decline in ECG and LV optical VF amplitude in fully perfused VF and to show that this is not solely due to reduced AP amplitude at a cellular level. We hypothesize that the remainder of the amplitude reduction is due to decreased inter-cellular coordination and supply evidence that supports this conjecture. This study is also the first to show an apparent increase in ECG and LV optical VF amplitude with time in raised [K+]o and that we hypothesize is solely due to increased inter-cellular electrical coordination as the AP amplitude was actually reduced.
VF Amplitude in Control Conditions
In VF during fully perfused control conditions, the amplitude of the ECG decreased in a non-linear fashion. An initial period of rapid amplitude reduction was followed stabilization at ∼55%. The ECG gives a global assessment of the electrical activity of the heart, and as such a reduction in its amplitude could represent (i) a homogeneous decrease in the amplitude of the electrical activations across the heart, (ii) heterogeneous changes, or (iii) no real decrease in the amplitude of the electrical activations, but rather an increase in electrical disorganization, as is known to occur in fully perfused VF (Witkowski et al., 1998). With increased disorganization, the local electrical vectors will increasingly oppose each other, thereby reducing the electrical amplitude as measured at a global level.
Although the optically derived psECG is also a global measure of electrical activity, its amplitude change is derived from the amplitude changes recorded in each of the 252 photodiodes. As each photodiode records from a small epicardial area (0.8 mm × 0.8 mm), vector alignment does not influence optical signal amplitude. However the amplitude of the optical signal may still be influenced by the reduction of inter-cellular synchrony. In optical mapping, the signal from a single pixel represents the summated activity from several thousands of cells (Bishop et al., 2009). As the AP propagates across the ∼1 mm2 of epicardium recorded by the photodiode, there is a delay in the activation time of each cell and hence the upstroke of the optical AP is slower than the simultaneous transmembrane AP (Figure 1). During regular pacing in control conditions, the average conduction velocity of ∼50 cm/s (Wiegerinck et al., 2006; Caldwell et al., 2007) creates a 2 ms spread of activation times across the pixel. Although this spread of activation acts to reduce the upstroke velocity, it does not significantly affect the AP amplitude due to the AP plateau, i.e., the plateau phase of the AP allows synchronization of the equivalent fluorescence phase in the hundreds of cells within the pixel (Figure 8A). In contrast, in VF the AP duration is dramatically curtailed and the AP morphology altered such that there is no prolonged plateau phase [Figure 8Bi]. Such changes allow little time for synchronization of the peak fluorescence between cells. Also during VF the conduction velocity is reduced creating a greater spread of activation times across the pixel. So theoretically, a change in the local synchrony of activation could also affect the optical amplitude.
Transmembrane recordings during VF in control conditions showed that the amplitude reduction was due to reduced systolic depolarization. However the reduction of AP amplitude to 79% of that immediately post VF induction was considerably less than the AP amplitude reduction measured by ECG (57% of that immediately post VF induction) or optically (54% of the amplitude immediately post VF induction after correction for signal degradation). So although the AP amplitude is reduced at the cellular level, this cannot explain all the amplitude reduction of ECG and optical recordings. The reduction in mean correlation coefficient with time in perfused VF show decreased coordination between groups of cells within adjacent pixels and thus suggests reduced inter-cellular coordination with time. The greater coordination seen within the low-flow group may be linked to the higher extracellular K+ levels during ischemia, since K+ alone increases the mean correlation coefficient.
VF Amplitude in Low-Flow Ischemia
Both clinical (Weaver et al., 1985; Strohmenger et al., 1997, 2001; Eftestol et al., 2004) and animal studies (Brown et al., 1989; Noc et al., 1994; Strohmenger et al., 1996; Achleitner et al., 2000, 2001; Kolarova et al., 2003) show reduction of ECG amplitude during VF with time when cardiac perfusion is not maintained. Similarly, this study demonstrated reductions of ECG and optical signal amplitudes in VF during low-flow ischemia. However, on reducing perfusion, the ECG and optical signal amplitude transiently increased. Two possible explanations for this transient amplitude increase are: – (i) Hyperpolarization – low levels of intracellular acidosis are known to hyperpolarize the resting membrane potential (Sato et al., 1985) and so may increase the VF AP amplitude. In ischemia, the myocardial pH decreases exponentially with time (Garlick et al., 1979). Thus any hyperpolarization would be transient, as the pH fell further to levels known to depolarize the resting membrane potential (Sato et al., 1985). This is unlikely to be the explanation as the effect is probably quite small and if anything there is diastolic depolarization as seen in Figure 6Cii. Increased electrical coordination – in global ischemia, VF becomes more co-ordinated (Wiggers, 1940; Mandapati et al., 1998; Rogers et al., 1999; Huang et al., 2004). Such coordination may cause an apparent increase in VF amplitude. In contrast to the ECG and optical signal amplitudes, and in keeping with previous research (Czarnecka et al., 1973; Kleber, 1983), transmembrane recordings did not demonstrate transient increases in VF amplitude on reduction of perfusion rate. This suggests that the transient increase in ECG and optical signal amplitudes were secondary to increased electrical coordination. Examination of mean correlation coefficient tends to support this argument as it remained constant during VF in low-flow ischemia and did not decrease as seen in controlled conditions.
VF Amplitude in Raised [K+]o
In this study the ECG and optical signal amplitude initially decreased during VF in raised [K+]o and then increased. This secondary amplitude augmentation runs contrary to theoretical expectations and previous experimental findings. Theoretically, raising [K+]o from 5.5 to 11 mM depolarizes the resting membrane potential from −82 to −64 mV, whilst experimentally in whole heart (Kleber, 1983; Wilde, 1988) and cellular preparations (Tissier et al., 2002), raising [K+]o to 11 mM depolarizes the membrane by ∼26 mV and reduces the AP amplitude accordingly (Kleber, 1983; Tissier et al., 2002). As above another consideration in optical recordings is the APD, as the longer the plateau phase the higher the chance of peak amplitude coordination, and thus the greater the peak optical amplitude. Previous studies, including our own, document reduced APD in raised [K+]o, a phenomenon that would tend to reduce rather than increase optical amplitude (Koller et al., 2000; Caldwell et al., 2007).
The observed increase in VF amplitude coincides with a reduction in ECG, psECG, and LV DF (Caldwell et al., 2007). This suggests that as the frequency of the activations decreases, the electrical activity in VF becomes more organized, and hence the amplitude of the global ECG measurements increases as the local electrical vectors reinforce each other. Such increased organization is not associated with increases in AP amplitude at the cellular level as shown by transmembrane recordings. Rather microelectrode studies demonstrated significant depolarization of the diastolic membrane potential during VF in raised [K+]o and reduction of the AP amplitude to 93% of baseline consistent with theoretical predictions and previous studies (Kleber, 1983; Tissier et al., 2002). One possible explanation for increased coordination in VF in raised [K+]o is reduced conduction velocity which has been previously described (Koller et al., 2000). However, as previously published, there was no significant change in conduction velocity in raised [K+]o in the conditions used in this study (Caldwell et al., 2007).
In this study we confirmed increased electrical coordination with time during VF in raised [K+]o by demonstrating that the optical correlation coefficient also increased with time. As stated before although this coefficient represents coordination between adjacent groups of cells within each pixel we believe it is a true reflection of the electrical coordination at the cellular level.
Study Limitations
The use of optical mapping to assess myocardial electrical activation means that the data is inherently limited to the first few nanometers of the epicardial surface. Previous studies using plunge needles have suggested that as VF progresses changes in the epicardium are slower than changes in the endocardium (Newton et al., 2004). However such plunge needles interfere with the micro-structure of the heart and affect the electrical changes. The similar frequency and amplitude changes that occurred in the global ECG and optical measurements in this study suggest that the epicardial changes are a reasonable reflection of the whole myocardium. Optical mapping has been performed in rabbit heart wedge preparations but here the heart is too small to sustain VF. Whilst it could be argued that “no flow” ischemia is more clinically relevant than “low-flow,” we found that in no flow the heart quickly spontaneously converted to a regular organized rhythm of ventricular origin (idioventricular escape-like rhythm). Such conversions are only rarely reported in humans. The flow rates used in “low-flow” are akin to the perfusion achieved in CPR (i.e., 25%) and thus do have a clinical correlate.
Conclusion
This study documents for the first time that during VF in control conditions ECG activation amplitude reduces with time. This amplitude decline is due to a combination decreased systolic activation at the cellular level and increased disorganization of the electrical activity. This study also shows that during VF, ECG, and optical mapping may show increases in amplitude as a result of increased electrical synchrony. The complexity of this relationship suggests that amplitude will not be a useful marker of VF progression in clinical scenarios.
Conflict of Interest Statement
The authors declare that the research was conducted in the absence of any commercial or financial relationships that could be construed as a potential conflict of interest.
Acknowledgments
This work was supported by the British Heart Foundation. Dr. Caldwell was supported during this work through the British Heart Foundation Clinical PhD Fellowship scheme.
References
Achleitner, U., Wenzel, V., Strohmenger, H. U., Krismer, A. C., Lurie, K. G., Lindner, K. H., and Amann, A. (2000). The effects of repeated doses of vasopressin or epinephrine on ventricular fibrillation in a porcine model of prolonged cardiopulmonary resuscitation. Anesth. Anal. 90, 1067–1075.
Achleitner, U., Wenzel, V., Strohmenger, H. U., Lindner, K. H., Baubin, M. A., Krismer, A. C., Mayr, V. D., and Amann, A. (2001). The beneficial effect of basic life support on ventricular fibrillation mean frequency and coronary perfusion pressure. Resuscitation 51, 151–158.
Bishop, M. J., Bub, G., Garny, A., Gavaghan, D. J., and Rodriguez, B. (2009). An investigation into the role of the optical detection set-up in the recording of cardiac optical mapping signals: a Monte Carlo simulation study. Physica D 238, 1008–1018.
Brown, C. G., Dzwonczyk, R., Werman, H. A., and Hamlin, R. L. (1989). Estimating the duration of ventricular fibrillation. Ann. Emerg. Med. 18, 1181–1185.
Caldwell, J. C., Burton, F. L., Smith, G. L., and Cobbe, S. M. (2007). Heterogeneity of ventricular fibrillation dominant frequency during global ischemia in isolated rabbit hearts. J. Cardiovasc. Electrophysiol. 18, 854–861.
Callaway, C. W., and Menegazzi, J. J. (2005). Waveform analysis of ventricular fibrillation to predict defibrillation. Curr. Opin. Crit. Care 11, 192–199.
Chen, J., Mandapati, R., Berenfeld, O., Skanes, A. C., and Jalife, J. (2000). High-frequency periodic sources underlie ventricular fibrillation in the isolated rabbit heart. Circ. Res. 86, 86–93.
Choi, B. R., Liu, T., Lavasani, M., and Salama, G. (2003). Fiber orientation and cell-cell coupling influence ventricular fibrillation dynamics. J. Cardiovasc. Electrophysiol. 14, 851–860.
Czarnecka, M., Lewartowski, B., and Prokopczuk, A. (1973). Intracellular recording from the in situ working dog heart in physiological conditions and during acute ischemia and fibrillation. Acta Physiol. Pol. 24, 331–337.
Eftestol, T., Wik, L., Sunde, K., and Steen, P. A. (2004). Effects of cardiopulmonary resuscitation on predictors of ventricular fibrillation defibrillation success during out-of-hospital cardiac arrest. Circulation 110, 10–15.
Garlick, P. B., Radda, G. K., and Seeley, P. J. (1979). Studies of acidosis in the ischaemic heart by phosphorus nuclear magnetic resonance. Biochem. J. 184, 547–554.
Huang, J., Rogers, J. M., Killingsworth, C. R., Singh, K. P., Smith, W. M., and Ideker, R. E. (2004). Evolution of activation patterns during long-duration ventricular fibrillation in dogs. Am. J. Physiol. Heart Circ. Physiol. 286, H1193–H1200.
Kleber, A. G. (1983). Resting membrane potential, extracellular potassium activity, and intracellular sodium activity during acute global ischemia in isolated perfused guinea pig hearts. Circ. Res. 52, 442–450.
Kolarova, J., Ayoub, I. M., Yi, Z., and Gazmuri, R. J. (2003). Optimal timing for electrical defibrillation after prolonged untreated ventricular fibrillation. Crit. Care Med. 31, 2022–2028.
Koller, M. L., Riccio, M. L., and Gilmour, R. F. Jr. (2000). Effects of [K(+)](o) on electrical restitution and activation dynamics during ventricular fibrillation. Am. J. Physiol. Heart Circ. Physiol. 279, H2665–H2672.
Mandapati, R., Asano, Y., Baxter, W. T., Gray, R., Davidenko, J., and Jalife, J. (1998). Quantification of effects of global ischemia on dynamics of ventricular fibrillation in isolated rabbit heart. Circulation 98, 1688–1696.
Newton, J. C., Smith, W. M., and Ideker, R. E. (2004). Estimated global transmural distribution of activation rate and conduction block during porcine and canine ventricular fibrillation. Circ. Res. 94, 836–842.
Nichol, G., Stiell, I. G., Laupacis, A., Pham, B., De Maio, V. J., and Wells, G. A. (1999). A cumulative meta-analysis of the effectiveness of defibrillator-capable emergency medical services for victims of out-of-hospital cardiac arrest. Ann. Emerg. Med. 34, 517–525.
Noc, M., Weil, M. H., Gazmuri, R. J., Sun, S., Biscera, J., and Tang, W. (1994). Ventricular fibrillation voltage as a monitor of the effectiveness of cardiopulmonary resuscitation. J. Lab. Clin. Med. 124, 421–426.
Plank, G. E. R. N., Leon, L. J., Kimber, S. H. A. N., and Vigmond, E. J. (2005). Defibrillation depends on conductivity fluctuations and the degree of disorganization in reentry patterns. J. Cardiovasc. Electrophysiol. 16, 205–216.
Rogers, J. M., Huang, J., Smith, W. M., and Ideker, R. E. (1999). Incidence, evolution, and spatial distribution of functional reentry during ventricular fibrillation in pigs. Circ. Res. 84, 945–954.
Sato, R., Noma, A., Kurachi, Y., and Irisawa, H. (1985). Effects of intracellular acidification on membrane currents in ventricular cells of the guinea pig. Circ. Res. 57, 553–561.
Stewart, A. J., Allen, J. D., and Adgey, A. A. (1992). Frequency analysis of ventricular fibrillation and resuscitation success. Q. J. Med. 85, 761–769.
Strohmenger, H. U., Eftestol, T., Sunde, K., Wenzel, V., Mair, M., Ulmer, H., Lindner, K. H., and Steen, P. A. (2001). The predictive value of ventricular fibrillation electrocardiogram signal frequency and amplitude variables in patients with out-of-hospital cardiac arrest. Anesth. Analg. 93, 1428–1433.
Strohmenger, H. U., Lindner, K. H., and Brown, C. G. (1997). Analysis of the ventricular fibrillation ECG signal amplitude and frequency parameters as predictors of countershock success in humans. Chest 111, 584–589.
Strohmenger, H. U., Lindner, K. H., Keller, A., Lindner, I. M., and Pfenninger, E. G. (1996). Spectral analysis of ventricular fibrillation and closed-chest cardiopulmonary resuscitation. Resuscitation 33, 155–161.
Tissier, C., Bes, S., Vandroux, D., Fantini, E., Rochette, L., and Athias, P. (2002). Specific electromechanical responses of cardiomyocytes to individual and combined components of ischemia. Can. J. Physiol. Pharmacol. 80, 1145–1157.
Weaver, W. D., Cobb, L. A., Dennis, D., Ray, R., Hallstrom, A. P., and Copass, M. K. (1985). Amplitude of ventricular fibrillation waveform and outcome after cardiac arrest. Ann. Intern. Med. 102, 53–55.
Wiegerinck, R. F., Verkerk, A. O., Belterman, C. N., van Veen, T. A. B., Baartscheer, A., Opthof, T., Wilders, R., de Bakker, J. M. T., and Coronel, R. (2006). Larger cell size in rabbits with heart failure increases myocardial conduction velocity and QRS duration. Circulation 113, 806–813.
Wiggers, C. J. (1940). The mechanism and nature of ventricular fibrillation. Am. Heart J. 20, 399–412.
Keywords: ECG, optical mapping, floating microelectrode, ischemia, ventricular fibrillation
Citation: Caldwell JC, Burton FL, Cobbe SM and Smith GL (2012) Amplitude changes during ventricular fibrillation: a mechanistic insight. Front. Physio. 3:147. doi: 10.3389/fphys.2012.00147
Received: 16 January 2012; Accepted: 02 May 2012;
Published online: 23 May 2012.
Edited by:
Tobias Opthof, Academic Medical Center, NetherlandsReviewed by:
Steve Poelzing, University of Utah, USAAlessandro Capucci, Universita’ Politecnica delle Marche, Italy
Copyright: © 2012 Caldwell, Burton, Cobbe and Smith. This is an open-access article distributed under the terms of the Creative Commons Attribution Non Commercial License, which permits non-commercial use, distribution, and reproduction in other forums, provided the original authors and source are credited.
*Correspondence: Godfrey L. Smith, Institute of Cardiovascular and Medical Sciences, University of Glasgow, Glasgow G12 8QQ, UK. e-mail:Z29kZnJleS5zbWl0aEBnbGFzZ293LmFjLnVr
†Present address: Jane C. Caldwell, Department of Cardiology, Queen’s University, Kingston, ON, Canada, K7L 3N6.

 Francis L. Burton
