- 1 Department of Vertebrate Genomics, Max Planck Institute for Molecular Genetics, Berlin, Germany
- 2 Institute of Pathology, Medical University of Graz, Graz, Austria
- 3 Division of Molecular Genome Analysis, German Cancer Research Center, Heidelberg, Germany
- 4 Manchester Centre for Integrative Systems Biology, Manchester Interdisciplinary Biocentre, University of Manchester, Manchester, UK
- 5 Cancer Stem Cell Group, Institute for Pathology and Comprehensive Cancer Center, Charité – Universitätsmedizin, Berlin, Germany
- 6 Magnetic Resonance Center, University of Florence, Florence, Italy
- 7 Department of Molecular Cell Biology, Netherlands Institute for Systems Biology, Vrije Universiteit Amsterdam, Amsterdam, Netherlands
- 8 Doctoral Training Centre ISBML, The Manchester Centre for Integrative Systems Biology, Manchester Interdisciplinary Biocentre, University of Manchester, Manchester, UK
- 9 Synthetic Systems Biology, Swammerdam Institute for Life Sciences, University of Amsterdam, Amsterdam, Netherlands
- 10 Dahlem Centre for Genome Research and Medical Systems Biology, Berlin, Germany
- 11 Medical Faculty, Institute for Stem Cell Research and Regenerative Medicine, Heinrich Heine University, Düsseldorf, Germany
Non-alcoholic fatty liver disease comprises a broad spectrum of disease states ranging from simple steatosis to non-alcoholic steatohepatitis. As a result of increases in the prevalences of obesity, insulin resistance, and hyperlipidemia, the number of people with hepatic steatosis continues to increase. Differences in susceptibility to steatohepatitis and its progression to cirrhosis have been attributed to a complex interplay of genetic and external factors all addressing the intracellular network. Increase in sugar or refined carbohydrate consumption results in an increase of insulin and insulin resistance that can lead to the accumulation of fat in the liver. Here we demonstrate how a multidisciplinary approach encompassing cellular reprogramming, transcriptomics, proteomics, metabolomics, modeling, network reconstruction, and data management can be employed to unveil the mechanisms underlying the progression of steatosis. Proteomics revealed reduced AKT/mTOR signaling in fibroblasts derived from steatosis patients and further establishes that the insulin-resistant phenotype is present not only in insulin-metabolizing central organs, e.g., the liver, but is also manifested in skin fibroblasts. Transcriptome data enabled the generation of a regulatory network based on the transcription factor SREBF1, linked to a metabolic network of glycerolipid, and fatty acid biosynthesis including the downstream transcriptional targets of SREBF1 which include LIPIN1 (LPIN) and low density lipoprotein receptor. Glutathione metabolism was among the pathways enriched in steatosis patients in comparison to healthy controls. By using a model of the glutathione pathway we predict a significant increase in the flux through glutathione synthesis as both gamma-glutamylcysteine synthetase and glutathione synthetase have an increased flux. We anticipate that a larger cohort of patients and matched controls will confirm our preliminary findings presented here.
Introduction
Non-alcoholic fatty liver disease (NAFLD) is on the rise in the western population affecting one-third of adults and an increasing proportion of children (de Alwis and Day, 2008; Vuppalanchi and Chalasani, 2009). Early stages of this disease exhibit accumulation of lipids in the liver leading to hepatic steatosis which is followed by advancing levels of fibrosis and inflammation. In a subset of these individuals the inflammatory response is accompanied by hepatocyte ballooning and progression to steatohepatitis which can lead to cirrhosis and liver cancer (Day, 2006; Petta et al., 2009).
Hepatic steatosis is caused by the abnormal accumulation of predominantly triglycerides (TG) in the liver. In histological sections of liver parenchyma TG droplets are visible in the cytoplasm of hepatocytes. This accumulation of TG in small or large vesicles impairs hepatic function and makes the liver more susceptible to other injuries. It has been shown that patients with NAFLD have a worse outcome when compared with an age and sex-matched general population, stemming from cardiovascular and liver related mortality (Ekstedt et al., 2006; Angulo, 2010). As most patients with NAFLD are obese and often resistant to insulin, steatosis can lead to significant co-morbidity or progress to non-alcoholic steatohepatitis, thus justifying therapeutic intervention already at the early stages. As NAFLD is highly associated with obesity and diabetes, weight loss can greatly improve the health status of these patients. However, the different susceptibility of patients with similar body mass index (BMI) to acquire NAFLD suggests a role for genetic factors and susceptibility genes.
The liver utilizes glycogen for energy storage and TG are usually mainly stored in adipocytes. Fatty acids originate either from the circulation, i.e., diet, are released from adipocytes by adipocyte TG hydrolase (ATGL) or are synthesized de novo in the liver. In each of these metabolic pathways, multiple transcription factors and signaling cascades (Horton et al., 2002; Li et al., 2010b) are involved thus presenting multiple possibilities for regulation and also deregulation of this network.
There exist several hereditary genetic disorders that demonstrate that these networks can be deregulated in vivo. Congenital generalized lipodystrophy, glycogen storage disease type 1a, and citrin deficiency all cause severe hepatic steatosis even in the absence of obesity or insulin resistance. Several mutations and genetic defects are known to influence TG accumulation in the liver, like mutations of ATGL which prevent mobilization of TG from the hepatocytes or mutations in apolipoprotein B which impair TG secretion to the bloodstream (Hooper et al., 2011). However, single gene mutations are only rarely responsible for NAFLD with the majority of cases caused by changes in the quantity and composition of food consumed in the western hemisphere. The Dallas Heart Study, which included 2000 individuals of multi ethnic origin, has shown that hepatic steatosis is rare in lean individuals with a BMI < 25 kg/m2 whereas it is highly prevalent in obese participants presenting a BMI > 45 kg/m2 (Browning et al., 2004).
In summary, hepatic steatosis is clearly correlated to food intake and insulin resistance. However, even in the severely obese, large differences in the extent of steatosis can be observed. As steatosis stands at the start of the road to non-alcoholic steatohepatitis (NASH) and hepatocellular carcinoma (HCC), finding genetic determinants of susceptibility to NAFLD might help in the prevention of NASH and HCC.
Studying NAFLD in human patients is limited by the need for liver biopsies to determine the stage of NAFLD and by the strong influence of the individual environment of the patient with respect to food intake and exercise. Nevertheless some genome wide association studies have recently been performed and identified genetic variants that have distinct effect on metabolic traits (Speliotes et al., 2011). Animal models have shed light on a causal relationship between insulin resistance and hepatic steatosis but so far failed in elucidating useful genetic markers to determine the susceptibility of individuals to develop NAFLD (Voshol et al., 2003; den Boer et al., 2004).
Hepatocytes generated from induced Pluripotent Stem (iPS) cells can thus present a model system in which the response of naïve hepatocytes with the patient’s genome to experimental stimuli can be tested and analyzed. These unique features of iPS cell-derived hepatocytes could help in elucidating the genetic networks that are responsible for the different reaction of the patients hepatocytes to the environmental stimulus presented to them by the patient’s lifestyle.
In this manuscript we illustrate how a multi-disciplined systems biology approach can be used to study the etiology of steatosis. The scheme presented in Figure 1 shows the interactions between wet-labs (cell biology and biochemistry) and in silico analysis which is made up of data integration, pathway reconstruction, and modeling. A description of the consortium can be found at http://www.erasysbio.net/index.php?index=264.
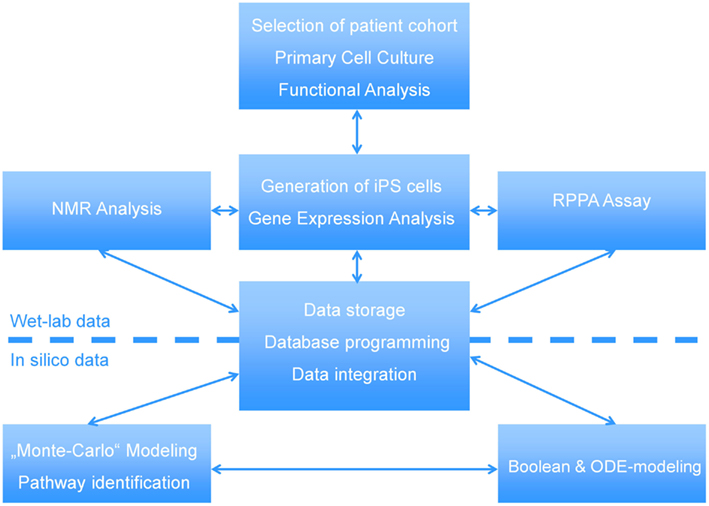
Figure 1. Interdependencies between the wet-lab data and in silico data to decipher the biology of NAFLD. The complex systems biology of NAFLD is explored by a multidisciplinary consortium of clinical and research groups having profound expertise in the fields of stem cells, pathology of chronic liver and metabolic disorders, development of a Biobank to support drug discovery, high-throughput sequencing, functional genomics, bioinformatics and systems biology. ODE-modeling refers to Ordinary Differential Equation-based modeling.
Materials and Methods
Patient Recruitment and Sample Collection
Starting in 2009, patients with morbid obesity were offered to participate in the Multidisciplinary Obesity Research (MORE) project at the Medical University of Graz, Austria. This study aims to take an interdisciplinary approach in research on obesity and related diseases like insulin resistance, liver steatosis and metabolic syndrome and includes the Institutes of Gastroenterology, Pathology, Surgery and Experimental Hepatology at the University Hospital of Graz. Patients with morbid obesity admitted into hospital for treatment by bariatric surgery (gastric banding, gastric bypass, sleeve gastrectomy) were invited to participate in the study and to sign the informed consent. In addition to obese patients we also included three healthy individuals in the study to obtain control dermal fibroblasts. If patients were admitted for bariatric surgery, samples of blood, skin and a liver biopsy were taken during the operation. The skin samples were immediately transported to the Institute of Pathology and fibroblast cultures were initiated. The liver biopsy was divided into one part for fixation and histology and a second part for liquid nitrogen storage while the blood sample was separated into mononuclear cells and plasma. Subsequently the disease phenotype characterization comprised detailed analysis of glucose (e.g., type 2 diabetes, insulin resistance) and lipid metabolism, hypertension, atherosclerosis, and histopathological evaluation of the liver biopsy. In addition, HOMA IR (homeostatic model assessment insulin resistance) was calculated for patients. The average normal-weight individual has an insulin resistance of 1, while for obese patients recruited for the study the HOMA IR index is within the range from 2.82 to 4.86, indicating the insulin resistance phenotype. Moreover, other diseases had to be excluded, and a detailed evaluation of the lifestyle (nutrition, physical activity and consumption of alcohol or drugs) was performed from the structured questionnaires and, where applicable, biomarkers and physical measurements.
Derivation of Dermal Fibroblast Cells from Patients
Primary fibroblasts were derived by standard tissue culture practice. In brief, the skin surface was sterilized with ethanol and subcutaneous fat was removed. The sample was divided into small pieces (2 mm × 2 mm) and each of these pieces was minced in a culture dish, supplemented with 1 mL of DMEM, 10% FCS with antibiotics, and covered with a sterile coverslip. After approximately 2 weeks skin fibroblasts started to grow out from the skin pieces and after approximately 4 weeks the fibroblasts were harvested and expanded.
Primary fibroblasts from two patients with steatosis (H0007, H0008) and a non-obese control (H0002) were established.
Protein Lysate Preparation
After washing with PBS two times cells were directly lysed in M-PER buffer (Pierce) with EDTA free complete inhibitors (Roche) and phosphostop (Roche). Lysates were immediately frozen at −80°C. Further samples were allowed to thaw on ice and incubated on a rotating shaker at 4°C for 20 min. To clear protein samples, lysates were centrifuged at maximum speed for 30 min at 4°C. The protein supernatant was collected and protein concentration was estimated using a micro BCA method (Smith et al., 1985).
Reverse Phase Protein Array
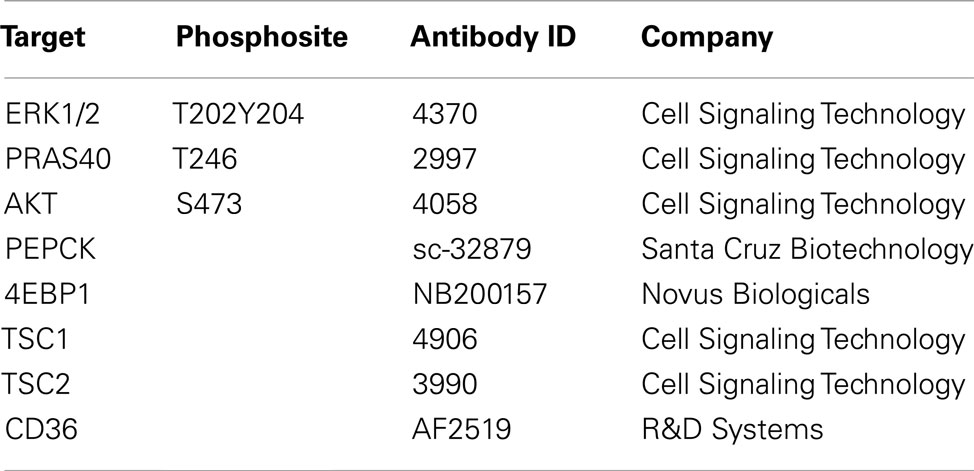
The method used in this study has been described previously (Loebke et al., 2007). For each sample four replicate spots were printed using the 2470 Arrayer (Aushon Biosystems, Billerica, USA). Slides not used immediately were kept a −20°C and rehydrated in PBS-Tween (0.05%). Blocking was carried out using Odyssey Blocking buffer (LI-COR, Lincoln, USA) diluted to 1:1 with PBS-Tween (0.05%) containing NaF and NaVO3 for 1h at room temperature. Next, slides were incubated with pre-validated antibodies (Table 1) at 1:300 dilutions in blocking buffer overnight at 4°C. Primary antibody detection was carried out with Alexa-680 labeled goat-anti-rabbit or goat-anti-mouse secondary antibodies and visualized using an Odyssey scanner (LI-COR, Lincoln, USA). Array images were analyzed and quantified using GenePix Pro 5.0 software (Molecular Devices, Ismaning, Germany). For on-slide protein quantification the total protein content of single spots was determined according to the FAST Green-FCF assay (Loebke et al., 2007).
Data Analysis of Reverse Phase Protein Arrays
Data analysis was performed using the software tool RPPanalyzer (Mannsperger et al., 2010) implemented in the statistical environment R. Arrays with signal intensities not significantly above blank readings as well as arrays without a linear correlation between signal intensity and protein concentration were not analyzed. Significance was calculated applying two-sample t-tests. Raw data was normalized for total protein content using FCF data as described before (Loebke et al., 2007). To obtain significantly regulated proteins, t-test statistics were applied. Three biological replicates and five technical replicates were tested and p-value was adjusted for multiple testing.
Transcriptome Analysis of Patient Specific Fibroblasts and Control
Gene expression analysis was performed using the Illumina HumanRef-8 v3 BeadChip. The bead-level data generated by the image scanner software were summarized and saved without background correction and normalization in the Illumina BeadStudio. Bead-summary data was analyzed via R/Bioconductor (Gentleman et al., 2004) and the lumi package (Du et al., 2008) starting with background subtraction, variance-stabilizing transformation and quantile normalization. Fibroblasts from two steatotic patients (H0007, H0008) were compared to control fibroblasts from a non-steatotic person (H0002). For each patient two replicates were hybridized. Differential expression was tested using Welch’s test and the moderated t-test from the limma (Smyth, 2004) package test in parallel. The list of significantly expressed genes was based on limmap, which represents the p-value from moderated t-test from limma-Package (limmap < 0.05) and the p-value from Welch’s test (t2p < 0.05). The Bioconductor package q-value (Storey, 2002) was employed to control the false discovery rate. Genes were considered differentially expressed when the Illumina detection p-value (judging significance of discrimination from the microarray image background) of at least one of the control or treatment group and the false discovery rate were usually 0.05.
Microarray data analysis was then performed on data grouped into the following combinations: steatosis patient H0007 vs. control, steatosis patient H0008 vs. control and steatosis patients H0007 and H0008 vs. control in order to identify the major markers and molecular read-outs as well as annotation of the functional networks that interconnect these markers. All original gene array files are available from the Gene Expression Omnibus (GEO) database1 accession number GSE37689.
Discovery of Pathways and Functional Modules through Network Analysis for the Development of Computational Models
Gene-set enrichment and over-representation analysis (ORA) was achieved utilizing the unique pathway database integration system ConsensusPathDB (Kamburov et al., 2009, 2011b) which is designed with a focus on human pathway and interaction data and integrates the content of most important pathway databases such as Reactome (Matthews et al., 2009; Croft et al., 2011), KEGG (Kanehisa et al., 2010), IntAct (Kerrien et al., 2007), DIP (Salwinski et al., 2004) as well as manually curated data resulting from experimental investigation or interaction data available in common pathway and systems biology file formats, such as SBML (Hucka et al., 2003), BioPAX (Demir et al., 2010), or PSI-MI (Hermjakob et al., 2004). The current content of the integration tool comprises more than 51,000 physical entities with more than 1,69,000 functional interactions. Pathway analysis with a daughter tool of ConsensusPathDB, IMPaLA (Kamburov et al., 2011a) has been used to identify pathways related to signaling and metabolism. In addition to over-represented pathways, also nearest neighborhood-based entity sets (NESTs) can be identified with ConsensusPathDB. NESTs are centered at a specific entity (gene, metabolite, etc.) and contain all direct interactions and interaction partners. Thus, NESTs can be viewed as unbiased (non-annotated) functional modules derived from the integrated network that can be used as gene sets for gene enrichment analyses as an alternative to curated pathways. NESTs can further be restricted with statistical graph-theoretical arguments, for example minimal connectivity, minimal degree, etc. Identified pathways and functional modules have been integrated in a prototype model related to disease development of steatosis and steatohepatitis.
Modeling Glutathione Synthesis and Metabolism Pathways
For this work an updated version of the glutathione model previously published was used (Reed et al., 2008; Geenen et al., 2012). The model is available for simulation at all three JWS Online (Olivier and Snoep, 2004) servers (e.g., http://jjj.mib.ac.uk/webMathematica/Examples/run.jsp?modelName=geenen). The modified model consists of the methionine cycle, glutathione synthesis and detoxification, ophthalmic acid synthesis, and the gamma-glutamyl cycle. We are more confident in the ability of this model to make quantitatively accurate predictions as this model was fitting on more experimental data (than the previous model) and is partially validated (Geenen et al., manuscript in preparation). However we have not validated the model for predicting the effect in changes in Vmax and therefore the predictions made here will offer limited certainty.
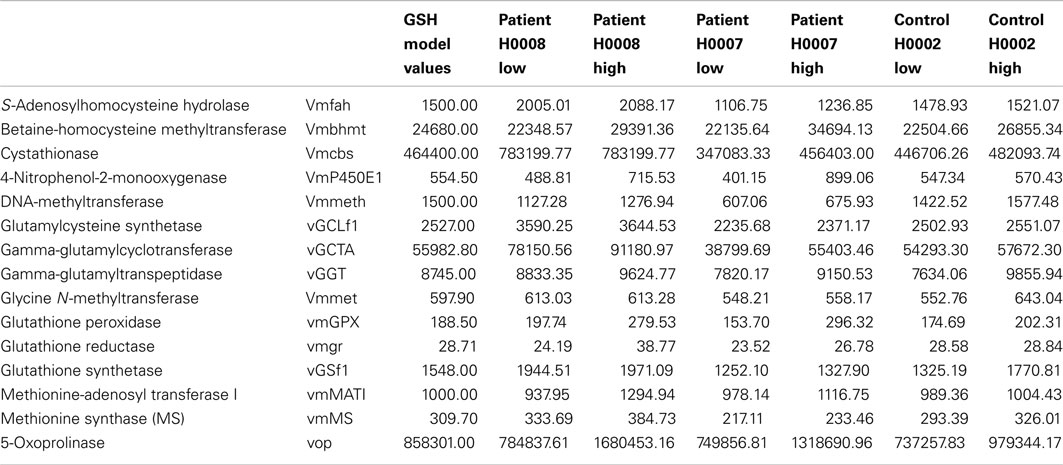
This model represents the control data set discussed in this study. The difference in expression between control (H0002) and steatosis (H0007, H0008) was first calculated and then used to calculate the Vmax for H0007 and H0008. In order to take account of the differences of expression within the repeats, the Vmax of all the repeats was calculated. This was then inputted into the model as a range of Vmax. The range of Vmax inputted into the model for the control model (H0002), patient H0007, and H0008 are presented in Table A1 in Appendix.
Similarly, a range of Vmaxs was also incorporated in the control model based on the range of expression data of the control patient. Three models were then analyzed: the control (H0002) model, H0007, and H0008. In order to calculate the fluxes/concentrations of the model, the model selected a Vmax value for each enzyme within the new calculated range and the steady state was calculated. This was repeated 5,00,000 times using Condor-COPASI2 (Hoops et al., 2006). This resulted in 5,00,000 different steady states due to the different combinations of Vmax values randomly chosen by COPASI. The average and standard deviation (SD) of flux/concentration was calculated from this data.
Results
Pathomorphological Assessment of Patient’s Phenotype
Pathomorphological assessment of the histology of the liver biopsies (Figure 2) allowed to select three patients with high grade steatosis (>30% steatosis, BMI 44 ± 3) and three patients with low grade steatosis (0–10% steatosis, BMI 42 ± 7) with similar BMI. These samples are supplemented by three control samples from healthy individuals. The number of samples is still small so sample acquisition is ongoing. The scheme in Figure 3 depicts the overall strategy for accomplishing our aims.
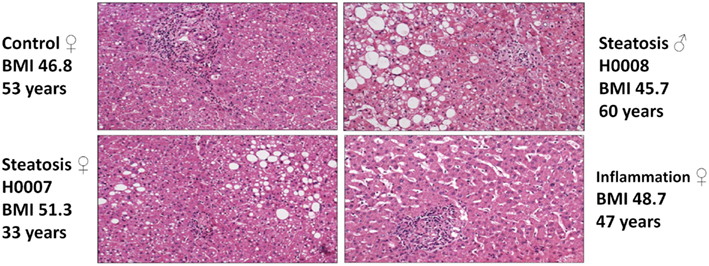
Figure 2. Hematoxylin-Eosin stained sections of liver biopsies from the four patients enrolled in the study (top: control (left), steatosis (H0008, right); bottom: steatosis (H0007, left), sinusoidal dilatation and inflammation (right).
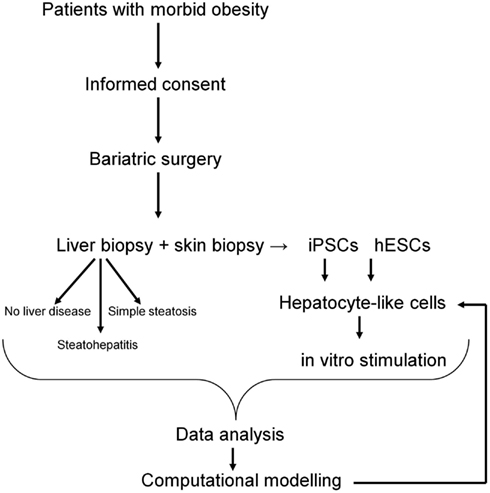
Figure 3. Workflow of patients recruitment, sample collection, and downstream analyses. The computational model of NAFLD will be generated based on hepatocyte-like cells challenged with “environmental” conditions typical for NAFLD. Data obtained from in vitro studies will be compared with data from liver biopsies and further validated in vitro on hepatocyte-like cells.
iPS Cell-Based Derivation of an in vitro Disease Model of Steatosis
Retroviruses encoding the reprogramming factors, OCT4, SOX2, KLF4, and c-MYC were transduced into fibroblasts cells from patient with steatosis (H0008) and control (H0002) using well established protocols (Takahashi et al., 2007; Wolfrum et al., 2010). These iPS lines express the embryonic stem cell specific markers, NANOG, SOX2, OCT4, SSEA4, TRA-1-60, and TRA-1-81 (Figure 4).
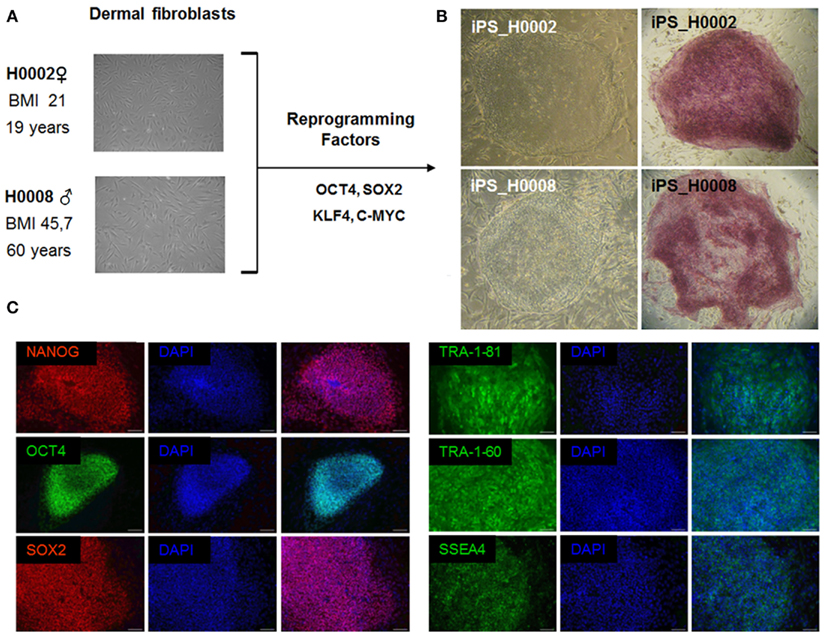
Figure 4. The patient-specific fibroblasts were transduced with the ES cell specific transcription factors OCT4, SOX2, KLF4, and c-MYC. Then grown on MEFs in ES cell culture medium. After 3 weeks flat ES-like colonies were observed and picked mechanically. (A) Phase contrast images of dermal fibroblasts derived from skin biopsies of steatosis patient (H0008) and control individual (H0002). (B) Phase contrast images of iPS cells derived from dermal fibroblasts and staining of alkaline phosphatase which is a marker associated with undifferentiated pluripotent stem cells. (C) Characterization of iPS cells. iPS cells express the crucial pluripotency-associated transcription factors NANOG, OCT4, SOX2 as well as cell surface markers TRA-1-81, TRA-1-60, and SSEA4. Scale bar = 100 μm.
Comparative Transcriptional Analysis of Dermal Fibroblasts Derived from Steatotic Patients (H0007 and H0008) and Healthy Individual Serving as Control (H0002).
The transcriptomes of dermal fibroblasts derived from two patients with steatosis [60 year, male BMI 45.7 (H0008) and 33 year, female, BMI 51.3 (H0007)] and control fibroblasts [19 year, female, BMI 21 (H0002)] were analyzed. The clustering of the respective transcriptomes is shown in Figure 5A, the correlation co-efficient ranged from 0.92 to 0.96.
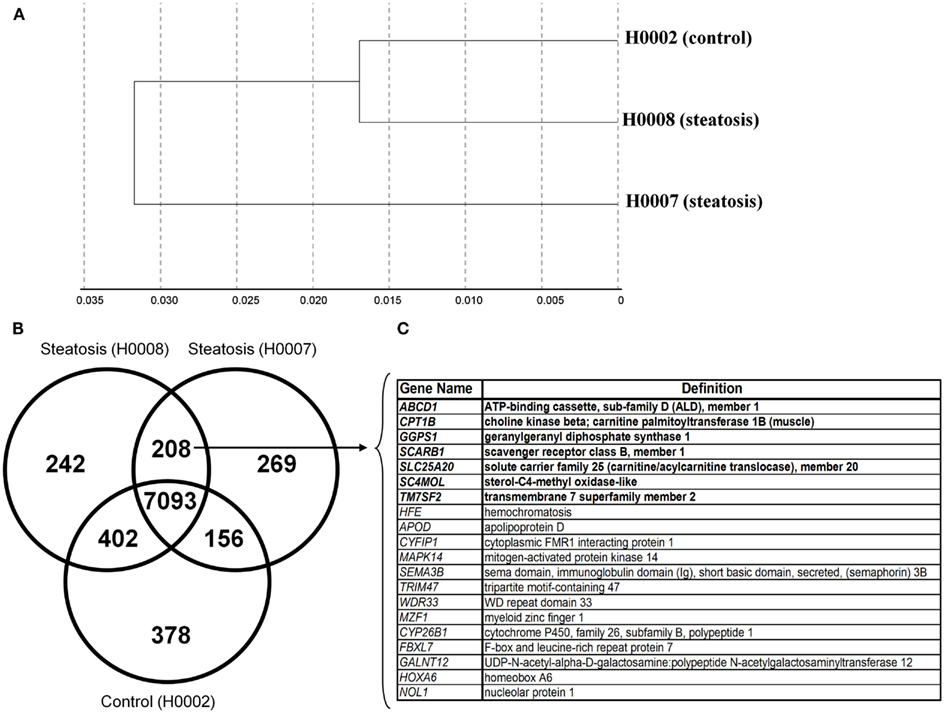
Figure 5. Comparative transcriptional analysis of dermal fibroblasts from steatotic patients (H0007 and H0008) and healthy individual (H0002). (A) The clustering of respective transcriptomes. (B) The Venn diagram illustrating the distinct and overlapping genes. (C) List of 20 genes expressed in both patient-derived fibroblasts. Seven genes involved in metabolism of lipids and lipoproteins (highlighted in bold).
First we considered all genes expressed (detection p-value < 0.01) in steatotic (H0007, H0008) and control (H0002) fibroblasts. The Venn diagram in Figure 5B illustrates that there are 208 genes exclusively expressed in fibroblasts from patients with steatosis. Several examples of overlapping genes (including seven genes involved in metabolism of lipids and lipoproteins, highlighted in bold) are presented in Figure 5C. The complete list of 208 overlapping genes is provided in Table 2, amongst this list are genes (represented as CORFs, FLJs, and LOCs) of unknown function and therefore considered as novel steatosis-associated genes.
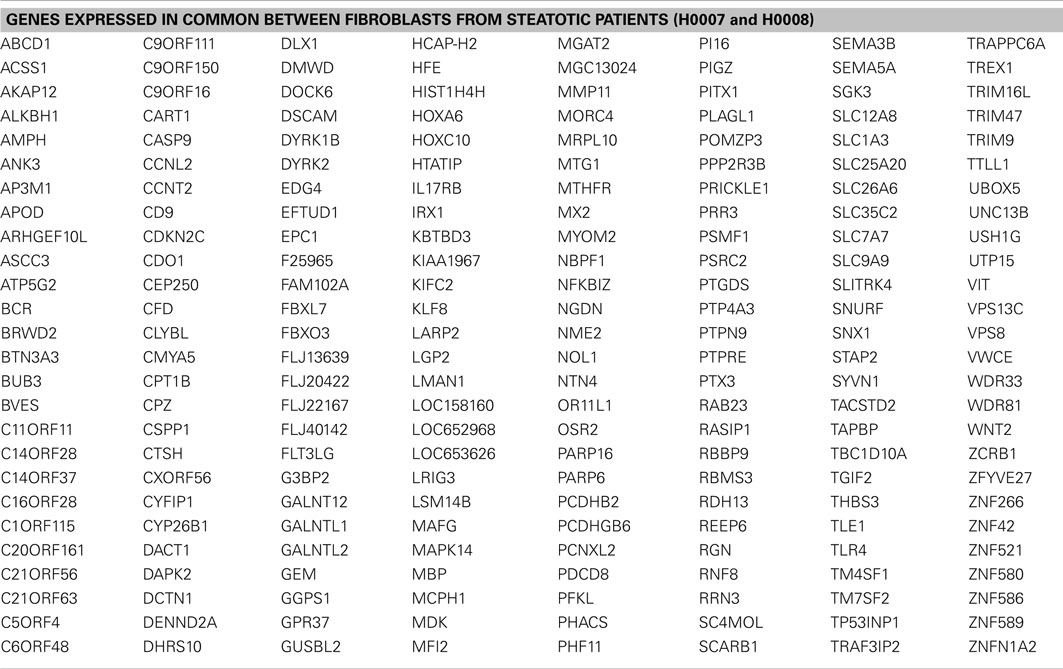
Table 2. List of 208 genes expressed in common between fibroblasts derived from two steatotic patients.
Target and Pathway Identification, Annotation and Computational Modeling
In order to assess whether the differentially expressed genes in steatosis patients (H0007 and H0008) compared to control (H0002) are enriched with respect to specific pathways, ORA was carried out with ConsensusPathDB. Using the hypergeometric test statistic of ConsensusPathDB on genes that are differentially expressed in the patients we were able to assign each pathway a p-value reflecting the occurrence of candidate genes for steatosis. ORA revealed top ranked pathways related to DNA replication (patient H0007, p-value = 3.22e−8; patient H0008, p-value = 2.95e−6) and cell cycle (patient H0007, p-value = 1.05e−6; patient H0008, p-value = 3.22e−8). Furthermore, ORA suggests that members of the NEST set related to glutathione metabolism (patient H0007, p-value = 0.0127; patient H0008, p-value = 5.61e−5) show jointly significant increase in transcription levels in steatosis patients. The NEST analysis is based on the genes glutathione S-transferase A4 (GSTA4), glutathione S-transferase theta-1 (GSTT1), and glutathione S-transferase mu 1 and 2 (GSTM1, GSTM1), which were identified as parts of the glutathione metabolism pathway, and the analysis identified a NEST gene-set that is centered around cytochrome CYP4F22 (p-value = 8.67e−11, Figure 6). The gene CYP4F22, encodes a member of the cytochrome P450 superfamily of enzymes. Cytochrome P450 proteins are mono-oxygenases which catalyze many reactions involved in drug metabolism and synthesis of cholesterol, steroids, and lipids. The gene GSTA4, which is found to be up-regulated in the fibroblasts of the two steatosis patients, catalyzes the reaction of reduced glutathione to 4-hydroxynonenal, a product which is considered as a marker for oxidative damage in tissue. Furthermore, GSTM1 and GSTM2 that are found to be up-regulated in the fibroblasts of the two steatosis patients are known to be induced by oxidative stress. Moreover, glutathione peroxidase 4 (GPX4) is up-regulated in the steatosis patients and catalyzes the formation of the oxidized form of glutathione (glutathione disulfide, GSSG) from glutathione (GSH). GPX4 is the only antioxidant enzyme known to directly reduce phospholipid hydroperoxides within membranes and lipoproteins, acting in conjunction with alpha-tocopherol to inhibit lipid peroxidation (Sneddon et al., 2003). In contrast to GSTM2, GSTM1, GSTA4, and GPX4 which are up-regulated in the steatosis patients, GSTT1 is found to be down-regulated. GSTT1 is known to be transcriptionally regulated by C/EBP-alpha which is considered to be critical for glucose and lipid homeostasis in adult mice (Inoue et al., 2004).
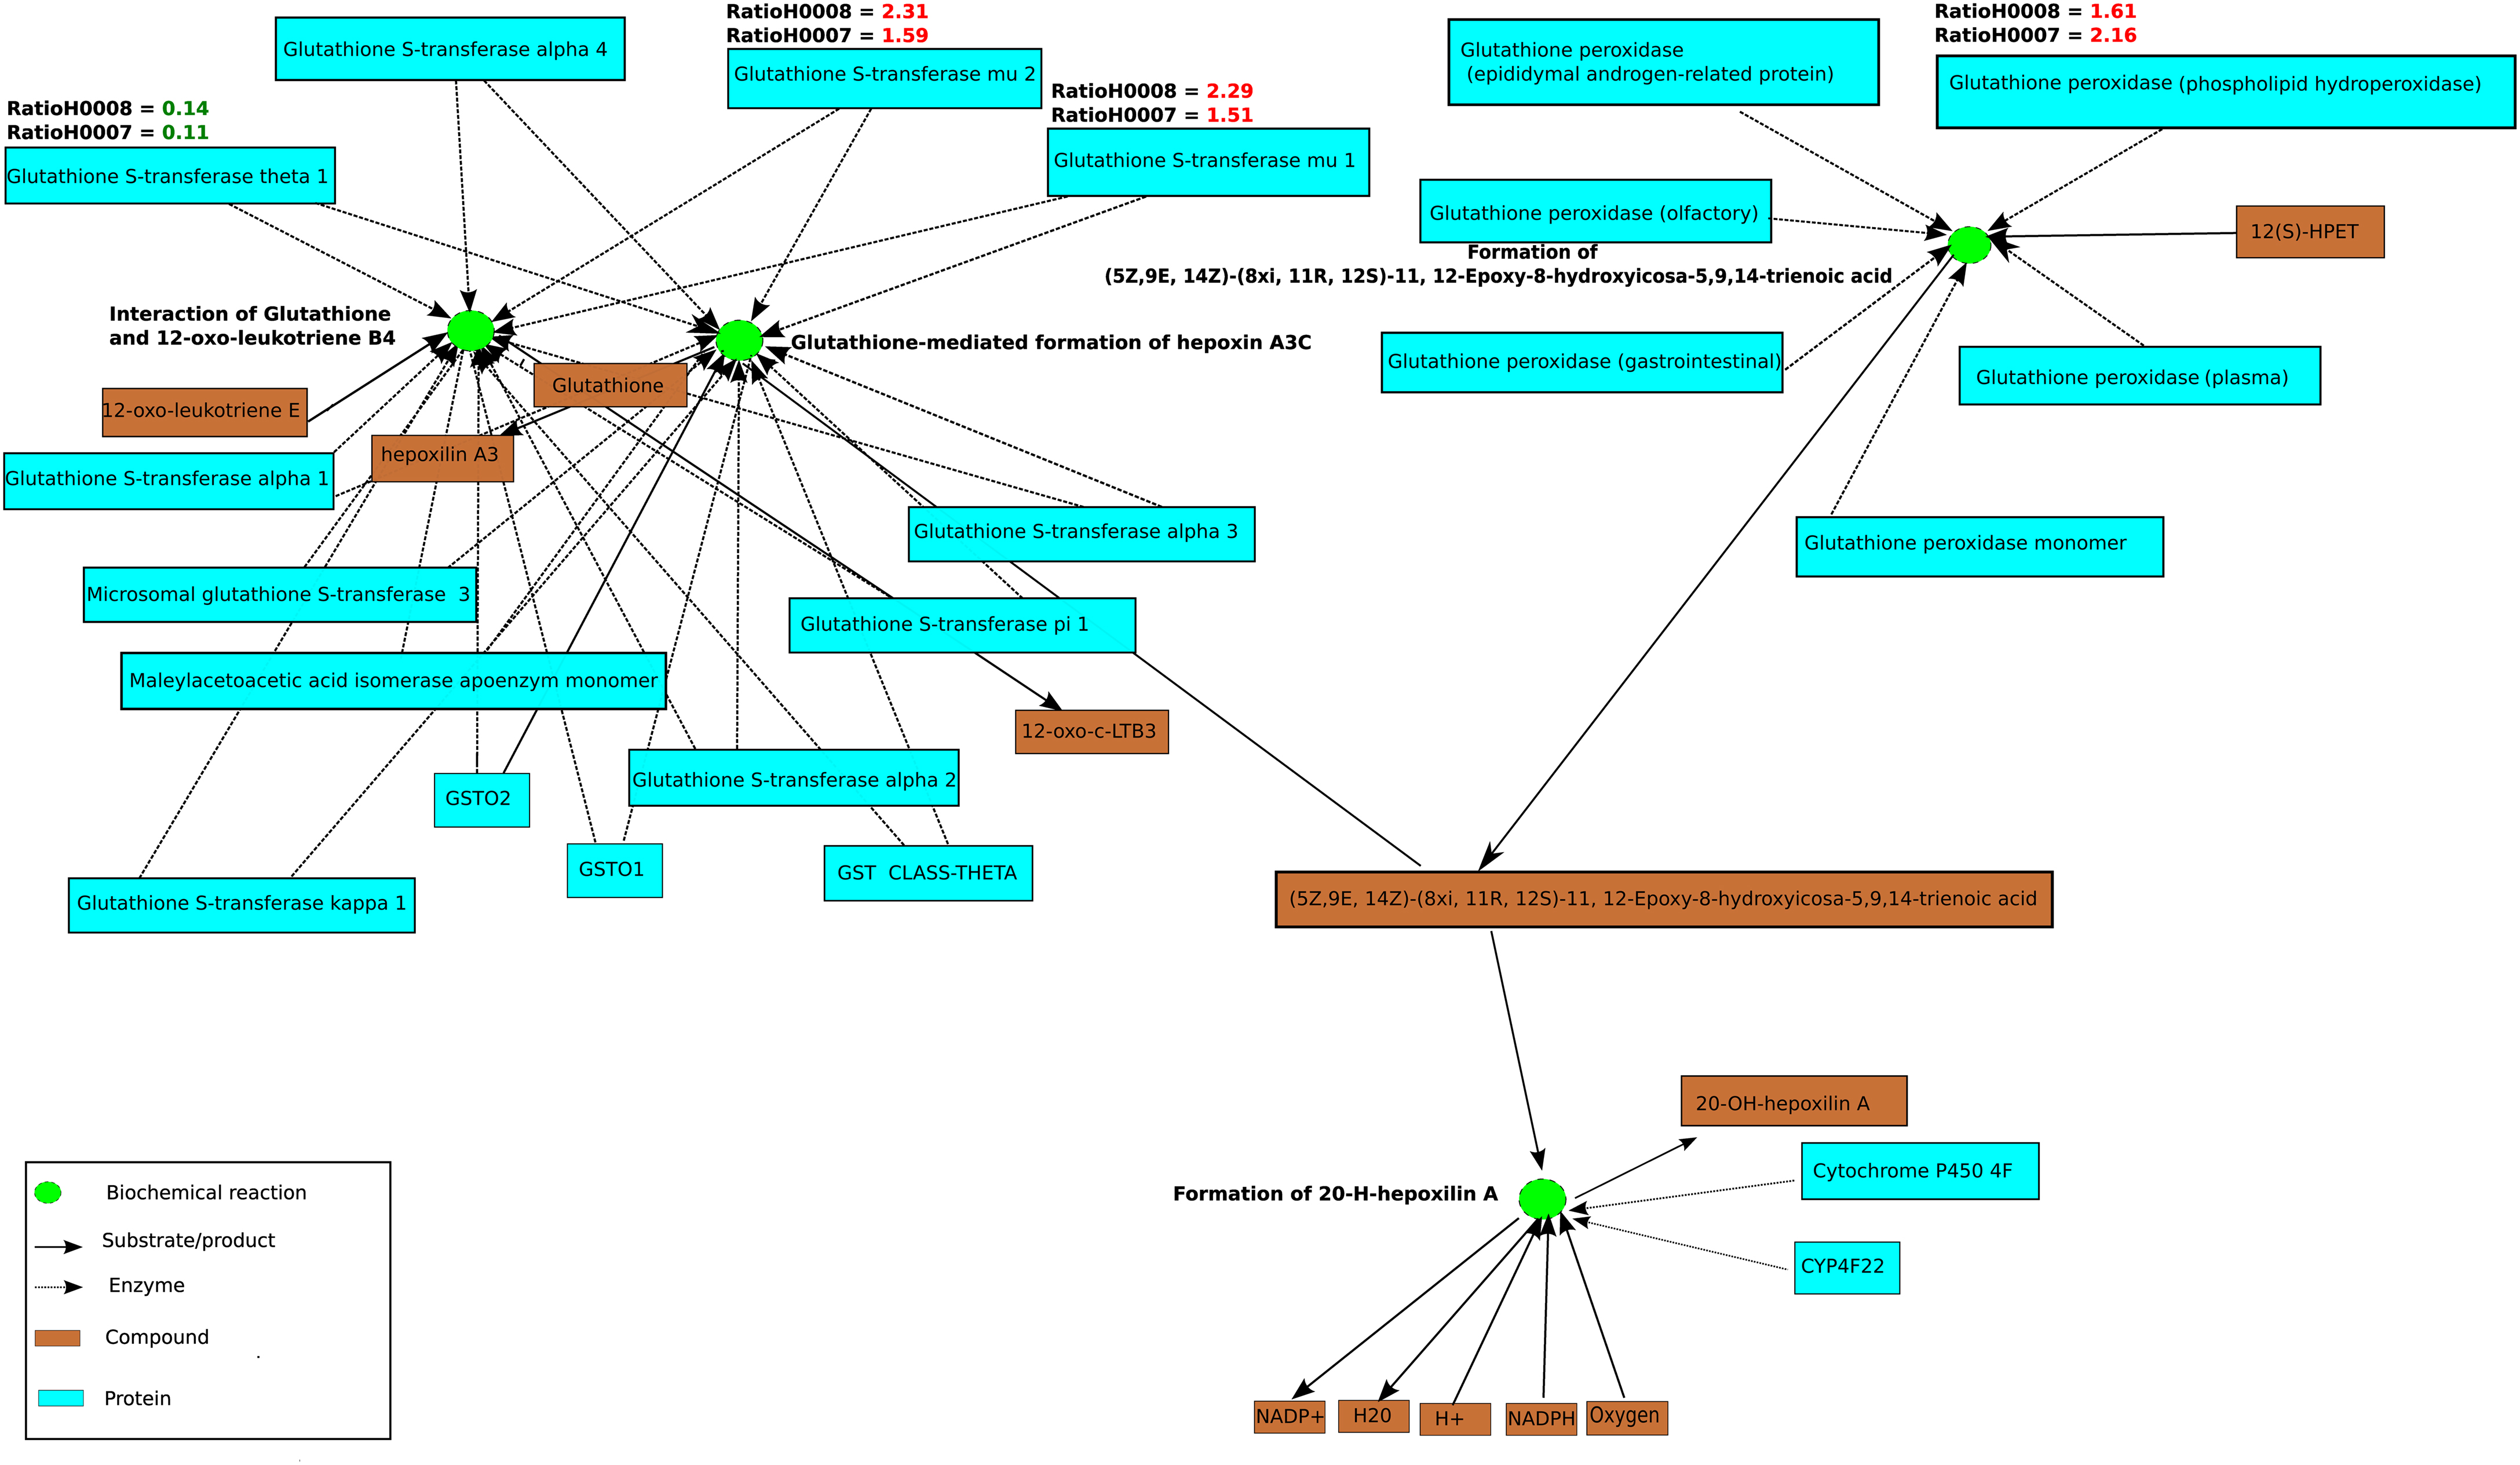
Figure 6. A functional interaction sub-network visualized by ConsensusPathDB’s network visualization framework. This sub-network defines the neighborhood-based entity set of genes playing a role in glutathione metabolism centered by cytochrome P450. The sub-network consists of 25 biochemical interactions (green circles), compounds, and metabolites are illustrated as light brown rectangles. Beyond the proteins that are visualized as light blue rectangles are the enzyme encoding genes GSTT1, GSTM2, GSTM1, and GPX4 which are differentially regulated in patients H0007 and H0008 in comparison to the control, H0002. Ratios of GPX4, GSTM2, GSTT1, GSTM1, and GSTA4 are also highlighted in red (up-regulation) or green (down-regulation). Four interactions from the KEGG Database are illustrated in this figure.
Free Fatty Acids Induced de novo Lipid Synthesis by Activation of Nuclear Receptors SREBF1 and PPARG
Figure 11 depicts a minimal model of steatosis based on the patients transcriptome and associated pathways. The genes LPIN and LDLR which encode lipin and low density lipoprotein receptor (LDLR), respectively, are downstream targets of SREBF1 (Fajas et al., 1999) and are up-regulated in both steatosis patients. SREBF1 encodes a transcription factor that binds to the sterol regulatory element-1 (SRE1), which is a decamer flanking, e.g., the LDL receptor gene (LDLR) and other genes involved in sterol biosynthesis. In addition to the transcriptional activation of LPIN and LDLR, Fajas et al. reported that SREBF1 regulates the expression of PPARG during adipocytes differentiation. Ishimoto et al. (2009) demonstrated that the transcription of LPIN1 is mediated by SREBF1 and nuclear factor Y (NF-Y) and has been identified to be regulated by cellular sterols, which play an important role in lipid metabolism. LPIN1 is involved in glycerolipid biosynthesis and catalyzes the synthesis of diacylglycerol (DAG).
In addition, SREBF1 regulates the expression of the gene PPARG that encodes the peroxisome proliferator-activated receptor gamma which is a regulator of adipocyte differentiation. PPARG has been implicated in the pathology of numerous diseases including obesity, diabetes, atherosclerosis, and cancer. PPARs can form heterodimers with retinoid X receptors (RXRs) regulating the transcription of genes encoding lipid droplet (LD) proteins such as PLIN1, PLIN2, PLIN3, PLIN5, FSP27, and HIG2, known to be expressed in steatotic liver. LD proteins play a role in the pathophysiology of fatty liver disease where hepatocytes enriched with LD proteins contain vast amounts of lipids.
Targeted Proteomics Using Reverse Phase Protein Arrays
Reverse phase protein arrays (RPPA) were used to analyze protein extracts derived from skin fibroblast cell lines obtained from two steatosis patients (H0007, H0008) and from a healthy lean control (H0002). In detail, the expression level of 109 proteins and phosphoproteins was quantified and several target proteins as well as phosphoproteins were identified as differentially regulated. For example, phosphorylation levels of major signaling proteins such as AKT, PRAS40, p70S6K (T389), ERK1/2 were strongly and significantly reduced in both patient-derived fibroblast cell lines whereas expression and phosphorylation of insulin receptor beta (IRβ) and its key adaptor protein IRS1 were comparable in control cells.
In animal models of diabetes as well as in human type 2 diabetes, a down-regulation of AKT/mTOR signaling indicates impaired insulin signaling (Sesti et al., 2001). Likewise, reduced p70S6K1 (T389) phosphorylation in response to insulin was previously reported as a characteristic feature of adipocytes obtained from patients with type 2 diabetes (Ost et al., 2010). This suggests that at the level of AKT/mTOR signaling, fibroblast cells obtained from steatosis patients phenocopy features of insulin resistance.
However, while animal models of insulin resistance suggest increased ERK signaling as well as an increased phosphorylation of IRS1 on its key activation site S632 (corresponding to S636 in human IRS1; Bouzakri et al., 2003), a significant down-regulation of phosphorylated ERK was observed for both patient-derived fibroblast cell lines. Patient H0008 cells revealed also decreased levels of IRS S636 (Figure 7). Thus, at the level of ERK signaling, notable differences exist between features characteristic for animal models of diabetes and fibroblast cells derived from steatosis patients.
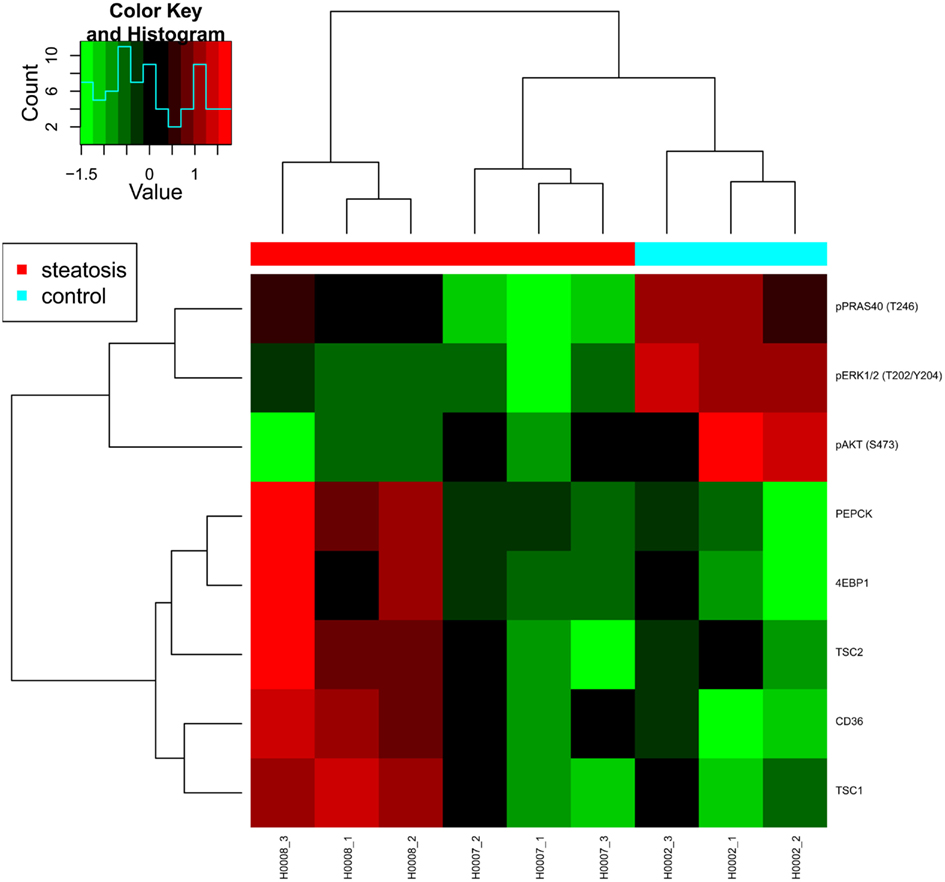
Figure 7. Heat map presenting differentially expressed proteins. Proteomic profiling was carried out for samples provided by the consortium such as fibroblasts from two patients with steatosis (H0007, H0008) and a non-obese control (H0002).
The fatty acid translocase CD36 was up-regulated at the protein level in both steatosis patient samples although only significantly in cells derived from patient H0008, thus suggesting an increased uptake of lipids in steatosis patients. An up-regulation of CD36 in liver cells has also been associated with insulin resistance (Miquilena-Colina et al., 2011). Furthermore, fibroblasts from patient H0008 showed elevated expression of phosphoenolpyruvate carboxykinase 2 (PEPCK), a major enzyme of gluconeogenesis. Up-regulation of PEPCK and CD36 was previously reported to occur after inhibition of mTOR signaling by rapamycin (Houde et al., 2010) which is mimicked by the up-regulation of mTOR inhibitor proteins TSC1 and TSC2 in fibroblast cells derived from patient H0008. In conclusion, our data indicate impaired AKT/mTOR signaling exists in fibroblast cells derived from steatosis patients and that numerous features typical for diabetes type 2 were also observed in steatosis patients. Thus, molecular features of insulin resistance are present in skin fibroblasts of steatosis patients.
However, the question how other signaling pathways such as those mediated by ERK and PKCα contribute to the insulin-resistant phenotype and how this impacts on phosphorylation of IRS1 as key regulator of insulin responsiveness remains to be elucidated. Targeted proteomics carried out on larger numbers of human steatosis samples will certainly provide a meaningful contribution to the ongoing debate on molecular mechanisms that are causative for insulin resistance and thus also identify points for clinical intervention contributing to personalized therapies of steatosis patients.
Modeling the Glutathione Synthesis Pathways in Dermal Fibroblasts from Steatosis and Control
Preliminary investigation involved analysis of the transcriptome profiles, Gene Ontology (GO) ORA and KEGG pathway analysis, which selected for the implementation of a kinetic model for glutathione synthesis and metabolism (updated from the previous model published by Geenen et al., 2012). In H0007 vs. control (H0002), enrichment of filtered gene lists was observed in the following pathways: glutathione metabolism, metabolism of xenobiotics by cytochrome P450, and specifically drug metabolism by cytochrome P450. Similarly, in H0008 vs. control (H0002), enrichment of filtered genes was observed in the aforementioned pathways but also the TGF-β signaling pathway. Combining data sets from both patients selected for the glutathione synthesis and metabolism pathways to be of interest, forming the basis for the construction/implementation of a kinetic model.
Glutathione Pathway
Our hypothesis was that the flux through the glutathione pathway of the steatosis patients would be higher due to the steatosis grade (as determined from histology). We acknowledge clinical projects are often challenged with unbiased sample numbers, so we compared each patient data with control independently.
The flux through glutathione synthetase (final step in glutathione synthesis) was observed to be higher in H0008 than control. The flux through glutathione synthetase was not significantly different between H0007 and control. The flux through glutamylcysteine synthetase (second to last step in glutathione synthesis) was higher in H0008 than in the control. The average concentration of glutathione was higher in H0008 compared to control but lower in H0007 than in control (Figure 8). We then used the model to investigate the reason for this change in glutathione level, i.e., explain the higher glutathione concentration by higher flux through glutathione synthesis pathway. To understand the decrease in glutathione concentration (even though flux through glutathione synthesis seems to be unchanged) we investigated the rate of degradation of glutathione. The increase in expression of glutathione peroxidase led to an increase in the flux through reaction in the model compared to control, which may be a possible explanation for this decrease.
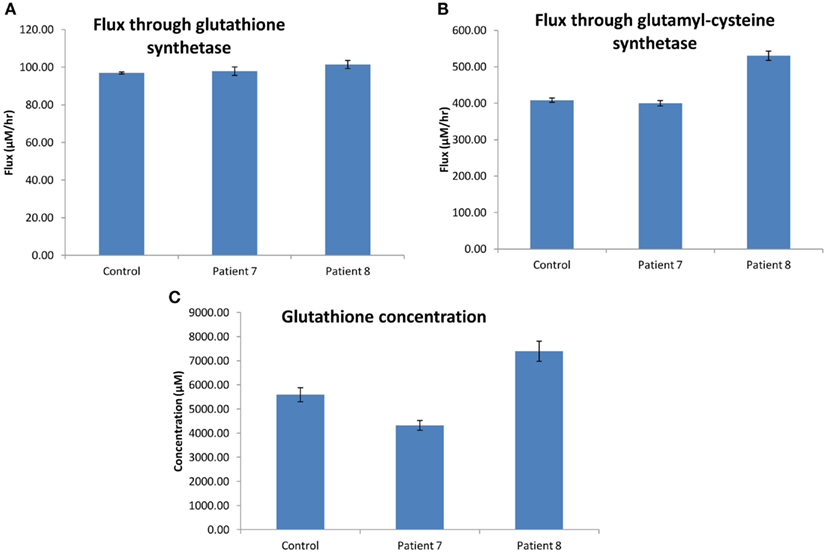
Figure 8. Glutathione synthesis pathways in dermal fibroblasts from patients with steatosis and control. (A) The average flux through glutathione synthetase (the final step in glutathione synthesis). (B) The average flux through glutamylcysteine synthetase (the second to last step in glutathione synthesis). (C) The average concentration of glutathione. Error bars are SD.
Correlation between Change in flux and Change in Vmax
One of the assumptions of analyzing expression data was that a change in mRNA expression is correlated to changes in the pathway flux/behavior. The advantage of combining the mRNA expression data to the kinetic model would be to investigate how a change in expression might affect flux (we now assume that a change in mRNA is equal to a change in Vmax). To see whether the model predicts different effects on the pathway flux/behavior compared to using the mRNA data alone, we investigated whether there is a correlation between change in the Vmax and change in the flux through the pathway. To test this we investigated two enzymes/reactions which had the largest change in expression; 5-oxoprolinase and DNA (cytosine-5-)-methyltransferase 1 and then one with smaller changes of expression; glutathione synthetase.
The expression of 5-oxoprolinase was 1.86 times higher in H0008 than control (H0002). The increase in flux though 5-oxoprolinase (v27 in model; Geenen et al., 2012; corresponding enzyme/reaction) was 1.64 (Figure 9A) implying there is a good correlation between flux and change in Vmax. Figure 9A shows that an increase of flux of 1.86 times lies within the error bars of the flux predicted for H0008. DNA (cytosine-5-)-methyltransferase 1 was 2.33 times lower in H0007 than in control. The decrease of flux through v11 was 1.79 times lower implying when compared to 5-oxoprolinase, here the correlation between flux and change in Vmax was not as good (Figure 9B). The glutathione synthetase expression data showed that H0008 had 1.26 times higher expression, and H0007 had 1.2 times lower expression than control. The flux showed that H0008 had a 1.05 times higher flux and H0007 had a 1.01 times higher flux (Figure 9C). This led to a poor correlation between flux and Vmax. The insertion of the expression data into a kinetic model of the glutathione pathway allowed us to predict what the effect of expression changes might be on pathway flux. The results suggest that H0008 could have a significant increase in the flux through glutathione synthesis as both gamma-glutamylcysteine synthetase and glutathione synthetase have an increased flux through them. A significant change in flux through glutathione synthesis of H0007 was not observed. Through this model, we have shown that a good correlation between change in flux and change in Vmax may not always be the case. This suggests adopting systems-based approaches (modeling approaches) have an advantage over analyzing mRNA expression data alone to synthesize information.
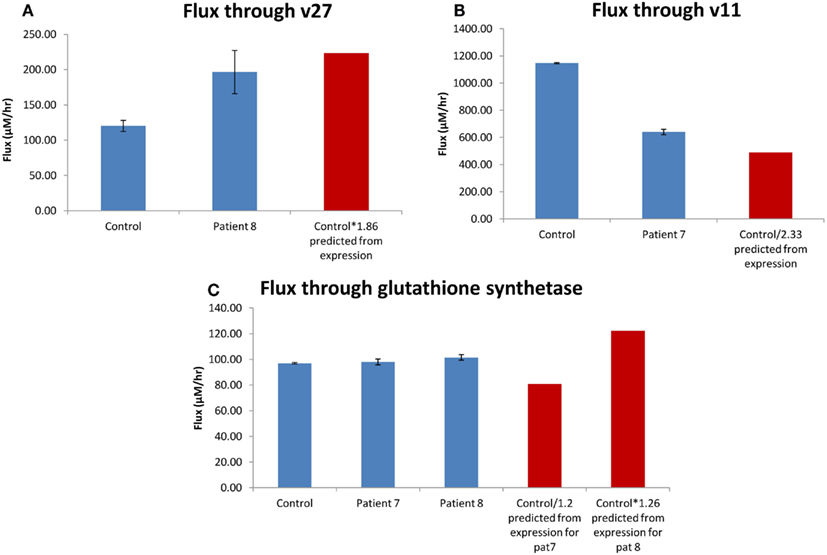
Figure 9. Correlation between change in flux and change in Vmax. (A) The average flux through oxoprolinase (v27) for the patient with steatosis (H0008) and control. (B) The average flux through DNA (cytosine-5-)-methyltransferase (v11) for the patient with steatosis (H0007) and control. (C) The average flux through glutathione synthetase. The red bar is the predicted value of flux based on mRNA expression. Error bars on model predicted changes in flux are SD.
Data Integration and Management
The principle of the livSYSiPS data management platform is to provide a user-friendly interface without superficial elements catering for easy access and exploitation of project data following the model of popular search engines in the World Wide Web. Requirements for the data management system of project livSYSiPS were analyzed taking into account dedicated use cases. Data formats generated in the experiments were assessed to find appropriate metadata models and standard data formats facilitating good representations of experiments in their systems biologic environment.
The Data Integration Platform for Systems Biology Co-operations (DIPSBC; Dreher et al., 2012) which was developed at the Max Planck Institute for Molecular Genetics in Berlin was adapted for the livSYSiPS project at the Charité, Berlin. The DIPSBC is based on wiki technique and the solr search server from the Apache open source project. Wiki and solr platform are brought together via a dedicated solrSearch plugin. The user interface – emphasizing the central search box – is intended to provide clear and easy-to-use access to project data and manifold representations and visualizations of it (Figure 10). In addition to the search engine interface a navigation bar on the front page links directly to the most prominent categories of data. The DIPSBC uses metadata defined via XML descriptions of data. The use of XML as metadata promotes the use of standard formats which are crucial for data sharing. Schema definitions for formats from the Minimum Information for Biological and Biomedical Investigations (MIBBI; Taylor et al., 2008) recommendations have been implemented, e.g., for Minimum Information About a Microarray Experiments (MIAME; Brazma et al., 2001). Systems biology resources, e.g., BioModels (Li et al., 2010a), Kyoto Encyclopedia of genes and genomes (KEGG; Kanehisa et al., 2010), and the ConsensusPathDB (Kamburov et al., 2011b) have been integrated. In a typical application, KEGG pathways enriched in the experimental data can be explored. The system provides statistical parameters for the dedicated tests and a prediction for activation or inhibition via the Bioconductor SPIA package (Tarca et al., 2009). Independent of the significance of the pathway as whole, differentially expressed genes can be visualized in the KEGG pathway chart. The repository allows direct access to raw data and processed data. The livSYSiPS data management is integrated into the system ERASysBio+ SEEK which provides a supervising data management platform for multiple transnational systems biology research projects. The site protected livSYSiPS webpage can be found at the following link: http://sheldon.charite.de/foswiki/bin/view/LIVSYSIPS/WebHome
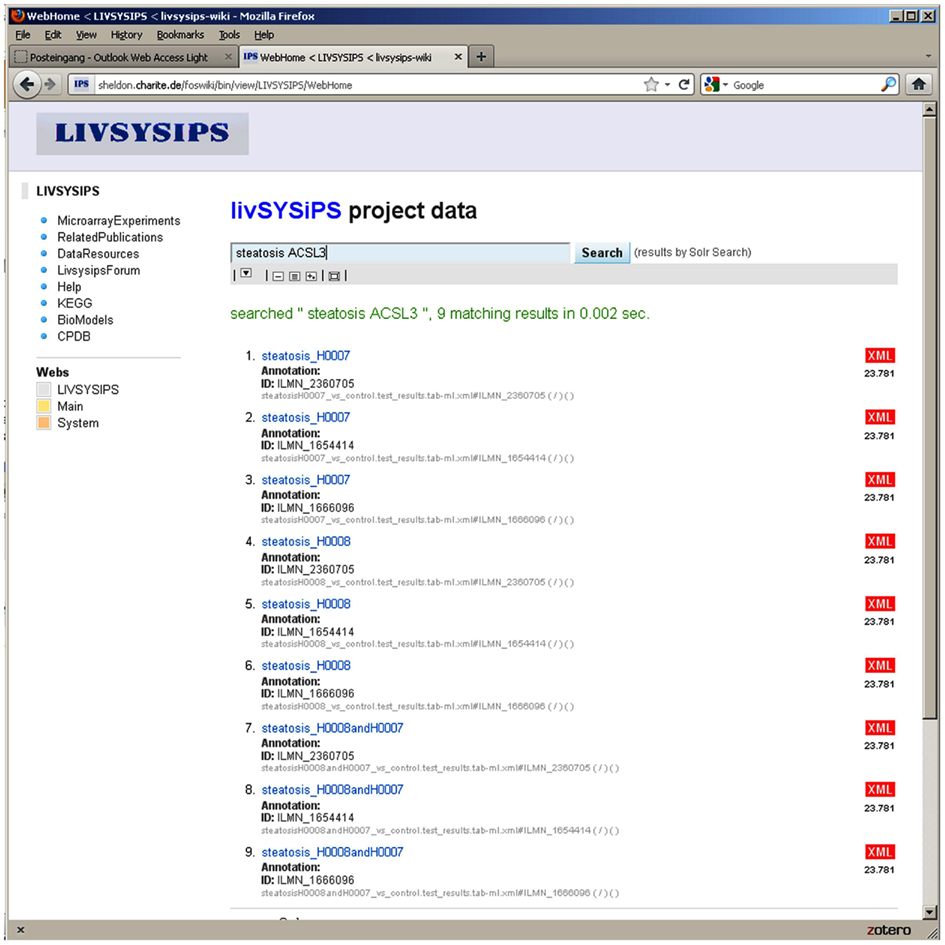
Figure 10. The user interface of the livSYSiPS data management system provides clear and easy-to-use access to project related data via the central search box and direct links to relevant data categories, e.g., the KEGG link on the left navigation bar addressing pathway analysis results of experimental data. Shown here are search results for experimental data of steatosis patients focusing on the gene ACSL3 (long-chain acyl-CoA synthetase) which plays an important role in the fatty acid metabolism pathway. Search results link to follow-up representations and visualizations of models and data.
The site will be available to the general public at the end of the project. For intra-project communication a user forum has been set up which is used for, e.g., exchanging minutes of meetings, slides of talks, etc. and most importantly enables web discussions about project related issues.
The following datasets have so far been incorporated into the database:
I. Microarray-based transcriptome data pertaining to the differentiation of healthy human embryonic stem cells and induced pluripotent stem cells into hepatocyte-like cells (Jozefczuk et al., 2011).
II. Transcriptome data of fibroblasts derived from patients with steatosis (H0007, H0008) and control (H0002).
III. Microarray-based transcriptome data of human hepatocellular xenograft models (Kashofer et al., 2009).
IV. Reverse Phase Protein Array data.
V. Systems biology models from the BioModels database.
VI. Consensus pathway data integrating multiple pathway databases from ConsensusPathDB.
Discussion
The current data sets though limited have provided valuable preliminary data pertaining to the etiology of steatosis and have provided the foundation for a more extended analysis based on an extensive collection of liver biopsies, serum, and dermal fibroblast from patients with distinct grades of disease progression.
The transcriptome, proteome, and modeling data obtained from fibroblasts derived from patients with steatosis (H0007, H0008) and control (H0002) has unveiled the following novel results.
The ribosomal protein PRAS40, abundant in steatosis patients has been identified as a crucial regulator of insulin signaling and also as mediator of AKT signals to mTOR (Vander Haar et al., 2007). Furthermore, it has been shown that PRAS40 phosphorylation is decreased under insulin-resistant conditions (Nascimento et al., 2006). Therefore, reduced AKT/mTOR signaling of skin fibroblasts derived from steatosis patients has revealed that the insulin-resistant phenotype is present not only in insulin-metabolizing central organs, e.g., the liver of steatosis patients, but is also manifested in skin fibroblasts derived from these patients.
Our results imply a down-regulation of mTOR under insulin-resistant conditions. However, different correlations between mTOR activity and insulin resistance in animal models (Wang et al., 2010; Medeiros et al., 2011) and humans (Ost et al., 2010; Pereira et al., 2012) is still a matter of an ongoing discussion. In several studies on animals with insulin resistance induced by high-fat diet, activation of mTOR has been observed (Um et al., 2004, 2006; Khamzina et al., 2005).
Network analysis of expression data of steatosis samples vs. control employing tools such as DAVID, ConsensusPathDB, and IMPaLA has revealed several pathways and functional modules of the disease like glutathione metabolism. Based on these pathways and modules a first model prototype of steatosis related processes has been developed employing the modeling and simulation system PyBioS3 (Wierling et al., 2007). PyBioS has an integrated interface to the ConsensusPathDB facilitating the semi-automatic development of annotated models integrating signaling pathways, metabolic reactions and gene-regulatory processes.
The model prototype which is implemented in PyBioS (see text footnote 3) is based on a minimal network comprising a regulatory network based on the transcription factor SREBF1, linked to a metabolic network of glycerolipid and fatty acid biosynthesis including the downstream transcriptional targets of SREBF1, LIPIN1 (LPIN), and LDLR (Figure 11). The increased expression of LPIN1 in patients with steatosis, together with the fatty acid-induced translocation of LPIN1 to the endoplasmic reticulum, facilitates increased triacylglycerol synthesis. In addition, Ide et al. (2004) reported a link between SREBF1 and insulin signaling as SREBF1 is shown to directly repress the transcription of IRS-2 and inhibit hepatic insulin signaling.
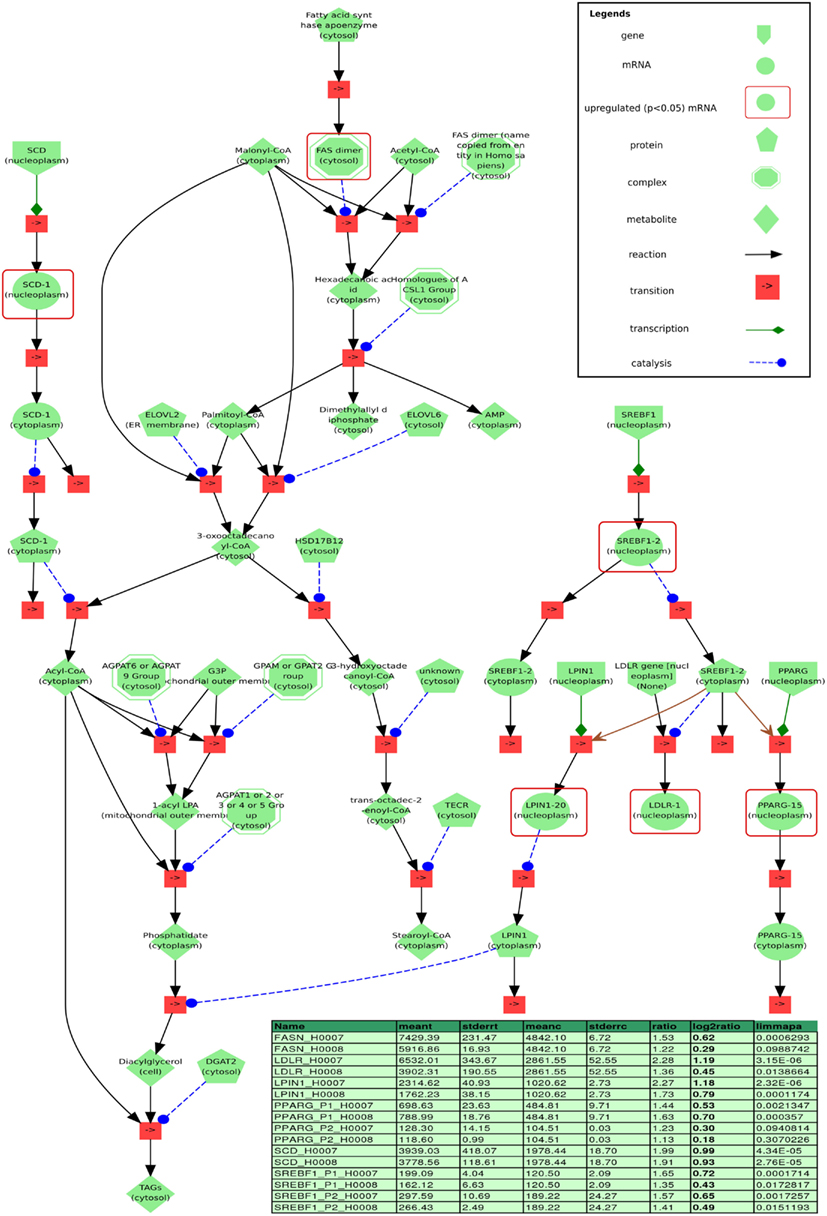
Figure 11. Visualization of a minimal model of processes found to be related to steatosis based on our data, implemented in the modeling and simulation system PyBioS. Differentially expressed genes (limmapa < 0.05) of the steatosis patients H0007 and H0008 vs. control H0002 are highlighted by red frames. Two major components of the model that have been identified by expression analysis are the transcription factor sterol regulatory element binding protein 1 (SREBF1) and the peroxisome proliferator-activated receptor gamma (PPARG). Furthermore, the network integrates important components related to fatty acid synthesis, like fatty acid synthase (FASN) and sterol-CoA desaturase (SCD), as well as key components of glycerolipid biosynthesis, like LIPIN1 and LDLR (both are regulated by SREBF1). Details of the differentially regulated components are depicted in the table (column headers from left to right: “name”: gene probe name; “meant,” “meanc”: mean treatment values in treatment/steatosis patients and non-steatosis, respectively; “stderrt,” “stderrc”: SE for treatment and control; “ratio,” quotient of meant/meantc; “log2ratio,” log-2 ratio; “limmapa,” q-value based on the statistics of the limma-package).
For subsequent model analysis we will employ a Monte Carlo-based simulation strategy, in which the kinetic parameters are repeatedly sampled from specific probability distributions and used for multiple parallel simulations (Wierling et al., 2012). This facilitates the analysis of large networks of signal transduction, metabolic and gene-regulatory processes, integrating diverse omics data for model refinement, and validation.
We aimed as well to generate a metabolic model of steatotic phenotype. Interestingly among the pathways enriched in steatosis vs. control was the glutathione pathway. Subsequently our investigation involved the mapping of mRNA expression data to a kinetic model of the glutathione synthesis pathway. Adopting this pathway-oriented approach we focused on a subset of complete pathways, rather than all genes of the genome. We have extended this approach to fatty acid biosynthesis, fatty acid metabolism, bile acid pathway, gluconeogenesis, urea cycle, glycolysis, tricarboxylic acid cycle, and glyoxalate shunt; all of which have vital roles in regulation, and are either directly or indirectly involved in the successful functioning of the liver.
Upon data acquisition from all patient-specific samples, various cellular networks will be perturbed by changing environmental conditions of iPS-derived, diseased and healthy cells. The impact of the perturbation will be assessed by constructing key networks from the most significantly dysregulated genes to evaluate any changes as measured and the consequences of these changes as they present themselves throughout the cellular networks.
Ultimately hepatocyte-like cells derived from patient-specific iPS cells will be challenged by free fatty acid overload and high glucose which resemble environmental conditions during the progression of steatosis. Moreover this in vitro model will also lay the foundation for identifying drug targets that may be used for treatment of steatosis. Subsequently, hepatocyte-like cells derived from healthy and diseased individuals would allow us to demonstrate the differences in response to clinically relevant drugs and enable to predict hepatotoxicity. We anticipate that the knowledge gained from this minimal number of patient samples will prove advantageous and beneficial to our ongoing analysis with a larger sample of steatosis patients and healthy controls. Undoubtedly, the application of high-throughput transcriptomics, metabolomics proteomic, and modeling to study healthy and stressed liver, will broaden our meager knowledge of steatosis thus, providing deeper insights into the mechanisms underlying the progression to steatohepatitis.
Conflict of Interest Statement
The authors declare that the research was conducted in the absence of any commercial or financial relationships that could be construed as a potential conflict of interest.
Acknowledgments
The authors acknowledge support from the German Federal Ministry of Education and Research (BMBF GRANT 0315717A), which is a partner of the ERASysBio+ initiative supported under the EU ERA-NET Plus scheme in FP7. Hans V. Westerhoff and Samrina Rehman thank the EPSRC and BBSRC (and BBSRC-BRIC) for support of the Manchester Centre for Integrative Systems Biology, as well as various other funding agencies (EU-FP7, NWO, the SysMO and ERASysBio funder communities). Suzanne Geenen thanks BBSRC and EPSRC for her studentship via the Doctoral Training Centre ISBML, at the Manchester Centre for Integrative Systems Biology, UK. The authors are sad about the passing away of their colleague and co-author Professor Bertini. Professor Bertini was a giant, seeing the importance of metabolomics for science early and contributing greatly.
Footnotes
References
Angulo, P. (2010). Long-term mortality in nonalcoholic fatty liver disease: is liver histology of any prognostic significance? Hepatology 51, 373–375.
Bouzakri, K., Roques, M., Gual, P., Espinosa, S., Guebre-Egziabher, F., Riou, J. P., Laville, M., Le Marchand-Brustel, Y., Tanti, J. F., and Vidal, H. (2003). Reduced activation of phosphatidylinositol-3 kinase and increased serine 636 phosphorylation of insulin receptor substrate-1 in primary culture of skeletal muscle cells from patients with type 2 diabetes. Diabetes 52, 1319–1325.
Brazma, A., Hingamp, P., Quackenbush, J., Sherlock, G., Spellman, P., Stoeckert, C., Aach, J., Ansorge, W., Ball, C. A., Causton, H. C., Gaasterland, T., Glenisson, P., Holstege, F. C., Kim, I. F., Markowitz, V., Matese, J. C., Parkinson, H., Robinson, A., Sarkans, U., Schulze-Kremer, S., Stewart, J., Taylor, R., Vilo, J., and Vingron, M. (2001). Minimum information about a microarray experiment (MIAME)-toward standards for microarray data. Nat. Genet. 29, 365–371.
Browning, J. D., Szczepaniak, L. S., Dobbins, R., Nuremberg, P., Horton, J. D., Cohen, J. C., Grundy, S. M., and Hobbs, H. H. (2004). Prevalence of hepatic steatosis in an urban population in the United States: impact of ethnicity. Hepatology 40, 1387–1395.
Croft, D., O’Kelly, G., Wu, G., Haw, R., Gillespie, M., Matthews, L., Caudy, M., Garapati, P., Gopinath, G., Jassal, B., Jupe, S., Kalatskaya, I., Mahajan, S., May, B., Ndegwa, N., Schmidt, E., Shamovsky, V., Yung, C., Birney, E., Hermjakob, H., D’Eustachio, P., and Stein, L. (2011). Reactome: a database of reactions, pathways and biological processes. Nucleic Acids Res. 39, D691–D697.
de Alwis, N. M., and Day, C. P. (2008). Non-alcoholic fatty liver disease: the mist gradually clears. J. Hepatol. 48(Suppl. 1), S104–S112.
Demir, E., Cary, M. P., Paley, S., Fukuda, K., Lemer, C., Vastrik, I., Wu, G., D’Eustachio, P., Schaefer, C., Luciano, J., Schacherer, F., Martinez-Flores, I., Hu, Z., Jimenez-Jacinto, V., Joshi-Tope, G., Kandasamy, K., Lopez-Fuentes, A. C., Mi, H., Pichler, E., Rodchenkov, I., Splendiani, A., Tkachev, S., Zucker, J., Gopinath, G., Rajasimha, H., Ramakrishnan, R., Shah, I., Syed, M., Anwar, N., Babur, O., Blinov, M., Brauner, E., Corwin, D., Donaldson, S., Gibbons, F., Goldberg, R., Hornbeck, P., Luna, A., Murray-Rust, P., Neumann, E., Reubenacker, O., Samwald, M., Van Iersel, M., Wimalaratne, S., Allen, K., Braun, B., Whirl-Carrillo, M., Cheung, K. H., Dahlquist, K., Finney, A., Gillespie, M., Glass, E., Gong, L., Haw, R., Honig, M., Hubaut, O., Kane, D., Krupa, S., Kutmon, M., Leonard, J., Marks, D., Merberg, D., Petri, V., Pico, A., Ravenscroft, D., Ren, L., Shah, N., Sunshine, M., Tang, R., Whaley, R., Letovksy, S., Buetow, K. H., Rzhetsky, A., Schachter, V., Sobral, B. S., Dogrusoz, U., Mcweeney, S., Aladjem, M., Birney, E., Collado-Vides, J., Goto, S., Hucka, M., Le Novere, N., Maltsev, N., Pandey, A., Thomas, P., Wingender, E., Karp, P. D., Sander, C., and Bader, G. D. (2010). The BioPAX community standard for pathway data sharing. Nat. Biotechnol. 28, 935–942.
den Boer, M., Voshol, P. J., Kuipers, F., Havekes, L. M., and Romijn, J. A. (2004). Hepatic steatosis: a mediator of the metabolic syndrome. Lessons from animal models. Arterioscler. Thromb. Vasc. Biol. 24, 644–649.
Dreher, F., Kreitler, T., Hardt, C., Kamburov, A., Yildirimman, R., Schellander, K., Lehrach, H., Lange, B. M., and Herwig, R. (2012). DIPSBC - Data Integration Platform for Systems Biology Collaborations. BMC Bioinformatics 13, 85. doi:10.1186/1471-2105-13-85
Du, P., Kibbe, W. A., and Lin, S. M. (2008). lumi: a pipeline for processing illumina microarray. Bioinformatics 24, 1547–1548.
Ekstedt, M., Franzen, L. E., Mathiesen, U. L., Thorelius, L., Holmqvist, M., Bodemar, G., and Kechagias, S. (2006). Long-term follow-up of patients with NAFLD and elevated liver enzymes. Hepatology 44, 865–873.
Fajas, L., Schoonjans, K., Gelman, L., Kim, J. B., Najib, J., Martin, G., Fruchart, J. C., Briggs, M., Spiegelman, B. M., and Auwerx, J. (1999). Regulation of peroxisome proliferator-activated receptor gamma expression by adipocyte differentiation and determination factor 1/sterol regulatory element binding protein 1: implications for adipocyte differentiation and metabolism. Mol. Cell. Biol. 19, 5495–5503.
Geenen, S., du Preez, F. B., Reed, M., Nijhout, H. F., Kenna, J. G., Wilson, I. D., Westerhoff, H. V., and Snoep, J. L. (2012). A mathematical modelling approach to assessing the reliability of biomarkers of glutathione metabolism. Eur. J. Pharm. Sci. 46, 233–243.
Gentleman, R. C., Carey, V. J., Bates, D. M., Bolstad, B., Dettling, M., Dudoit, S., Ellis, B., Gautier, L., Ge, Y., Gentry, J., Hornik, K., Hothorn, T., Huber, W., Iacus, S., Irizarry, R., Leisch, F., Li, C., Maechler, M., Rossini, A. J., Sawitzki, G., Smith, C., Smyth, G., Tierney, L., Yang, J. Y., and Zhang, J. (2004). Bioconductor: open software development for computational biology and bioinformatics. Genome Biol. 5, R80.
Hermjakob, H., Montecchi-Palazzi, L., Bader, G., Wojcik, J., Salwinski, L., Ceol, A., Moore, S., Orchard, S., Sarkans, U., Von Mering, C., Roechert, B., Poux, S., Jung, E., Mersch, H., Kersey, P., Lappe, M., Li, Y., Zeng, R., Rana, D., Nikolski, M., Husi, H., Brun, C., Shanker, K., Grant, S. G., Sander, C., Bork, P., Zhu, W., Pandey, A., Brazma, A., Jacq, B., Vidal, M., Sherman, D., Legrain, P., Cesareni, G., Xenarios, I., Eisenberg, D., Steipe, B., Hogue, C., and Apweiler, R. (2004). The HUPO PSI’s molecular interaction format – a community standard for the representation of protein interaction data. Nat. Biotechnol. 22, 177–183.
Hooper, A. J., Adams, L. A., and Burnett, J. R. (2011). Genetic determinants of hepatic steatosis in man. J. Lipid Res. 52, 593–617.
Hoops, S., Sahle, S., Gauges, R., Lee, C., Pahle, J., Simus, N., Singhal, M., Xu, L., Mendes, P., and Kummer, U. (2006). COPASI – a complex pathway simulator. Bioinformatics 22, 3067–3074.
Horton, J. D., Goldstein, J. L., and Brown, M. S. (2002). SREBPs: activators of the complete program of cholesterol and fatty acid synthesis in the liver. J. Clin. Invest. 109, 1125–1131.
Houde, V. P., Brule, S., Festuccia, W. T., Blanchard, P. G., Bellmann, K., Deshaies, Y., and Marette, A. (2010). Chronic rapamycin treatment causes glucose intolerance and hyperlipidemia by upregulating hepatic gluconeogenesis and impairing lipid deposition in adipose tissue. Diabetes 59, 1338–1348.
Hucka, M., Finney, A., Sauro, H. M., Bolouri, H., Doyle, J. C., Kitano, H., Arkin, A. P., Bornstein, B. J., Bray, D., Cornish-Bowden, A., Cuellar, A. A., Dronov, S., Gilles, E. D., Ginkel, M., Gor, V., Goryanin, Ii, Hedley, W. J., Hodgman, T. C., Hofmeyr, J. H., Hunter, P. J., Juty, N. S., Kasberger, J. L., Kremling, A., Kummer, U., Le Novere, N., Loew, L. M., Lucio, D., Mendes, P., Minch, E., Mjolsness, E. D., Nakayama, Y., Nelson, M. R., Nielsen, P. F., Sakurada, T., Schaff, J. C., Shapiro, B. E., Shimizu, T. S., Spence, H. D., Stelling, J., Takahashi, K., Tomita, M., Wagner, J., and Wang, J. (2003). The systems biology markup language (SBML): a medium for representation and exchange of biochemical network models. Bioinformatics 19, 524–531.
Ide, T., Shimano, H., Yahagi, N., Matsuzaka, T., Nakakuki, M., Yamamoto, T., Nakagawa, Y., Takahashi, A., Suzuki, H., Sone, H., Toyoshima, H., Fukamizu, A., and Yamada, N. (2004). SREBPs suppress IRS-2-mediated insulin signalling in the liver. Nat. Cell Biol. 6, 351–357.
Inoue, Y., Inoue, J., Lambert, G., Yim, S. H., and Gonzalez, F. J. (2004). Disruption of hepatic C/EBPalpha results in impaired glucose tolerance and age-dependent hepatosteatosis. J. Biol. Chem. 279, 44740–44748.
Ishimoto, K., Nakamura, H., Tachibana, K., Yamasaki, D., Ota, A., Hirano, K., Tanaka, T., Hamakubo, T., Sakai, J., Kodama, T., and Doi, T. (2009). Sterol-mediated regulation of human lipin 1 gene expression in hepatoblastoma cells. J. Biol. Chem. 284, 22195–22205.
Jozefczuk, J., Prigione, A., Chavez, L., and Adjaye, J. (2011). Comparative analysis of human embryonic stem cell and induced pluripotent stem cell-derived hepatocyte-like cells reveals current drawbacks and possible strategies for improved differentiation. Stem Cells Dev. 20, 1259–1275.
Kamburov, A., Cavill, R., Ebbels, T. M., Herwig, R., and Keun, H. C. (2011a). Integrated pathway-level analysis of transcriptomics and metabolomics data with IMPaLA. Bioinformatics 27, 2917–2918.
Kamburov, A., Pentchev, K., Galicka, H., Wierling, C., Lehrach, H., and Herwig, R. (2011b). ConsensusPathDB: toward a more complete picture of cell biology. Nucleic Acids Res. 39, D712–D717.
Kamburov, A., Wierling, C., Lehrach, H., and Herwig, R. (2009). ConsensusPathDB – a database for integrating human functional interaction networks. Nucleic Acids Res. 37, D623–D628.
Kanehisa, M., Goto, S., Furumichi, M., Tanabe, M., and Hirakawa, M. (2010). KEGG for representation and analysis of molecular networks involving diseases and drugs. Nucleic Acids Res. 38, D355–D360.
Kashofer, K., Tschernatsch, M. M., Mischinger, H. J., Iberer, F., and Zatloukal, K. (2009). The disease relevance of human hepatocellular xenograft models: molecular characterization and review of the literature. Cancer Lett. 286, 121–128.
Kerrien, S., Alam-Faruque, Y., Aranda, B., Bancarz, I., Bridge, A., Derow, C., Dimmer, E., Feuermann, M., Friedrichsen, A., Huntley, R., Kohler, C., Khadake, J., Leroy, C., Liban, A., Lieftink, C., Montecchi-Palazzi, L., Orchard, S., Risse, J., Robbe, K., Roechert, B., Thorneycroft, D., Zhang, Y., Apweiler, R., and Hermjakob, H. (2007). IntAct – open source resource for molecular interaction data. Nucleic Acids Res. 35, D561–D565.
Khamzina, L., Veilleux, A., Bergeron, S., and Marette, A. (2005). Increased activation of the mammalian target of rapamycin pathway in liver and skeletal muscle of obese rats: possible involvement in obesity-linked insulin resistance. Endocrinology 146, 1473–1481.
Li, C., Donizelli, M., Rodriguez, N., Dharuri, H., Endler, L., Chelliah, V., Li, L., He, E., Henry, A., Stefan, M. I., Snoep, J. L., Hucka, M., Le Novere, N., and Laibe, C. (2010a). BioModels database: an enhanced, curated and annotated resource for published quantitative kinetic models. BMC Syst. Biol. 4, 92. doi:10.1186/1752-0509-4-92
Li, S., Brown, M. S., and Goldstein, J. L. (2010b). Bifurcation of insulin signaling pathway in rat liver: mTORC1 required for stimulation of lipogenesis, but not inhibition of gluconeogenesis. Proc. Natl. Acad. Sci. U.S.A. 107, 3441–3446.
Loebke, C., Sueltmann, H., Schmidt, C., Henjes, F., Wiemann, S., Poustka, A., and Korf, U. (2007). Infrared-based protein detection arrays for quantitative proteomics. Proteomics 7, 558–564.
Mannsperger, H. A., Gade, S., Henjes, F., Beissbarth, T., and Korf, U. (2010). RPPanalyzer: analysis of reverse-phase protein array data. Bioinformatics 26, 2202–2203.
Matthews, L., Gopinath, G., Gillespie, M., Caudy, M., Croft, D., De Bono, B., Garapati, P., Hemish, J., Hermjakob, H., Jassal, B., Kanapin, A., Lewis, S., Mahajan, S., May, B., Schmidt, E., Vastrik, I., Wu, G., Birney, E., Stein, L., and D’Eustachio, P. (2009). Reactome knowledgebase of human biological pathways and processes. Nucleic Acids Res. 37, D619–D622.
Medeiros, C., Frederico, M. J., Da Luz, G., Pauli, J. R., Silva, A. S., Pinho, R. A., Velloso, L. A., Ropelle, E. R., and De Souza, C. T. (2011). Exercise training reduces insulin resistance and upregulates the mTOR/p70S6k pathway in cardiac muscle of diet-induced obesity rats. J. Cell. Physiol. 226, 666–674.
Miquilena-Colina, M. E., Lima-Cabello, E., Sanchez-Campos, S., Garcia-Mediavilla, M. V., Fernandez-Bermejo, M., Lozano-Rodriguez, T., Vargas-Castrillon, J., Buque, X., Ochoa, B., Aspichueta, P., Gonzalez-Gallego, J., and Garcia-Monzon, C. (2011). Hepatic fatty acid translocase CD36 upregulation is associated with insulin resistance, hyperinsulinaemia and increased steatosis in non-alcoholic steatohepatitis and chronic hepatitis C. Gut 60, 1394–1402.
Nascimento, E. B., Fodor, M., Van Der Zon, G. C., Jazet, I. M., Meinders, A. E., Voshol, P. J., Vlasblom, R., Baan, B., Eckel, J., Maassen, J. A., Diamant, M., and Ouwens, D. M. (2006). Insulin-mediated phosphorylation of the proline-rich Akt substrate PRAS40 is impaired in insulin target tissues of high-fat diet-fed rats. Diabetes 55, 3221–3228.
Olivier, B. G., and Snoep, J. L. (2004). Web-based kinetic modelling using JWS Online. Bioinformatics 20, 2143–2144.
Ost, A., Svensson, K., Ruishalme, I., Brannmark, C., Franck, N., Krook, H., Sandstrom, P., Kjolhede, P., and Stralfors, P. (2010). Attenuated mTOR signaling and enhanced autophagy in adipocytes from obese patients with type 2 diabetes. Mol. Med. 16, 235–246.
Pereira, M. J., Palming, J., Rizell, M., Aureliano, M., Carvalho, E., Svensson, M. K., and Eriksson, J. W. (2012). mTOR inhibition with rapamycin causes impaired insulin signalling and glucose uptake in human subcutaneous and omental adipocytes. Mol. Cell. Endocrinol. 355, 96–105.
Petta, S., Muratore, C., and Craxi, A. (2009). Non-alcoholic fatty liver disease pathogenesis: the present and the future. Dig. Liver Dis. 41, 615–625.
Reed, M. C., Thomas, R. L., Pavisic, J., James, S. J., Ulrich, C. M., and Nijhout, H. F. (2008). A mathematical model of glutathione metabolism. Theor. Biol. Med. Model. 5, 8.
Salwinski, L., Miller, C. S., Smith, A. J., Pettit, F. K., Bowie, J. U., and Eisenberg, D. (2004). The database of interacting proteins: 2004 update. Nucleic Acids Res. 32, D449–D451.
Sesti, G., Federici, M., Lauro, D., Sbraccia, P., and Lauro, R. (2001). Molecular mechanism of insulin resistance in type 2 diabetes mellitus: role of the insulin receptor variant forms. Diabetes Metab. Res. Rev. 17, 363–373.
Smith, P. K., Krohn, R. I., Hermanson, G. T., Mallia, A. K., Gartner, F. H., Provenzano, M. D., Fujimoto, E. K., Goeke, N. M., Olson, B. J., and Klenk, D. C. (1985). Measurement of protein using bicinchoninic acid. Anal. Biochem. 150, 76–85.
Smyth, G. K. (2004). Linear models and empirical bayes methods for assessing differential expression in microarray experiments. Stat. Appl. Genet. Mol. Biol. 3, 3.
Sneddon, A. A., Wu, H. C., Farquharson, A., Grant, I., Arthur, J. R., Rotondo, D., Choe, S. N., and Wahle, K. W. (2003). Regulation of selenoprotein GPx4 expression and activity in human endothelial cells by fatty acids, cytokines and antioxidants. Atherosclerosis 171, 57–65.
Speliotes, E. K., Yerges-Armstrong, L. M., Wu, J., Hernaez, R., Kim, L. J., Palmer, C. D., Gudnason, V., Eiriksdottir, G., Garcia, M. E., Launer, L. J., Nalls, M. A., Clark, J. M., Mitchell, B. D., Shuldiner, A. R., Butler, J. L., Tomas, M., Hoffmann, U., Hwang, S. J., Massaro, J. M., O’Donnell, C. J., Sahani, D. V., Salomaa, V., Schadt, E. E., Schwartz, S. M., Siscovick, D. S., Voight, B. F., Carr, J. J., Feitosa, M. F., Harris, T. B., Fox, C. S., Smith, A. V., Kao, W. H., Hirschhorn, J. N., and Borecki, I. B. (2011). Genome-wide association analysis identifies variants associated with nonalcoholic fatty liver disease that have distinct effects on metabolic traits. PLoS Genet. 7, e1001324. doi:10.1371/journal.pgen.1001324
Storey, J. D. (2002). A direct approach to false discovery rates. J. R. Stat. Soc. Series B Stat. Methodol. 64, 479–498.
Takahashi, K., Tanabe, K., Ohnuki, M., Narita, M., Ichisaka, T., Tomoda, K., and Yamanaka, S. (2007). Induction of pluripotent stem cells from adult human fibroblasts by defined factors. Cell 131, 861–872.
Tarca, A. L., Draghici, S., Khatri, P., Hassan, S. S., Mittal, P., Kim, J. S., Kim, C. J., Kusanovic, J. P., and Romero, R. (2009). A novel signaling pathway impact analysis. Bioinformatics 25, 75–82.
Taylor, C. F., Field, D., Sansone, S. A., Aerts, J., Apweiler, R., Ashburner, M., Ball, C. A., Binz, P. A., Bogue, M., Booth, T., Brazma, A., Brinkman, R. R., Michael Clark, A., Deutsch, E. W., Fiehn, O., Fostel, J., Ghazal, P., Gibson, F., Gray, T., Grimes, G., Hancock, J. M., Hardy, N. W., Hermjakob, H., Julian, R. K. Jr., Kane, M., Kettner, C., Kinsinger, C., Kolker, E., Kuiper, M., Le Novere, N., Leebens-Mack, J., Lewis, S. E., Lord, P., Mallon, A. M., Marthandan, N., Masuya, H., Mcnally, R., Mehrle, A., Morrison, N., Orchard, S., Quackenbush, J., Reecy, J. M., Robertson, D. G., Rocca-Serra, P., Rodriguez, H., Rosenfelder, H., Santoyo-Lopez, J., Scheuermann, R. H., Schober, D., Smith, B., Snape, J., Stoeckert, C. J. Jr., Tipton, K., Sterk, P., Untergasser, A., Vandesompele, J., and Wiemann, S. (2008). Promoting coherent minimum reporting guidelines for biological and biomedical investigations: the MIBBI project. Nat. Biotechnol. 26, 889–896.
Um, S. H., D’Alessio, D., and Thomas, G. (2006). Nutrient overload, insulin resistance, and ribosomal protein S6 kinase 1, S6K1. Cell Metab. 3, 393–402.
Um, S. H., Frigerio, F., Watanabe, M., Picard, F., Joaquin, M., Sticker, M., Fumagalli, S., Allegrini, P. R., Kozma, S. C., Auwerx, J., and Thomas, G. (2004). Absence of S6K1 protects against age- and diet-induced obesity while enhancing insulin sensitivity. Nature 431, 200–205.
Vander Haar, E., Lee, S. I., Bandhakavi, S., Griffin, T. J., and Kim, D. H. (2007). Insulin signalling to mTOR mediated by the Akt/PKB substrate PRAS40. Nat. Cell Biol. 9, 316–323.
Voshol, P. J., Haemmerle, G., Ouwens, D. M., Zimmermann, R., Zechner, R., Teusink, B., Maassen, J. A., Havekes, L. M., and Romijn, J. A. (2003). Increased hepatic insulin sensitivity together with decreased hepatic triglyceride stores in hormone-sensitive lipase-deficient mice. Endocrinology 144, 3456–3462.
Vuppalanchi, R., and Chalasani, N. (2009). Nonalcoholic fatty liver disease and nonalcoholic steatohepatitis: selected practical issues in their evaluation and management. Hepatology 49, 306–317.
Wang, Y., Shi, M., Fu, H., Xu, H., Wei, J., Wang, T., and Wang, X. (2010). Mammalian target of the rapamycin pathway is involved in non-alcoholic fatty liver disease. Mol. Med. Report 3, 909–915.
Wierling, C., Herwig, R., and Lehrach, H. (2007). Resources, standards and tools for systems biology. Brief. Funct. Genomic. Proteomic. 6, 240–251.
Wierling, C., Kuhn, A., Hache, H., Daskalaki, A., Maschke-Dutz, E., Peycheva, S., Li, J., Herwig, R., and Lehrach, H. (2012). Prediction in the face of uncertainty: a Monte Carlo-based approach for systems biology of cancer treatment. Mutat. Res. 746, 163–170.
Wolfrum, K., Wang, Y., Prigione, A., Sperling, K., Lehrach, H., and Adjaye, J. (2010). The LARGE principle of cellular reprogramming: lost, acquired and retained gene expression in foreskin and amniotic fluid-derived human iPS cells. PLoS ONE 5, e13703. doi:10.1371/journal.pone.0013703
Appendix
Keywords: NAFLD, induced pluripotent stem cells, sterol biosynthesis, glutathione metabolism, lipid metabolism, AKT/mTOR signaling, systems biology, modeling
Citation: Jozefczuk J, Kashofer K, Ummanni R, Henjes F, Rehman S, Geenen S, Wruck W, Regenbrecht C, Daskalaki A, Wierling C, Turano P, Bertini I, Korf U, Zatloukal K, Westerhoff HV, Lehrach H and Adjaye J (2012) A systems biology approach to deciphering the etiology of steatosis employing patient-derived dermal fibroblasts and iPS cells. Front. Physio. 3:339. doi: 10.3389/fphys.2012.00339
Received: 15 March 2012; Accepted: 03 August 2012;
Published online: 03 September 2012.
Edited by:
Matteo Barberis, Humboldt University Berlin, Germany; Max Planck, Institute for Molecular Genetics, GermanyReviewed by:
Ioannis Xenarios, Swiss Institute of Bioinformatics, SwitzerlandGunnar Cedersund, Linköping University, Sweden
Copyright: © 2012 Jozefczuk, Kashofer, Ummanni, Henjes, Rehman, Geenen, Wruck, Regenbrecht, Daskalaki, Wierling, Turano, Bertini, Korf, Zatloukal, Westerhoff, Lehrach and Adjaye. This is an open-access article distributed under the terms of the Creative Commons Attribution License, which permits use, distribution and reproduction in other forums, provided the original authors and source are credited and subject to any copyright notices concerning any third-party graphics etc.
*Correspondence: James Adjaye, Department of Vertebrate Genomics, Max Planck Institute for Molecular Genetics, Ihnestrasse 63, 14195 Berlin, Germany. e-mail:YWRqYXllQG1vbGdlbi5tcGcuZGU=
†Present address: Ramesh Ummanni, Centre for Chemical Biology, Indian Institute of Chemical Technology, Hyderabad, India.
‡Deceased July 7, 2012.
 Justyna Jozefczuk1


