- 1Department of Emergency Medicine, Taipei Veterans General Hospital, Hsin-Chu, China
- 2Department of Physiology, College of Medicine, National Taiwan University, Taipei, China
- 3Department of Emergency Medicine, National Taiwan University Hospital, Taipei, China
- 4Department of Internal Medicine, National Taiwan University Hospital, Taipei, China
- 5Department of Anesthesiology, National Taiwan University Hospital, Taipei, China
- 6Department of Surgery, National Taiwan University Hospital, Hsin-Chu, China
- 7Department of Surgery, National Taiwan University Hospital, Taipei, China
Changes in vascular mechanics due to aging include elevated vascular impedance, diminished aorta distensibility, and an accelerated return of pulse wave reflection, which may increase the systolic workload on the heart. Classically, the accurate measurement of vascular mechanics requires the simultaneous recording of aortic pressure and flow signals. In practice, it is feasible to estimate arterial wave properties in terms of wave transit time (τw) and wave reflection index (RI) by using aortic pressure signal alone. In this study, we determined the τw and magnitudes of the forward (∣Pf∣) and backward (∣Pb∣) pressure waves in Long–Evans male rats aged 4 (n = 14), 6 (n = 17), 12 (n = 17), and 18 (n = 24) months, based on the measured aortic pressure and an assumed triangular flow (Qtri). The pulsatile pressure wave was the only signal recorded in the ascending aorta by using a high-fidelity pressure sensor. The base of the unknown Qtri was constructed using a duration, which equals to the ejection time. The timing at the peak of the triangle was derived using the fourth-order derivative of the aortic pressure waveform. In the 18-month-old rats, the ratio of τw to left ventricular ejection time (LVET) decreased, indicating a decline in the distensibility of the aorta. The increased ∣Pb∣ associated with unaltered ∣Pf∣ enhanced the RI in the older rats. The augmentation index (AI) also increased significantly with age. A significant negative correlation between the AI and τw/LVET was observed: AI = −0.7424 − 0.9026 × (τw/LVET) (r = 0.4901; P < 0.0001). By contrast, RI was positively linearly correlated with the AI as follows: AI = −0.4844 + 2.3634 × RI (r = 0.8423; P < 0.0001). Both the decreased τw/LVET and increased RI suggested that the aging process may increase the AI, thereby increasing the systolic hydraulic load on the heart. The novelty of the study is that Qtri is constructed using the measured aortic pressure wave to approximate its corresponding flow signal, and that calibration of Qtri is not essential in the analysis.
Introduction
Aging is known to be associated with deterioration in many structural and functional properties of aortas and large arteries, including dilated vessel diameter, increased wall thickness, diminished wall elasticity, and endothelial dysfunction (Lakatta and Yin, 1982; O'Rourke and Nichols, 2005). As age advances, the following histological alterations in the vasculature are observed: an increased rate of endothelial cell apoptosis, the degeneration of smooth muscles in the media, fragmentation of and decrease in the content of elastic fibers, and an increase in the number of irregularly arranged collagen fibers in the stroma (Lakatta, 1979; Yin, 1980; Lakatta and Yin, 1982; Chang et al., 1998). Collagen crosslinking by non-enzymatic glycation is also enhanced within the arterial wall (Sims et al., 1996; Schleicher et al., 1997). All these factors contribute to the age-related changes in the mechanical properties of the vasculature, including elevated arterial impedance, diminished aorta distensibility, and an accelerated return of pulse wave reflection (O'Rourke and Nichols, 2005). These changes in vascular mechanics are accelerated in the incidence of hypertension (Najjar et al., 2005; Franklin, 2006), coronary heart diseases (Mattace-Raso et al., 2006), congestive heart failure (Sutton-Tyrrell et al., 2005), and stroke (O'Leary et al., 1999) withadvancing age.
The physical properties of the arterial system are reflected in the aortic input impedance (Zi), which is the aortic pressure-flow relation in the frequency domain (McDonald, 1974; O'Rourke, 1982; Milnor, 1989; Wang et al., 2014a). While the aortic characteristic impedance (Zc) is known (Nichols and O'Rourke, 2011), the wave separation method can be derived in the time domain to resolve the measured aortic pressure wave into its forward (Pf) and backward (Pb) components (Westerhof et al., 1972). The arterial wave transit time (τw) can be computed using the impulse response function, which is the time-domain equivalent of its input impedance in the frequency domain (Laxminarayan et al., 1978; Sipkema et al., 1980). Thus, the accurate measurement of arterial wave properties, including arterial τw and wave reflection magnitude (RM) or wave reflection index (RI), requires the simultaneous recording of aortic pressure and flow signals.
In practice, it is feasible to estimate the τw and magnitudes of the forward and backward pressure waves by using aortic pressure signal alone. Westerhof et al. (2006) provided a novel method to calculate the pressure wave reflection by using only the measured aortic pressure. Replacing the unknown flow signal with a triangular wave shape (Qtri), they successfully resolved the measured aortic pressure wave into its components, Pf and Pb, to calculate the RM or RI. Chang et al. (2017) elaborated this concept by determining the arterial τw through vascular impulse response analysis. They discovered that the aortic impulse response is an effective method for the estimation of arterial τw by using a single pressure pulse recording with an assumed Qtri.
In this study, we determined the age-related changes in arterial wave properties on the basis of the aortic pressure alone in Long–Evans male rats. The pulsatile pressure wave was the only signal recorded in the ascending aorta by using a high-fidelity pressure sensor. The timing at the peak of the Qtri was derived using the fourth-order derivative of the aortic pressure waveform (Westerhof et al., 2006; Chang et al., 2017). On the basis of the measured aortic pressure and an assumed Qtri, we calculated the arterial τw, magnitudes of the Pf and Pb waves, and augmentation index (AI) to delineate the age-related changes in the pulsatile component of the left ventricular (LV) afterload. The novelty of the study is that Qtri is constructed using the measured aortic pressure wave to approximate its corresponding flow signal, and that calibration of Qtri is not essential in the analysis.
Methods
Animals and Catheterization
The effects of the aging process on the arterial mechanics were evaluated in specific pathogen-free Long–Evans male rats, aged 4 (n = 14), 6 (n = 17), 12 (n = 17), and 18 (n = 24) months. The rats were obtained from the colony maintained in the barrier facilities at the Laboratory Animal Center of the College of Medicine, National Taiwan University (Chang et al., 1998). All rats were allowed free access to Purina chow and water and were housed under 12 h light–dark cycles. The cages of the rats were examined periodically. Furthermore, the body weight (BW) of the rats was measured regularly to ensure the appropriate administration of the food. The experiment was conducted according to the Guide for the Care and Use of Laboratory Animals, and our study protocol was approved by the Animal Care and Use Committee of National Taiwan University (Chang et al., 1998).
The general surgical procedures and measurement of the cardiovascular variables in anesthetized rats were conducted as described previously (Chang et al., 1998). In brief, each rat was anesthetized with sodium pentobarbital (50 mg kg−1, I.P.), placed on a heating pad, intubated, and ventilated using a rodent respirator (model 131; New England Medical Instruments, Medway, MA, USA) (Wu et al., 2011). A high-fidelity pressure catheter (model SPC 320, size 2 French; Millar Instruments, Houston, TX, USA) was used to measure the pulsatile ascending aortic pressure via the isolated carotid artery of the right side. The lead II ECG was recorded using a Gould ECG/Biotach amplifier (Cleveland, OH, USA). Selective aortic pressure signals from 5 to 10 beats were averaged in the time domain, using the peak R wave of the ECG as a fiducial point.
To show the similarity between the measured and predicted arterial wave properties, the aortic pressure and flow (Qm) signals were also simultaneously recorded in one rat aged 4 months, as an example, under the anesthetized, open-chest condition (Figure 1). The chest was opened through the second intercostal space on the right side. The pulsatile Qm waveform was measured by using an electromagnetic flow probe (100 series, internal circumference 8 mm, Carolina Medical Electronics, King, NC, USA), which was positioned around the ascending aorta (Chang et al., 2017).
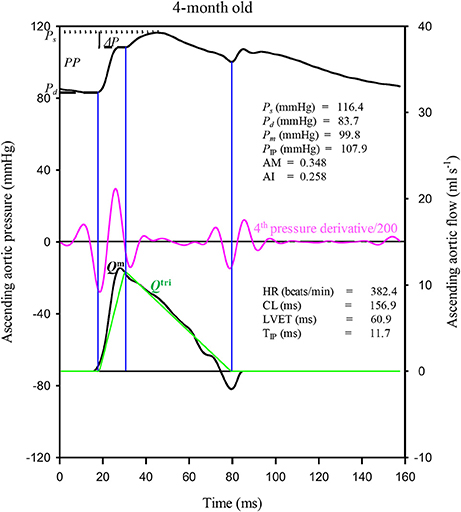
Figure 1. Construction of an uncalibrated triangular flow (Qtri) from the measured aortic pressure waveform in one rat aged 4 months as an example. The pressure and flow (Qm) signals were simultaneously recorded in the ascending aorta under the anesthetized, open-chest condition. AM, augmentation magnitude, given by ΔP/(PP − ΔP); AI, augmentation index, given by ΔP/PP; CL, cardiac cycle length; HR, basal heart rate; LVET, left ventricular ejection time; Ps, systolic pressure; Pd, diastolic pressure; Pm, mean pressure; PP, pulse pressure; PIP, pressure at inflection point; ΔP, given by Ps − PIP; TIP, time to inflection point.
Construction of the Unknown Flow Wave by Using a Triangle
The unknown Qtri was derived from the pressure waveform measured in the ascending aorta (Westerhof et al., 2006; Chang et al., 2017). The onset and termination of LV ejection were identified as the intersection of two tangential lines near the foot of the pressure wave (the first vertical blue lines in Figures 1, 3A,B) and near the incisura (the third vertical blue lines in Figures 1, 3A,B), respectively (Chang et al., 2015). The base of the Qtri was constructed using a duration set equal to the ejection time, which is the time difference between the start and end points. The timing at the peak of the triangle was derived from the fourth-order derivative of the aortic pressure wave (the pink curves in Figures 1, 3A,B; Westerhof et al., 2006; Chang et al., 2017). After ejection commenced, the first zero-crossing curve from above to below (the second vertical blue lines in Figures 1, 3A,B) determined the peak of the triangle of blood flow, which was the inflection point of the pressure wave (Kelly et al., 1989; Westerhof et al., 2006; Chang et al., 2017). Thus, the uncalibrated Qtri was approximated by a triangular shape (the green curves in Figures 1, 3A,B) and represented the corresponding flow wave of the aortic pressure signal.
After identifying the inflection point, the augmentation of pressure (ΔP) can be defined as the difference between the systolic pressure (Ps) and the pressure at the inflection point (PIP): ΔP = Ps − PIP (Figures 1, 3A,B; Westerhof et al., 2006). The difference between Ps and the diastolic pressure (Pd) is the pulse pressure (PP = Ps − Pd). Thus, the augmentation magnitude (AM) is defined as the ratio of ΔP to the initial pressure rise (PP − ΔP), given by AM = ΔP/(PP − ΔP) (Westerhof et al., 2006). The AI is the pressure augmentation (ΔP) divided by the total pressure amplitude (PP), given by AI = ΔP/PP.
Impulse Response Function Curve
A standard Fourier series expansion technique was performed to calculate the Zi from the ratio of the ascending aortic pressure harmonics to the corresponding flow harmonics from either Qm or Qtri (McDonald, 1974; Milnor, 1989; Nichols and O'Rourke, 2011; Chang et al., 2015). The Zc was calculated by averaging the high-frequency moduli of the Zi data points from 4 to 10 harmonics (Wang et al., 2014a). The arterial τw was computed using the impulse response function curve (the pink lines in Figures 2A,B, 4A,B; Sipkema et al., 1980; Latson et al., 1987), which was generated by using an inverse Fourier transformation of the Zi after multiplying the first 12 harmonics by a Dolph–Chebychev weighting function with order 24 (Laxminarayan et al., 1978; Chang et al., 2015). One-half of the time difference between the appearance of the second reflected peak (long arrow) and the initial peak (short arrow) in the impulse response curve approximates the τw in the lower body circulation (Laxminarayan et al., 1978; Sipkema et al., 1980; Wu et al., 2012).
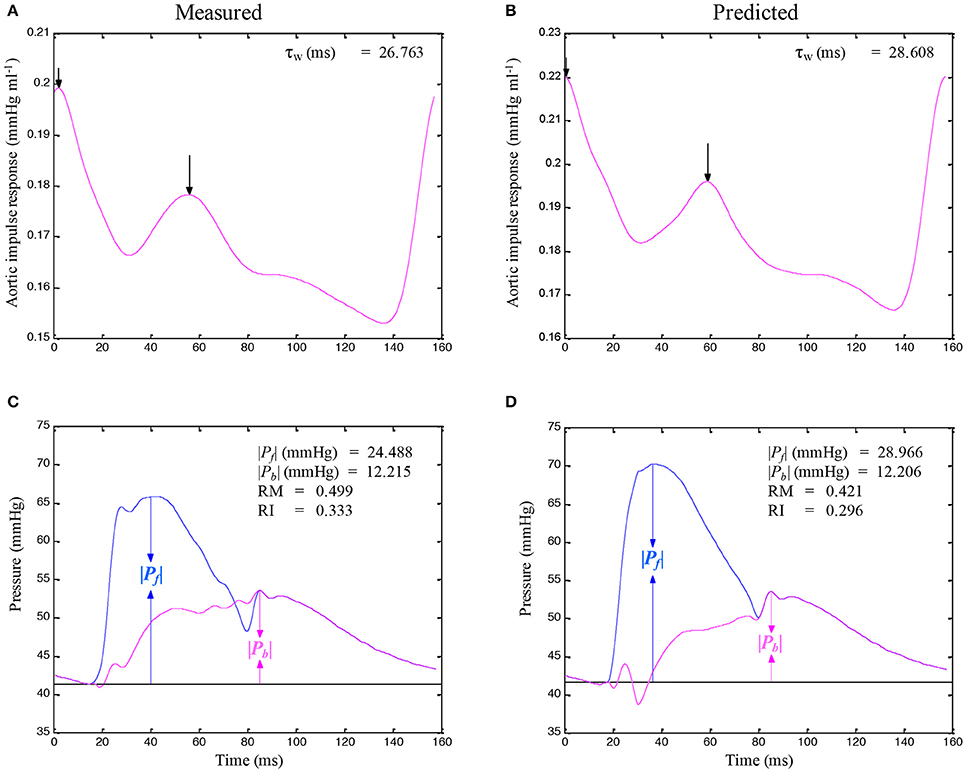
Figure 2. Similarity between the measured aortic impulse response obtained from the measured pressure and Qm (A) and the predicted aortic impulse response obtained from the measured pressure and Qtri (B) in the same rat, which is shown in Figure 1. The measured Pf and Pb waves (C) and the predicted Pf and Pb waves (D) are also depicted. In (C,D), the amplitudes (peak - trough) of the Pf and Pb are represented by ∣Pb∣ and ∣Pf∣, respectively. Pf, forward pressure wave; Pb, backward pressure wave; RM, wave reflection magnitude, given by ∣Pb∣/∣Pf∣; RI, wave reflection index, given by ∣Pb∣/(∣Pf∣ + ∣Pb∣); Qm, measured aortic flow; Qtri, uncalibrated triangular flow; τw, wave transit time.
Arterial Wave Separation Analysis
The following equations were used to calculate the Pf and Pb from the measured aortic pressure wave (Pao) in the time domain (Murgo et al., 1981; Chang et al., 2015):
The calculations of the Pf and Pb by using Q(t) from either Qm or Qtri are depicted in Figures 2C,D, 4C,D. The amplitudes (peak - trough) of the Pb and Pf are represented by ∣Pb∣ and ∣Pf∣, respectively. The aortic RM was then defined as the ratio of ∣Pb∣ and ∣Pf∣ (i.e., RM = ∣Pb∣/∣Pf∣; Westerhof et al., 2006). The reflection index (RI) was calculated as RI = ∣Pb∣/(∣Pf∣ + ∣Pb∣).
Statistics
Results are expressed as means ± standard error. A one-way analysis of variance (ANOVA) was performed to determine the statistical significance of the results for multiple comparisons of the effect of the aging process on arterial wave properties (Wu et al., 2012). Statistical significance was assumed at the level of P < 0.05. In cases where the ANOVA results indicated that a hemodynamic variable differed significantly among age groups, Tukey's honest significant difference method was used to determine the groups of rats that exhibited divergent mean values for that variable (Wang et al., 2014b).
Results
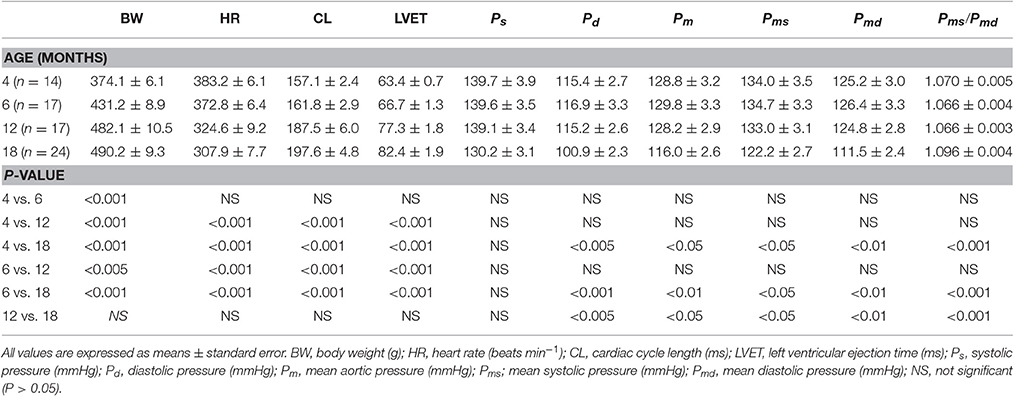
Table 1 presents the effect of age on BW, basal heart rate (HR), cardiac cycle length (CL), LV ejection time (LVET), and aortic pressure profile. In the rats, a significant increase in BW, decrease in HR, increase in CL, and prolongation in LVET were observed with an increase in age. However, the BW, HR, CL, and LVET did not significantly differ between the rats aged 12 and 18 months. The systolic blood pressure (Ps) did not change significantly as animals aged; however, diastolic (Pd), mean (Pm), mean systolic (Pms), and mean diastolic (Pmd) aortic pressures, and the Pms/Pmd ratio were significantly lower in 18-month-old rats than in the rats from other age groups.
Table 2 presents the pressure characteristics in relation to the pulse wave reflection derived from the aortic pressure signal in rats of different ages. Rats aged 18 months had markedly higher TIP than did the rats aged 4 and 6 months. However, PIP significantly decreased and ΔP increased in the 18-month-old rats compared with those in rats from other age groups. The PP values were markedly higher in the 18-month-old rats than were those values in the 4-, 6-, and 12-month-old rats. Moreover, rats aged 18 months had significantly higher ∣Pb∣, but not ∣Pf∣ than did the rats in other age groups. Although, the arterial τw did not change significantly as animals aged, the τw/CL ratio was significantly lower in the rats aged 18 months than in the rats aged 4 and 6 months but not in those aged 12 months. No correlation between arterial τw and TIP was observed.
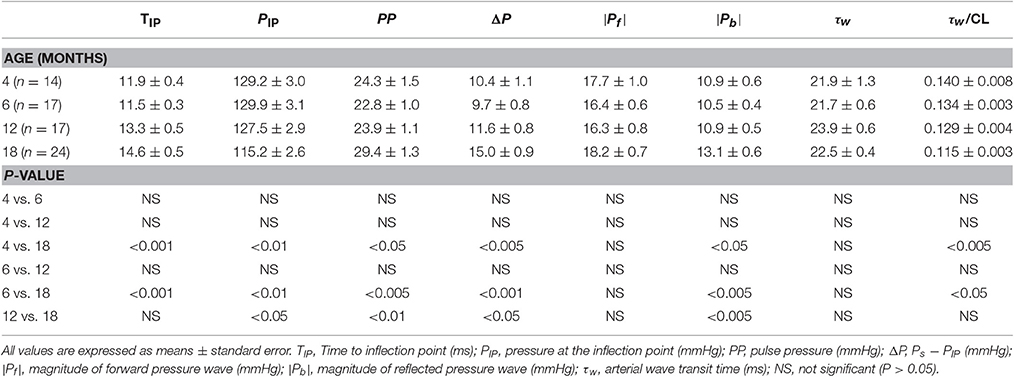
Table 2. Characteristics in relation to pulse wave reflection derived from aortic pressure waveform in rats aged 4, 6, 12, and 18 months.
Figure 1 illustrates the construction of an uncalibrated Qtri from the measured pressure waveform in one rat aged 4 months as an example. The pressure and Qm signals were simultaneously recorded in the ascending aorta under the anesthetized, open-chest condition. Figure 2 depicts the similarity between the measured aortic impulse response obtained from the measured pressure and Qm (A) and the predicted aortic impulse response obtained from the measured pressure and Qtri (B) in the same rat. The measured Pf and Pb waves (C) and the predicted Pf and Pb waves (D) are also presented. Although, the Qtri shape is an approximation that may differ from the actual Qm shape, this approximation gave results close to those obtained with the measured Qm.
Figures 3A,B illustrate the construction of an uncalibrated triangular flow from the measured pressure waveform in 4- and an 18-month old rats, respectively. The rat aged 4 months was the same one as shown in Figure 1. The pressure wave was the only signal recorded in the ascending aorta under the anesthetized, closed-chest condition. Figure 4 depicts the aortic impulse responses obtained from the measured aortic pressure and Qtri in the same 4- and 18-month old rats (Figures 4A,B, respectively). The Pf and Pb waves for the corresponding rats aged 4 (Figure 4C) or 18 (Figure 4D) months are also depicted.
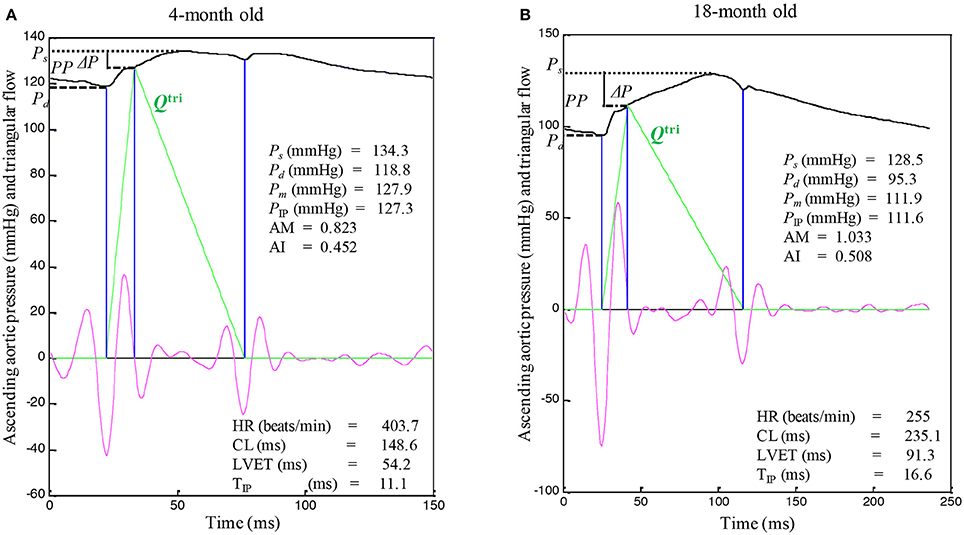
Figure 3. An uncalibrated triangular flow (Qtri) derived from the measured aortic pressure wave in rats aged 4 (A) and 18 months (B). The 4-month old rat is the same one as shown in Figure 1. Only the pressure signal was recorded in the ascending aorta under the anesthetized, closed-chest condition. AM, augmentation magnitude, given by ΔP/(PP − ΔP); AI, augmentation index, given by ΔP/PP; CL, cardiac cycle length; HR, basal heart rate; LVET, left ventricular ejection time; Ps, systolic pressure; Pd, diastolic pressure; Pm, mean aortic pressure; PP, pulse pressure; PIP, pressure at inflection point; ΔP, given by Ps − PIP; TIP, time to inflection point.
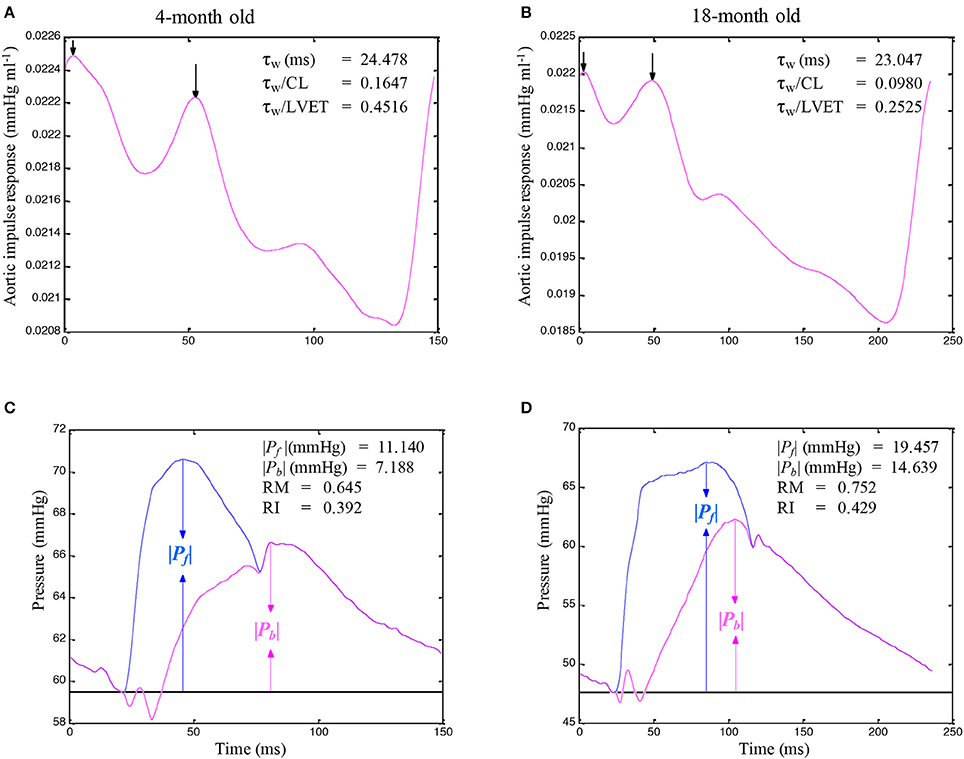
Figure 4. Impulse response function curve obtained from the measured aortic pressure and an assumed triangular flow (Qtri) in the same rats aged 4 (A) and 18 (B) months, which are shown in Figure 3. The Pf and Pb waves for the corresponding rats aged 4 (C) or 18 (D) months are also depicted. In C and D, the amplitudes (peak - trough) of the Pf and Pb are represented by ∣Pb∣ and ∣Pf∣, respectively. CL, cardiac cycle length; LVET, left ventricular ejection time; Pf, forward pressure wave; Pb, backward pressure wave; RM, wave reflection magnitude, given by ∣Pb∣/∣Pf∣; RI, wave reflection index, given by ∣Pb∣/(∣Pf∣ + ∣Pb∣); τw, wave transit time.
Figures 5, 6 illustrate the effect of aging on the arterial wave properties in terms of the AM, AI, RM, and RI as well as the τw/LVET ratio. The AM (Figure 5A) and AI (Figure 5B) increased markedly in the 18-month-old rats compared with those in the 4- and 6-month-old rats. Moreover, the rats aged 18 months had significantly higher RM (Figure 6A) and RI (Figure 6B) values than did the rats aged 4 and 6 months. Although, the arterial τw did not change significantly as the rats aged (Table 2), the τw/LVET ratio was markedly lower in the 18-month-old rats than in the 4- and 6-month-old rats (Figure 6C).
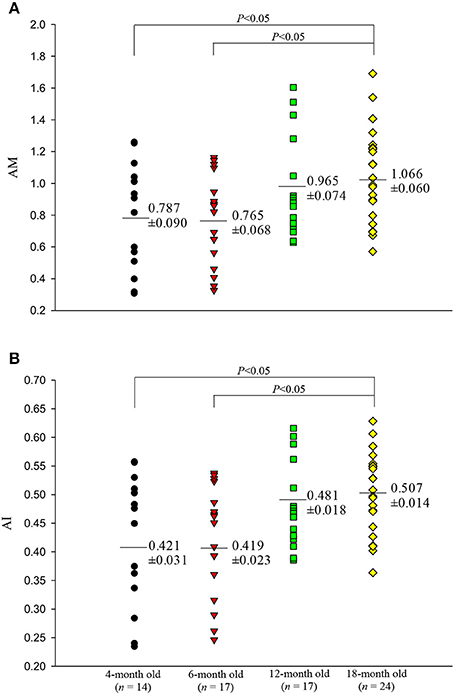
Figure 5. Effects of aging on augmentation magnitude AM (A) and augmentation index AI (B). The rats aged 18 months had significantly higher AM and AI than did those aged 4 and 6 months.
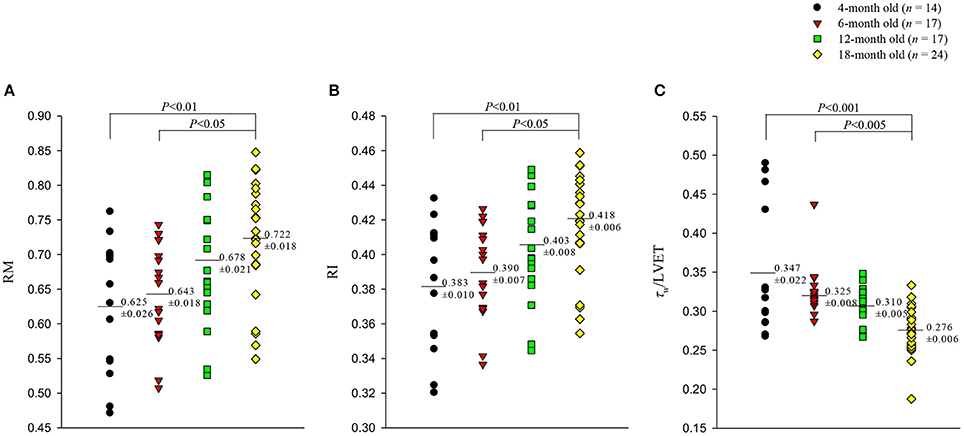
Figure 6. Effects of aging on wave reflection magnitude RM (A), wave reflection index RI (B), and the ratio of wave transit time (τw) to left ventricular ejection period (LVET) (C). The rats aged 18 months had significantly higher RM and RI than did those aged 4 and 6 months. Moreover, the τw/LVET ratio was markedly lower in the 18-month-old rats than in the 4- and 6-month-old rats.
Figure 7A illustrates relation between AI and τw/LVET, and Figure 7C depicts that between AI and RI, which were calculated from the measured aortic pressure and an assumed Qtri. Figure 7A exhibits a significant inverse regression line for AI: AI = −0.7424 − 0.9026 × (τw/LVET) (r = 0.4901; P < 0.0001). The regression equation of AI is given by AI = −0.4844 + 2.3634 × RI (r = 0.8423; P < 0.0001), and it is provided in Figure 7C. Figure 7B depicts relationship between PP and τw/LVET, and Figure 7D presents that between PP and RI. Figure 7B depicts an inverse regression line given by PP = 44.0011 − 59.6778 × (τw/LVET) (r = 0.5179; P < 0.0001). The regression equation of PP is PP = 1.8636 + 59.0396 × RI (r = 0.3363; P < 0.005), and it is provided in Figure 7D.
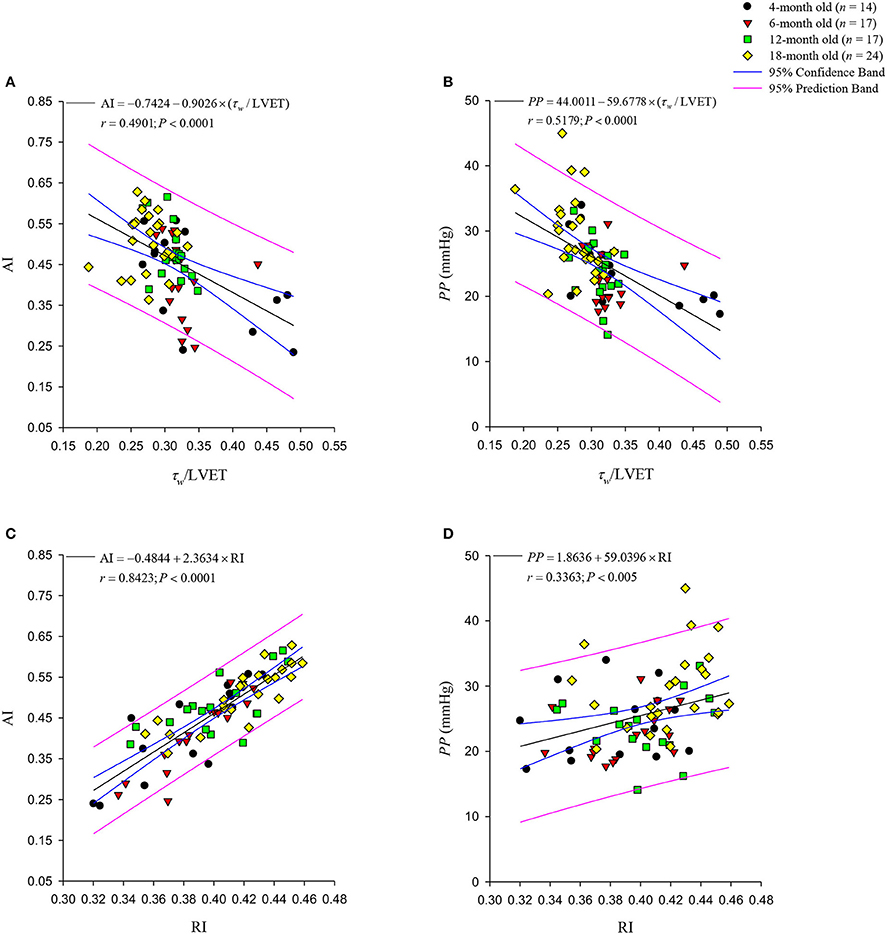
Figure 7. Relationships between the augmentation index (AI) and the ratio of wave transit time (τw) to left ventricular ejection time (LVET) (A) and wave reflection index RI (C). The aortic AI was significantly inversely related to the τw/LVET ratio. By contrast, the RI and the aortic AI were directly related. In (B), the pulse pressure (PP) shows a negative linear correlation with the τw/LVET ratio. The positive regression line of PP with RI is depicted in (D). The aortic AI had a closer correlation with the RI than the PP did.
Figure 8 illustrates relation between Pms/Pmd and τw/LVET, which exhibits a significant inverse regression line for Pms/Pmd: (Pms/Pmd) = 1.1395 − 0.2030 × (τw/LVET) (r = 0.4807; P < 0.0001). However, the Pms/Pmd ratio has no correlation with the RI.
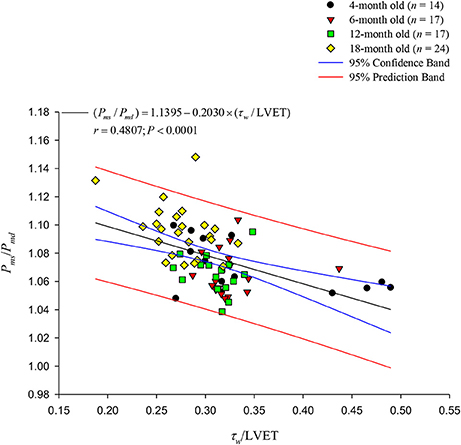
Figure 8. Relationship between the Pms/Pmd ratio and the τw/LVET ratio. The aortic Pms/Pmd ratio was significantly inversely related to the τw/LVET ratio. LVET, left ventricular ejection time; Pmd, mean diastolic pressure; Pms, mean systolic pressure; τw, wave transit time.
Discussion
Earlier studies on the age-related changes of arterial mechanical properties in different species have shown that considerable changes occur in response to age. In humans, Gundel et al. (1981) measured the aortic pressure and flow signals to calculate Zi and Zc, demonstrating no relationship between age and Zc. By contrast, Nichols et al. (1985) reported that aging process increased the steady and pulsatile components of the hydraulic load and the arterial wave reflections returned earlier with increasing age. However, Cox (1977) measured the carotid elastic modulus in rats of different ages, and suggested that the aging heart was somewhat compensated by a decrease in hydraulic load. In the present study, the older rats exhibited increased arterial stiffness and magnitude of the reflected pressure wave, which enhanced the systolic workload on the heart and contributed to a mismatch between the myocardial oxygen demand andsupply.
In this study, the older rats exhibited a decline in HR and a prolongation in LVET. The decline in HR with age has also been described in other studies on rats (Bunag et al., 1990; Bunag and Teravainen, 1991). In the current study, significant declines in Pd and Pm but not Ps were observed in the 18-month-old rats. Although not reaching statistical significance, the rats aged 18 months had lower Ps than did the rats in the other age groups. The age-induced decline in the aortic pressure profile in the rats was consistent with the results of a previous report by Bunag et al. (1990).
The pulse wave velocity and traveling distance of pressure waves to reflection sites are the determinants of arterial τw. In this study, we analyzed the aortic impulse response to calculate the arterial τw and found that the calculation of arterial τw was influenced by the CL (Figures 4A,B). Although the arterial τw did not change significantly as animals aged (Table 2), the τw/CL ratio was significantly lower in the rats aged 18 months than in the rats aged 4 and 6 months but not in those aged 12 months. The decreased τw/CL ratio indicated a decline in the distensibility of the aorta in rats with advancing age. In the absence of any significant change in the ∣Pf∣, the significant rise in the ∣Pb∣ in senescence (Table 2) was responsible for the increased RM (Figure 6A) and RI (Figure 6B). Both the arterial RM and RI augmented by age in turn increased the intensity of the wave reflection from the peripheral circulation in the older rats.
For the calculation of AM and AI, defining an inflection point on the aortic pressure waveform is imperative (Westerhof et al., 2006; London and Pannier, 2010). In this study, the inflection point was identified by the first zero-crossing curve from positive to negative on the fourth derivative of the pressure signal during ventricular ejection (Kelly et al., 1989; Westerhof et al., 2006; Chang et al., 2017). With the inflection point determined, we found that the rats aged 18 months had higher ΔP values than did those in other age groups. Although PP also increased as the rats aged, the increased ΔP dominated the increased PP, leading to an augmentation in aortic AM and AI.
From the definition, AI depends on the overlap between the Pf and the Pb, which is determined by both the timing and magnitude of the reflected pressure wave (Westerhof et al., 2006; London and Pannier, 2010). The overlap between the Pf and the Pb depends on both the arterial τw and the LVET duration (London and Pannier, 2010). With a shortened τw, the reflected waves return earlier, thereby affecting the central arteries during systole rather than diastole. With a lengthened LVET, it is favorable for the reflected wave to return during systole. Thus, the decreased τw/LVET ratio may increase the overlap between the Pf and the Pb, thereby increasing the systolic workload on the heart and reducing aortic pressure during diastole (London and Pannier, 2010).
In the present study, the τw/LVET ratio was markedly smaller in the 18-month-old rats than in the rats from other age groups (Figure 6C). We found that the aortic AI was inversely affected by the arterial τw/LVET ratio; thus, the lower the arterial τw/LVET ratio, the higher the aortic AI (Figure 7A), which was consistent with those of a previous report by London and Pannier (2010). Although aging did not affect ∣Pf∣, the older rats had increased ∣Pb∣ (Table 2). Using simple linear regression analysis, we found that the aortic AI augmented by age was associated with the increased ∣Pb∣: AI = 0.2423 + 0.0192 × ∣Pb∣ (r = 0.5044; P < 0.0001), and had strong positive correlation with the RI (Figure 7C). As the arterial τw/LVET ratio decreased and the arterial RI increased with age, the aortic AI increased, thereby augmenting the systolic workload on the heart.
Similarly to AI, PP was augmented as arterial τw/LVET ratio decreased (Figure 7B) and arterial RI was increased (Figure 7D) in older rats. However, AI exhibited closer correlation with RI than PP did. These findings suggest that the aortic AI might be a better index describing the arterial wave properties than the aortic PP.
In considering the ventricular/vascular coupling, O'Rourke et al. (1984) suggested that the ascending aortic pressure wave includes two components: Pms, which is relevant to LV performance as a pump, and Pmd, which is relevant to LV perfusion. Thus, the augmented Pms/Pmd ratio may cause a mismatch between the myocardial oxygen demand and supply. In this study, the rats aged 18 months had lower Pms than did the rats in the other age groups (Table 1). Although Pmd also decreased as the rats aged, the decreased Pmd dominated the decreased Pms, leading to an increase in Pms/Pmd ratio. The Pms/Pmd ratio augmented by age was associated with the diminished τw/LVET ratio (Figure 8), suggesting that as aging stiffened aortas, the older rats were accompanied with deterioration in the myocardial oxygen demand/supply ratio.
This study has several limitations. Because Zi cannot be measured in conscious animals, evaluating the effects of pentobarbital-induced anesthesia on rats is impossible. The results reported here pertain only to the measurements made in anesthetized rats (Wu et al., 2012). This condition might have induced changes in the aortic pressure profiles and introduced reflex effects that are not observed under ordinary conditions (Wang et al., 2014a). The degree to which anesthesia influences the pulsatile hemodynamics in rats is not known with certainty. However, studies on other animals suggest that the effects are small in relation to the biological and experimental variability between animals (Cox, 1974). Moreover, the uncalibrated Qtri was constructed using the measured aortic pressure wave to approximate the corresponding flow signal. Although the Qtri is an approximation that may differ from the actual flow wave shape (Westerhof et al., 2006), the use of this concept to describe the arterial wave properties has been validated in studies by Westerhof et al. (2006) and Chang et al. (2017).
Conclusions
We determined the mechanical defects due to arterial aging on the basis of the measured aortic pressure and an assumed triangular flow. Because the ∣Pf∣ was unaltered, the increase in ∣Pb∣ enhanced the intensity of the wave reflection, thereby augmenting RI in the older rats. A reduction in the τw/CL ratio with age indicated a decline in the distensibility of the aorta, which resulted in arterial wave reflections returned earlier with increasing age. As the arterial τw/LVET ratio decreased and arterial RI increased with age, the aortic AI increased. With an increase in the Pms/Pmd ratio, the older rats were accompanied with deterioration in the myocardial oxygen demand/supply ratio. All these findings suggest that aging potentially impairs the pulsatile component of arterial mechanics, thereby increasing the systolic workload imposed on the heart.
Perspectives
Our contribution in this endeavor is to provide a path to consider the clinical application of the method estimating the arterial wave properties, based on the measured pressure alone. The advantage of the technique is that an assumed Qtri is derived from the measured pressure and that the flow calibration is not essential in the analysis. Westerhof et al. (2006) suggested that the method can also be performed using the carotid pressure wave as a surrogate for the pressure measured in the ascending aorta. The carotid pressure can be obtained non-invasively by applanation tonometry (Van Bortel et al., 2001) or by using a transfer function on finger arterial pressure (Westerhof, 2005) or radial artery pressure (Chen et al., 1997). In large epidemiological studies, it is helpful to evaluate the arterial wave properties as a function of age by using a minimally non-invasive measurement on aortic pressure alone, because the construction of the unknown Qtri, the separation of the aortic pressure waves, and the calculation of the arterial τw can be automated.
Author Contributions
CC, RC, CW, and KC developed the concept of the study, designed the experiments, and wrote the manuscript. CC, RC, and SH performed the animal experiments, collected the data, and performed statistical analysis. MW, YC, HK, and LL provided advice on the surgical procedures used in the study. CW and KC interpreted the data, supervised this work, and critically revised the manuscript. All authors have read and approved the final manuscript.
Conflict of Interest Statement
The authors declare that the research was conducted in the absence of any commercial or financial relationships that could be construed as a potential conflict of interest.
Acknowledgments
This study was supported by grants from National Taiwan University Hospital, Hsin-Chu Branch (HCH-104-004). This manuscript was edited by Wallace Academic Editing.
Abbreviations
AI, Augmentation index; AM, augmentation magnitude; CL, cardiac cycle length (ms); HR, basal heart rate (beats min−1); LVET, left ventricular ejection time (ms); Qm, measured aortic flow wave (ml s−1); Qtri, uncalibrated triangular flow wave (ml s−1); Pb, backward pressure wave (mmHg); Pd, diastolic aortic pressure (mmHg); Pf, forward pressure wave (mmHg); PIP, pressure at inflection point (mmHg); Pm, mean aortic pressure (mmHg); Pmd, mean diastolic pressure (mmHg); Pms, mean systolic pressure (mmHg); PP, pulse pressure (mmHg); Ps, systolic aortic pressure (mmHg); ΔP, Ps − PIP (mmHg); RM, wave reflection magnitude; RI, wave reflection index; TIP, time to inflection point (ms); Zc, aortic characteristic impedance (mmHg s ml−1); Zi, aortic input impedance (mmHg s ml−1); τw, wave transit time (ms).
References
Bunag, R. D., Krizsan, D., and Eriksson, L. (1990). Mediation of reflex tachycardia becomes exclusively 3-adrenergic in old Fischer 344 rats. Mech. Aging Dev. 52, 179–194.
Bunag, R. D., and Teravainen, T. L. (1991). Waning cardiovascular responses to adrenergic drugs in conscious aging rats. Mech. Aging Dev. 61, 313–326. doi: 10.1016/0047-6374(91)90063-6
Chang, K. C., Tsai, Y. F., Chow, C. Y., Peng, Y. I., and Chen, T. J. (1998). Age-related changes of arterial mechanical properties in rats: analysis using exponentially tapered T-tube model. J. Gerontol. Biol. Sci. 53A, B274–B280.
Chang, R. W., Chang, C. Y., Lai, L. C., Wu, M. S., Young, T. H., Chen, Y. S., et al. (2017). Determining arterial wave transit time from a single aortic pressure pulse in rats: vascular impulse response analysis. Sci. Rep. 7:40998. doi: 10.1038/srep40998
Chang, R. W., Chang, C. Y., Wu, M. S., Yu, H. Y., Luo, J. M., Chen, Y. S., et al. (2015). Systolic aortic pressure-time area is a useful index describing arterial wave properties in rats with diabetes. Sci. Rep. 5:17293. doi: 10.1038/srep17293
Chen, C. H., Nevo, E., Fetics, B., Pak, P. H., Yin, F. C., Maughan, W. L., et al. (1997). Estimation of central aortic pressure waveform by mathematical transformation of radial tonometry pressure. Validation of generalized transfer function. Circulation 95, 1827–1836. doi: 10.1161/01.CIR.95.7.1827
Cox, R. H. (1974). Three-dimensional mechanics of arterial segments in vitro methods. J. Appl. Physiol. 36, 381–384.
Cox, R. H. (1977). Effects of age on the mechanical properties of rat carotid artery. Am. J. Physiol. 233, H256–H263.
Franklin, S. S. (2006). Hypertension in older people: part 1. J. Clin. Hyperten. 8, 444–449. doi: 10.1111/j.1524-6175.2006.05113.x
Gundel, W., Cherry, G., Rajagopalan, B., Tan, L. B., Lee, G., and Schultz, D. (1981). Aortic input impedance in man: acute response to vasodilator drugs. Circulation 63, 1305–1314. doi: 10.1161/01.CIR.63.6.1305
Kelly, R., Hayward, C., Avolio, A., and O'Rourke, M. F. (1989). Noninvasive determination of age-related changes in the human arterial pulse. Circulation 80, 1652–1659. doi: 10.1161/01.CIR.80.6.1652
Lakatta, E. G. (1979). Alterations in the cardiovascular system that occur in advanced age. Fed. Proc. 38, 163–167.
Lakatta, E. G., and Yin, F. C. P. (1982). Myocardial aging: functional alterations and related cellular mechanisms. Am. J. Physiol. 242, H927–H941.
Latson, T. W., Yin, F. C. P., and Hunter, W. C. (1987). “The effects of finite wave velocity and discrete reflection on ventricular loading,” in Ventricular/Vascular Coupling: Clinical, Physiological, and Engineering Aspects, ed F. C. P. Yin (New York, NY: Springer-Verlag), 354–383.
Laxminarayan, S., Sipkema, P., and Westerhof, N. S. (1978). Characterization of the arterial system in the time domain. IEEE Trans. Biomed. Eng. 25, 177–184. doi: 10.1109/TBME.1978.326244
London, G. M., and Pannier, B. (2010). Arterial functions: how to interpret the complex physiology. Nephrol. Dial. Transplant. 25, 3815–3823. doi: 10.1093/ndt/gfq614
Mattace-Raso, F. U. S., Van Der Cammen, T. J. M., Hofman, A., Van Popele, N. N., Bos, M. L., Schalekamp, M. A., et al. (2006). Arterial stiffness and risk of coronary heart disease and stroke: the Rotterdam Study. Circulation 113, 657–663. doi: 10.1161/CIRCULATIONAHA.105.555235
Murgo, J. P., Westerhof, N., Giolma, J. P., and Altobelli, S. A. (1981). Manipulation of ascending aortic pressure and flow with the Valsalva maneuver: relationship to input impedance. Circulation 63, 122–132. doi: 10.1161/01.CIR.63.1.122
Najjar, S. S., Scuteri, A., and Lakatta, E. G. (2005). Arterial aging: is it an immutable cardiovascular risk factor? Hypertension 46, 454–462. doi: 10.1161/01.HYP.0000177474.06749.98
Nichols, W. W., and O'Rourke, M. F. (2011). McDonald's Blood Flow in Arteries, 6th Edn. London: Edward Arnold.
Nichols, W. W., O'Rourke, M. F., Avolio, A. P., Yaginuma, T., Murgo, J. P., and Pepine, C. J., et al. (1985). Effects of age on ventricular-vascular coupling. Am. J. Cardiol. 55, 1179–1184. doi: 10.1016/0002-9149(85)90659-9
O'Leary, D. H., Polak, J. F., Kronmal, R. A., Manolio, T. A., Burke, G. L., and Wolfson, S. K. Jr. (1999). Carotid-artery intima and media thickness as a risk factor for myocardial infarction and stroke in older adults. Cardiovascular Health Study Collaborative Research Group. N. Engl. J. Med. 340, 14–22. doi: 10.1056/NEJM199901073400103
O'Rourke, M. F. (1982). Vascular impedance in studies of arterial and cardiac function. Physiol. Rev. 62, 571–652.
O'Rourke, M. F., and Nichols, W. W. (2005). Aortic diameter, aortic stiffness, and wave reflection increase with age and isolated systolic hypertension. Hypertension 45, 652–658. doi: 10.1161/01.HYP.0000153793.84859.b8
O'Rourke, M. F., Yaginuma, T., and Avolio, A. P. (1984). Physiological and pathophysiological implications of ventricular/vascular coupling. Ann. Biomed. Eng. 12, 119–134. doi: 10.1007/BF02584226
Schleicher, E. D., Wagner, E., and Nerlich, A. G. (1997). Increased accumulation of the glycoxidation product N(epsilon)-(carboxymethyl)lysine in human tissues in diabetes and aging. J. Clin. Invest. 99, 457–468. doi: 10.1172/JCI119180
Sims, T. J., Rasmussen, L. M., Oxlund, H., and Bailey, A. J. (1996). The role of glycation cross-links in diabetic vascular stiffening. Diabetologia 39, 946–951. doi: 10.1007/BF00403914
Sipkema, P., Westerhof, N., and Randall, O. S. (1980). The arterial system characterized in the time domain. Cardiovasc. Res. 14, 270–279. doi: 10.1093/cvr/14.5.270
Sutton-Tyrrell, K., Najjar, S. S., Boudreau, R. M., Venkitachalam, L., Kupelian, V., Simonsick, E. M., et al. (2005). Elevated aortic pulse wave velocity, a marker of arterial stiffness, predicts cardiovascular events in well-functioning older adults. Circulation 111, 3384–3390. doi: 10.1161/CIRCULATIONAHA.104.483628
Van Bortel, L. M., Balkestein, E. J., van der Heijden-Spek, J. J., Vanmolkot, F. H., Staessen, J. A., Kragten, J. A., et al. (2001). Non-invasive assessment of local arterial pulse pressure: comparison of applanation tonometry and echo-tracking. J. Hypertens. 19, 1037–1044. doi: 10.1097/00004872-200106000-00007
Wang, C. H., Chang, R. W., Ko, Y. H., Tsai, P. R., Wang, S. S., Chen, Y. S., et al. (2014a). Prevention of arterial stiffening by using low-dose atorvastatin in diabetes is associated with decreased malondialdehyde. PLoS ONE 9:e90471. doi: 10.1371/journal.pone.0090471
Wang, C. H., Wu, E. T., Wu, M. S., Tsai, M. S., Ko, Y. H., Chang, R. W., et al. (2014b). Pyridoxamine protects against mechanical defects in cardiac aging in rats: studies on load dependence of myocardial relaxation. Exp. Physiol. 99, 1488–1498. doi: 10.1113/expphysiol.2014.082008
Westerhof, B. E. (2005). Blood Pressure Analysis on Time Scales From Seconds to Days (dissertation). Amsterdam: University of Amsterdam.
Westerhof, B. E., Guelen, I., Westerhof, N., Karemaker, J. M., and Avolio, A. (2006). Quantification of wave reflection in the human aorta from pressure alone: a proof of principle. Hypertension 48, 595–601. doi: 10.1161/01.HYP.0000238330.08894.17
Westerhof, N., Sipkema, P., van den Bos, G. C., and Elzinga, G. (1972). Forward and backward waves in the arterial system. Cardiovasc. Res. 6, 648–656. doi: 10.1093/cvr/6.6.648
Wu, E. T., Liang, J. T., Wu, M. S., and Chang, K. C. (2011). Pyridoxamine prevents age-related aortic stiffening and vascular resistance in association with reduced collagen glycation. Exp. Gerontol. 46, 482–488. doi: 10.1016/j.exger.2011.02.001
Keywords: aging, aortic input impedance, arterial wave property, vascular impulse response, wave reflection factor, wave transit time
Citation: Chang C-Y, Chang R-W, Hsu S-H, Wu M-S, Cheng Y-J, Kao H-L, Lai L-C, Wang C-H and Chang K-C (2017) Defects in Vascular Mechanics Due to Aging in Rats: Studies on Arterial Wave Properties from a Single Aortic Pressure Pulse. Front. Physiol. 8:503. doi: 10.3389/fphys.2017.00503
Received: 09 May 2017; Accepted: 29 June 2017;
Published: 13 July 2017.
Edited by:
Gianfranco Pintus, Qatar University, QatarReviewed by:
Huseyin Cagatay Yalcin, Dogus University, TurkeyAlberto P. Avolio, Macquarie University, Australia
Copyright © 2017 Chang, Chang, Hsu, Wu, Cheng, Kao, Lai, Wang and Chang. This is an open-access article distributed under the terms of the Creative Commons Attribution License (CC BY). The use, distribution or reproduction in other forums is permitted, provided the original author(s) or licensor are credited and that the original publication in this journal is cited, in accordance with accepted academic practice. No use, distribution or reproduction is permitted which does not comply with these terms.
*Correspondence: Chih-Hsien Wang, d2NoZW1haWxAbnR1LmVkdS50dw==
Kuo-Chu Chang, a2NjaGFuZzEwMDhAbnR1LmVkdS50dw==
 Chun-Yi Chang1
 Ru-Wen Chang
 Liang-Chuan Lai
 Kuo-Chu Chang