- 1de Duve Institute, Université catholique de Louvain, Brussels, Belgium
- 2de Duve Institute, Flow Cytometry and Cell Sorting Facility (CYTF), Brussels, Belgium
The isolation of ribonucleic acid (RNA) suitable for gene expression studies is challenging in the pancreas, due to its high ribonuclease activity. This is even more complicated during pancreatitis, a condition associated with inflammation and fibrosis. Our aim was to implement a time-effective and reproducible protocol to isolate high quality RNA from specific pancreatic cell subtypes, in normal and inflammatory conditions. We used two genetically engineered mouse models (GEMM), Ela-CreER/YFP and Sox9-CreER/YFP, to isolate acinar and ductal cells, respectively. To induce pancreatitis, mice received a caerulein treatment (125 μg/kg) for 8 and 72 h. We alternatively used EGTA and calcium buffers that contain collagenase P (0.6 mg/mL) to rapidly digest the pancreas into individual cells. Most of the cells from normal and injured pancreas were single-dissociated, exhibited a round morphology and did not incorporate trypan blue dye. Cell suspensions from Ela- and Sox9-CreER/YFP pancreas were then sorted by flow cytometry to isolate the YFP-positive acinar and ductal cells, respectively. Sorted cells kept a round shape and emitted fluorescence detected by the 38 HE green fluorescence filter. RNA was isolated by column-based purification approach. The RNA integrity number (RIN) was high in sorted acinar cell fractions treated with or without caerulein (8.6 ± 0.17 and 8.4 ± 0.09, respectively), compared to the whole pancreas fraction (4.8 ± 1.1). Given the low number of sorted ductal cells, the RIN value was slightly lower compared to acini (7.4 ± 0.4). Quantitative-PCR experiments indicated that sorted acinar and ductal cells express the specific acinar and ductal markers, respectively. Additionally, RNA preparations from caerulein-treated acinar cells were free from significant contamination with immune cell RNA. We thus validated the DIE (Digestion, Isolation, and Extraction)-RNA tool as a reproducible and efficient protocol to isolate pure acinar and ductal cells in vivo and to extract high quality RNA from these cells.
Introduction
Acute pancreatitis is among the most prevalent diseases that affect the pancreas and is a main driver for pancreatic cancer development (Yadav and Lowenfels, 2013). Acinar cells, which represent 80% of the pancreas, are mainly affected by pancreatitis (Reichert et al., 2016). In the presence of inflammation, acinar cells undergo acinar-to-ductal metaplasia, a pre-requisite for the development of pancreatic neoplasia and, possibly, pancreatic cancer in a later stage (Strobel et al., 2007; Fendrich et al., 2008; Prévot et al., 2012). However, the pathophysiology of metaplasia initiation is still incompletely understood. In this context, preclinical models of pancreatitis are of particular interest to get more insights into the underlying molecular mechanisms. Accordingly, significant advances could be made by profiling gene expression and applying deep molecular biology approaches on purely isolated acinar cells from injured pancreas.
The extraction of high quality ribonucleic acid (RNA) suitable for reproducible gene expression experiments and RNA sequencing is difficult to achieve in pancreas, compared with other organs such as skeletal muscle and liver. This is due to the exocrine function of the pancreas that produces excessive amounts of ribonucleases, as well as deoxyribonucleases and proteases. A mouse pancreas contains ~75 mg of ribonucleases, which are partly released during dissection and RNA preparation procedures. This contributes to tissue autolysis and the low quality of the resulting RNA preparations (Lenstra and Beintema, 1979). Moreover, in the presence of pancreatitis, a further decrease in RNA quality occurs. Therefore, the high enzymatic activity of the pancreas in normal and pathological conditions, constitute a serious barrier against the application of standard molecular biology approaches in pancreatology.
Our laboratory and others have previously developed specific protocols or optimized existing ones to isolate intact RNA from the pancreas. Examples of strategies adopted involve: immersion of the pancreas in RNAlater for 24 h at −80°C, ductal infusion with a pH-controlled sulfate salt solution and incubation at room temperature (RT) for 24-to-72 h, rapid storage of the pancreas in liquid nitrogen upon dissection, and use of a high phenol/guanidine-to-tissue ratio (Mullin et al., 2006; Kiba et al., 2007; Azevedo-Pouly et al., 2014; Augereau et al., 2016). Although these different methods yield satisfactory RNA quality, they still present two major limitations. Firstly, these methods only allow RNA extraction from whole pancreatic tissue and are not suitable for the preparation of RNA from a given pancreatic cell type. Secondly, their application in conditions evoking pancreatitis has not been previously tested and may probably lead to the collection of poor quality RNA.
In the present work, we describe an effective strategy to obtain RNA from specific pancreatic cell types that combines transgenic technology, flow cytometry, and cellular and molecular biology techniques. This protocol is easily undertaken, time-effective, and reproducible, enabling the isolation of pure acinar cells from mouse pancreas in both normal and acute inflammation conditions for extraction of high quality RNA with an average RNA integrity number (RIN) of 8.5. This method is also applicable to ductal cells for the isolation of RNA suitable for sensitive molecular biology applications. We thus validated the DIE (Digestion, Isolation, and Extraction)-RNA tool as a reproducible and efficient protocol to isolate pure acinar and ductal cells in vivo and subsequently extract high quality RNA.
Materials and Equipment
Animals
All procedures described below were performed with the approval of the animal welfare committee of the University of Louvain Medical School. Mice received humane care according to the criteria listed by the National Academy of Sciences. Mice used in this study were mainly maintained in an enriched CD1 background. Elastase-CreER/ROSA26Yellow Fluoresence Protein (YFP)/+ (Ela-CreER/YFP) and Sox9-CreER/YFP were obtained after breeding Ela- or Sox9-CreER males with ROSA26YFP/YFP females. Ela-CreER/YFP and Sox9-CreER/YFP were used to isolate acinar and ductal cells, respectively.
Four to 12-week-old mice were injected subcutaneously with 100 μL tamoxifen (TAM) (30 mg/mL, in corn oil) combined with a gavage of 4-hydroxytamoxifen (0.3 mg/mL, in corn oil) once a day and every other day over 5 days. Figure 1A illustrates the mechanism by which TAM induces the expression of YFP specifically in acinar or ductal cells. To induce acute pancreatitis, mice received seven intra-peritoneal injections of caerulein (125 μg/kg) per day; either for 1 day or for 2 days separated by 1 day of rest (less caerulein may be necessary depending on the genetic background of animals). Mice were sacrificed either at day 1 after the completion of the first series of injections or at day 4 following the second series of injections. The protocol was optimal when the weight of the mouse was between 20 and 25 g.
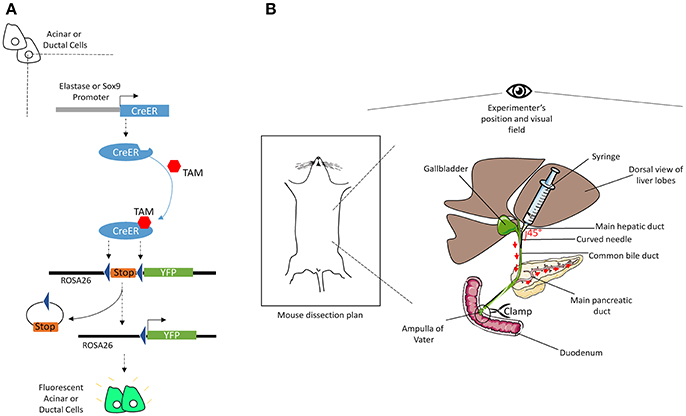
Figure 1. Illustrations of the mechanisms of CreER recombination and of common bile duct injection. (A) The elastase or Sox9 promoter located upstream of the CreER gene allows specific CreER expression in acinar or ductal cells, respectively. The presence of TAM induces Cre-mediated recombination, through its specific interaction with the ligand binding domain of the estrogen receptor (ER) coupled to the Cre. Activated CreER deletes the stop cassette inserted between the two loxP sites in the ROSA26 locus, upstream of the gene coding for YFP, via homologous recombination. Thus, YFP is specifically expressed in acinar or ductal cells. (B) After dissection, mouse's head should be placed face up the experimenter. Using two straight forceps flip the liver lobes so that the common bile duct becomes visible, from the liver to the duodenum. Clamp the intersection point of the duct with the duodenum (Ampulla of Vater). Then, delicately insert a curved needle (30 gauge) in the duct and inject 3-to-5 mL of cold Col-EGTA solution. The pancreas will blow and take a white appearance. The detailed technical procedure is provided in the text.
Reagents and Enzymes
- Agilent RNA 6000 Nano kit (5067-1512, Agilent Genomics, USA)
- Bovine serum albumin (BSA) (160069 MP, Merck, Belgium)
- Caerulein (C9026, Merck, Belgium)
- Collagenase P 500 mg (1121386500, Merck, Belgium)
- Deoxyribonucleotide (dNTP) (03622614001, Merck, Belgium)
- Dulbecco's phosphate-buffered saline (DPBS) (BE17-512F, Lonza, Belgium)
- High-capacity complementary deoxyribonucleic acid (cDNA) reverse transcription kit (4368814, Life technology Europe, Belgium)
- KAPA SYBR FAST (KK4608, Merck, Belgium)
- Nuclease-Free water (Promega, Netherlands)
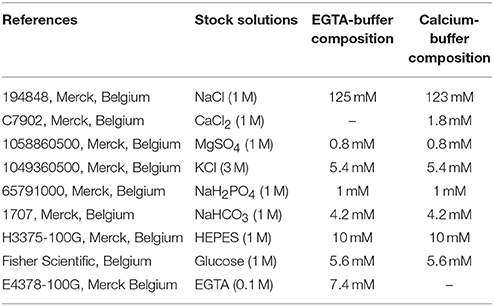
- Prepared solutions listed in Table 1
- Pure Ethanol 100% (UN1170, VWR Chemicals, Belgium)
- RNAqueous-Micro total RNA isolation kit (AM1931, Fisher Scientific, Belgium)
- RNaseOut (10777019, Life technology Europe, Belgium)
- Tamoxifen (T5648, Merck, Belgium)
- Trypan blue (T8154, Merck, Belgium)
Equipment
- 0.22 μm-filter (430758, Fisher Scientific, Belgium)
- 30-gauge needle (30400, BD Biosciences, Belgium)
- 40 μm-cell strainer (431750, Fisher Scientific, Belgium)
- 0.2, 0.5, and 1.5 mL-Sterile Eppendorf tubes (Eppendorf, Belgium)
- 15 and 50 mL-Polypropylene Falcon tubes (Fisher Scientific, Belgium)
- 250 and 500 mL-Pyrex bottles (Fisher Scientific, Belgium)
- 96-well PCR plates (HSP9655, Bio-Rad, Belgium)
- Automated cell counter (TC20, Bio-Rad, Belgium)
- Cell sorter machine with water bath (FACS ARIAIII, BD Biosciences, Belgium)
- CFX96 real-time PCR machine (C1000, Bio-Rad, Belgium)
- Fluorescence microscope (Axiovert 200, Zeiss, Belgium)
- Incubator at 37°C with a rotating plate (Eppendorf, Belgium)
- Magnetic bar and agitator
- Nanodrop spectrophotometer (ND-1000, Isogen, Belgium)
- Nuclease-free tips and pipettes (Westburg, Netherlands)
- Optical microscope (Axiovert 40C, Zeiss, Belgium)
- Pyrex beaker (Fisher Scientific, Belgium)
- RNA BioAnalyzer system (Agilent 2100, Agilent Genomics, Belgium)
- Sterile dissection tools (i.e., scissors, forceps, and clamps) (Fine Science Tools, Germany)
- Sterile Petri dishes (Fisher Scientific, Belgium)
- Thermo-cycler machine (T100, Bio-Rad, Belgium)
Reagent Set-up
► Prepare stock solutions listed in Table 1, by dissolving the required amount of powder in distilled water.
► Autoclave all solutions (30 min, 120°C) and pass them through a 0.22 μm-filter. Solutions can then be stored at room temperature (RT) for up to 6 months or until the formation of crystal precipitates.
► The day before the experiment, prepare EGTA- and calcium-buffers separately in Pyrex beakers (see Table 1).
► Place EGTA- and calcium-buffers on an agitator and add BSA powder (0.5%). The complete dissolution may take 20 min.
► Adjust the pH of both buffers to 7.4 and filter them through a 0.22 μm-filter. Store buffers at 4°C overnight (it is recommended to always use fresh buffers).
► Dispense collagenase P powder into aliquots of 12 mg in Falcon polypropylene tubes (50 mL). Two aliquots are needed per mouse.
► The day of experiment, dissolve one aliquot of collagenase P in 20 mL of EGTA-buffer and another in 20 mL of calcium-buffer, to obtain 0.6 mg/mL collagenase-EGTA (Col-EGTA) and collagenase-calcium (Col-Ca2+) buffers, respectively.
► Keep Col-EGTA and Col-Ca2+ buffers on ice, until proceeding to dissection.
► In a 50 mL-Falcon tube, prepare a solution of EGTA-buffer containing RNaseOut (20 U/mL) and store at 4°C. This solution will be called “sorting buffer” in the protocol.
Equipment Set-up
► Before proceeding to dissection, turn on the incubator to stabilize the temperature at 37°C.
► Take 5 mL of Col-EGTA buffer with a 10 mL-syringe.
► Draw through a 30-gauge needle into the syringe.
► Curve the needle carefully with your finger to obtain an angle of ~45°. This will make injection easier.
► Close the plug and keep the syringe on ice.
Stepwise Procedure
Common Bile Duct Injection • TIME 10 Min
The Figure 1B shows a scheme of the main steps of injection and provides an overview of the procedure before application.
A stereoscopic microscope, although not essential, can help to perform this step.
(1) Kill the mouse by cervical dislocation and directly decapitate the animal using standard sharp scissors.
(2) Make an incision at the bottom of the abdomen (near the genital parts, for a male mouse, or the equivalent place for a female mouse), then open the thoracic cavity and remove the ribcage.
(3) Turn over the liver lobes so you can have a dorsal view of them. The common bile duct will appear as a white tube coming out of the liver to the duodenum.
(4) Hold the duodenum using a ring forceps and block the intersection point (resembling a white spot) between the common duct and the duodenum with a clamp.
(5) Position the clamp near the genital region to create tension on the duct and facilitate the injection.
(6) Take straight forceps with fine tips in one hand and a syringe with a curved needle containing EGTA-buffer in the other hand.
(7) Place the forceps gently under the common bile duct to offer support and avoid duct shredding during injection.
(8) Insert the needle delicately in the duct and slowly inject 3-to-4 mL of EGTA-buffer. The pancreas distends and takes on a white color (Figures 2A,B).
(9) After injection, hold the spleen with straight forceps and remove the pancreas and spleen away from the stomach and duodenum.
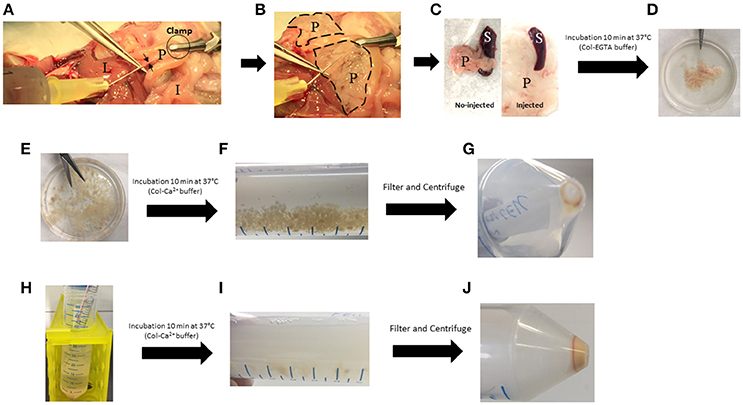
Figure 2. Key steps of the pancreas digestion protocol. (A) Injection of cold Col-EGTA buffer in the common bile duct (black arrows). (B) Pancreas (dotted lines) blows and becomes white. (C) Comparison between injected and no-injected pancreas. (D) Pancreas takes a floppy texture. (E) Pancreas is cut into small pieces. (F) Pancreas is partially digested with Col-Ca2+ buffer and small pieces are still present. (G) First pellet of dissociated cells that must be kept on ice. (H) Col-Ca2+ buffer is setback on remaining undigested pancreas. (I) Digestion solution takes a milky appearance. (J) Final pellet of cell that must be kept on ice. I, Intestine; L, Liver; P, Pancreas; S, Spleen.
Pancreas Digestion •TIME 60 Min
A detailed graphical illustration of this step can be found in supplementary data (Figure S1).
(1) In a sterile Petri dish, remove the spleen and contaminating mesenteric tissue (Figure 2C). Put the pancreas in a 50 mL-polypropylene Falcon (Tube 1) containing 10 mL of cold fresh Col-EGTA medium.
(2) Incubate Tube 1 at 37°C for 10 min with continuous shaking (200 rotations/min). Place the tube horizontally to allow better dissociation.
(3) After incubation, put the pancreas in a sterile Petri dish and cut it into small pieces of ~2 mm with scissors (Figures 2D,E).
(4) Put the pancreas back into Tube 1 and wash rapidly twice with 20 mL of sterile DPBS to remove floating adipose tissue and EGTA traces. Allow the tube to stand so pancreatic tissue can sediment.
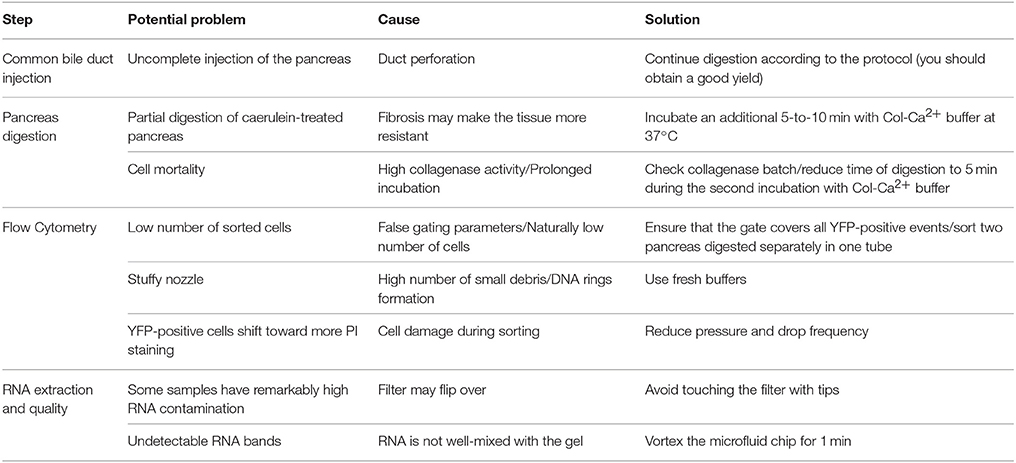
(5) Add 20 mL of fresh Col-Ca2+ buffer and incubate at 37°C for 10 min with continuous shaking (200 rotations/min). At the end of this step, pancreas fragments are still present in the solution (Figure 2F). ▴CRITICAL Use fresh Ca2+-buffer (prepared the day before the experiment) (Table 2).
(6) Filter the solution through a 40 μm-cell strainer into a new Falcon (Tube 2) and centrifuge at (500 g × 3 min at 4°C).
(7) Return the supernatant into Tube 1 with the remaining undigested pancreas fragments and keep the pellet of dissociated cells in Tube 2 on ice. Slowly put 1 mL DPBS on the pellet and rotate the Falcon gently, without disrupting the pellet. Remove DPBS, then resuspend the pellet with an additional 500 μl of fresh DPBS and keep on ice. Continue digestion at 37°C for 10 min with shaking (200 rotations/min) (Figures 2G,H).
(8) At the end of step 7, pass the solution in Tube 1 through a 40 μm-filter into Tube 2 and centrifuge at (500 g × 3 min at 4°C) (Figures 2I,J).
(9) Wash the pellet once to remove residual collagenase by suspending it with 10 mL DPBS. Centrifuge at (500 g × 3 min at 4°C).
(10) Add 20 mL of EGTA-buffer and suspend the pellet by pipetting up and down with a 10 mL-pipette. This step is optional, but results in better dissociation of the cells.
(11) Check using an optical microscope that the cells are not damaged and are well-dissociated.
(12) Centrifuge at (500 g × 3 min at 4°C), and resuspend the pellet in 1 mL of sorting buffer.
(13) ▴CRITICAL Keep the cells on ice until sorting by flow cytometry.
Cells Sorting by Flow Cytometry •TIME 60 Min
(1) Pass the cells suspension through a 35 μm-filter into a polystyrene sorting tube and add propidium iodide (PI) (2 μg/mL).
(2) Vortex briefly and load the tube into the cell sorter.
(3) Open two dot-plots: the first dot-plot shows the forward scatter (FSC) and side scatter (SSC) and the second dot-plot gives the fluorescence channels for YFP (excitation 488 nm, collection with Band-Pass filter 530/30) and PI detection (excitation 561 nm, collection with Band-Pass filter 582/15).
(4) Before the first sorting, we recommend the use of a non-YFP mouse to determine the level of auto-fluorescence and thus to easily identify the viable YFP-positive population in the Ela- or Sox9-CreER/YFP mice (and/or in the other fluorescent protein-bearing animal models used).
(5) Load the next tube from Ela- or Sox9-CreER/YFP pancreas and set a first gate to eliminate most of the debris in the FSC/SSC dot-plot. Then, perform doublet discrimination on FSC (FSC-A/FSC-W) and SSC (SSC-A/SSC-W). Ductal cells form a clearly distinct population, compared to acinar cells that tend to be more widespread. Finally, create a sorting gate around the YFP-positive cells, which should also be PI-negative.
(6) For sorting, we used the following parameters: nozzle 85 μm, pressure 45 psi, drop frequency 62 kHz and sort precision 16-32-0.
(7) Sort your cells into a 15 mL-Falcon tube that contains 3 mL of sorting buffer. When the number of sorted cells reaches ~150,000, you can stop sorting and proceed to RNA extraction.
(8) To analyze the efficiency of sorting, take a small volume of sorted cells and load into the machine. At least 75% of the cells should fall in the gate used previously for sorting.
(9) ▴CRITICAL Perform the sorting procedure at 4°C.
RNA Extraction and Quality Control •TIME 80 Min
This step has been performed by referring to the manufacturer's protocol (AM1931). However, some practical tips were added to adapt the protocol according to the number of sorted cells.
(1) Centrifuge the tube at (500 g × 5 min at 4°C) to pellet the cells.
(2) Add 100 μL of lysis buffer and pipet up and down to break the cells. If the cell number is < 50,000 cells, reduce volume of lysis buffer to 50 μL.
(3) Add 50 μL of pure 100% ethanol for each 100 μL of lysis buffer and vortex briefly.
(4) Put the lysis buffer/ethanol mixture onto the filter column and close the plug.
(5) Centrifuge at (15,000 g × 30 s at RT).
(6) Wash the filter with ethanol-based solutions: once with 180 μL of Wash 1 solution and twice with 180 μL of Wash 2/3 solution. Each washing step is followed by centrifugation at (15,000 g × 30 s at RT).
(7) To eliminate residual ethanol, centrifuge once as in step (5).
(8) Add 12 μL of pre-heated elution buffer to the filter and incubate 1 min at RT, then centrifuge at (15,000 g × 30 s at RT). Repeat step (8) once. If the cell number is < 50,000 cells, add 12 μL of pre-heated elution buffer to the filter and incubate 5 min at RT. Then centrifuge at (15,000 g × 30 s at RT).
(9) Take a small aliquot of extracted RNA (2 μL) for quantity and quality control and store the remaining solution at −80°C.
(10) Use 1 μL of extracted RNA to measure the total amount by Nano-drop spectrophotometry.
(11) For quality control, a BioAnalyzer system from Agilent Genomics was used. The BioAnalyzer from Bio-Rad is very similar in terms of chip preparation and data processing.
(12) Before starting, wash the channels of the BioAnalyzer with RNaseAway solution followed by a second wash with nuclease-free water.
(13) Start by filtering 550 μL of gel matrix through a spin filter by centrifuging at (1500 g × 10 min at RT). Divide aliquots into 65 μL and store at 4°C for up to 1 month.
(14) Add 1 μL of intercalating dye mix in 65 μL of gel matrix and vortex briefly. Centrifuge once (13 000 g × 10 min at RT).
(15) Before the end of the centrifugation, heat RNA samples and RNA ladder at 65°C for 5 min.
(16) Add the gel into the dedicated well on the chip and allow it to diffuse into all wells by applying a pressure with the priming station.
(17) To each well, add 5 μL of RNA buffer and 1 μL of RNA sample (diluted 1:2).
(18)▴CRITICAL Vortex the chip 1 min using a horizontal vortex (Table 2).
(19) Put the chip into the BioAnalyzer and start the program by choosing the “total eukaryotic RNA-Nano” option.
(20) At the end of the run the results are given in the form of electropherograms and the 28S/18S ribosomal RNA (rRNA) bands can be visible on gel-like tracks.
Anticipated Results and Discussion
Alternation between Col-EGTA and Col-Ca2+ Buffers Produces a Great Number of Live Single-Dissociated Cells in Healthy and Injured Pancreas
In the present paper, we fully describe a protocol that allows a rapid dissociation of adult pancreas, isolation of acinar or ductal cells and extraction of high quality RNA suitable for deep and sensitive molecular biology approaches. The composition of EGTA- and Ca2+- buffers used for the digestion is similar to that described by Stangé et al. for β-cells isolation (Stangé et al., 2003). However, the different steps of the digestion protocol, time and order of use of buffers, have been optimized. We tested different procedures to increase the yield of single-dissociated cells. For example, overnight digestion with cold trypsin at 4°C, as described by Li et al. (2013), produced an insufficient number of viable dissociated cells (~8 000 000 cells/pancreas) (data not shown). When we performed a collagenase (Col) digestion at 37°C with either EGTA- or Ca2+- buffer, throughout the protocol, we obtained either a low number of dissociated cells or a high number of cells still organized in clusters, respectively. We found it necessary to combine both EGTA- (Ca2+ chelator) and Ca2+-buffers in the protocol to obtain a high number of single-dissociated cells. This could be explained by the fact that Ca2+ is necessary for an optimal Col activity, while EGTA is needed to disrupt the desmosomal intercellular junctions and lead to a better dissociation of cells (Chidgey and Dawson, 2007; Tria et al., 2013). Thus, injection and incubation with a Col-EGTA buffer helps to irreversibly cleave the intercellular junctions (Neufeld, 1997). Additionally, Col at a concentration of 0.6 mg/mL will maintain a low activity in the EGTA solution, which is sufficient to tenderize the pancreas and prepare it for a rapid and efficient digestion. After the removal of EGTA, the addition of Col-Ca2+ buffer for a short time (not exceeding 20 min), results in complete pancreatic digestion (Figure 2).
Interestingly, the digestion protocol described here is applicable on both healthy and injured pancreas and may give rise to ~70-to-85% of viable cells. As depicted in Figure 3A, cells from healthy and caerulein-treated pancreas are well-dissociated and most did not incorporate trypan blue dye. Phase-contrast microscope images revealed that cells isolated from control pancreas appear larger and darker compared to those isolated from the caerulein-treated pancreas for 72 h (Figure 3B). This dark appearance could be attributed to the presence of zymogen vesicles that are lost by degranulation in injured acini (Cosen-Binker and Gaisano, 2007). However, although the dark aspect of acinar cells was also lost after 8 h of caerulein treatment, the size of the cells remained unchanged (Figure S2A). The average cell count gave 25 000 000 cells per adult pancreas in both normal and acute inflammatory conditions (Figure 3C and Figure S2B). Therefore, the protocol is efficient and reproducible, allowing the isolation of a high number of single-dissociated cells from healthy and injured pancreas.
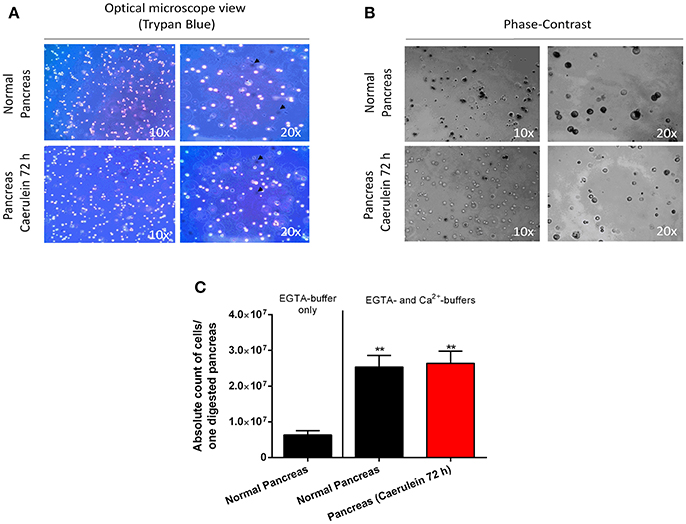
Figure 3. Assessment of cell viability, morphology, and count. (A) Cells from normal and caerulein-treated pancreas were mixed with trypan bleu dye (1:2) directly after digestion, then put in a Petri dish and visualized under an optical microscope (view 10 x and 20 x). Dead cells incorporated trypan blue and appeared dark (black arrows). (B) Phase-contrast images were taken for cells isolated from normal and caerulein-treated pancreas (view 10 x and 20 x). Cells from normal pancreas appeared larger and darker. (C) Absolute cell count was performed on 20 μL of digestion solution, using an automated hemocytometer. The EGTA-buffer only condition was shown to illustrate the low number of cells obtained when only this solution was used. Results were presented as mean ± SEM (EGTA-buffer only: n = 3; normal pancreas with EGTA- and Ca2+-buffers: n = 16; caerulein-treated pancreas 72 h with EGTA- and Ca2+-buffers: n = 17). Statistical significance was determined using a t-student test and p-values were considered statistically significant when P < 0.05 (**P < 0.01, compared to EGTA-buffer only).
Sorting by Flow Cytometry Allows the Isolation of a Given Pancreatic Cell Type and the Extraction of High Quality RNA
Previous studies have detailed protocols to isolate pancreatic endocrine and mesenchymal cells using labeling with specific antibodies and flow cytometry sorting (Dorrell et al., 2011; Epshtein et al., 2017). However, the quality of extracted RNA from sorted cells has not been clearly reported. Genetic labeling by Cre-mediated excision of loxP-stop-loxP cassettes located upstream of genes encoding fluorescent proteins has become an unavoidable tool, not only for cell lineage tracing in developmental biology studies (Lemaigre, 2015), but also to isolate a specific set of cells for further in-depth experiments. In our study, we chose the Ela-CreER/YFP and Sox9-CreER/YFP models, as Cre-mediated recombination has been shown to be restricted in these models to acinar and ductal cells, respectively (Desai et al., 2007; Kopp et al., 2011). Compared to other protocols, the use of pancreas-specific Cre driver lines and fluorescent proteins is advantageous, as it permits the sorting of cells directly after pancreas digestion, reduces the time of cell manipulation and decreases cell loss by additional washing/centrifugation steps during antibody labeling. Before starting sorting on Ela- or Sox9-CreER/YFP mice, we used a control non-YFP mouse to set the levels of auto-fluorescence and avoid the gating of contaminating cells (Figure 4A). Acinar and ductal cells from Ela- and Sox9-CreER/YFP appeared as a single population high in YFP and negative for PI staining (Figures 4B–D and Figure S2C). The total number of isolated acinar cells, treated with or without caerulein, was ~6-fold higher than ductal cells (Figures 4B–D and Figure S2C). After flow cytometry, we visualized the sorted solution under a fluorescence microscope to ensure that it contains YFP-positive cells with good morphology. As depicted in Figure 4E, sorted acinar and ductal cells exhibited a round shape in bright field and emitted fluorescence that was detected by the 38 HE green fluorescence channel.
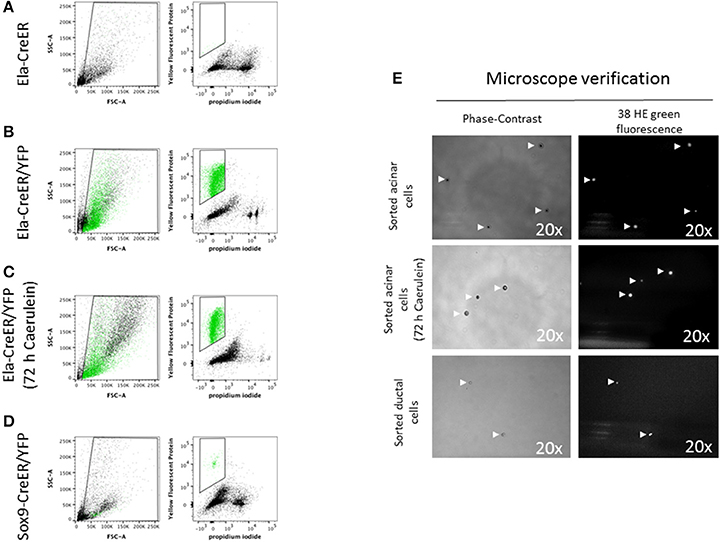
Figure 4. Flow cytometry sorting of YFP-positive acinar and ductal cells. (A–D) In the left panels, the designed window excludes debris and selects events that were distributed according to their internal content (e.g., granularity) and size on the SSC-A and FSC-A axes, respectively. In the right panels, events were represented according to their level of YFP and PI staining. YFP-positive events were marked in green. (A) The sorting gate was empty as the mouse used has a non-YFP Ela-CreER genotype. (B,C) Acinar cells from Ela-CreER/YFP mice, treated or not with caerulein, appeared in green within the sorting gate. The SSC-A/FSC-A panels indicated that untreated acinar cells possessed a somehow higher level of SSC-A compared to caerulein-treated cells. This was perhaps due to zymogene vesicles degranulation in the caerulein-treated group. (D) Ductal cells from Sox9-CreER/YFP mice appeared within the sorting window, but the number of gated cells was ~6-fold lower compared to sorted acinar cells. Additionally, as shown by the SSC-A/FSC-A panel, ductal cells exhibited a lower level of SSC-A compared to untreated and caerulein-treated acinar cells, which could reflect the less complex intracellular architecture of ductal cells. (E) After flow cytometry, a small volume of the sorting solution was subjected to microscope analysis. To check the morphology of the cells, images were taken using a phase-contrast objective (view 20 x). Indeed, ductal cells diameter appeared smaller than that of acinar cells. To verify that the sorted cells were YFP-positive, the emitted fluorescence was collected using a 38 HE green fluorescence channel (excitation line 470/40 nm, collection with Band-Pass filter 525/50 nm) (view 20 x).
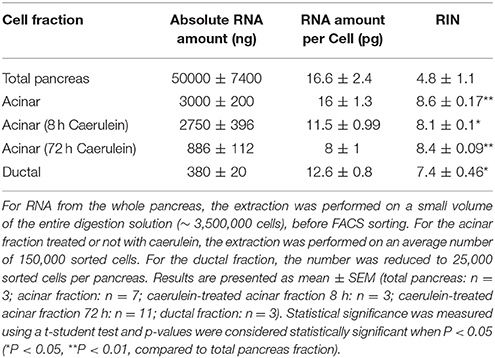
After RNA extraction, we observed that the quality of RNA obtained from total pancreatic digestion before cell sorting was poor as evidenced by the presence of a smear throughout the gel-like track and low intensity of the 28S rRNA band (Figure 5A). By contrast, gel-like tracks corresponding to RNA extracted from sorted acinar and ductal cells indicated higher RNA quality, with the 28S rRNA band two times more intense than the 18S rRNA band (Figures 5B–D). The electropherogram provides interesting information about the quality of RNA. Indeed, an elevated baseline (above the green line) and a very low height in the 28S rRNA peak are strong indicators of RNA degradation (Schroeder et al., 2006). Based on these features, the bio-analyzer attributes for each sample a RIN value between 1 (completely degraded) and 10 (intact). Usually, RNA samples with a RIN between 6.9 and 9.5 are suitable for gene expression experiments. Interestingly, electropherograms of acinar and ductal cell fractions were tangent to the green line and presented less parasite peaks compared with the total pancreas fraction (Figure 5). The height of the 28S rRNA peak was slightly lower compared with 18S rRNA in sorted acinar and ductal fractions, indicating a weak level of degradation. However, the electropherogram profiles for both acinar and ductal fractions are typical to samples with a RIN of 8 (Schroeder et al., 2006).
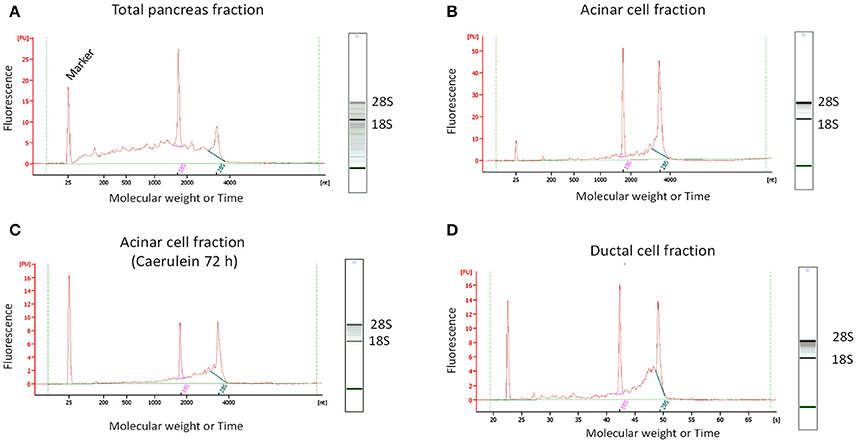
Figure 5. Determination of RNA quality by micro-electrophoresis. For standardized RNA quality control, 1 μL of total extracted RNA was added to each well in a twelve-well microfluidic chip. The wells were filled with gel containing an intercalating dye that allows RNA detection by a laser-induced fluorescence method. The results were then visualized as gel-like tracks and electropherograms (Y-axis: Fluorescence intensity and X-axis: Molecular weight or Time). (A) RNA from total pancreatic fraction was of poor quality, as electropherogram showed an elevated baseline (above the green line) and the gel-like track revealed the presence of a smear and low 28S rRNA band intensity. (B–D) The quality of RNA from sorted acinar and ductal fractions was significantly higher compared to total pancreas fraction. Indeed, electropherograms were tangent to the green line and the gel-like tracks appear to be smear-free.
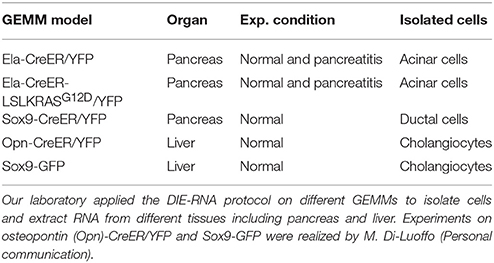
We found that 150 000 sorted acinar cells were sufficient to obtain ~3 μg of total RNA with a RIN value of 8.5. Pancreatitis is usually associated with edema and fibrosis (Sparmann et al., 1997), which could limit the extraction of high quality RNA. An important finding of this study is that the quality of RNA from caerulein-treated mice for 8 and 72 h, respectively, was similar to that of untreated mice (Table 3). However, we found a time-dependent decrease in RNA quantity in caerulein-treated groups compared to control. For ductal cells, we sorted ~25 000 cells per pancreas and extracted ~350 ng of RNA with a RIN value of 7.4 (Table 3). In fact, we observed a proportional relationship between the number of sorted cells and the quality of RNA extracted from these cells. Thus, when two pancreata were digested separately and then sorted in one tube, the RIN value of RNA extracted from ductal cells (55 000 cells) climbed to 8 (data not shown). Together, the data indicate that flow cytometry sorting allows work on a population of live acinar or ductal cells free from extracellular matrix, fragmented cell membranes, and other contaminating material favoring the extraction of high quality RNA. The approach could be used to isolate cell subtypes from other organs. Table 4 lists the models in which the DIE-RNA protocol was tested by our laboratory.
Isolated Acinar and Ductal Cells Are Free from Significant Contamination by Other Cell Types and Exhibit the Expected Biological Responses
Next, we investigated whether the sorted fractions were enriched in acinar and ductal cells. For this purpose, a reverse transcriptase reaction on 100 ng of extracted RNA from acinar or ductal cells was performed using the high-capacity cDNA reverse transcription kit. Real-time quantitative PCR (qPCR) analysis was then undertaken on the neo-synthetized cDNA with the KAPA SYBR FAST mix. The relative expression of specific acinar and ductal markers was normalized to housekeeping genes (Actb, Gapdh, Rpl4, and Rpl19) and calculated using the ΔΔCt method. The primers used are listed in Table S1.
As anticipated, high expression of acinar markers such as Amy2a5, Ctrc, and Cela1 was observed in acinar RNA preparations, compared with ductal markers (Figure 6A). Conversely, the expression of ductal markers like Sox9, Hnf1b, and Onecut1 was much higher in the ductal RNA preparations (Figure 6A). We determined how caerulein treatment affects the expression profile of acinar markers in sorted acinar cells from caerulein-treated Ela-CreER/YFP mice. After 8 h of caerulein injections, the expression of acinar markers, with the exception of Ctrc, tended to decrease compared with control but was not statistically significant (Figure 6B). In contrast, the expression of Amy2a5, Ctrc, Cela1, and Bhlha15 was strongly decreased at 72 h of caerulein treatment (Figure 6B). This result was expected, as early acinar-to-ductal metaplasia induced by caerulein were associated with a decrease in the expression of acinar markers (Prévot et al., 2012; Dey et al., 2014). As caerulein-induced pancreatitis is associated with infiltration of immune cells, we tested whether the sorted acinar cells were contaminated with this population. We measured the expression of well-known immune cell markers [CD3e (CD3), Itgam (CD11b), and Ptprc (CD45)] by RTqPCR and compared their expression level in the total pancreas fraction before sorting and in sorted acinar cells after 8 h of caerulein treatment. We demonstrated that the expression of CD3e, Itgam, and Ptprc was 4-to-5-fold lower in sorted acinar cells (Figure 6C). The low levels of CD3e, Itgam, and Ptprc observed in sorted acinar cells, could be due to the ability of acini to express these markers at the mRNA level in response to injury (De Dios et al., 2005). Therefore, together the data presented suggest that isolated acinar and ductal cell fractions were of high purity.
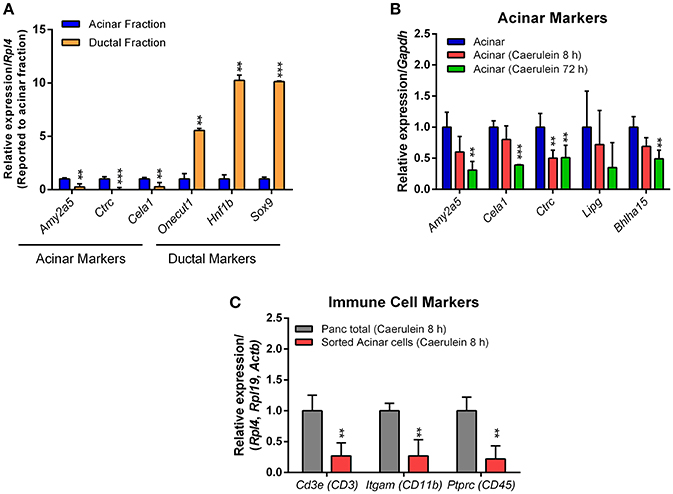
Figure 6. Expression of acinar, ductal, and immune cell markers by RTqPCR. The qPCR reaction was carried out in a final volume of 10 μL, containing: 5 μL of KAPA SYBR FAST mix, 1 μL of primers (10 μM each), 1 μL of cDNA and 3 μL of nuclease-free water. (A) For acinar cells, four different samples sorted from the pancreas of Ela-CreER/YFP mice were analyzed in duplicate on a 96-well opaque PCR plate. For ductal cells, one sample obtained from the pancreas of Sox9-CreER/YFP mouse and one other sample obtained from the combination of two pancreas of Sox9-CreER/YFP mice were analyzed in duplicate on the same PCR plate. The expression of target genes was normalized to the reference gene Rpl4. (B) Sorted acinar cells obtained from four untreated Ela-CreER/YFP mice and acinar cells sorted from three caerulein-treated Ela-CreER/YFP mice at 8 and 72 h were analyzed in duplicate on the same PCR plate. The expression of target genes was normalized to the reference gene Gapdh. (C) Measurement of immune cell markers was performed in duplicate on three total pancreas fractions before sorting and three sorted acinar fractions, after 8 h of caerulein treatment. Given the variability between total pancreas and sorted acinar cell fractions, the expression of target genes was normalized to three housekeeping genes (Actb, Rpl4, and Rpl19). Results were presented as mean ± SEM (Untreated acinar fraction: n = 4; caerulein-treated total pancreas fraction 8 h: n = 3; caerulein-treated acinar fraction 8 h: n = 3; caerulein-treated acinar fraction 72 h: n = 3 and ductal fraction: n = 3). Statistical significance was tested using a t-student test and p-values were considered statistically significant when P < 0.05 (**P < 0.01, ***P < 0.001, compared to untreated acinar fraction or caerulein-treated total pancreas fraction 8 h).
Conclusion, Strengths, and Limitations
In summary, the protocol described allows a rapid and efficient digestion of pancreas into single-dissociated cells, the sorting of pure acinar and ductal fractions and the preparation of high quality RNA suitable for sensitive gene expression experiments such as RNA sequencing and microarray. A significant advantage of the protocol is that it can also be applied without modifications to injured pancreas, even in the presence of an oncogenic insult of KRASG12D mutation (data not shown). The protocol is short and reproducible (n = 40 RNA preparations) and can be carried out on other organs, such as liver. In addition, Ela- or Sox9-CreER/YFP mice are models currently available in many laboratories. One of the limitations of this study is the low number of sorted cells for some cellular subsets, such as pancreatic ductal cells. Therefore, in this case, the combination of cells from two or more pancreata could be necessary. We note that 50 000 sorted cells is the minimum threshold that should be reached to obtain a sufficient quantity of high quality RNA. Another limitation is the efficiency of Cre recombination that may vary according to responsiveness of mice to TAM and the model of Cre driver lines. A last limitation results from the time that flows (~2 h) between the moment when the mice are sacrificed and the cells are lysed. During this time, the cells are under stress resulting from the isolation procedure. This stress could lead to changes in the expression levels of transcripts. When analyzing results, the researcher must be aware of this possibility, although it is expected that these changes are identical between samples being compared. Overall, the present protocol facilitates the isolation of different cellular subsets for comparative analyses. This is important to detect limited but significant biological responses that could be drowned or be undetectable when measurements are performed on whole pancreatic tissue.
Author Contributions
MA and PJ designed this work; MA performed all experiments, drafted, and revised the manuscript; MA and ND performed flow cytometry experiments; MA, ND, and PJ interpreted the data; PJ critically revised the paper; PJ supervised this work. All authors approve the final version of this manuscript.
Funding
This study was supported by the de Duve Institute and the Fondation contre le Cancer (Belgium). MA is recipient of a de Duve Institute postdoctoral fellowship award. PJ is Senior Research Associate at the FRS-FNRS (Belgium).
Conflict of Interest Statement
The authors declare that the research was conducted in the absence of any commercial or financial relationships that could be construed as a potential conflict of interest.
Acknowledgments
The authors thank Mourad El Kaddouri for his help in mouse care, Mark Rider for his comments on the manuscript and Elsa Ghurburrun for her technical help in the first experiments of collagenase injection. We also thank Doris Stoffers and Maike Sander for providing Ela-CreER and Sox9-CreER mice, and Louis Collet for generating Sox9-CreER/YFP mice.
Abbreviations
Actb, Beta Actin gene; Amy2a5, Amylase gene; Bhlha15, Mist1 gene; Ca2+, Calcium; Cd3e: CD3 gene; Cela1, Elastase gene; Col, Collagenase; cDNA, Complementary deoxyribonucleic acid;Ctrc, Chymotrypsin gene; DNA, Deoxyribonucleic acid; DPBS, Dulbecco's phosphate-buffered saline; EGTA, Ethylene glycol-bis(beta-aminoethyl ether)-N,N,N',N'-tetraacetic acid; Ela, Elastase; FSC, Forward scatter; Gapdh, Glyceraldehyde-3-phosphate dehydrogenase; GEMM, Genetically engineered mouse models; GFP, Green fluorescent protein; Hnf, Hepatocyte nuclear factor; Itgam, CD11b gene; Lipg, Lipase gene; Opn, Osteopontin; PanIN, Pancreatic intraepithelial neoplasia; PCR, Polymerase chain reaction; PI: propidium iodide; RNA, Ribonucleic acid; rRNA, Ribosomal RNA; RIN, RNA integrity number; Rpl4, Ribosomal protein L4; Rpl19, Ribosomal protein L19; Sox9, SRY (sex determining region Y)-box 9; SSC, Side scatter; TAM, Tamoxifen; YFP, Yellow fluorescent protein.
Supplementary Material
The Supplementary Material for this article can be found online at: https://www.frontiersin.org/articles/10.3389/fphys.2018.00129/full#supplementary-material
Table S1. List of primers used for RTqPCR analysis.
Figure S1. Detailed graphical illustration of pancreas digestion protocol.
Figure S2. Application of DIE-RNA protocol on caerulein-treated mice for 8 h. (A) Phase-contrast images were taken for cells isolated from caerulein-treated pancreas (view 10 x and 20 x). (B) Absolute cell count was performed on 20 μL of digestion solution, using an automated hemocytometer. The EGTA-buffer only condition is shown to illustrate the low number of cells obtained when only this solution is used. Results were presented as mean ± SEM (EGTA-buffer only: n = 3; caerulein-treated pancreas 8 h with EGTA- and Ca2±-buffers: n = 3). Statistical significance was determined using a t-student test and p-values were considered statistically significant when P < 0.05 (**P < 0.01, ***P < 0.001 compared to EGTA-buffer only) (C) Flow cytometry sorting of YFP-positive events.
References
Augereau, C., Lemaigre, F. P., and Jacquemin, P. (2016). Extraction of high-quality RNA from pancreatic tissues for gene expression studies. Anal. Biochem. 500, 60–62. doi: 10.1016/j.ab.2016.02.008
Azevedo-Pouly, A. C., Elgamal, O. A., and Schmittgen, T. D. (2014). RNA isolation from mouse pancreas: a ribonuclease-rich tissue. J. Vis. Exp. 90:e51779. doi: 10.3791/51779
Chidgey, M., and Dawson, C. (2007). Desmosomes: a role in cancer? Br. J. Cancer 96, 1783–1787. doi: 10.1038/sj.bjc.6603808
Cosen-Binker, L. I., and Gaisano, H. Y. (2007). Recent insights into the cellular mechanisms of acute pancreatitis. Can. J. Gastroenterol. 21, 19–24.
De Dios, I., Ramudo, L., Alonso, J. R., Recio, J. S., Garcia-Montero, A. C., and Manso, M. A. (2005). CD45 expression on rat acinar cells: involvement in pro-inflammatory cytokine production. FEBS Lett. 579, 6355–6360. doi: 10.1016/j.febslet.2005.10.017
Desai, B. M., Oliver-Krasinski, J., De Leon, D. D., Farzad, C., Hong, N., Leach, S. D., et al. (2007). Preexisting pancreatic acinar cells contribute to acinar cell, but not islet beta cell, regeneration. J. Clin. Invest. 117, 971–977. doi: 10.1172/JCI29988
Dey, P., Rachagani, S., Vaz, A. P., Ponnusamy, M. P., and Batra, S. K. (2014). PD2/Paf1 depletion in pancreatic acinar cells promotes acinar-to-ductal metaplasia. Oncotarget 5, 4480–4491. doi: 10.18632/oncotarget.2041
Dorrell, C., Grompe, M. T., Pan, F. C., Zhong, Y., Canaday, P. S., Shultz, L. D., et al. (2011). Isolation of mouse pancreatic alpha, beta, duct and acinar populations with cell surface markers. Mol. Cell. Endocrinol. 339, 144–150. doi: 10.1016/j.mce.2011.04.008
Epshtein, A., Sakhneny, L., and Landsman, L. (2017). Isolating and analyzing cells of the pancreas mesenchyme by flow cytometry. J. Vis. Exp. 119:55344. doi: 10.3791/55344
Fendrich, V., Esni, F., Garay, M. V., Feldmann, G., Habbe, N., Jensen, J. N., et al. (2008). Hedgehog signaling is required for effective regeneration of exocrine pancreas. Gastroenterology 135, 621–631. doi: 10.1053/j.gastro.2008.04.011
Kiba, T., Kintaka, Y., Nakada, E., Suzuki, Y., Inoue, S., and Ishigaki, Y. (2007). High-quality RNA extraction from rat pancreas for microarray analysis. Pancreas 35, 98–100. doi: 10.1097/01.mpa.0000278690.93930.b6
Kopp, J. L., Dubois, C. L., Schaffer, A. E., Hao, E., Shih, H. P., Seymour, P. A., et al. (2011). Sox9+ ductal cells are multipotent progenitors throughout development but do not produce new endocrine cells in the normal or injured adult pancreas. Development 138, 653–665. doi: 10.1242/dev.056499
Lemaigre, F. P. (2015). Determining the fate of hepatic cells by lineage tracing: facts and pitfalls. Hepatology 61, 2100–2103. doi: 10.1002/hep.27659
Lenstra, J. A., and Beintema, J. J. (1979). The amino acid sequence of mouse pancreatic ribonuclease. Extremely rapid evolutionary rates of the myomorph rodent ribonucleases. Eur. J. Biochem. 98, 399–408.
Li, D., Peng, S. Y., Zhang, Z. W., Feng, R. C., Li, L., Liang, J., et al. (2013). Complete disassociation of adult pancreas into viable single cells through cold trypsin-EDTA digestion. J. Zhejiang Univ. Sci. B 14, 596–603. doi: 10.1631/jzus.B1200226
Mullin, A. E., Soukatcheva, G., Verchere, C. B., and Chantler, J. K. (2006). Application of in situ ductal perfusion to facilitate isolation of high-quality RNA from mouse pancreas. BioTechniques 40, 617–621.
Neufeld, D. S. (1997). Isolation of rat liver hepatocytes. Methods Mol. Biol. 75, 145–151. doi: 10.1385/0-89603-441-0:145
Prévot, P. P., Simion, A., Grimont, A., Colletti, M., Khalaileh, A., Van den Steen, G., et al. (2012). Role of the ductal transcription factors HNF6 and Sox9 in pancreatic acinar-to-ductal metaplasia. Gut 61, 1723–1732. doi: 10.1136/gutjnl-2011-300266
Reichert, M., Blume, K., Kleger, A., Hartmann, D., and von Figura, G. (2016). Developmental pathways direct pancreatic cancer initiation from its cellular origin. Stem Cells Int. 2016:9298535. doi: 10.1155/2016/9298535
Schroeder, A., Mueller, O., Stocker, S., Salowsky, R., Leiber, M., Gassmann, M., et al. (2006). The RIN: an RNA integrity number for assigning integrity values to RNA measurements. BMC Mol. Biol. 7:3. doi: 10.1186/1471-2199-7-3
Sparmann, G., Merkord, J., Jäschke, A., Nizze, H., Jonas, L., Löhr, M., et al. (1997). Pancreatic fibrosis in experimental pancreatitis induced by dibutyltin dichloride. Gastroenterology 112, 1664–1672.
Stangé, G., Van De Casteele, M., and Heimberg, H. (2003). Diabetis Mellitus Methods and Protocols. Totowa, NJ: Humana Press, 18–22.
Strobel, O., Dor, Y., Alsina, J., Stirman, A., Lauwers, G., Trainor, A., et al. (2007). In vivo lineage tracing defines the role of acinar-to-ductal transdifferentiation in inflammatory ductal metaplasia. Gastroenterology 133, 1999–2009. doi: 10.1053/j.gastro.2007.09.009
Tria, S., Jimison, L. H., Hama, A., Bongo, M., and Owens, R. M. (2013). Sensing of EGTA mediated barrier tissue disruption with an organic transistor. Biosensors 3, 44–57. doi: 10.3390/bios3010044
Keywords: pancreatitis, cell isolation, flow cytometry, inflammation, pancreas, RNA quality control
Citation: Assi M, Dauguet N and Jacquemin P (2018) DIE-RNA: A Reproducible Strategy for the Digestion of Normal and Injured Pancreas, Isolation of Pancreatic Cells from Genetically Engineered Mouse Models and Extraction of High Quality RNA. Front. Physiol. 9:129. doi: 10.3389/fphys.2018.00129
Received: 13 November 2017; Accepted: 07 February 2018;
Published: 27 February 2018.
Edited by:
Peter Hegyi, University of Szeged, HungaryReviewed by:
Savio George Barreto, Medanta, The Medicity, IndiaJens Thomas Siveke, German Cancer Consortium (DKTK) Site Essen, Germany
Matthias Sendler, Universitätsmedizin Greifswald, Germany
Copyright © 2018 Assi, Dauguet and Jacquemin. This is an open-access article distributed under the terms of the Creative Commons Attribution License (CC BY). The use, distribution or reproduction in other forums is permitted, provided the original author(s) and the copyright owner are credited and that the original publication in this journal is cited, in accordance with accepted academic practice. No use, distribution or reproduction is permitted which does not comply with these terms.
*Correspondence: Mohamad Assi, bW9oYW1hZC5hc3NpQHVjbG91dmFpbi5iZQ==
Patrick Jacquemin, cGF0cmljay5qYWNxdWVtaW5AdWNsb3V2YWluLmJl
 Mohamad Assi
 Nicolas Dauguet
 Patrick Jacquemin