- College of Information Science and Engineering, Hunan Normal University, Changsha, China
Asperger syndrome (AS) is subtype of autism spectrum disorder (ASD). Diagnosis and pathological analysis of AS through resting-state fMRI data is one of the hot topics in brain science. We employed a new model called the genetic-evolutionary random Support Vector Machine cluster (GE-RSVMC) to classify AS and normal people, and search for lesions. The model innovatively integrates the methods of the cluster and genetic evolution to improve the performance of the model. We randomly selected samples and sample features to construct GE-RSVMC, and then used the cluster to classify and extract lesions according to classification results. The model was validated by data of 157 participants (86 AS and 71 health controls) in ABIDE database. The classification accuracy of the model reached to 97.5% and we discovered the brain regions with significant differences, such as the Angular gyrus (ANG.R), Precuneus (PCUN.R), Caudate nucleus (CAU.R), Cuneus (CUN.R) and so on. Our method provides a new perspective for the diagnosis and treatment of AS, and a universal framework for other brain science research as the model has excellent generalization performance.
Introduction
Asperger syndrome (AS), as a common neurological disease (Gillberg et al., 2016), has an increasing incidence (Jensen et al., 2014) and is usually considered as one of the autism spectrum disorders (ASDs; Lugnegård et al., 2015) or pervasive developmental disorder (Ghaziuddin, 2010; Bucaille et al., 2016). Typically, the patient with AS has a certain degree of cognitive empathy deficiency which is mainly manifested in the weakness of executive function and theory of mind (Montgomery et al., 2013; Oliver et al., 2016). Diagnosing and exploring the pathogenesis of AS is one of the important research fields of brain science (Lorenzo et al., 2016).
In the early exploration of AS, researchers have found that AS and ASD have some similar features including limited interest and repetition, stereotyped activity and communication difficulties (Kamp-Becker et al., 2010; Lugnegård et al., 2013; Woods et al., 2013). But some researches also have noticed the differences between ASD and AS in some aspects such as early speech development (Soulieres et al., 2011), language and intellectual (Radulescu et al., 2013). Therefore, it is necessary to conduct a separate research of AS in subsequent studies. In existing literature on AS, many researchers carried out studies of AS in different perspectives. Rueda et al. (2015) comprehensively used three international common diagnostic criteria for the diagnosis of AS, which effectively improved the stability and accuracy of the diagnostic results. Through the dual approach and voxel analysis, Roine et al. (2015b) found that the white matter (WM) structure in the brain of AS patients was abnormal, and these abnormalities were mainly concentrated in the left ILF region. Tseng et al. (2015) found that there may be structural defects in the amygdala and its related marginal structures. Roine et al. (2015a) discovered that AS had abnormalities in the right caudate and right superior temporal pole base on magnetic resonance images. Channon et al. (2014) observed the social skills of AS patients, and found that they had difficulty in dealing with daily social situations. Abnormal functional mechanisms of emotion detection and emotion differentiation in AS were also found out (Frank et al., 2018). Woodbury-Smith et al. (2005) used the Autism Spectrum Quotient as criterion for discriminating AS and normal person with accuracy of 83%. Neurological soft signs were also applied to discriminate AS and other ASD patients but the performance was unsatisfactory (Hirjak et al., 2014).
It is found that existing researches mainly concentrate on the aspects such as the pathological analysis of the partial AS lesion area (Sato et al., 2014; Di Napoli et al., 2015; Bjørklund et al., 2018), the social adaptability of AS patients (Rodger and Vishram, 2010; Channon et al., 2014; Wilson, 2015), classification of AS and normal people, or AS and other ASD patients (Hirjak et al., 2014; Schwarzová, 2018; Sung et al., 2018). But little literature carries out comprehensive analysis of AS lesions, and makes full use of the unique advantages of the increasingly popular machine learning methods in brain science.
To overcome these shortcomings, we innovatively integrates the methods of cluster and genetic evolution to improve the performance of the model, which called GE-RSVMC. In this study, we acquired functional connectivities between brain regions as sample features, and then randomly extracted samples and sample features to construct the initial SVM cluster. Next, according to the fitness function, the base classifiers in the cluster were selected, crossed and mutated so that the cluster can evolve in the direction of performance improvement. Finally, we used the evolutionary cluster to classify and explore lesions. The cluster is constructed by using multiple base classifiers to enhance the poor performance of a single classifier, and the method of genetic evolution helps to optimize the cluster in efficiency. The accuracy reached to 97.5% and the method effectively ensures the generalization performance of the cluster. The classification accuracy of the model is better than most classification methods, and the lesion brain areas has also been found. As a new trial to explore AS, our research contributes to the diagnosis and treatment of AS.
Materials and Methods
Data Acquisition
In this paper, we downloaded the experimental data from the Autism Brain Imaging Data Exchange (ABIDE) database. As an authoritative database of autism research, the data in ABIDE has three modalities which are clinical data, sMRI data and fMRI data. We used 157 participants’ fMRI data to carry out the study including 86 healthy controls (HCs) and 71 AS patients.
The criteria for selecting experimental samples are as follows:
(1) The head motion of the sample is less than 2 mm.
(2) Each experimental participant has the information of full intelligence quotient (FIQ), verbal intelligence quotient (VIQ), and performance intelligence quotient (PIQ) as far as possible.
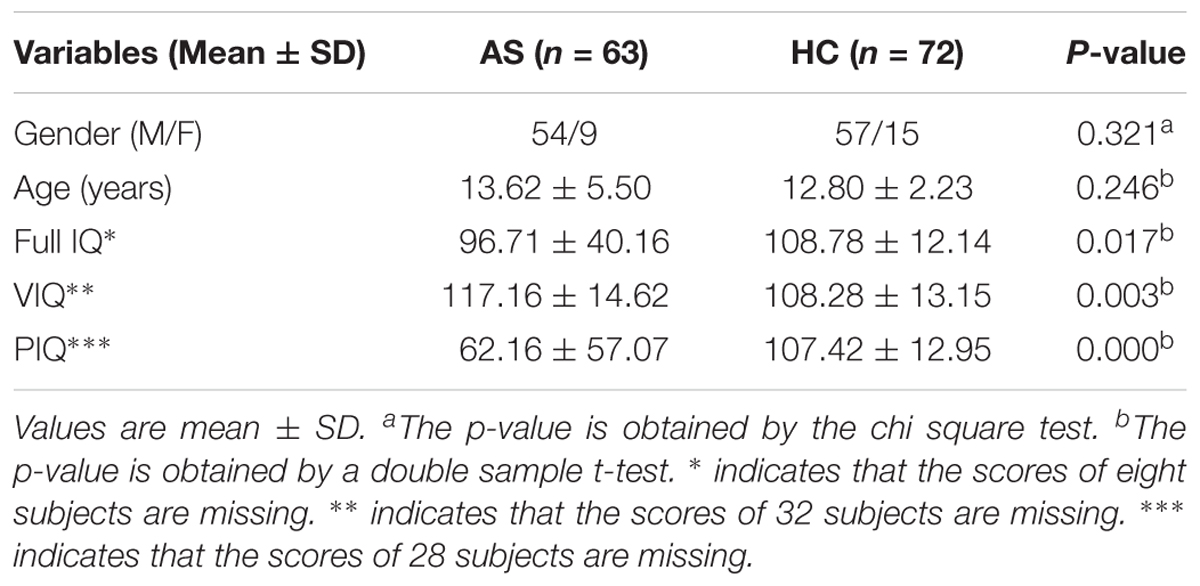
In order to avoid the interferences of other factors such as age and sex on the results of the experiment, we conducted tests on these factors before conducting experiments. The specific results are shown in Table 1.
Data Preprocessing
Due to the distinctions of participants, we have adopted some preprocessing measures to ensure the unification and standardization of experimental data. DPARSF is used for data preprocessing, and the method used by Cai et al. (2017) provides references for us. The following is the detailed preprocessing process:
(1) Removing the first 10 time points to avoid the environmental inadaptability of the participants in the initial stage of the experiment.
(2) Correcting time slice to ensure that the image data was obtained from the same time.
(3) Adjusting head movements of all subjects to make the brain images of different participants locate in the same position.
(4) Standardizing brain images with the echo-planar imaging (EPI) template to make different participants have identical brain structures.
(5) Smoothing the image by Gauss kernel to reduce noise interference (the full width half height of Gauss kernel was set to 6 mm).
(6) Removing linear drift to decrease the influence of uncertain factors.
(7) Using regression analysis to diminish the impact of covariance such as noise signal.
(8) Filtering uncorrelated blood oxygen level dependent signal with a bandwidth of 0.01–0.08 Hz.
After these procedures, we retained 135 participants including 63 AS and 72 HC, and each participant’s original image was transformed into an image that accords with the research standard.
Construction of Sample Features
After preprocessing, we continued the follow-up experiment using the preprocessing results of all samples. Firstly, Automatic Anatomical Labeling (AAL) template was used to split the preprocessed brain images into 90 brain regions which are also called as regions of interest (ROI). Secondly, we paired any two brain regions resulting in 4,005 pairs. Thirdly, we treated the Pearson correlation coefficient between the two regions contained in each pair as a functional connection. Finally, each sample would get 4,005 functional connections, which served as the sample features of the following experiment.
Genetic-Evolutionary Random SVM Cluster
The Construction of the Genetic-Evolutionary Random SVM Cluster
Machine learning is increasingly used in brain science. In the existing researches, some scholars used a single classifier to classify AS and HC (Kakihara et al., 2015; Siuly and Zhang, 2016). These methods might usually achieve good classification results for specific types of data, but could not stand out in other situations. To solve the problem, some scholars proposed random classifier clusters, such as the random SVM cluster (RSVMC model) proposed by Bi et al. (2018a). But this method did not fully consider the optimization of the classifier cluster. In order to overcome the drawback, this paper employed GE-RSVMC model. Specifically, we applied the cluster to overcome insufficient generalization performance of a single classifier, and solved the optimization problem of the cluster by using the method of genetic evolution. Then, we could carry out feature extraction and sample classification based on evolutionary cluster. The detailed construction process of the genetic-evolutionary cluster is as follows.
The preparatory step is to divide all the participants into a training set and a test set in accordance with the ratio of 7:3.
The first step is to build a single SVM base classifier. Firstly, we randomly selected a part of samples from the training set as the training samples of a single SVM classifier. Secondly, as each sample has 4005-dimensional features, we randomly selected ≈ 62 sample features as classification features. We used binary coding to represent the selection result of sample features. Specifically, we generate a feature sequence with the length of 4005. If the i-th sample feature is selected as a classification feature, the value of i-th position in the sequence is set as 1, otherwise the value is set as 0. The classification features sequence (Scf) is given as follows:
where n represents the quantity of sample features, and m indicates the quantity of sample features be selected. The xi in Scf is defined by:
Finally, we constructed a single SVM base classifier based on the training samples and the classification feature sequence.
The second step is to construct the first generation SVM cluster. We repeated the first step for p times to get p SVM base classifiers. Then, these classifiers were assembled into a cluster which was called as the first generation SVM cluster.
The third step is to determine the fitness function. In this paper, we used the test set to examine the classification performance of each SVM base classifier, the classification accuracy was considered as fitness function. Thus, the expression of the fitness function is obtained by:
where Strue,j is the quantity of samples which are correctly recognized in the j-th SVM base classifiers, and S is the totality of samples in the test set. The value of fitness function is a significant index to evaluate the classification ability of the base classifier. The larger the value is, the better the performance of the base classifier will be.
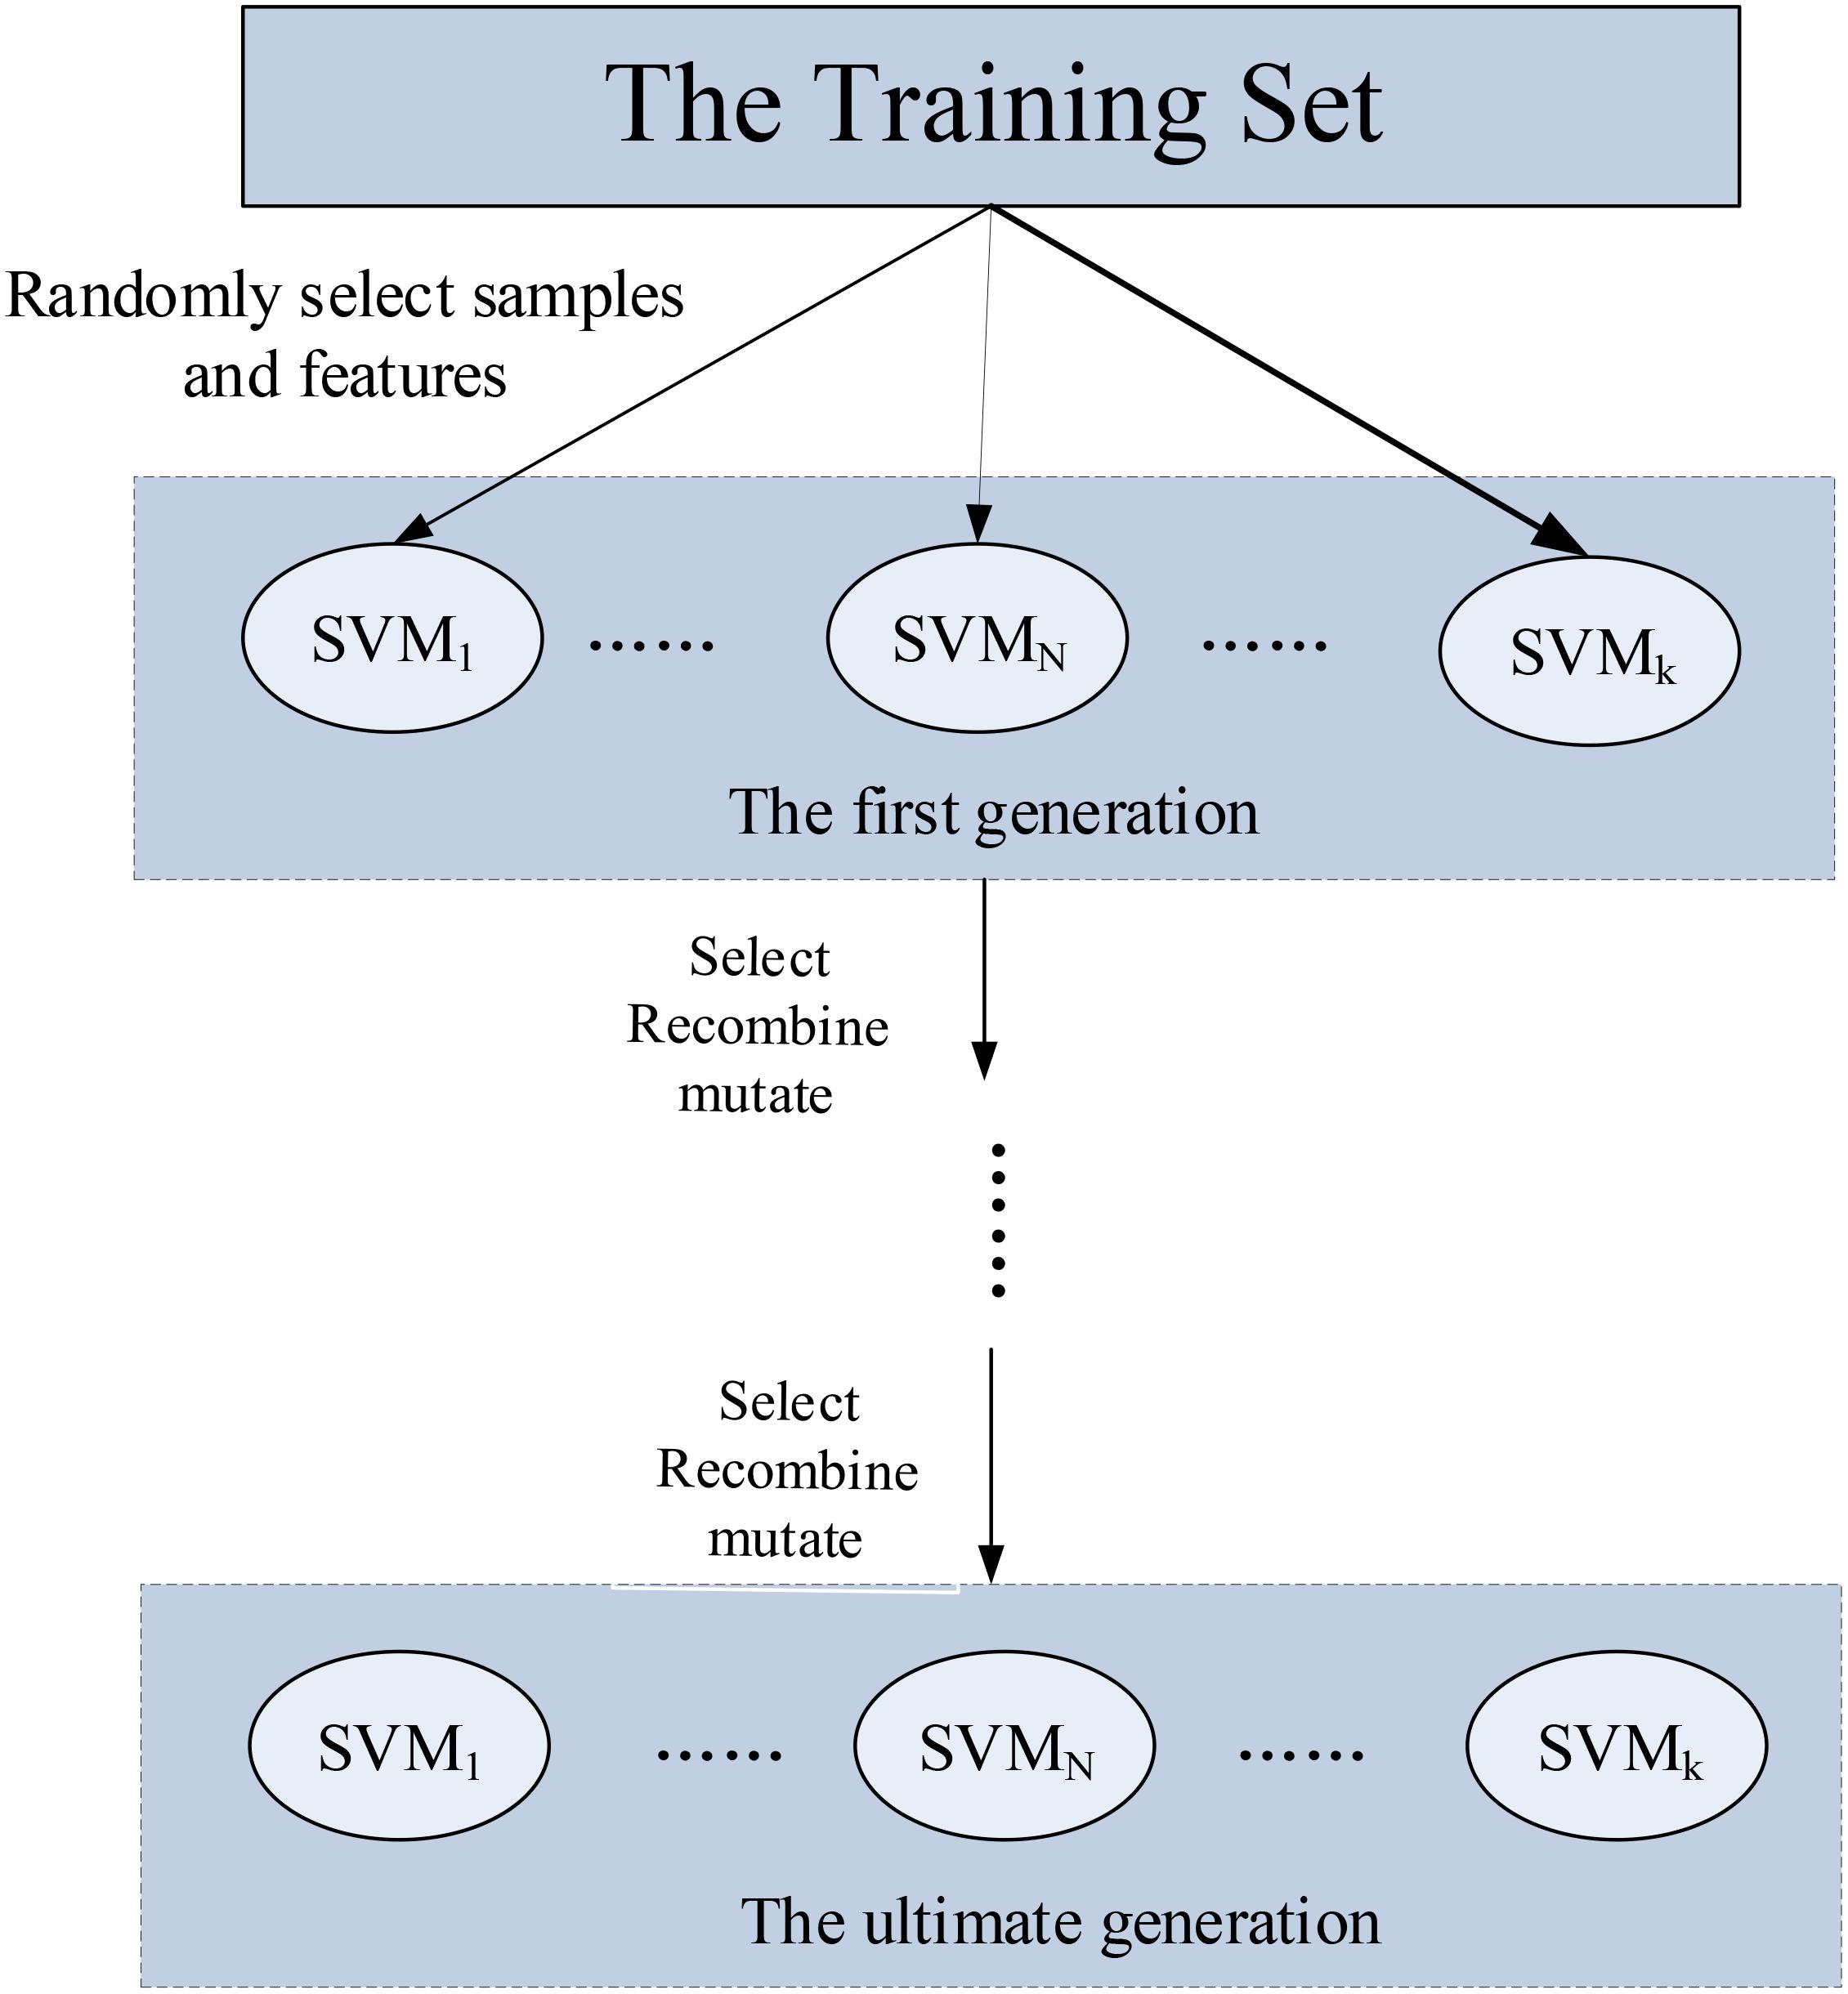
The fourth step is to implement the genetic evolutionary process of the random SVM cluster. First of all, we selected the base classifier based on fitness function. The base classifier with higher fitness function value is reserved, and the base classifier with lower fitness function value is eliminated. Then, we found out the corresponding feature sequence of each selected base classifier. Finally, we crossed and mutated the feature sequences of these classifiers to generate new offspring feature sequences. The second generation cluster was established based on the new offspring feature sequences. Because we had eliminated the classifiers with lower fitness function, the performance of the second generation cluster was obviously better than the first generation cluster. The process of selection, crossover and mutation is called as genetic evolution. We repeated the process until the classification performance of the cluster became stable. The evolutionary procedure of the cluster is shown in Figure 1.
The Optimal Combination of the Times of Genetic Evolution and the Quantity of Base Classifiers
According to the proposed method, we could build a cluster but could not ensure whether it is the optimal cluster. In order to optimize the cluster, we need to find the optimal combination of the quantity of base classifiers and evolutionary times. In this study, the grid search method was used to select the optimal quantity of base classifiers. We used 100–300 base classifiers to build different clusters and searched out the corresponding times of genetic evolution. When both of the quantity of base classifiers and the corresponding evolutionary times are the lowest, the combination is the best.
The Classification of the Genetic-Evolutionary Random SVM Cluster
Our first goal is to accurately classify HC and AS through our cluster. As mentioned above, 70% of the experimental samples were used as the training set, and the rest was used as the test set. Each experimental sample has 4,005 sample features and one class label (“+1” or “-1”). “+1” represents HC, “-1” represents AS.
According to the above methods of building the cluster and finding the optimal combination, we could obtain the ultimate cluster. When a test sample enters into the ultimate cluster, each base classifier in the cluster will give a classification result. Because all the base classifiers in the ultimate cluster have excellent classification performance, we assign the equal classification weight to each base classifier. If most of the classification results given by the base classifiers are the “+1,” the samples will be classified as HC, otherwise the sample will be classified as AS.
Abstracting the Optimal Feature and Brain Region
Our second aim is to explore significantly different features between AS and HC. These differential features are effective in identifying patients and normal people, which we called as “optimal features.” This study used the multi-stage analysis to explore the “optimal features.” The route design for finding the “optimal feature” is as follows.
Step 1: When the optimal quantity of base classifiers was determined and the cluster was evolved to a stable state, we could get the ultimate cluster. Since each base classifier in the ultimate cluster randomly selected 62 sample features, these selected features were the basis to distinguish between AS and HC. We counted the features selected by each base classifier and calculated the frequency of each selected feature. Then, we searched out the most frequent 400 features as “important features.”
Step 2: We extracted the top 70 features from “important features” as “candidate set of optimal features.” Then, we extracted 65 features each time from the “candidate set of optimal features” through stochastic selection to build a RSVMC model, and evaluated the classification performance of RSVMC model by using the test set. Next, we extended the “candidate set of optimal features.” The extraction range of features in “candidate set of optimal features” gradually extends from the top 70 features with the highest frequency to the whole “important feature” set. Finally, we constructed different clusters based on different “candidate set of optimal features,” and the classification accuracies of the clusters were calculated. The “candidate set of optimal features” corresponding to the peak of classification accuracy is the “optimal feature set.”
Step 3: Because each “optimal feature” involves two brain regions, we also used frequency as a criterion to select significant brain regions. We counted each brain region involved in the “optimal features” to get its frequency. The brain regions with higher frequencies are regarded as “significant brain regions.”
Results
Construction of Optimal Genetic Evolution Random SVM Cluster
Through many experiments and adjustments, we set the parameters of each SVM base classifier as follows: using the Radial Basis Function (RBF) kernel function, setting cost parameter of RBF as Inf, and setting the gamma parameter as 3.
According to the existing researches, the optimal quantity of base classifier was set up to the interval of [100,300] (Bi et al., 2018b), and genetic evolutionary times was set up to the interval of [0,200] by experiments. Then we used the method of grid search to look for the optimal combination.
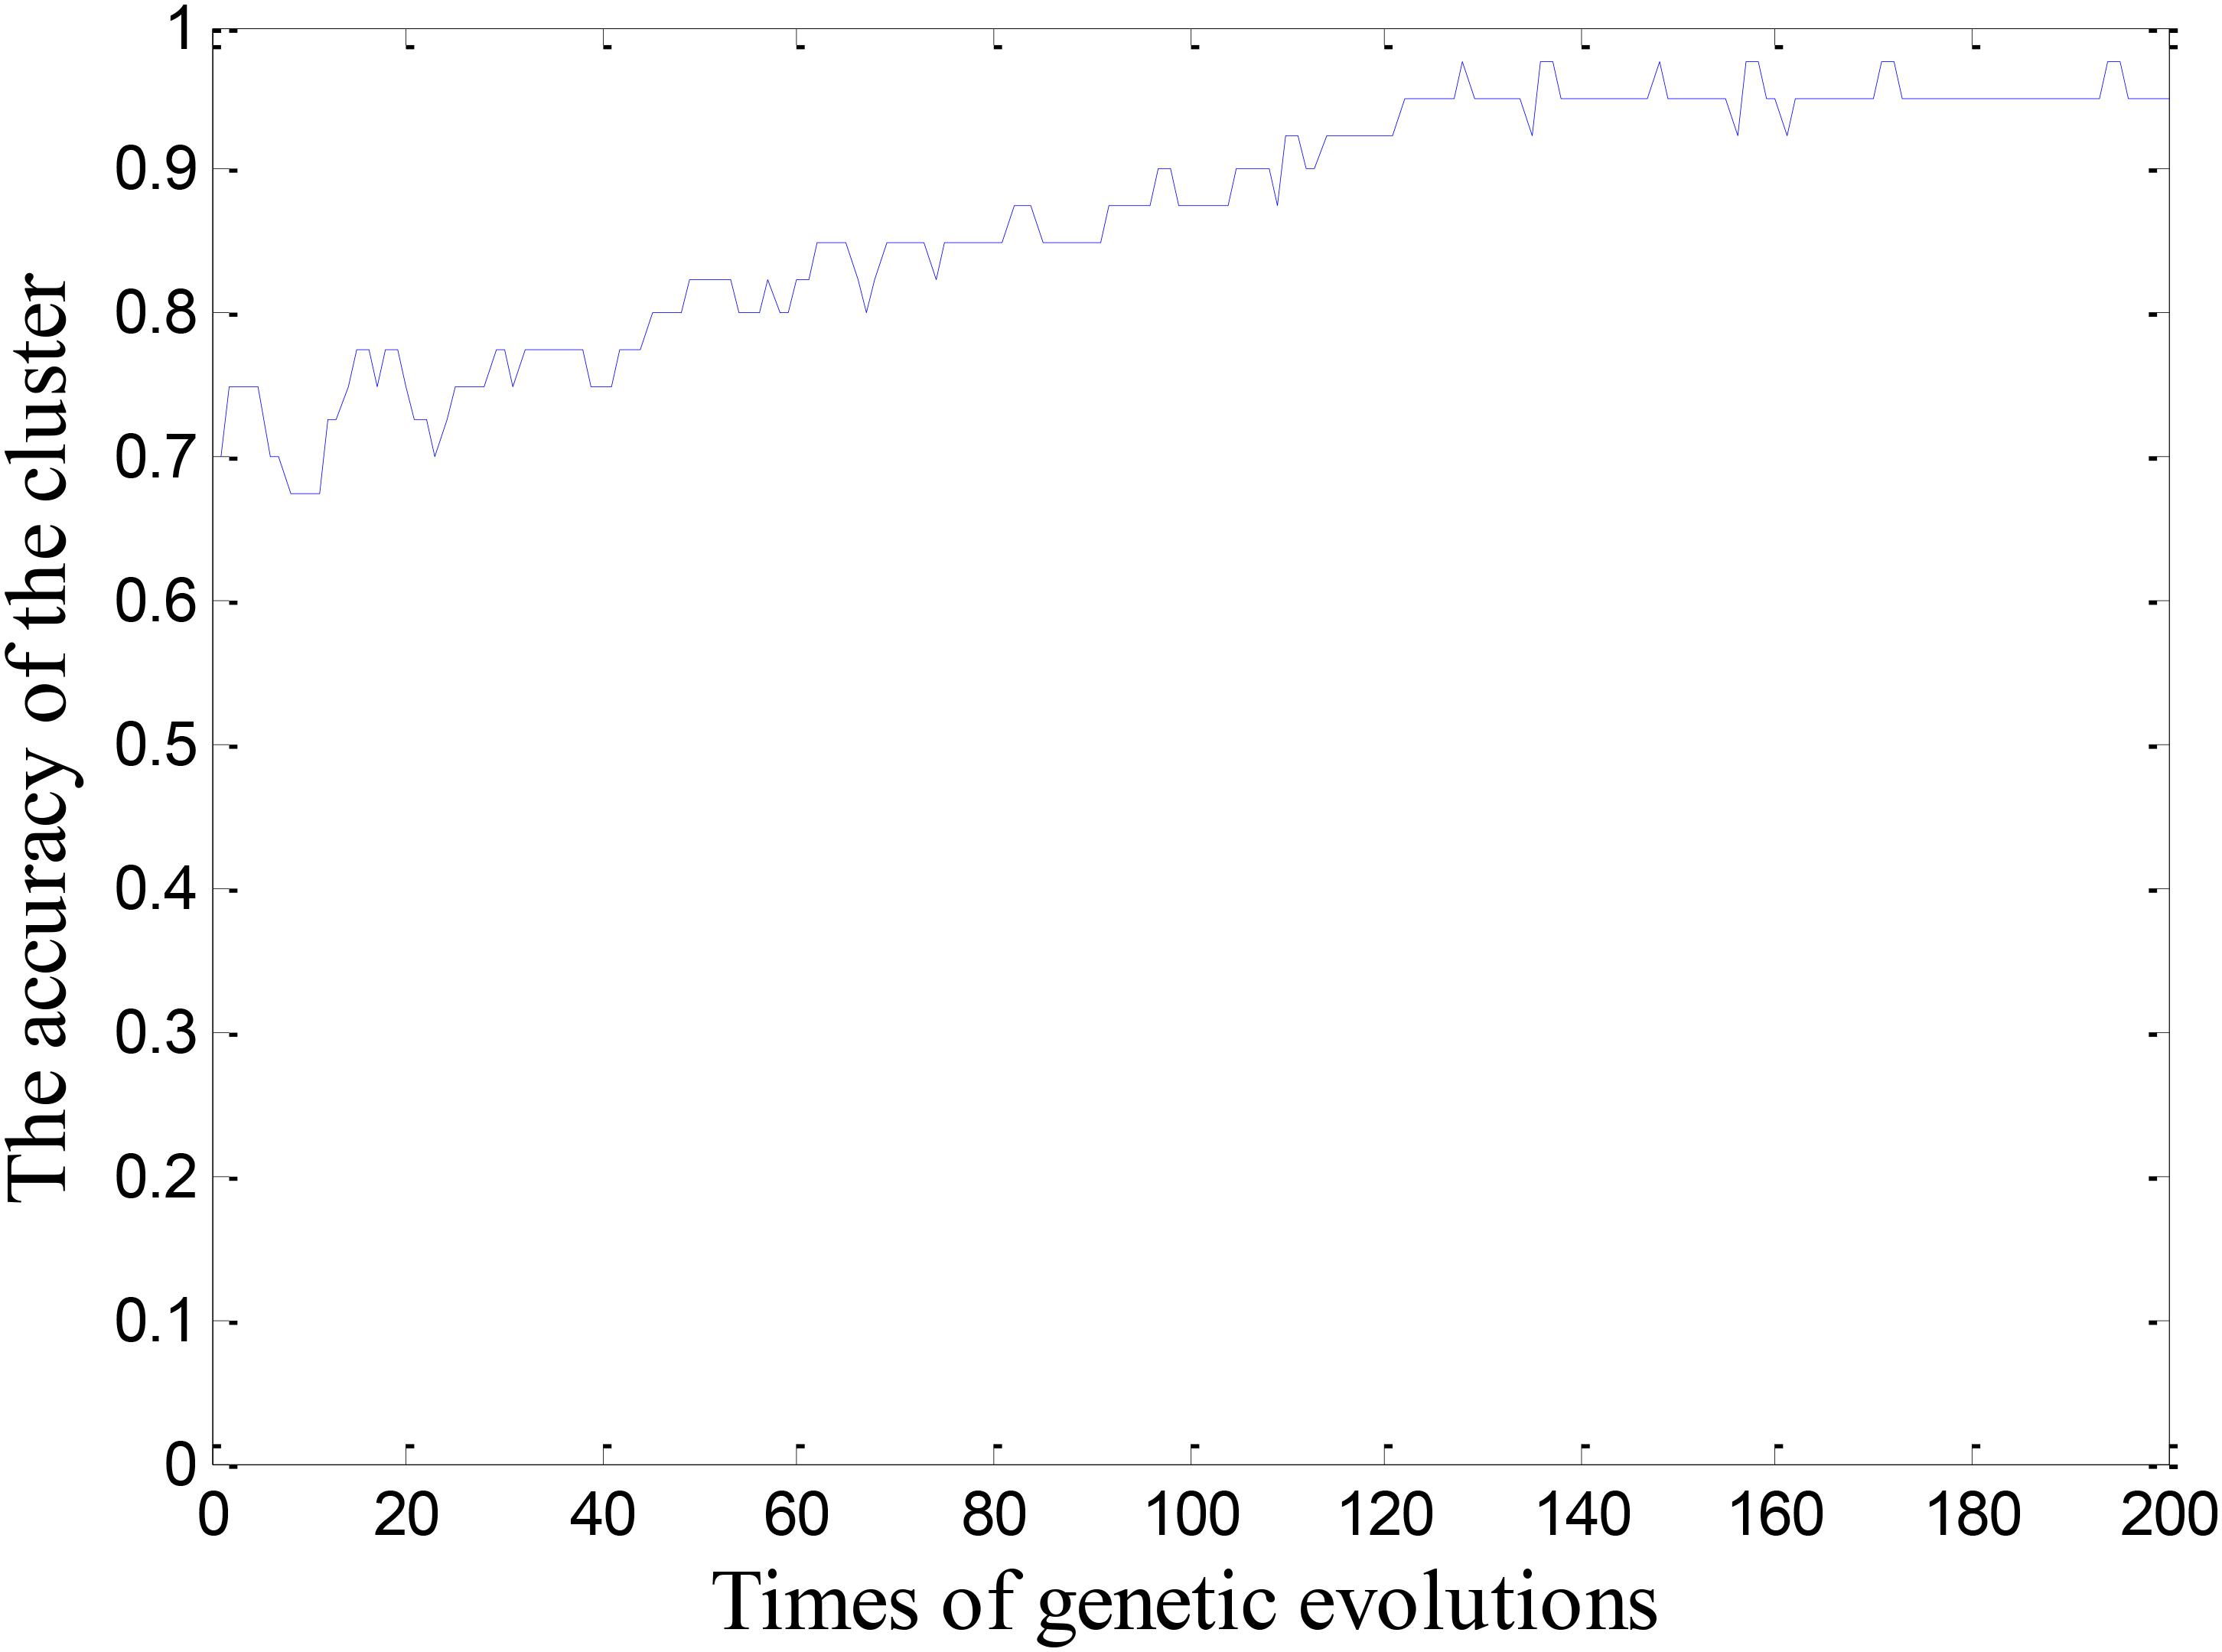
We built a cluster using 100 base classifiers at the beginning of the experiment. In order to make the cluster stable, the cluster was evolved for 200 times, and the evolution process was shown in Figure 2. It is learned that when the cluster is evolved 122 times, the cluster begin to reach a stable state. Thus, we get the first combination of (100,122). Next, we increased the quantity of base classifiers in the cluster with a step of 20, and obtained the corresponding evolutionary times for the cluster. In this way, we can get the combinations under different situations. We regarded these combinations as two-dimensional coordinates and obtained Figure 3. As motioned above, the smaller the quantity of base classifiers is and the less the evolutionary times are, the better the efficiency of the cluster will be. Therefore, we can learn that the coordinate of (200,71) is the optimal combination in Figure 3. Finally, the number of base classifiers in the cluster was set to 200, and the cluster was evolved for 70 times to get the ultimate cluster.
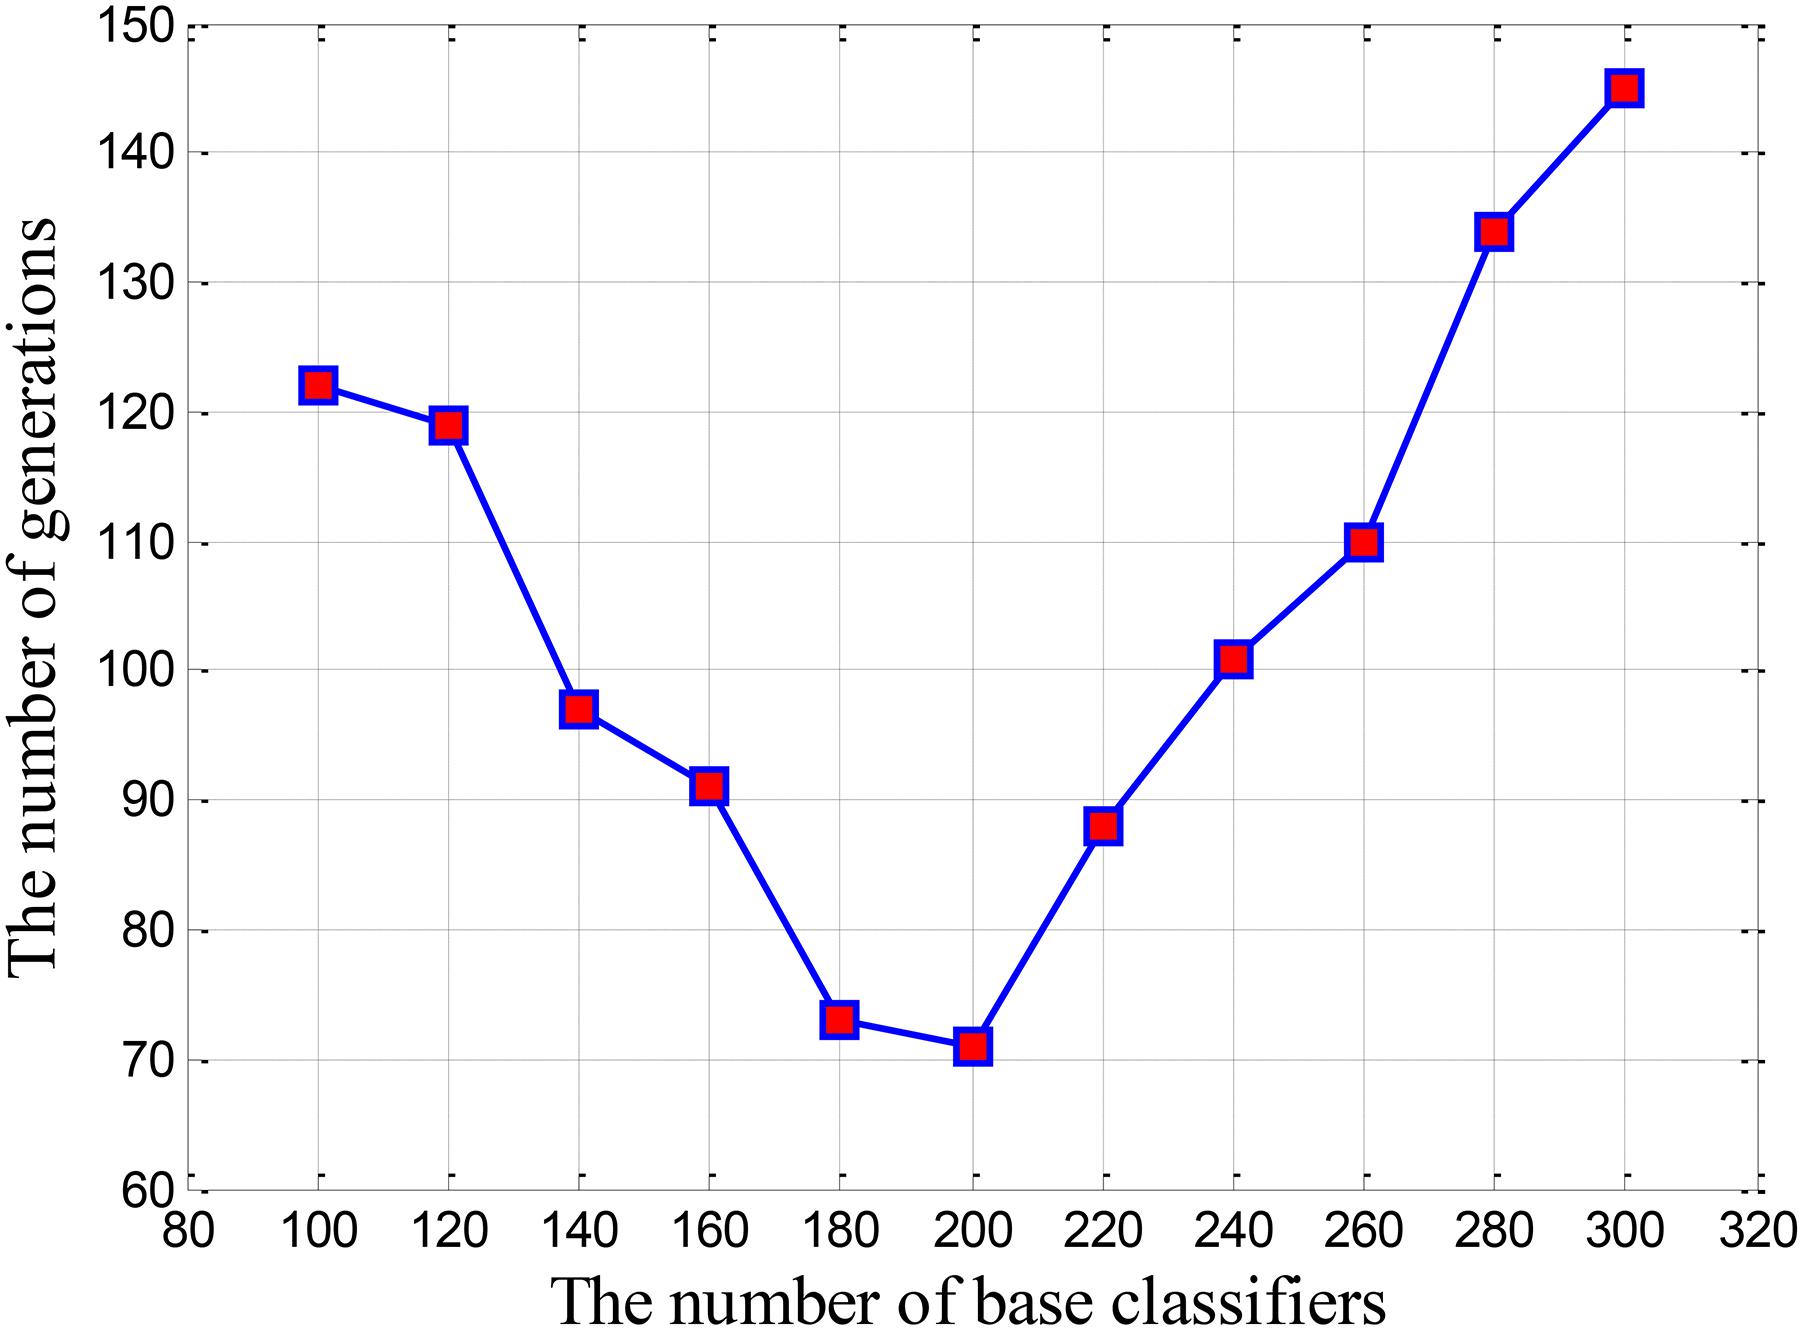
FIGURE 3. The relationship curve between the evolutionary times and the quantity of base classifiers.
Classification Performance of Genetic Evolution Random SVM Cluster
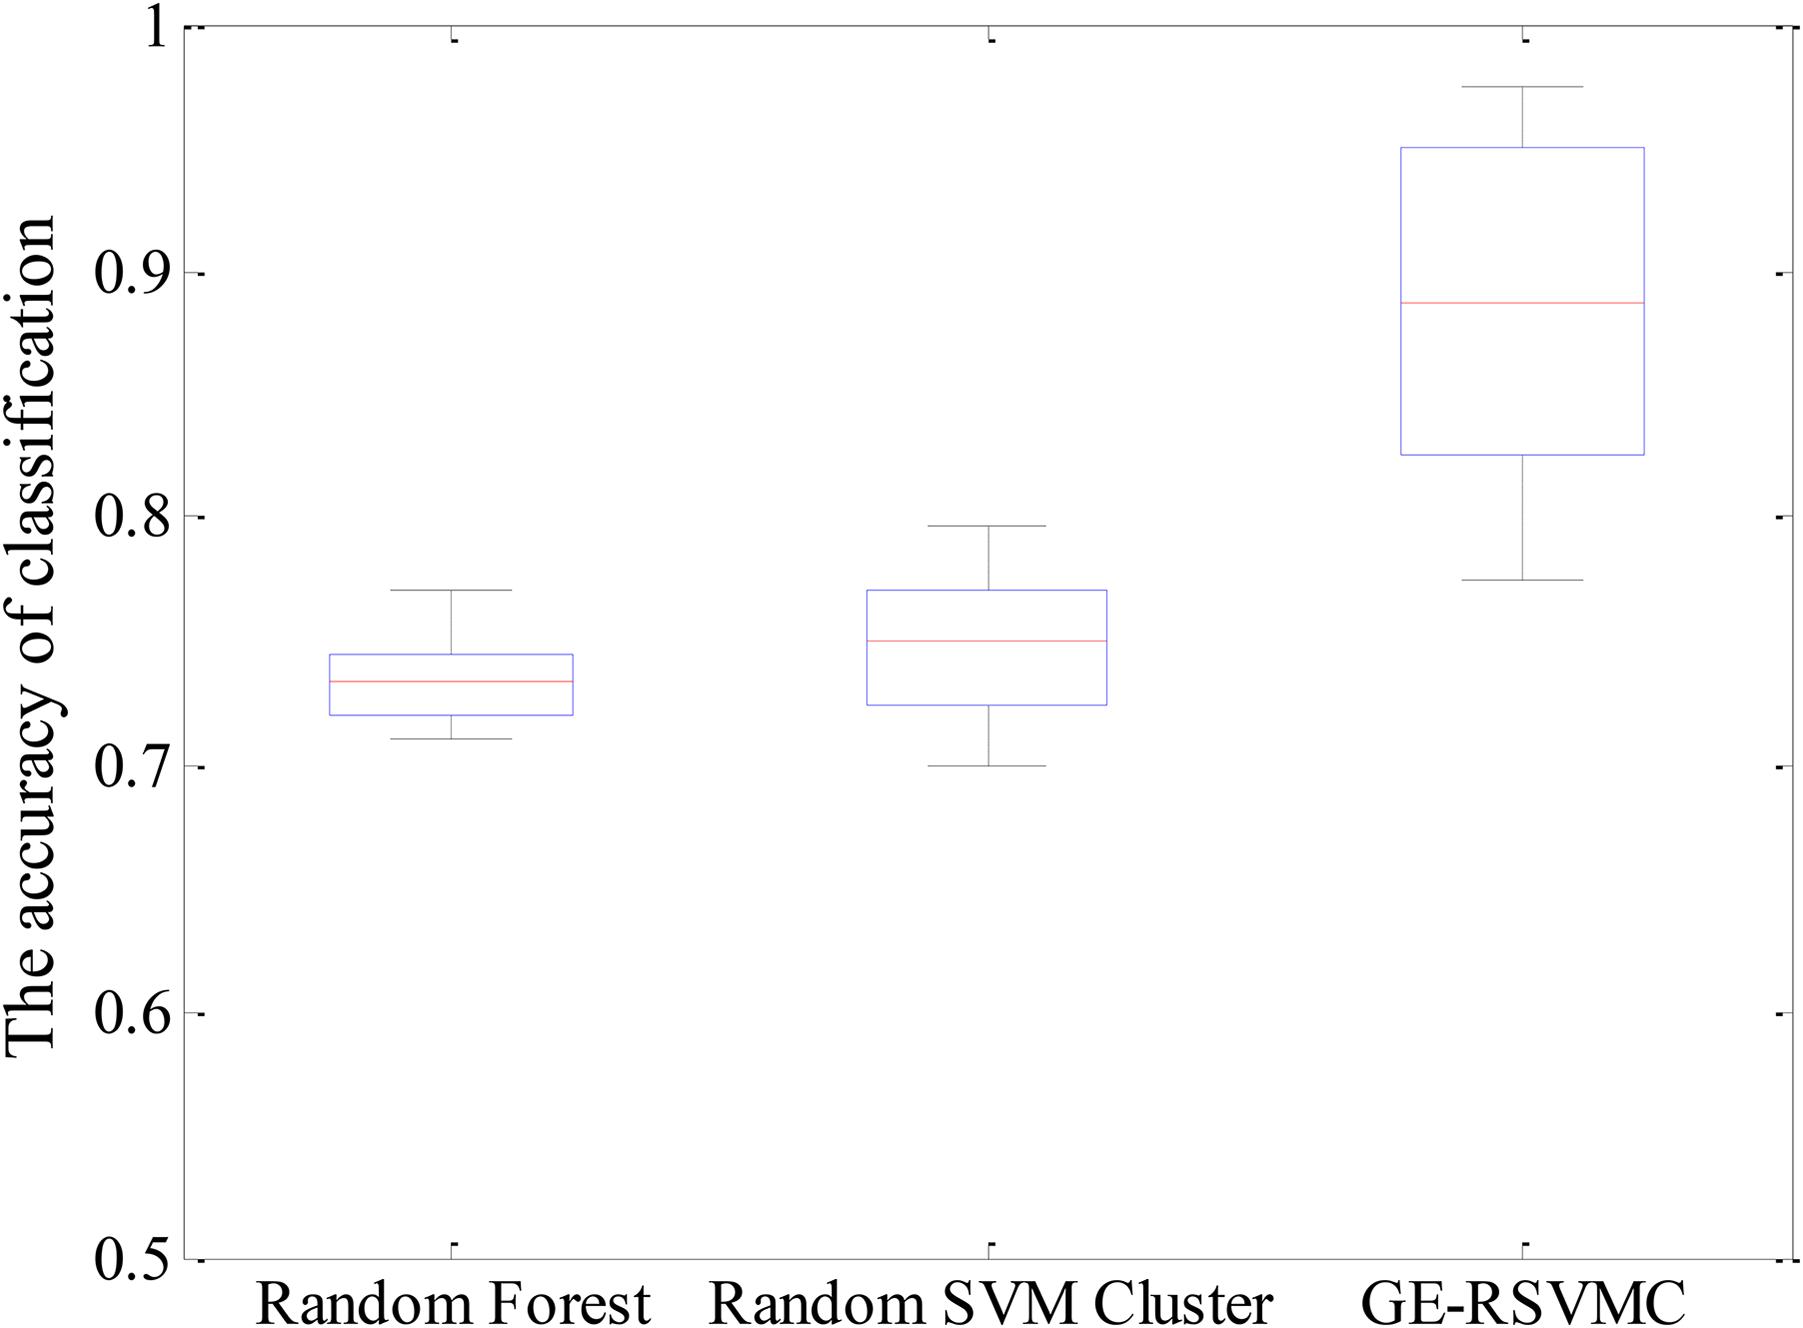
In this paper, we built the ultimate cluster according to the optimal combination of evolution times and the amount of base classifiers. Our first goal was to accurately discriminate the AS and HC, and we used the test set to evaluate the ultimate cluster. The experimental results showed that the highest accuracy was up to 97.5%. In order to verify the stability of the performance, we conducted experiments for 50 times and the results were compared with those of the Random Forest and the Random SVM Cluster. The detail results are shown in Figure 4 and Table 2. The maximum, median and minimum values of accuracy in our model are 0.975, 0.8875, and 0.775, respectively, which are all superior to the other two methods. On the other hand, the average accuracy of our model is close to 90%, while other methods are less than 75%. We could draw the conclusion from the comparison result that our model has obvious advantages in stability and accuracy.
Important Features and Optimal Features
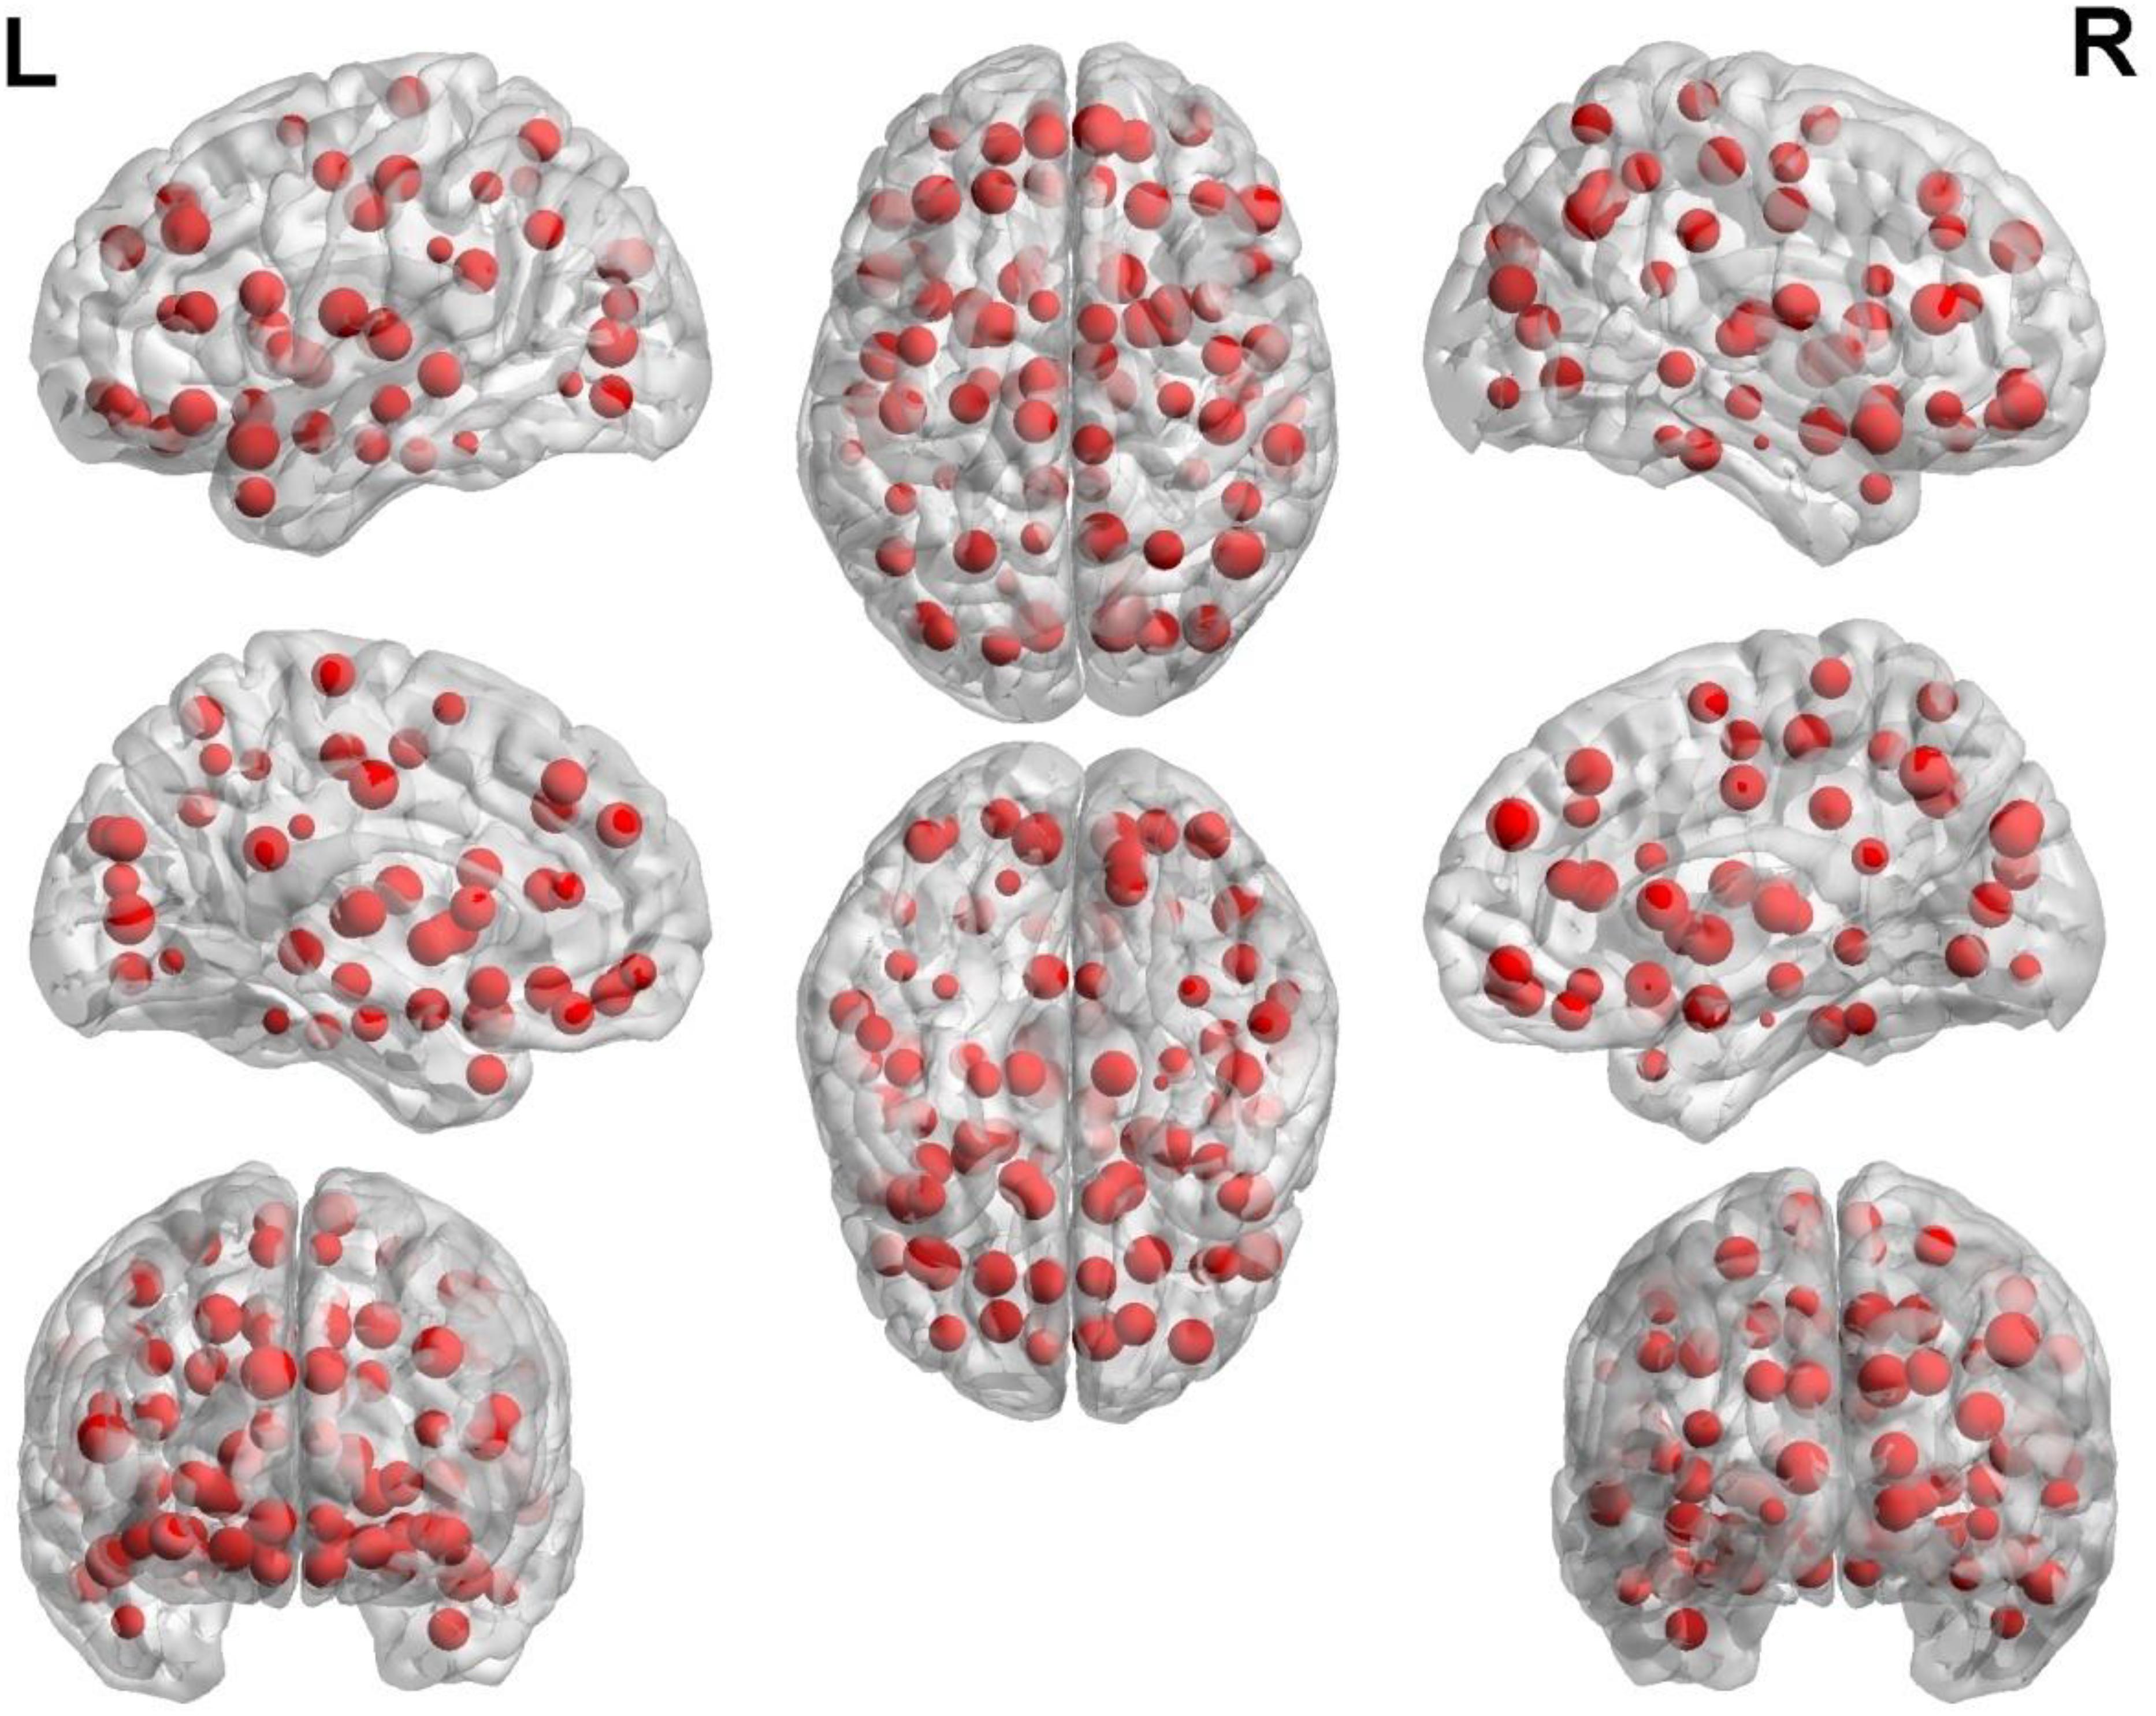
The second purpose of our research is to find out the differences between AS and HC. These differences have two major functions. One function is helpful for the effective recognition of AS and HC, another is helpful for the pathogenesis analysis of AS from the view of physiological and pathological point. Our study search for these differences by the ultimate cluster. According to the result of grid search, we got the ultimate cluster with 200 base classifiers. Each base classifier randomly selected 62 features as classification features. The occurrence number of each feature in 200 base classifiers was counted. The most frequent 400 features were taken as “important features.” The important features are shown in Figure 5.
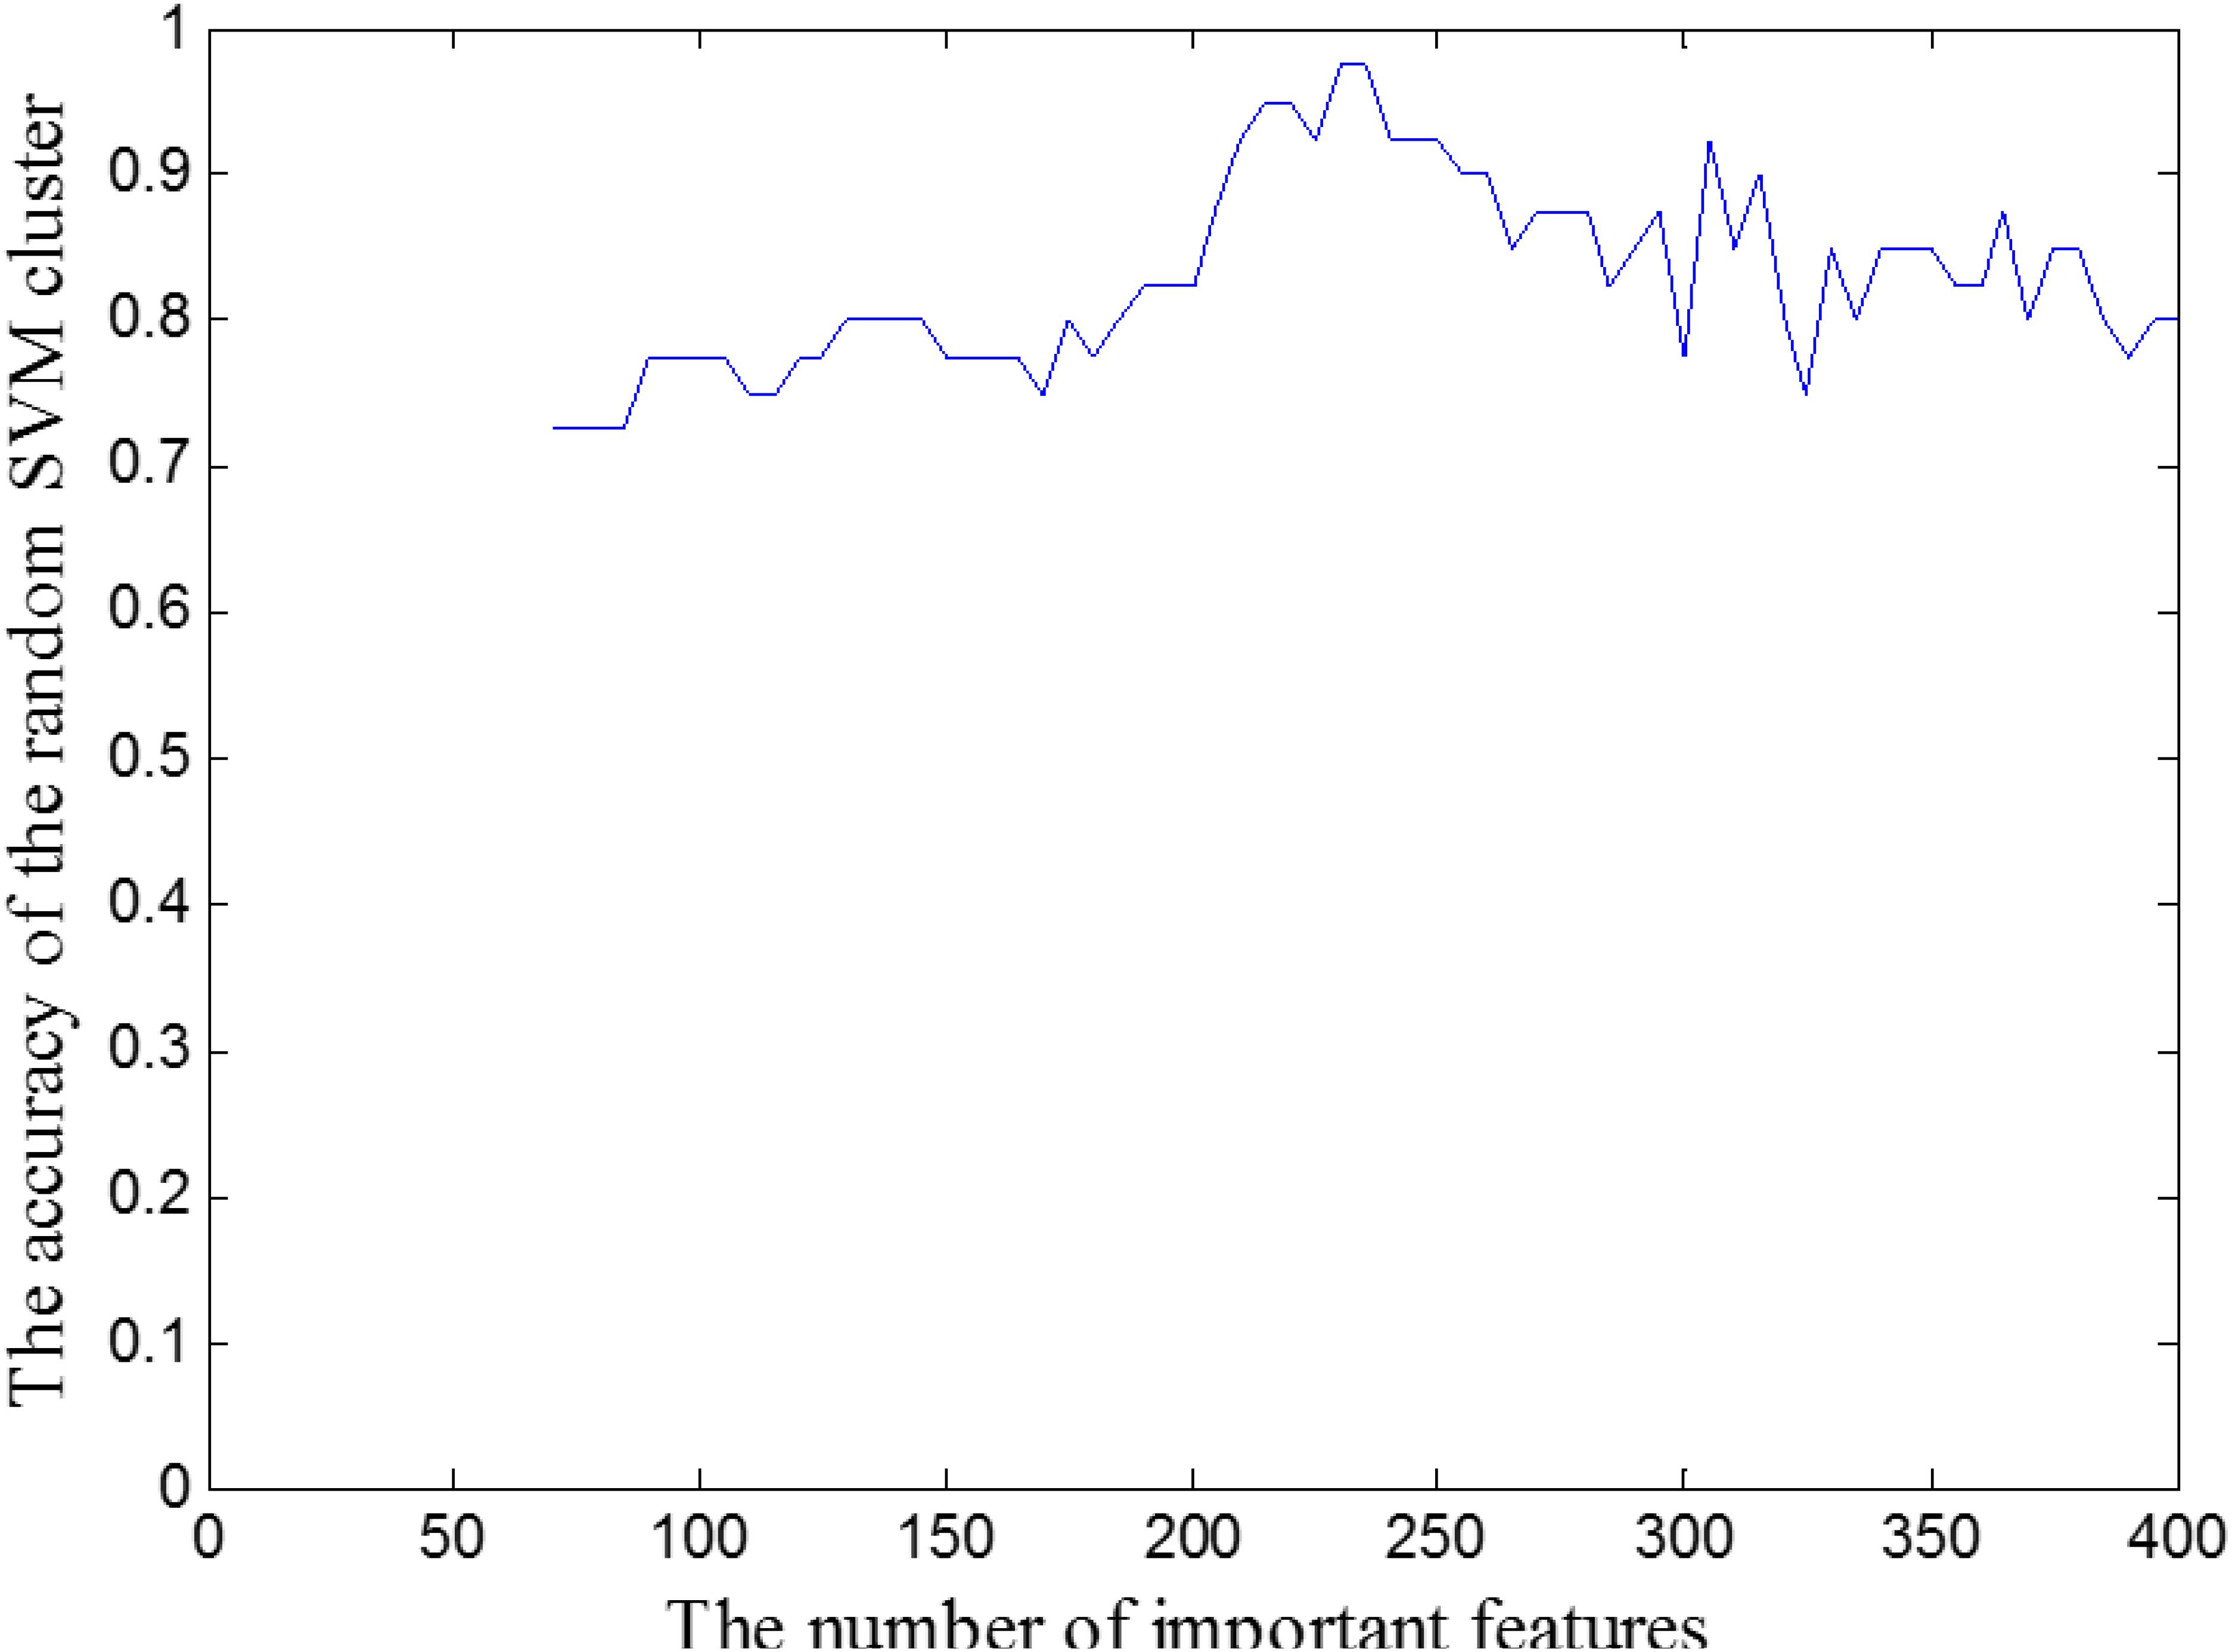
Although “important features” have a good classification performance for HC and AS, they are still not the optimal features for the reason that it may include some unrelated brain areas. Thus we continued to extract the optimal features from “important features.” Specifically, we firstly extract the 70 features from the important features as “candidate set of optimal features.” Next, we randomly extracted 62 features from this candidate set to construct a RSVMC model, and calculated the classification accuracy. Then, we gradually increased the number of feature in “candidate set of optimal features” from 70 to 400 with the step length is 5, and use the same method as above to build different RSVMC. Finally, we calculated the classification accuracies of the RSVMC model under different “candidate set of optimal features” which are shown in the Figure 6. When the number of feature in “candidate set of optimal features” equals to 230, the cluster reaches the peak of accuracy. Thus we regarded the first 230 features of the important feature as the optimal feature set.
Significant Brain Regions
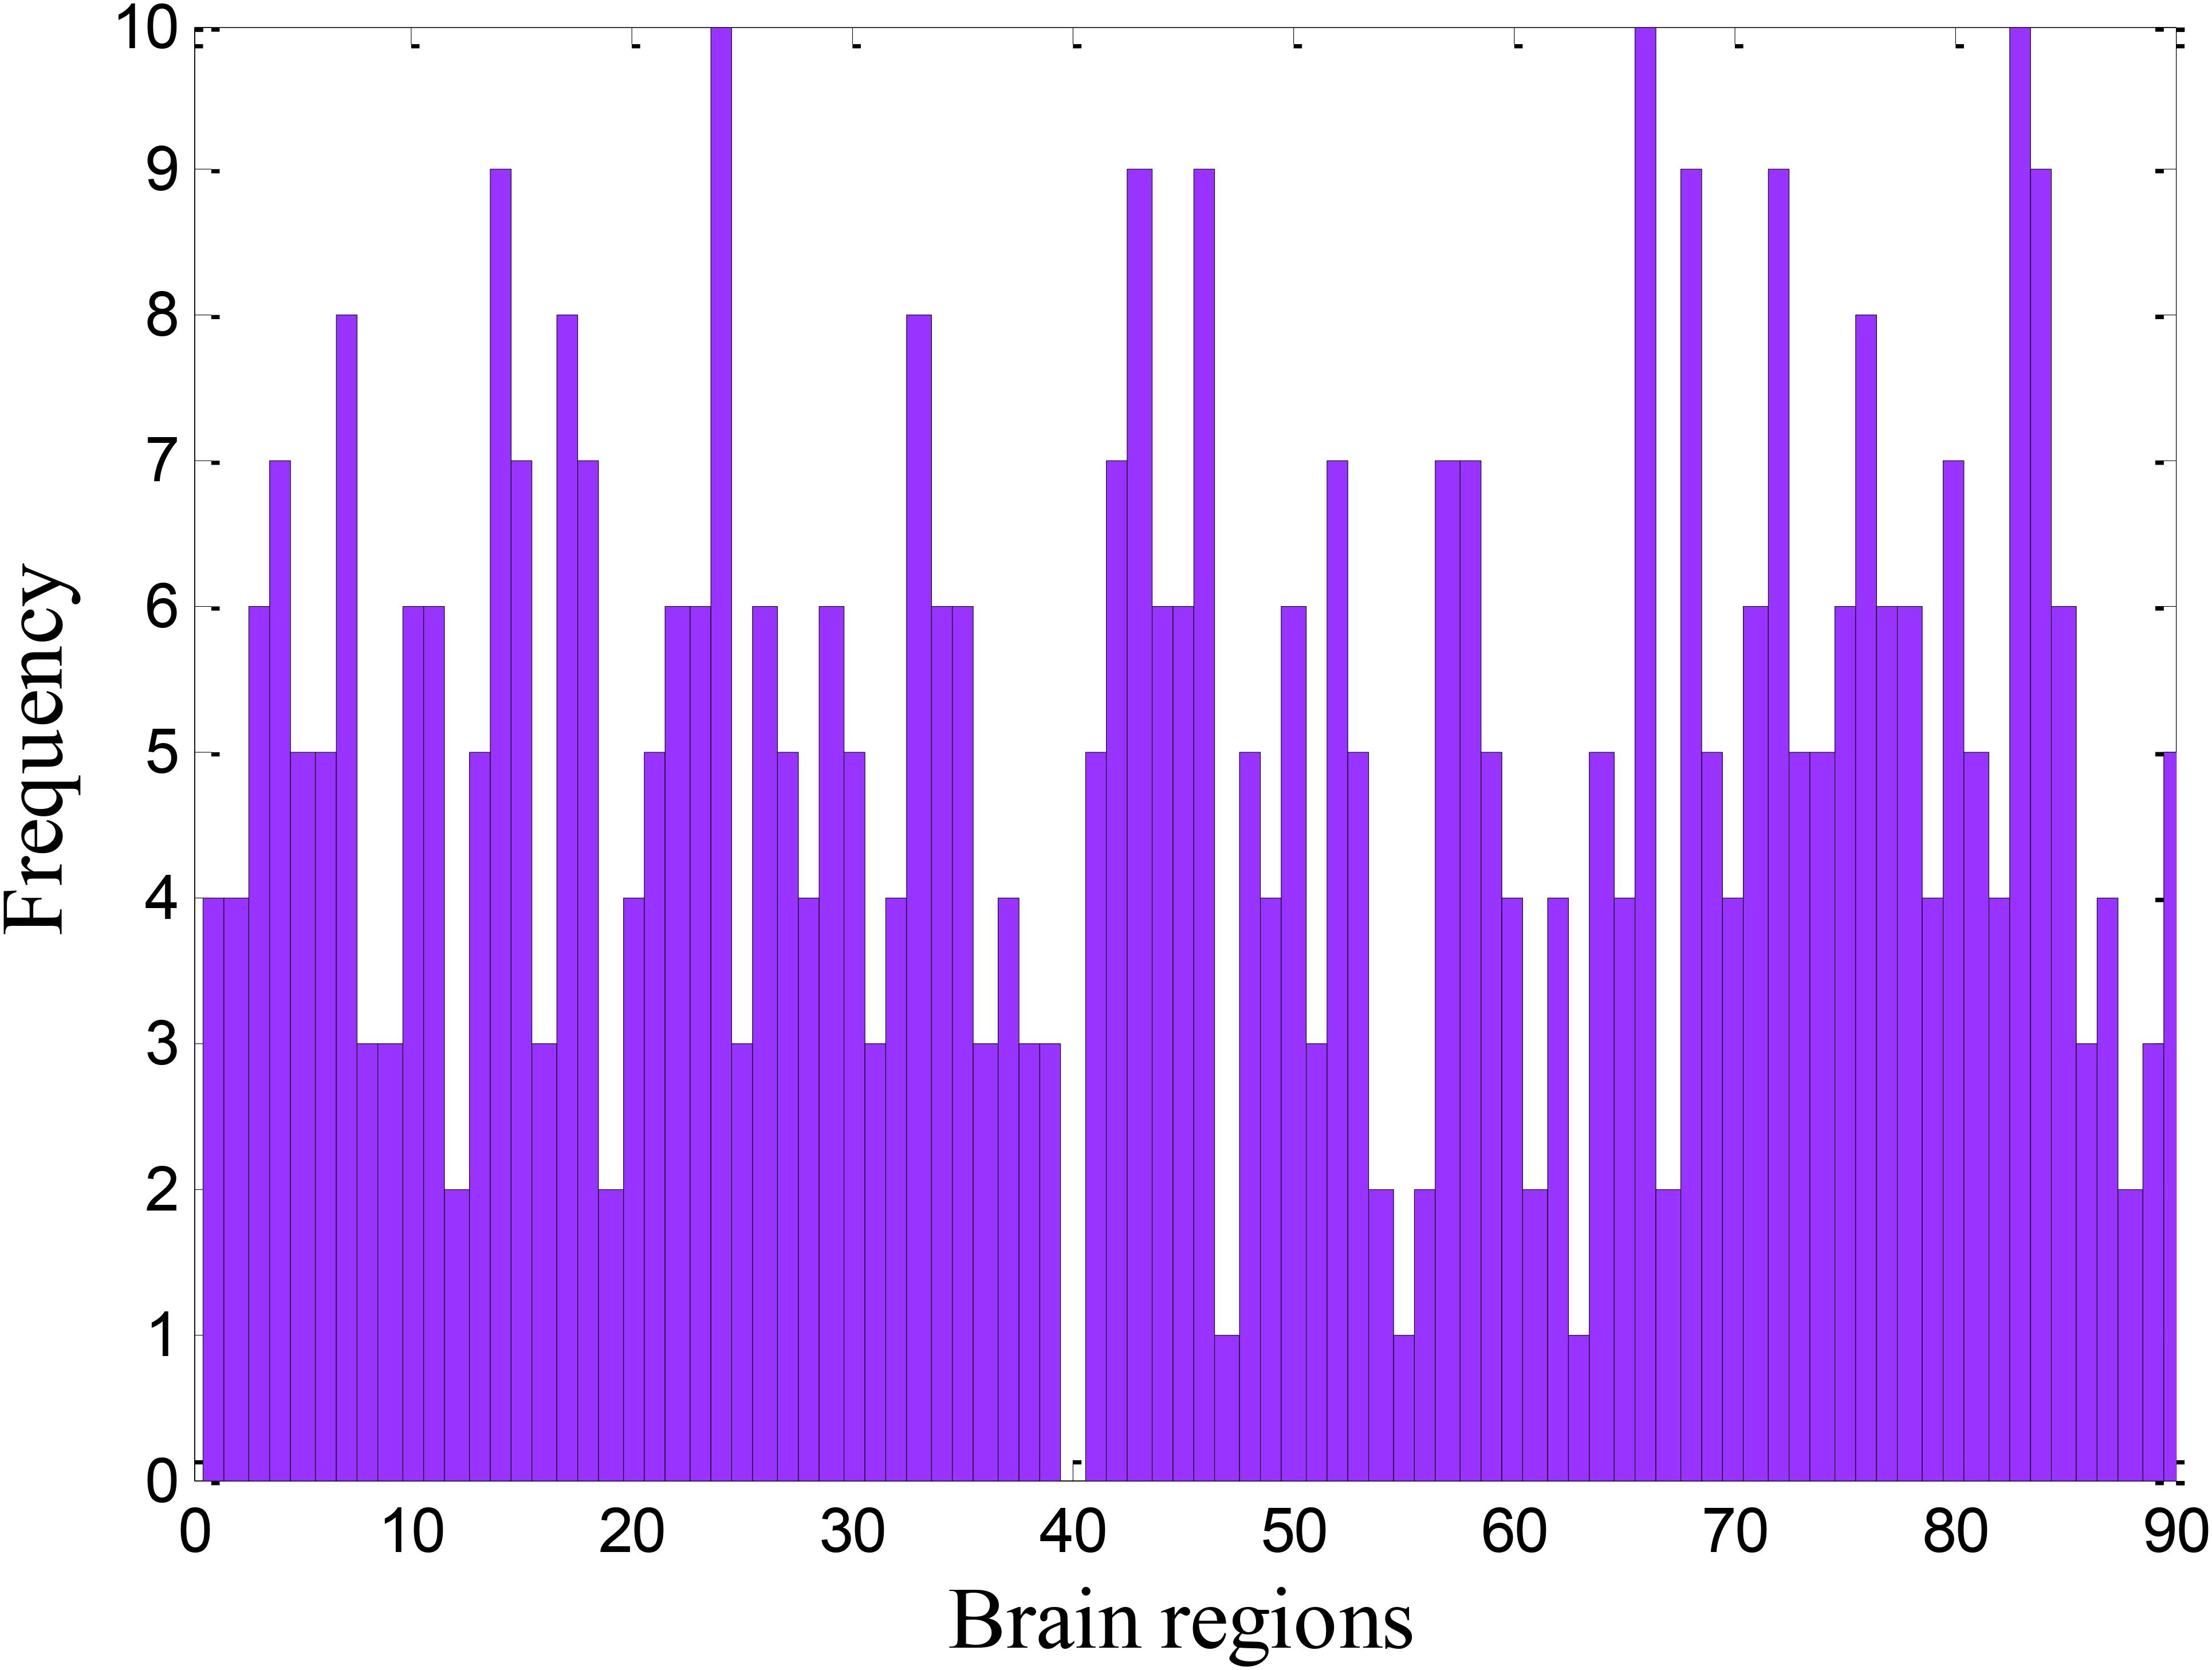
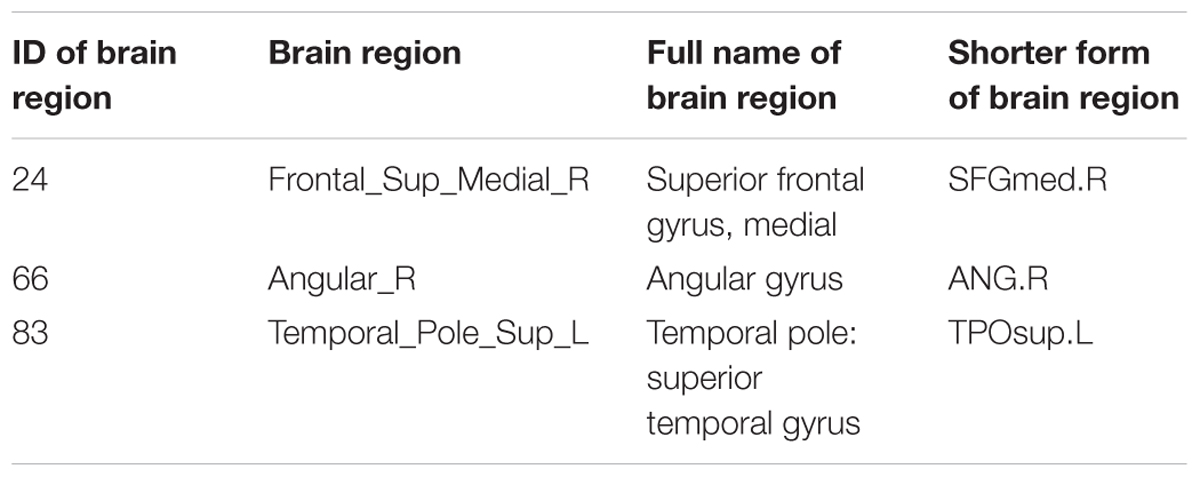
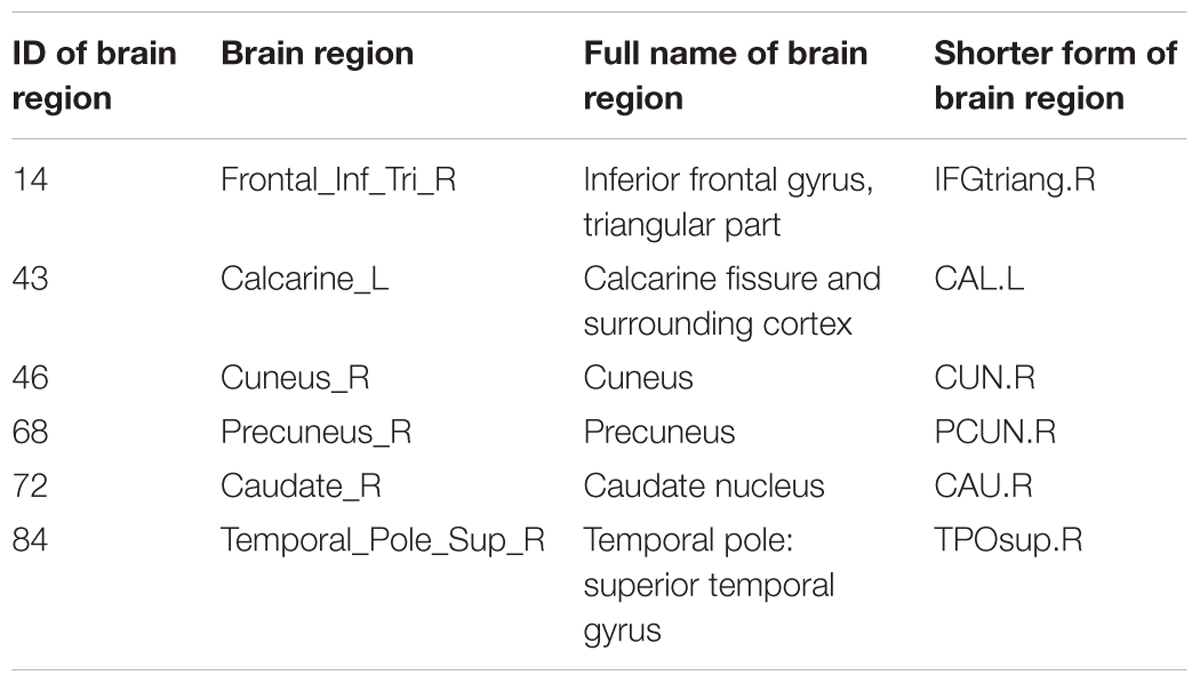
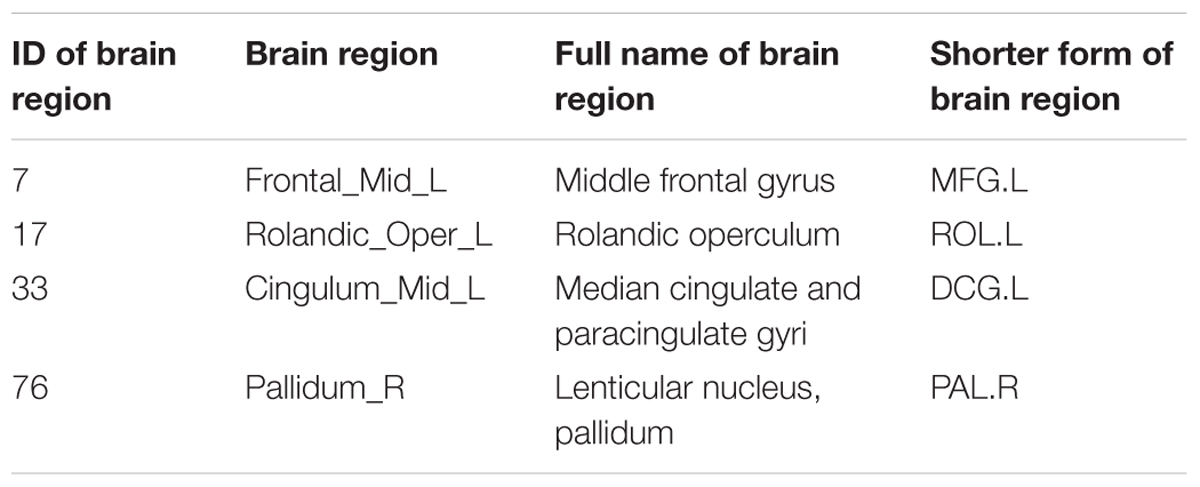
Because the sample feature represents the functional connectivity between the two ROIs, the significant ROIs should be detected from the optimal feature set. In this paper, we also used the frequency as a criterion for searching the significant ROIs. We counted the frequency of each ROI in the optimal feature set. The frequency of each ROI is shown in Figure 7. The frequency can detect the correlation between brain regions and disease. The higher the frequency, the stronger the correlation. The ROIs with higher frequencies were used as the significant brain regions. Therefore, we enumerated the information of 13 brain regions with the strongest correlation in Tables 3–5.
Discussion
Classification Performance
Recently, more and more models of machine learning have been used in the study of neuroimaging. Harlianto et al. (2017) compared several machine learning algorithms for classification, which involved support vector machine (SVM), neural network, decision tree, and naive Bayesian, and the result showed that linear kernel SVM outperformed the others algorithms with an accuracy of 82.35%. Hoang and Nguyen (2018) used SVM, artificial neural network (ANN) and Random Forest (RF) to classify data set, and the accuracy was 87.50, 84.25, and 70%, respectively. Mat Razi et al. (2015) used Multi-Layer Perceptron Neural Network to classify the AS children and typically developing children based on the analysis of EEG signals, and the classification accuracy of the model was up to 79%. Wilson et al. (2014) adopted the SVM to discriminate AS and high-functioning autism (HFA), and the performance of classifier is only 58%.
In this study, the distinction between normal people and patients was abstracted as the binary classification problem in machine learning. We employed a GE-RSVMC for the classification between AS patients and HC. We construct the GE-RSVMC based on ensemble learning, and the ensemble learning model usually has better accuracy and generalization performance than a single classifier. And we introduce the idea of genetic evolution, so that the cluster gradually deletes the classifier with weak classification ability, and retains the classifier with high accuracy. After a certain genetic evolutionary times, each basic classifiers in the cluster has a good classification ability, which makes the cluster achieve a high accuracy. Therefore, the performance of classification stabilizes at the level of 95%, and the highest is 97.5%. Based on the optimal combination of evolution times and the amount of base classifiers, 230 optimal features are retained and used to classify as the optimal feature set. The experimental results show that the GE-RSVMC cannot only distinguish AS patients and HC more accurately, but also identify significant features and the different brain regions between the two groups.
Analysis of Brain Regions With Greater Frequency
The results of our study indicate that there are some significantly different brain regions including Angular gyrus (ANG.R), Precuneus (PCUN.R), Caudate nucleus (CAU.R), Cuneus (CUN.R), etc. These abnormal regions mean that the lesions occurred in these brain areas. The specific analysis of these brain regions is as follows.
(1) Angular Gyrus (ANG.R)
In our paper, the angular gyrus is the one of the ROIs with the highest occurrence number, indicating that the frequency of the abnormal functional connectivity is the highest between this brain region and other brain regions. It plays an essential role not only in the classification of GE-RSVMC model, but also in the pathologic analysis of pathologists.
The angular gyrus locates in the posterior part of the inferior parietal lobule (Seghier, 2013). The angular gyrus involves in semantic processing (Bonnici et al., 2016; Jiang et al., 2018), word reading and comprehension (Pugh et al., 2010), memory retrieval (Price et al., 2015), reasoning (D’Argembeau et al., 2014), and social cognition (Moss and Schunn, 2015). Especially, the increase of the angular gyrus activation makes language ability higher during semantic processing (Ettingerveenstra et al., 2016). And the angular gyrus plays a crucial role in complex information integration and knowledge retrieval (Pick and Lavidor, 2017).
Some studies are in agreement with our results on AS patients. Woods et al. (2013) found that AS patients were commonly characterized by having difficulties in social skills and communication, which can present challenges in everyday functioning. Yanai and Maekawa (2014) found that children with AS had more difficulties with automatic semantic processing than children with normal development. Herrington et al. (2007) indicated that AS patients showed significantly decreased activity between the right superior temporal gyrus and the angular gyrus compared with the HC. Thompson et al. (2010) had observed the decreased activity in angular gyrus and supramarginal gyrus of the right hemisphere in AS with the motor and sensory aprosodias. These results show that the angular gyrus is significantly abnormal in AS, which is of great help to the clinical diagnosis and treatment of AS.
(2) Precuneus (PCUN.R)
We discovered that precuneus is one of the vitally important brain regions, and the frequency is ranked second by the occurrence number of 9, which indicating that it makes contribution to the classification of the GE-RSVMC model.
Precuneus is considered as functional pivot of the default-mode network (Utevsky et al., 2014). There is a tight connection between the precuneus and cognitive processes (Fomina et al., 2016), and the precuneus is important in a wide spectrum of highly integrated tasks (Cavanna and Trimble, 2006), including visuo-spatial imagery, episodic memory retrieval and self-processing operations. Then the precuneus plays a role in egocentric spatial processing in the context of memory retrieval (Freton et al., 2014). The results of our study are consistent with some several current researches. For example, Yu et al. (2011) found that the summary AS map indicated lower gray matter volumes in precuneus compared with HC. Radulescu et al. (2013) found a reliance on bottom-up connections in AS among inferior frontal gyri, caudate and precuneus, which contrasted with cognitive control. Sevik et al. (2010) showed that the activation of the precuneus was above the baseline level (P < 0.05) for an 18-year-old male with AS and highly unusual calendar memory. These findings demonstrated that the precuneus is abnormal region in AS, which is beneficial to the clinical diagnosis of AS.
(3) Caudate Nucleus (CAU.R)
Caudate nucleus is another important brain region in our study, which is one of the prominent brain region detected by the GE-RSVMC model.
The lesions of caudate nucleus lead to impairments in planning and solving problems, mental flexibility, learning, attention, short-term and long-term memory, retrieval, and verbal fluency (Voelbel et al., 2006; Moretti et al., 2017). It is thought to play a role in behavioral monitoring (Schwerdt et al., 2017). Roine et al. (2015a) noted that AS patients have significant degrees of motor incoordination, which sometimes affects writing and drawing skills as well as posture, gait, and gesture incoordination. Some researchers also have the similar results as our findings. Leisman et al. (2014) found that the damage to caudate nucleus was associated with a variety of behavioral abnormalities including organizing behavioral responses and using verbal skills in problem solving. Faridi and Khosrowabadi (2017) noted that the alteration of caudate nuclei in volume was larger by the age in terms of pattern of brain structure in AS than HC. These results show that the study of caudate nucleus is helpful for the treatment of AS.
(4) Cuneus (CUN.R)
We also find that Cuneus is a more frequent brain region than remaining brain regions in our study. It is demonstrated that the cuneus plays an important role in classification, and the research of the cuneus is of great significance for the treatment of AS.
The cuneus locates in the occipital lobe (Zhu et al., 2016), and a lot of studies have shown that the cuneus have been related to the visual processing (Vanni et al., 2001; Gershfeld et al., 2015). The visuospatial processing of AS has more supernormal performance in adults than age-matched HC, but which is opposite in children (Chien et al., 2015; Roser et al., 2015). Other researchers such as Herrington et al. (2007) also discovered the difference between AS and HC, which is in line with our results. Cheng et al. (2011), Perkins et al. (2015), and Eilam-Stock et al. (2016) found that the activation of cuneus in AS patients was reduced compared with HC. We can draw a conclusion from the above findings that lesion occurring in the cuneus may lead to AS.
Limitations
Although our GE-RSVMC model has a great accuracy rate for the classification of AS and HC, there are still some limitations that prevented the model from being more optimized. Firstly, it is simple to use the index of functional connectivity in our study. In a further study, we can also construct other indicators to capture sample features and use these indicators to conduct a more comprehensive analysis of AS, such as multi-classification study of AS and normal people. In addition, considering that we only use the fMRI data of the sample, it is suggested to use the multi-mode data to classify and explore lesions, such as the gene data, structural image data and task-state fMRI. Finally, the performance of the cluster is related to the kernel function of each base classifier. We only use the based classifier with RBF kernel function in the paper. In the subsequent research, we can consider the use of multiple kernel base classifiers to improve the efficiency of the cluster.
Ethics Statement
Our study was based on secondary analysis of previously collected and publicly available data sets called ABIDE. This study was carried out in accordance with the recommendations of Health Insurance Portability and Accountability Act (HIPAA) guidelines, National Institutes of Health (NIH) Combined Neuroscience Institutional Review Board with written informed consent from all subjects. All subjects gave written informed consent in accordance with the Declaration of Helsinki. The protocol was approved by the National Institutes of Health (NIH) Combined Neuroscience Institutional Review Board. In particular, data of child participants were recruited by Erasmus University Medical Center Rotterdam, ETH Zürich, Georgetown University, Kennedy Krieger Institute, Kennedy Krieger Institute, Trinity Centre for Health Sciences, San Diego State University, Stanford University, and University of California, Davis. Informed assent and consent were obtained from all participants and their caregivers using IRB-approved language and procedures.
Author Contributions
X-aB proposed the design of the work and revised it critically for important intellectual content. JC, QS, and YL carried out the experiments for the work and drafted part of the work. XL and YW collected and interpreted the data and drafted part of the work. All the authors approved the final version to be published and agreed to be accountable for all aspects of the work in ensuring that questions related to the accuracy or integrity of any part of the work are appropriately investigated and resolved.
Funding
This work was supported by the National Science Foundation of China (Grant No. 61502167).
Conflict of Interest Statement
The authors declare that the research was conducted in the absence of any commercial or financial relationships that could be construed as a potential conflict of interest.
References
Bi, X. A., Shu, Q., Sun, Q., and Xu, Q. (2018a). Random support vector machine cluster analysis of resting-state fMRI in Alzheimer’s disease. PLoS One 13:e0194479. doi: 10.1371/journal.pone.0194479
Bi, X. A., Wang, Y., Shu, Q., Sun, Q., and Xu, Q. (2018b). Classification of autism spectrum disorder using random support vector machine cluster. Front. Genet. 9:18. doi: 10.3389/fgene.2018.00018
Bjørklund, G., Kern, J. K., Urbina, M. A., Saad, K., El-Houfey, A. A., Geier, D. A., et al. (2018). Cerebral hypoperfusion in autism spectrum disorder. Acta Neurobiol. Exp. 78, 21–29. doi: 10.21307/ane-2018-005
Bonnici, H. M., Richter, F. R., Yazar, Y., and Simons, J. S. (2016). Multimodal feature integration in the angular gyrus during episodic and semantic retrieval. J. Neurosci. 36, 5462–5471. doi: 10.1523/JNEUROSCI.4310-15.2016
Bucaille, A., Grandgeorge, M., Degrez, C., Mallégol, C., Cam, P., Botbol, M., et al. (2016). Cognitive profile in adults with Asperger syndrome using WAIS-IV: comparison to typical adults. Res. Autism Spect. Disord. 21, 1–9. doi: 10.1016/j.rasd.2015.09.001
Cai, B., Zille, P., Stephen, J. M., Wilson, T. W., Calhoun, V. D., and Wang, Y. P. (2017). Estimation of dynamic sparse connectivity patterns from resting state fMRI. IEEE Trans. Med. Imaging 37, 1224–1234. doi: 10.1109/TMI.2017.2786553
Cavanna, A. E., and Trimble, M. R. (2006). The precuneus: a review of its functional anatomy and behavioural correlates. Brain 129, 564–583. doi: 10.1093/brain/awl004
Channon, S., Crawford, S., Orlowska, D., Parikh, N., and Thoma, P. (2014). Mentalising and social problem solving in adults with Asperger’s syndrome. Cognit. Neuropsychiatry 19, 149–163. doi: 10.1080/13546805.2013.809659
Cheng, Y., Kun-Hsien, C., Fan, Y. T., and Lin, C. P. (2011). ANS: aberrant neurodevelopment of the social cognition network in adolescents with autism spectrum disorders. PLoS One 6:e18905. doi: 10.1371/journal.pone.0018905
Chien, Y. L., Gau, S. S., Shang, C. Y., Chiu, Y. N., Tsai, W. C., and Wu, Y. Y. (2015). Visual memory and sustained attention impairment in youths with autism spectrum disorders. Psychol. Med. 45, 2263–2273. doi: 10.1017/S0033291714003201
D’Argembeau, A., Cassol, H., Phillips, C., Balteau, E., Salmon, E., and Van, d. L. M. (2014). Brains creating stories of selves: the neural basis of autobiographical reasoning. Soc. Cogn. Affect. Neurosci. 9, 646–652. doi: 10.1093/scan/nst028
Di Napoli, A., Warrier, V., Baron-Cohen, S., and Chakrabarti, B. (2015). Genetic variant rs17225178 in the ARNT2 gene is associated with Asperger syndrome. Mol. Autism 6:9. doi: 10.1186/s13229-015-0009-0
Eilam-Stock, T., Wu, T., Spagna, A., Egan, L. J., and Fan, J. (2016). Neuroanatomical alterations in high-functioning adults with autism spectrum disorder. Front. Neurosci. 10:237. doi: 10.3389/fnins.2016.00237
Ettingerveenstra, H. V., Mcallister, A., Lundberg, P., Karlsson, T., and Engström, M. (2016). Higher language ability is related to angular gyrus activation increase during semantic processing, independent of sentence incongruency. Front. Hum. Neurosci. 10:110. doi: 10.3389/fnhum.2016.00110
Faridi, F., and Khosrowabadi, R. (2017). Behavioral, cognitive and neural markers of Asperger syndrome. Basic Clin. Neurosci. 8, 349–359. doi: 10.18869/nirp.bcn.8.5.349
Fomina, T., Lohmann, G., Erb, M., Ethofer, T., Schölkopf, B., and Grosse-Wentrup, M. (2016). Self-regulation of brain rhythms in the precuneus: a novel BCI paradigm for patients with ALS. J. Neural Eng. 13:066021. doi: 10.1088/1741-2560/13/6/066021
Frank, R., Schulze, L., Hellweg, R., Koehne, S., and Roepke, S. (2018). Impaired detection and differentiation of briefly presented facial emotions in adults with high-functioning autism and asperger syndrome. Behav. Res. Ther. 104:7. doi: 10.1016/j.brat.2018.02.005
Freton, M., Lemogne, C., Bergouignan, L., Delaveau, P., Lehéricy, S., and Fossati, P. (2014). The eye of the self: precuneus volume and visual perspective during autobiographical memory retrieval. Brain Struct. Funct. 219, 959–968. doi: 10.1007/s00429-013-0546-2
Gershfeld, K., Ng, J., Book, G., Stone, A., Strange, S., Papasavas, P., et al. (2015). A double-blind sham/deflation study evaluating reward and somatosensory brain activation after milkshake taste in successful laparoscopic adjustable gastric band patients. Surg. Obes. Relat. Dis. 11:S58. doi: 10.1016/j.soard.2015.08.063
Ghaziuddin, M. (2010). Brief report: should the DSM V drop asperger syndrome? J. Autism Dev. Disord. 40, 1146–1148. doi: 10.1007/s10803-010-0969-z
Gillberg, I. C., Helles, A., Billstedt, E., and Gillberg, C. (2016). Boys with Asperger syndrome grow up: psychiatric and neurodevelopmental disorders 20 years after initial diagnosis. J. Autism. Dev. Disord. 46, 74–82. doi: 10.1007/s10803-015-2544-0
Harlianto, P. A., Adji, T. B., and Setiawan, N. A. (2017). “Comparison of machine learning algorithms for soil type classification,” in Proceedings of the 3rd International Conference on Science and Technology – Computer, Yogyakarta, 7–10. doi: 10.1109/ICSTC.2017.8011843
Herrington, J. D., Baroncohen, S., Wheelwright, S. J., Singh, K. D., Bullmore, E. T., Brammer, M., et al. (2007). The role of MT(/V5 during biological motion perception in Asperger syndrome: an fMRI study. Res. Autism Spectr. Disord. 1, 14–27. doi: 10.1016/j.rasd.2006.07.002
Hirjak, D., Wolf, R. C., Koch, S. C., Mehl, L., Kelbel, J. K., Kubera, K. M., et al. (2014). Neurological abnormalities in recent-onset schizophrenia and asperger-syndrome. Front. Psychiatry 5:91. doi: 10.3389/fpsyt.2014.00091
Hoang, N. D., and Nguyen, Q. L. (2018). A novel method for asphalt pavement crack classification based on image processing and machine learning. Eng. Comput. 1, 1–12. doi: 10.1007/s00366-018-0611-9
Jensen, C. M., Steinhausen, H.-C., and Lauritsen, M. B. (2014). Time trends over 16 years in incidence-rates of autism spectrum disorders across the lifespan based on nationwide danish register data. J. Autism Dev. Disord. 44, 1808–1818. doi: 10.1007/s10803-014-2053-6
Jiang, Q., Ma, L., and Zhang, S. (2018). Cognition, emotion and brain mechanism: neural mechanism of animation cognition based on gender difference. NeuroQuantology 16, 454–460. doi: 10.14704/nq.2018.16.5.1348
Kakihara, Y., Takiguchi, T., Ariki, Y., Nakai, Y., Takada, S., Kakihara, Y., et al. (2015). Investigation of classification using pitch features for children with autism spectrum disorders and typically developing children. Am. J. Sign. Process. 5, 1–5. doi: 10.5923/j.ajsp.20150501.01
Kamp-Becker, I., Smidt, J., Ghahreman, M., Heinzel-Gutenbrunner, M., Becker, K., and Remschmidt, H. (2010). Categorical and dimensional structure of autism spectrum disorders: the nosologic validity of Asperger syndrome. J. Autism Dev. Disord. 40, 921–929. doi: 10.1007/s10803-010-0939-5
Leisman, G., Braunbenjamin, O., and Melillo, R. (2014). Cognitive-motor interactions of the basal ganglia in development. Front. Syst. Neurosci. 8:16. doi: 10.3389/fnsys.2014.00016
Lorenzo, G., Lledó, A., Pomares, J., Roig, R., and Arnaiz, P. (2016). Bibliometric indicators in the study of Asperger syndrome between 1990 and 2014. Scientometrics 109, 377–388. doi: 10.1007/s11192-016-1975-5
Lugnegård, T., Hallerbäck, M. U., and Gillberg, C. (2015). Asperger syndrome and schizophrenia: overlap of self-reported autistic traits using the Autism-spectrum Quotient (AQ). Nord. J. Psychiatry 69, 268–274. doi: 10.3109/08039488.2014.972452
Lugnegård, T., Unenge Hallerbäck, M., Hjärthag, F., and Gillberg, C. (2013). Social cognition impairments in Asperger syndrome and schizophrenia. Schizophr. Res. 143, 277–284. doi: 10.1016/j.schres.2012.12.001
Mat Razi, N. I., Othman, M., and Wahab, A. (2015). Classification of resting state electroencephalography for the identification of Asperger’s Syndrome. Adv. Sci. Lett. 21, 3084–3087. doi: 10.1166/asl.2015.6492
Montgomery, J. M., Stoesz, B. M., and McCrimmon, A. W. (2013). Emotional intelligence, theory of mind, and executive functions as predictors of social outcomes in young adults with Asperger syndrome. Focus Autism Other Dev. Disabil. 28, 4–13. doi: 10.1177/1088357612461525
Moretti, R., Caruso, P., Crisman, E., and Gazzin, S. (2017). Basal ganglia: their role in complex cognitive procedures in experimental models and in clinical practice. Neurol. India 65, 814–825. doi: 10.4103/neuroindia.NI_850_16
Moss, J., and Schunn, C. D. (2015). Comprehension through explanation as the interaction of the brain’s coherence and cognitive control networks. Front. Hum. Neurosci. 9:562. doi: 10.3389/fnhum.2015.00562
Oliver, L. D., Neufeld, R. W. J., Dziobek, I., and Mitchell, D. G. V. (2016). Distinguishing the relationship between different aspects of empathic responding as a function of psychopathic, autistic, and anxious traits. Personal. Ind. Differ. 99, 81–88. doi: 10.1016/j.paid.2016.04.058
Perkins, T. J., Bittar, R. G., Mcgillivray, J. A., and Stokes, M. A. (2015). Increased premotor cortex activation in high functioning autism during action observation. J. Clin. Neurosci. 22, 664–669. doi: 10.1016/j.jocn.2014.10.007
Pick, H., and Lavidor, M. (2017). P163 The role of the angular gyrus in creative and automatic tasks. Clin. Neurophysiol. 128:e97. doi: 10.1016/j.clinph.2016.10.284
Price, A. R., Bonner, M. F., Peelle, J. E., and Grossman, M. (2015). Converging evidence for the neuroanatomic basis of combinatorial semantics in the angular gyrus. J. Neurosci. 35, 3276–3284. doi: 10.1523/JNEUROSCI.3446-14.2015
Pugh, K. R., Mencl, W. E., Shaywitz, B. A., Shaywitz, S. E., Fulbright, R. K., Constable, R. T., et al. (2010). The angular gyrus in developmental dyslexia: task-specific differences in functional connectivity within posterior cortex. Psychol. Sci. 11, 51–56. doi: 10.1111/1467-9280.00214
Radulescu, E., Minati, L., Ganeshan, B., Harrison, N. A., Gray, M. A., Beacher, F. D., et al. (2013). Abnormalities in fronto-striatal connectivity within language networks relate to differences in grey-matter heterogeneity in Asperger syndrome. Neuroimage Clin. 2, 716–726. doi: 10.1016/j.nicl.2013.05.010
Rodger, S., and Vishram, A. (2010). Mastering social and organization goals: strategy use by two children with Asperger syndrome during cognitive orientation to daily occupational performance. Phys. Occupat. Ther. Pediatr. 30:264. doi: 10.3109/01942638.2010.500893
Roine, U., Roine, T., Salmi, J., Wendt, N. V., Tani, P., Leppämäki, S., et al. (2015a). Abnormal wiring of the connectome in adults with high-functioning autism spectrum disorder. Mol. Autism 6:65. doi: 10.1186/s13229-015-0058-4
Roine, U., Salmi, J., Roine, T., Wendt, T. N.-V., Leppämäki, S., Rintahaka, P., et al. (2015b). Constrained spherical deconvolution-based tractography and tract-based spatial statistics show abnormal microstructural organization in Asperger syndrome. Mol. Autism 6:4. doi: 10.1186/2040-2392-6-4
Roser, M. E., Aslin, R. N., Mckenzie, R., Zahra, D., and Fiser, J. (2015). Enhanced visual statistical learning in adults with autism. Neuropsychology 29:163. doi: 10.1037/neu0000137
Rueda, P., Fernández-Berrocal, P., and Baron-Cohen, S. (2015). Dissociation between cognitive and affective empathy in youth with Asperger syndrome. Eur. J. Dev. Psychol. 12, 85–98. doi: 10.1080/17405629.2014.950221
Sato, W., Kubota, Y., Kochiyama, T., Uono, S., Yoshimura, S., Sawada, R., et al. (2014). Increased putamen volume in adults with autism spectrum disorder. Front. Hum. Neurosci. 8:957. doi: 10.3389/fnhum.2014.00957
Schwarzová, L. (2018). Possibilities of support of special needs students at the graduation exam - case study of a student with asperger syndrome focusing on the modification of graduation exam conditions. society. integration. education. Proc. Int. Sci. Conf. 3:147. doi: 10.17770/sie2018vol1.3389
Schwerdt, H. N., Shimazu, H., Amemori, K.-I., Amemori, S., Tierney, P. L., Gibson, D. J., et al. (2017). Long-term dopamine neurochemical monitoring in primates. Proc. Natl. Acad. Sci. U.S.A. 114:13260. doi: 10.1016/j.pbb.2018.05.010
Seghier, M. L. (2013). The angular gyrus: multiple functions and multiple subdivisions. Neuroscientist 19, 43–61. doi: 10.1177/1073858412440596
Sevik, A. E., Kultur, E. C., Demirel, H., Oguz, K. K., Akca, O., Ergun, E. L., et al. (2010). An asperger syndrome patient with highly exceptional calendar memory skills. Turkish J. Psychiatry 21:1. doi: 10.5080/u6146
Siuly, S., and Zhang, Y. (2016). Medical big data: neurological diseases diagnosis through medical data analysis. Data Sci. Eng. 1, 54–64. doi: 10.1007/s41019-016-0011-3
Soulieres, I., Dawson, M., Gernsbacher, M. A., and Mottron, L. (2011). The level and nature of autistic intelligence II: what about Asperger syndrome? PLoS One 6:e25372. doi: 10.1371/journal.pone.0025372
Sung, M., Goh, T. J., Tan, B. L. J., Chan, J. S., and Liew, H. S. A. (2018). Comparison of DSM-IV-TR and DSM-5 criteria in diagnosing autism spectrum disorders in Singapore. J. Autism Dev. Disord. 48, 3273–3281. doi: 10.1007/s10803-018-3594-x
Thompson, L., Thompson, M., and Reid, A. (2010). Functional neuroanatomy and the rationale for using EEG biofeedback for clients with Asperger’s syndrome. Appl. Psychophysiol. Biofeedback 35, 39–61. doi: 10.1007/s10484-009-9095-0
Tseng, Y.-L., Yang, H. H., Savostyanov, A. N., Chien, V. S. C., and Liou, M. (2015). Voluntary attention in Asperger’s syndrome: brain electrical oscillation and phase-synchronization during facial emotion recognition. Res. Autism Spectr. Disord. 13, 32–51. doi: 10.1016/j.rasd.2015.01.003
Utevsky, A. V., Smith, D. V., and Huettel, S. A. (2014). Precuneus is a functional core of the default-mode network. J. Neurosci. Off. J. Soc. Neurosci. 34:932. doi: 10.1523/JNEUROSCI.4227-13.2014
Vanni, S., Tanskanen, T., Seppä, M., Uutela, K., and Hari, R. (2001). Coinciding early activation of the human primary visual cortex and anteromedial cuneus. Proc. Natl. Acad. Sci. U.S.A. 98, 2776–2780. doi: 10.1073/pnas.041600898
Voelbel, G. T., Bates, M. E., Buckman, J. F., Pandina, G., and Hendren, R. L. (2006). Caudate nucleus volume and cognitive performance: are they related in childhood psychopathology? Biol. Psychiatry 60, 942–950. doi: 10.1016/j.biopsych.2006.03.071
Wilson, C. E., Happé, F., Wheelwright, S. J., Ecker, C., Lombardo, M. V., Johnston, P., et al. (2014). The neuropsychology of male adults with high-functioning autism or asperger syndrome. Autism Res. 7, 568–581. doi: 10.1002/aur.1394
Wilson, J. (2015). Chris mitchell: mindful living with Asperger’s syndrome: everyday mindfulness practices to help you tune in to the present moment. Jessica Kingsley Publishers, London, 2014, 128 pp. Mindfulness 6, 146–149. doi: 10.1007/s12671-014-0343-x
Woodbury-Smith, M. R., Robinson, J., Wheelwright, S., and Baron-Cohen, S. (2005). Screening adults for Asperger syndrome using the AQ: a preliminary study of its diagnostic validity in clinical practice. J. Autism. Dev. Disord. 35, 331–335. doi: 10.1007/s10803-005-3300-7
Woods, A. G., Mahdavi, E., and Ryan, J. P. (2013). Treating clients with Asperger’s syndrome and autism. Child Adolesc. Psychiatry Ment. Health 7:32. doi: 10.1186/1753-2000-7-32
Yanai, T., and Maekawa, H. (2014). Inhibition of automatic semantic processing in children with high-functioning pervasive developmental disorders having reading difficulty. J. Spec. Educ. Res. 2, 25–33. doi: 10.6033/specialeducation.2.25
Yu, K. K., Cheung, C., Chua, S. E., and Mcalonan, G. M. (2011). Can asperger syndrome be distinguished from autism? an anatomic likelihood meta-analysis of MRI studies. J. Psychiatry Neurosci. Jpn. 36:412. doi: 10.1503/jpn.100138
Zhu, Y., Fan, Q., Zhang, H., Qiu, J., Ling, T., Xiao, Z., et al. (2016). Altered intrinsic insular activity predicts symptom severity in unmedicated obsessive-compulsive disorder patients: a resting state functional magnetic resonance imaging study. BMC Psychiatry 16:104. doi: 10.1186/s12888-016-0806-9
Keywords: genetic-evolutionary random SVM cluster, functional connectivity, classification, Asperger syndrome, abnormal brain regions
Citation: Bi X-a, Chen J, Sun Q, Liu Y, Wang Y and Luo X (2018) Analysis of Asperger Syndrome Using Genetic-Evolutionary Random Support Vector Machine Cluster. Front. Physiol. 9:1646. doi: 10.3389/fphys.2018.01646
Received: 01 August 2018; Accepted: 31 October 2018;
Published: 21 November 2018.
Edited by:
Zhixiong Zhong, Minnan Normal University, ChinaCopyright © 2018 Bi, Chen, Sun, Liu, Wang and Luo. This is an open-access article distributed under the terms of the Creative Commons Attribution License (CC BY). The use, distribution or reproduction in other forums is permitted, provided the original author(s) and the copyright owner(s) are credited and that the original publication in this journal is cited, in accordance with accepted academic practice. No use, distribution or reproduction is permitted which does not comply with these terms.
*Correspondence: Xia-an Bi, Yml4aWFhbkBobnUuZWR1LmNu
 Xia-an Bi
 Jie Chen