 Rodrigo Gomes da Rosa1
 Henrique Bianchi Oliveira1
 Natalia Andrea Gomeñuka2
 Marcos Paulo Bienert Masiero1
 Edson Soares da Silva1
 Ana Paula Janner Zanardi1
 Alberito Rodrigo de Carvalho3
 Pedro Schons1
 Leonardo Alexandre Peyré-Tartaruga1*
- 1Laboratório de Pesquisa do Exercício, Universidade Federal do Rio Grande do Sul, Porto Alegre, Brazil
- 2Departamento de Investigación de la Facultad de Ciencias de la Salud, Universidad Católica de las Misiones (UCAMI), Posadas, Argentina
- 3Physical Therapy College, Universidade Estadual do Oeste do Paraná (UNIOESTE), Cascavel, Brazil
Background: Elastic bouncing is a physio-mechanical model that can elucidate running behavior in different situations, including landing and takeoff patterns and the characteristics of the muscle-tendon units during stretch and recoil in running. An increase in running speed improves the body’s elastic mechanisms. Although some measures of elastic bouncing are usually carried out, a general description of the elastic mechanism has not been explored in running performance. This study aimed to compare elastic bouncing parameters between the higher- and lower-performing athletes in a 3000 m test.
Methods: Thirty-eight endurance runners (men) were divided into two groups based on 3000 m performance: the high-performance group (Phigh; n = 19; age: 29 ± 5 years; mass: 72.9 ± 10 kg; stature: 177 ± 8 cm; 3000time: 656 ± 32 s) and the low-performance group (Plow; n = 19; age: 32 ± 6 years; mass: 73.9 ± 7 kg; stature: 175 ± 5 cm; 3000time: 751 ± 29 s). They performed three tests on different days: (i) 3000 m on a track; (ii) incremental running test; and (iii) a running biomechanical test on a treadmill at 13 different speeds from 8 to 20 km h−1. Performance was evaluated using the race time of the 3000 m test. The biomechanics variables included effective contact time (tce), aerial time (tae), positive work time (tpush), negative work time (tbreak), step frequency (fstep), and elastic system frequency (fsist), vertical displacement (Sv) in tce and tae (Sce and Sae), vertical force, and vertical stiffness were evaluated in a biomechanical submaximal test on treadmill.
Results: The tae, fsist, vertical force and stiffness were higher (p < 0.05) and tce and fstep were lower (p < 0.05) in Phigh, with no differences between groups in tpush and tbreak.
Conclusion: The elastic bouncing was optimized in runners of the best performance level, demonstrating a better use of elastic components.
Introduction
Individual differences in locomotor performance depend on specific biomechanical patterns. In bouncing terrestrial gaits, the body is idealized as a spring-mass composition thereby acting as a simple elastic system. The elastic mechanism is a well-recognized trait of human running to minimize the energy expenditure. It is known that animals, such as kangaroos (Kram and Dawson, 1998) and ostriches (Rubenson et al., 2011), make better use of the elastic mechanism and can achieve high speeds at a lower energy cost than humans. In humans, biological development and aging limit the utilization of elastic bouncing (Cavagna et al., 2008b), but this function is fully developed in adulthood, and it is related to the optimization of the use of muscle-tendon units (Legramandi et al., 2013). More than unveiling the function of single joints, the elastic model denotes whole-body aspects converging to the passive/non metabolic function of elastic energy storage and recovery (Blickhan, 1989; McMahon and Cheng, 1990). However, the role of performance level on elastic bouncing is not completely understood in distance runners.
The elastic function of muscle-tendon units during distance running is determined by two main asymmetries: the landing-takeoff asymmetry and the asymmetry of rebound (Cavagna, 2009). The former occurs partitioning temporally the contact time in positive and negative work of the center of body mass (BCoM), namely tpush (time in which mechanical energy is released at the push), and tbrake (time in which mechanical energy is absorbed at the brake), respectively (see Figure 1). The latter occurs dividing the vertical oscillation of BCoM during the entire step in two temporal components: the inferior vertical oscillation, called effective contact time (tce), when the vertical force (Fv) is higher than body weight is approximately equal to that of the upper part during the effective aerial time (tae), when the vertical force on the ground is less than the body weight. Elastic bounce model is dependent on time and spatial variables. In an ideal body’s elastic bounce, the tpush equals tbrake,(symmetric landing-takeoff) and the rebound is asymmetric resulting in a tae higher than the tce due to needed to equilibrate the vertical momentum (Cavagna, 2006). These optimized conditions take place at high speeds of human running. In a symmetric elastic system, tbrake is identical to tpush. However, in slow human running, these similarities are not found because the rebound is asymmetric: specifically, at low and intermediate running speeds, the tpush is longer than tbrake. Conversely, at slow speeds of human running, the tpush is longer than tbrake (asymmetric landing-takeoff), and the tce is identical to tae (symmetric rebound). In a symmetric elastic system, tce is identical to tae. At high speeds, the duration of the upper part of the oscillation is higher than that of the lower part, i.e., tae < tce. This phenomenon is called an asymmetric rebound (Cavagna et al., 1988). These asymmetries may be sensitive to demonstrated differences between faster and slower runners.
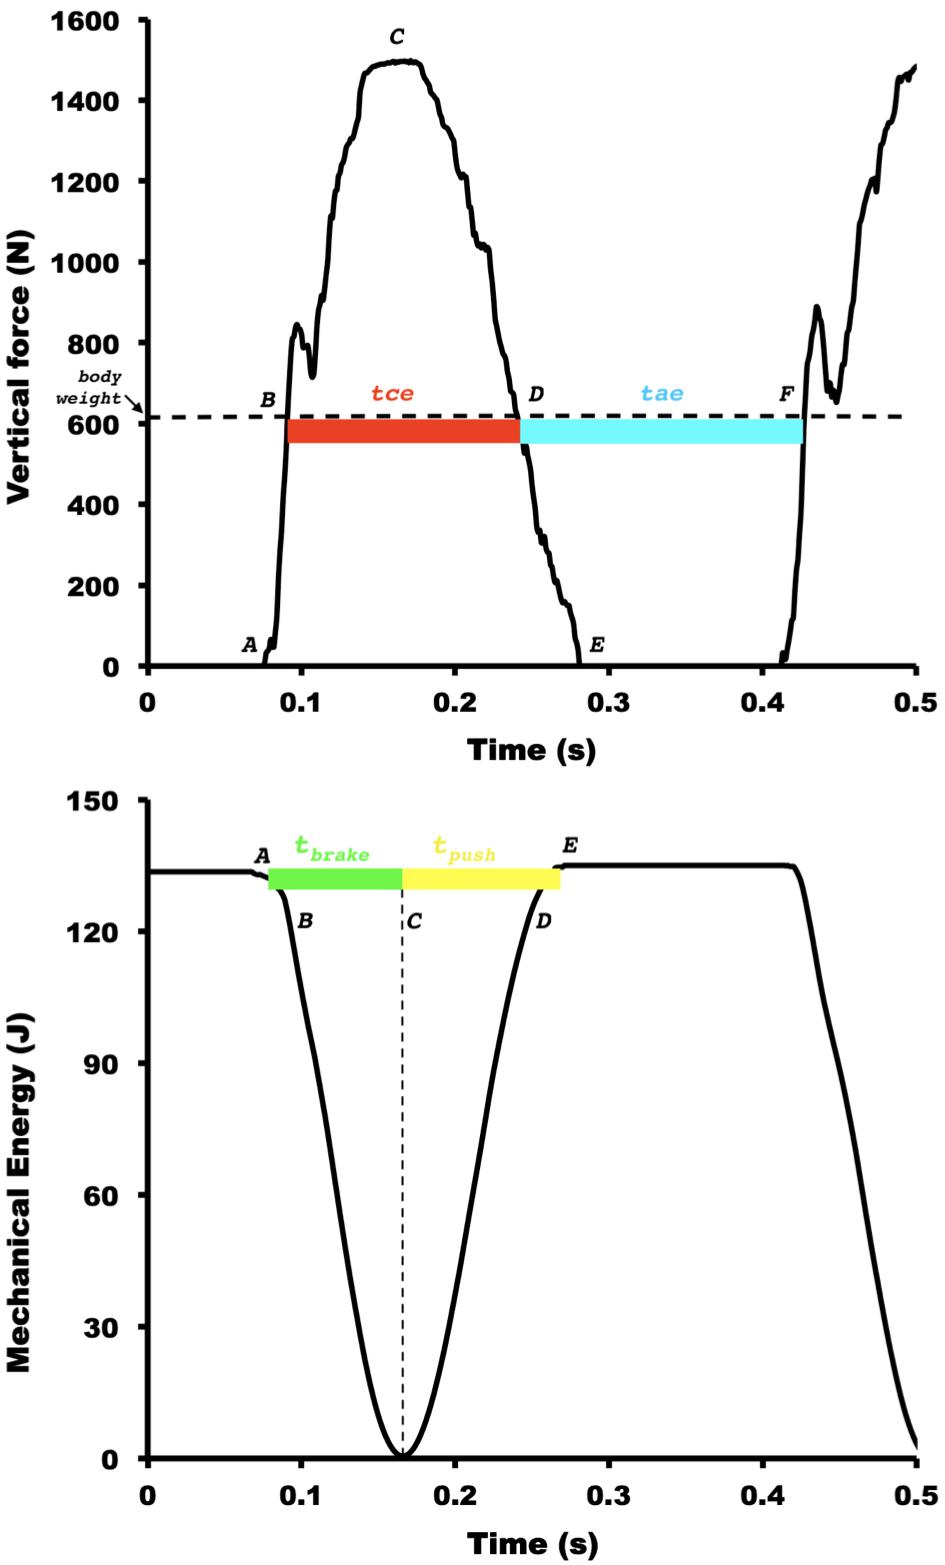
Figure 1. Representative figure for the vertical ground reaction force, external mechanical energy, and two main temporal asymmetries during running at 13 km h−1. The letters indicate the discrete points defining the main phases of spring-mass model: (A) landing, (B) downward equilibrium point (instant where body weight equals to vertical ground reaction forces (GRF) during downward trajectory of the body), (C) maximal vertical force and transition between negative and positive work, (D) upward equilibrium point (instant where body weight equals to vertical GRF during upward trajectory of the body), (E) takeoff, (F) second downward equilibrium point. The effective contact time (tce, B–D, in red) and the effective aerial time (tae, D–F, in blue) represent the asymmetry of rebound. The positive work time (tpush, C–E, in yellow) and negative work time (tbrake, A–C, in green) represent the landing-takeoff asymmetry. The horizontal dashed black line in the superior panel denotes the body weight. The vertical dashed black line in the inferior panel indicates the transition instant between negative and positive work.
In addition to temporal characteristics, the asymmetry of rebound may be analyzed in spatial terms. And, again, these asymmetries are highly dependent on the horizontal speed (Blickhan, 1989). The relative amount of vertical displacement of the BCoM (Sv) taking place at ground contact increases markedly with running speed due almost exclusively to vertical displacement during the aerial phase (Cavagna et al., 2008a; Cavagna, 2010). According to the spring-mass model, the vertical displacement of the BCoM is divided into Sae and Sce, which occur during tae and tce, respectively (Cavagna and Legramandi, 2015). The duration of the lower part of the oscillation represents the half-period of the bouncing system, and the Sv during this period represents the amplitude of the oscillation of the BCoM (Cavagna et al., 1988, 2005; Blickhan, 1989; McMahon and Cheng, 1990).
In each bounce, some of the BCoM mechanical energy is absorbed by muscle-tendon units during the tbrake and is successively restored through the tpush. The BCoM vertical motion during this rebound defines the relationship between the apparent natural frequency of the bouncing system (fsist) and the step frequency (fstep) at different speeds (Cavagna et al., 1988). While the contact time and step frequency are biomechanical outcomes often utilized to try explaining the running performance and economy, these variables do not reflect the integrative elastic function of muscle-tendon units (Cavagna, 2006). The fsist and tce, conversely, represent critical parameters of spring-mass model and, therefore, may be more closely related to running performance.
Additionally, the analysis of the ground reaction forces (GRF) improves the understanding of long-distance running performance. In elite athletes, the average peak force is correlated with performance and running economy (RE). In other research evaluating female runners, more substantial decreases in VO2 were associated with the highest improvements in the alignment of the resultant GRF and leg axis during propulsion. This last finding was primarily due to runners applying their resultant GRF more horizontally (Moore, 2016). On the other hand, in high-level Kenyan runners, no correlation between GRF and RE was found (Santos-Concejero et al., 2017). The sum of horizontal and vertical peak forces was found to be negatively correlated to 3000-m running performance (Støren et al., 2011). The vertical force (Fv) is a determinant of vertical stiffness (kvert), which may reflect the optimization of elastic bouncing (see section “Vertical Stiffness and System Frequency”). Therefore, trained distance runners were divided in two groups according to their performance, and analyzed for the main mechanical parameters and landing-takeoff asymmetries of spring-mass model. We hypothesized that the elastic bouncing parameters should be more optimized in the faster runners group, i.e., that faster distance runners would have a more asymmetric tae/tce relation, higher Fv, kvert, and fsist than slower runners.
Materials and Methods
Subjects and Ethics Statement
The experiments were conducted on 38 men runners (Table 1). Inclusion criteria were minimum age of 18 years and maximum of 40 years, minimum training time of 2 years, minimum weekly training of 20 km. The exclusion criteria were: injury or illness that precludes or impairs the practice of running in the last 2 years, use of medication that affects running performance and being a smoker. The runners were divided into two groups (n = 19 in each group), separated by the median performance in the 3000 m test, the high-performance group (Phigh) with time 682 ± 56 s and average speed 16.5 ± 0.9 km.h−1 and the low- performance group (Plow) with time 765 ± 45 s and average speed 14.9 ± 1.0 km.h−1. All runners were trained by professional coaches. The trained only distance running without cross-training programs (e.g., plyometrics, core, etc). The runners trained commonly on overground/outdoor environment, and, however, they were habituated to run on treadmills. The runners were classified as level 3 (trained) for Plow and level 4 (highly trained) for Phigh in accordance with the guidelines proposed by De Pauw et al. (2013). Further, the organization of groups followed the aforementioned guidelines. The institutional ethics committee (No. 1.946.049 of the Universidade Federal do Rio Grande do Sul, Brazil) approved this study and the procedures conformed to the latest revision of the Declaration of Helsinki. All participants were aware of the potential risks and discomforts associated with this study before signing the informed consent form.
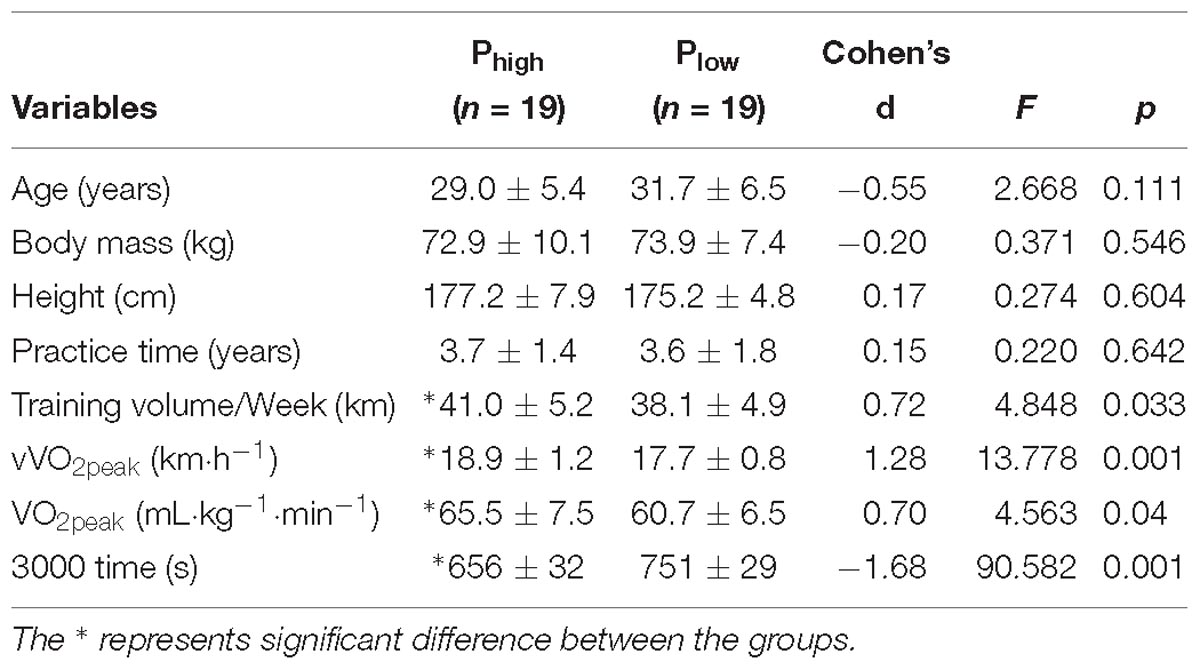
Table 1. Means and standard deviation of sample characterization for high- and low-performance groups.
Design
All athletes performed three tests on different days with a minimum interval of 24 h between them. On the first day, an incremental maximal running test was performed. The breath-by-breath oxygen consumption (VO2) and carbon dioxide were continuously measured using a telemetric portable gas analyzer (K5, Cosmed, Rome, Italy) attached to a computer, and the heart rate was measured using a cardiac monitor (Cosmed, Rome, Italy). On the second day, the 3000 m performance test was carried out in a outdoor athletic track (SportFlex Super X, Mondo, Italy). On the third day, the athletes performed the biomechanical submaximal running on a treadmill instrumented with force sensors at different speeds. To calculate the spring-mass-model components, Cavagna’s methods were utilized (Cavagna et al., 1997, 2008b).
Incremental Running Test
After 3 min of warm-up at 8–8.5 km.h−1, athletes started the protocol at 9 km.h−1 with a fixed treadmill grade of 1% (Jones and Doust, 1996). After each 25-s interval, the speed was increased by 0.3 km.h−1 until volunteers reached exhaustion. Athletes were encouraged to continue for as long as possible. After exhaustion, the athletes underwent a 5-min recovery protocol (Lourenço et al., 2011).
3000 m Test Performance
The 3000 m test was performed on an official athletics track. The athlete had 10 min to warm-up, including jogging and running on the track and free stretching within the given time. Two experienced researchers were at the start and the finish line of the 3000 m to record the time. The athlete was verbally encouraged to perform his best.
Biomechanical Running Test
The athletes performed a 10-min warm-up on the treadmill at a speed of 9–10 km.h−1. The athletes ran at least 45 if at most 120 s according to the speed of the test (8, 9, 10, 11, 12, 13, 14, 15, 16, 17, 18, 19, and 20 km.h−1) and the kinetic data were recorded during the final 20 s of the each trial. The interval between each test was at least 2 min or until the athlete achieved full recovery on the Total Quality Recovery scale (Kentta and Hassmen, 1998) in order to avoid possible effects of fatigue (Fischer et al., 2015). The order of the tests was determined by simple randomization1.
Data Acquisition of Ground Reaction Forces
An instrumented treadmill (super ATL model, Inbramed, Porto Alegre, Brazil) with four three dimensional load cell was used for data collection. The sensor had a low-pass and second-order filter with a cut-off frequency of 30 Hz. The data was collected with at 1000 Hz per canal with Instor software (Porto Alegre, Brazil) and a custom LabVIEW system (National Instruments, Austin, United States), and the signal was proportional to the total force collected by sensors in a vertical direction. We used the vertical component of the GRF because the spring-mass model idealized for human running (Blickhan, 1989; McMahon and Cheng, 1990) applies only the vertical GRF. Data acquisition and analysis were performed via a dedicated DAQ board and custom LabView software (National Instruments, Austin, United States). Before each acquisition, the system was calibrated to the equipment standard. There were 13 acquisitions in total, one of each speed performed by the athlete. The vertical velocities (Vv) of the BCoM were obtained as follows.
Landing Takeoff, Vertical Displacement, and Step Length
Ten steps of each speed were selected for analysis. The brake and push durations, respectively, tbrake, and tpush (see the Figure 1) were calculated as the time intervals in which the dEcm (t)/dt signals were below (for tbrake), and above (for tpush) of zero. The time interval where the dEcm (t)/dt signal ≈ zero was considered the aerial time (Cavagna, 2006).
The step period and the vertical oscillation Sv of the BCoM were divided in two parts: a lower part, which occurred when the vertical force measured by the force platform was greater than the body weight (tce and Sce), and an upper part, which occurred when the vertical force was smaller than body weight (tae and Sae, Figure 1). The step period and the vertical displacement were also divided into the fractions taking place during the ground contact time (tc and Sc) and during the aerial time (ta and Sa). The measurement procedure and physical meaning of the Sv fractions have been described previously (Cavagna et al., 2008b; Cavagna, 2010). The step length (L) was calculated by multiplying the duration of the step by the average forward velocity (Cavagna et al., 1988, 2008a).
The vertical force, Fv, during the stance phase is Fv = body weight + Mb av, where av is the vertical acceleration of the BCoM, i.e., the time derivative of its vertical velocity, Vv. When the Vv and Ekv (0.5 Mb Vv2) are at a maximum, the derivative is nil, av = 0, and as a consequence Fv = body weight. The locations of the Ekv peaks attained during the step were therefore used to determine the instants where the vertical force equaled the body weight (Cavagna et al., 2008b).
Vertical Stiffness and System Frequency
The mass-specific vertical stiffness, k/Mb, is given by the slope of the relationship between vertical acceleration (av) and Sv in the range corresponding to the amplitude of the oscillation of the spring-mass system, i.e., from its equilibrium position (av = 0) to its maximal deformation av,mx; (Cavagna et al., 1988). The mass-specific vertical stiffness was therefore measured as k/Mb = av,mx/Sce, where Sce is the amplitude of the oscillation, i.e., the vertical displacement of the BCoM from av = 0 to av,mx. Correspondingly, the natural frequency of the spring–mass system was calculated as fsist = 1/(2tce) = (k/Mb)0.5/(2π).
Statistical Analysis
The statistical tests were performed using the SPSS 25 package (IBM Corporation, Inc., New York, United States). All descriptive statistics presented in the text, tables and figures are mean values ± SD. The level of significance was α = 0.05. Generalized linear analysis models (GLMM) were used and Bonferroni post hoc tests were used to find statistical differences. Initially, intra-subject variability was tested to determine candidate random variables due to the hierarchical nature in GLMM (Nakagawa and Schielzeth, 2013). The condition was not found to be a variable according to the test of compliance with the intraclass correlation coefficient (ICC-pre) of the analysis of variance components by the maximum restricted likelihood method. The pre-ICC was not higher than 5%, and none had a random effect. The Cohen’s coefficient (d) was calculated to determining the effect size between 0.2 to 0.5 to small, 0.5 to 0.8 medium and higher than 0.8 to large effect (Cohen, 2013). All individual results are shown in the Supplementary Material.
Results
Table 1 shows the characterization of subjects. Age, body mass, height, practice time were similar between groups. The 3000 m running performance, the vVO2peak, and VO2peak were higher in the Phigh.
Figure 2 shows the step phase, the phases of the bouncing system and the tpush, tbrake durations for Phigh and Plow. It was observed that ta was higher for Phigh (F = 13.987, p < 0.01); however, in tc there was no difference between groups (F = 0.001, p = 0.971), while in tce was lower (F = 6.328, p < 0.01) and tae was grater (F = 13,987, p < 0.01) in Phigh. The tpush and tbrake showed no differences between groups (F = 2.159, p = 0.142 and F = 0.108, p = 0.742, respectively).
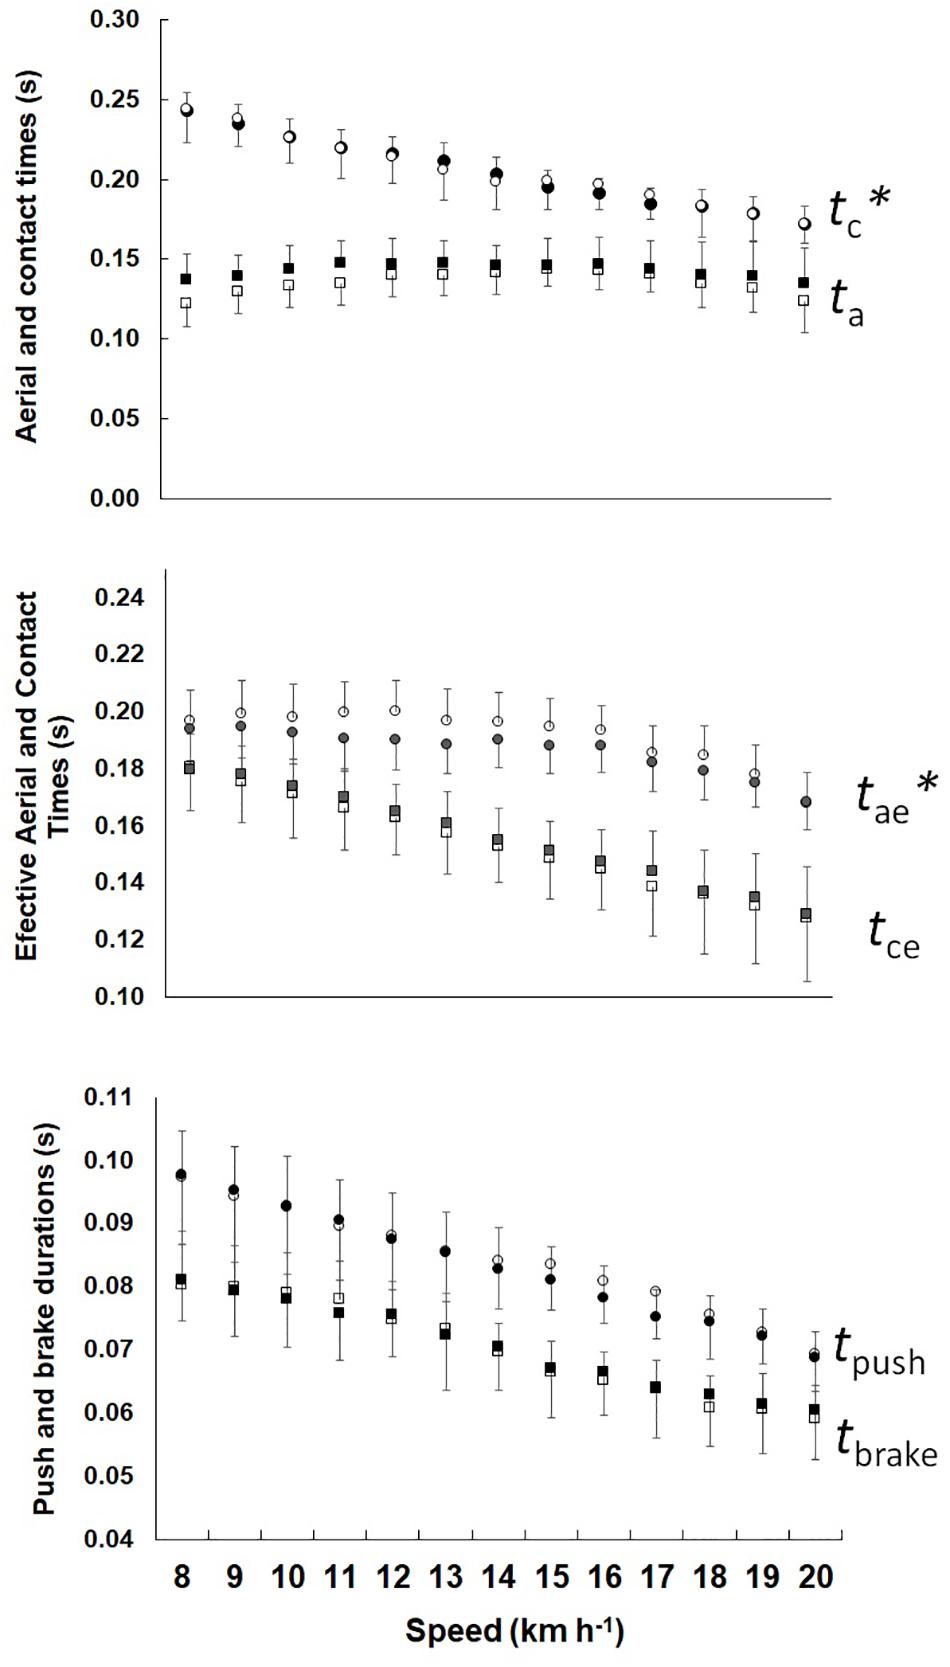
Figure 2. Mean and standard deviation in aerial and contact times, effective aerial, and contact times, tpush and tbrake durations plotted as a function of the speed. Left show Phigh and right Plow. The ∗ represents significant difference between the groups.
The kvert and the Fv are shown in the Figure 3. The two charts are presented together because the stiffness is the ratio between Fv and Sce, and it is possible to observe their relationship. The results show that kvert (F = 4.460, p < 0.05) and Fv (F = 30.824, p < 0.01) were greater in Phigh.
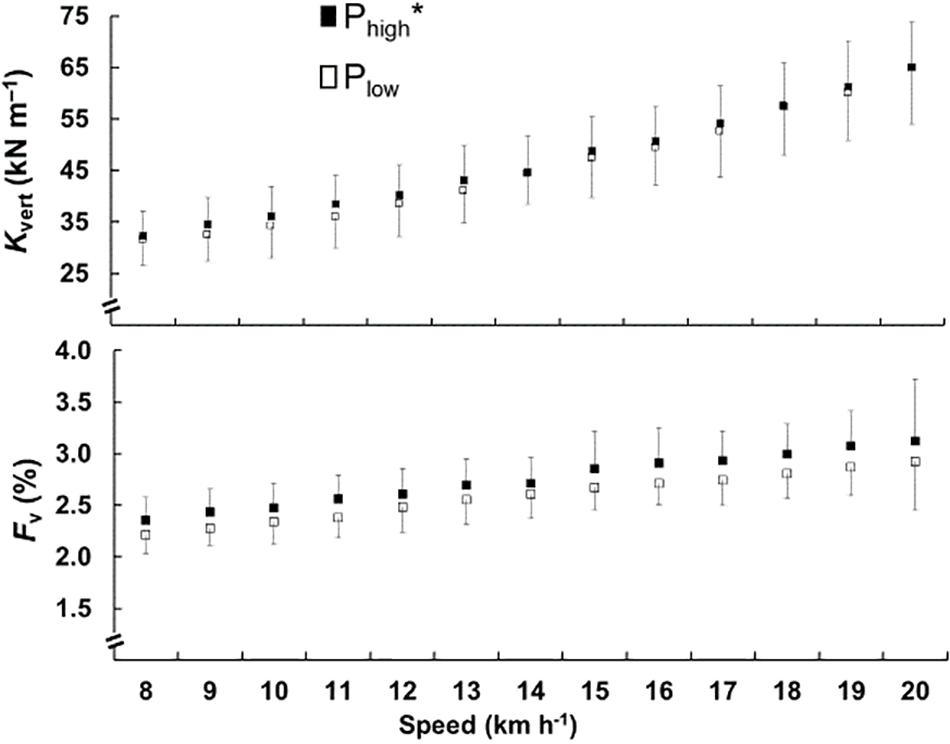
Figure 3. Mean and standard deviation of the vertical stiffness (kvert) in the top chart and relative vertical force (Fv) in the lower chart, for vertical distance traveled, is plotted as a function of the speed. The black square represents the Phigh and the open square represents the Plow. The ∗ represents significant difference between the groups.
The fsist and fstep are shown in Figure 4. The fsist was higher in Phigh, (F = 4.199, p < 0.05) and fstep was higher in Plow (F = 4.173, p < 0.01). With increasing speed, the fsist (F = 96.416, p < 0.001) and fstep (F = 46.664, p < 0.001) increased in both groups, the difference between the two frequencies fsist and fstep was lower in the Phigh group.
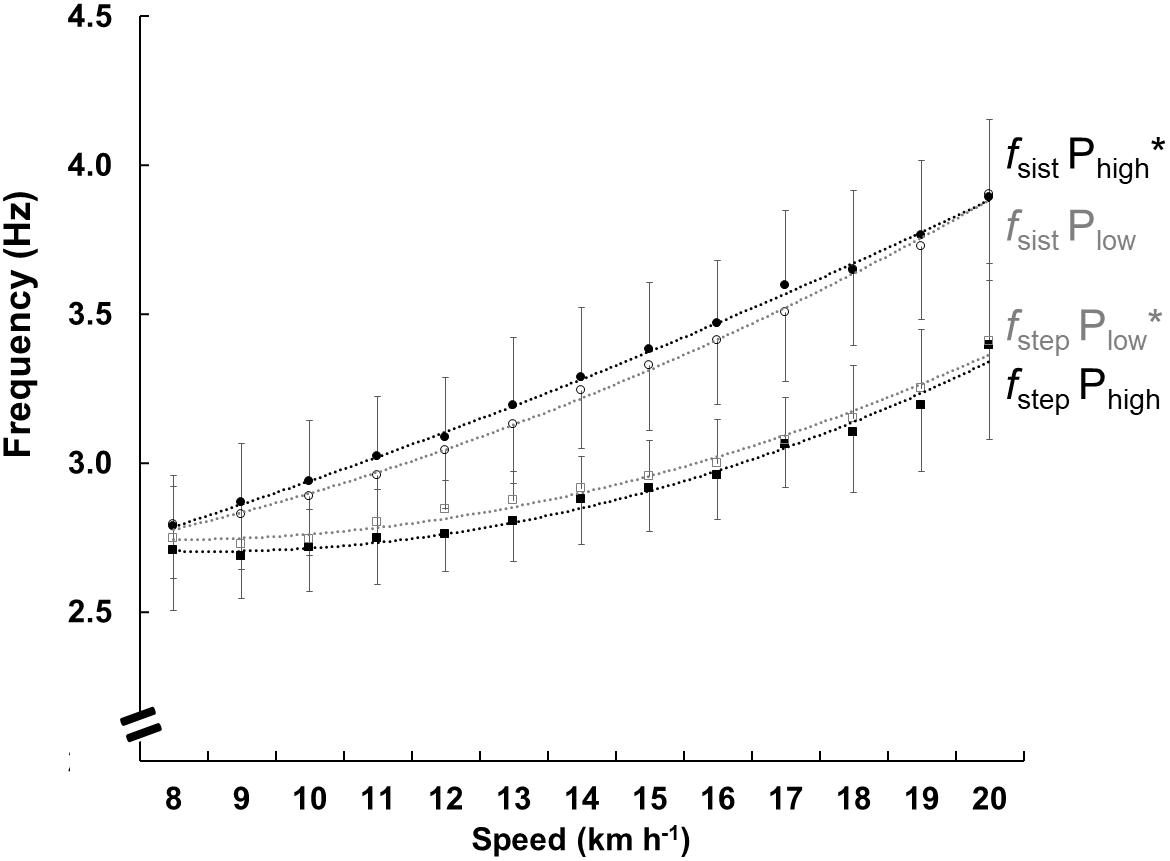
Figure 4. Mean and standard deviation of the frequency parameters at each speed for both groups. The black circles show the natural frequency of the system (fsist) in Phigh and the open circles show Plow. The black squares show the step frequency (fstep) in Phigh and the open squares show Plow. The lines represent the polynomials of the second order function, the black color represents Phigh, and the gray represents the Plow. Its only purpose is to facilitate the viewing of results. The ∗ represents differences between the groups.
Figure 5 shows the Sv components divided into Sa, Sc, Sae, and Sce. The Sa (F = 29.475, p < 0.01), Sae (F = 83.044, p < 0.001), Sc (F = 25.835, p < 0.01), Sce (F = 52.494, p < 0.001), Sv (F = 25.835, p < 0.001) and L (F = 4.548, p = 0.034) were higher in Phigh than Plow. With increasing speed, Sv was reduced (F = 23.268, p < 0.001) and L (F = 667.259, p > 0.001) progressively increased in both groups.
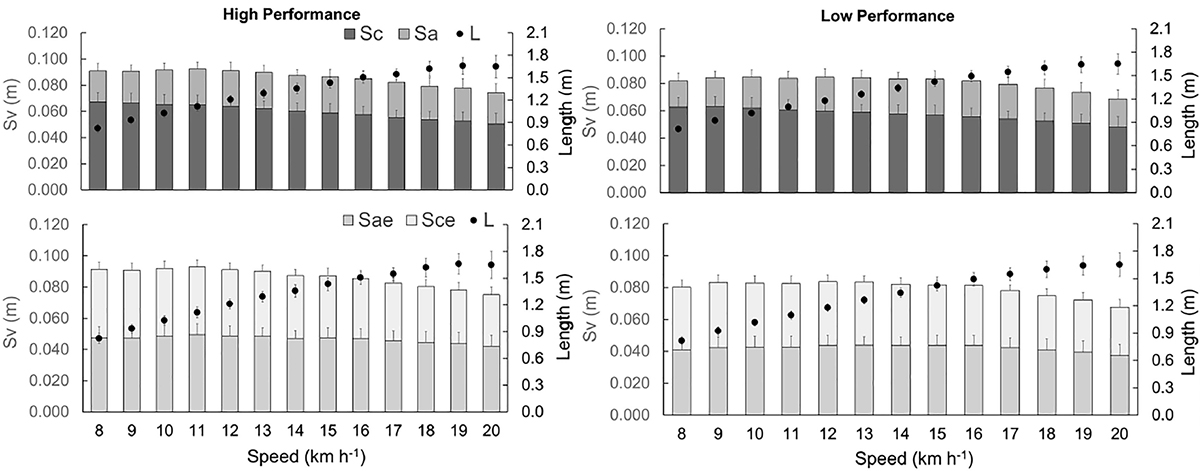
Figure 5. Vertical displacements of BCoM (Sv) during contact time (Sc), aerial time (Sa), effective aerial time (Sae), effective contact time (Sae), and step length (L). The gray bars are related to the left axis and the black circles to the right axis.
Discussion
We compared the elastic bouncing parameters in athletes with different running performances and investigated the possible mechanical adaptations for better runners. Our hypothesis was confirmed since crucial variables of the spring-mass model were significantly better for the Phigh group, demonstrating that the tce/tae parameters are sensitive to detecting differences in the performance of athletes.
The results showed that asymmetry tce/tae is more sensitive to represent the elastic mechanism than the traditional tc/ta asymmetry, and allows one more application of the parameters of the mass-spring system in performance athletes. When analyzing only the tc, there was no difference between groups, but when analyzing tce, it was lowest for Phigh, while tae was highest, showing a more effective force application in the ground with a greater L (see Figure 4). Future studies should consider the use of tce and tae, which are more representative of the elastic system in running than values usually used in the literature (Morin et al., 2007; Pantoja et al., 2016). Furthermore, no relationship between contact time and RE were found (Santos-Concejero et al., 2017). The use of more specific parameters of the spring-mass model has an additional potential to understand the contribution and role of biomechanics in RE and performance.
Differently, tpush and tbrake did not present differences between groups, showing that the general mechanical differences are not readily enough to demonstrate integrative changes on positive and negative mechanical work duration. In Cavagna’s seminal work on landing-takeoff asymmetries, it has been shown that with increasing speed, the work contribution by the contractile machinery is gradually replaced by elastic storage and release by tendons (Cavagna, 2006). These asymmetries increase with aging (Cavagna et al., 2008b). The muscular force seems to determine the impaired elastic function in the elderly. In our study, the muscular force capabilities probably are not drastically different between the analyzed groups. On the other hand, our findings on the rebound more asymmetric (tce and tae different) in Phigh than Plow are consistent with the stiffer tendon structures in the knee extensors and more compliant ones in the plantar flexors in better long distance runners (Kubo et al., 2000).
It is possible to observe that the Sv is higher in the Phigh, this behavior is a response of greater optimized elastic bouncing because of the larger L. The Plow obtained a smaller amplitude of the vertical oscillation of the BCoM, with a lower Fv and a reduced duration of the aerial phase, implying less elastic energy stored and a higher step frequency. Similar outcomes were observed when testing effects of step frequency (Morin et al., 2007) and comparing young and old people (Cavagna et al., 2008b).
The stiffness is the ratio of Fv to Sce. The kvert is higher in the Phigh due to proportionally higher Fv than Sce in comparison to the Plow group. Considering that stiffness is a function of fsist, the increase in the kvert is related to tce lower in the Phigh (Cavagna et al., 2008a), corroborating the modelistic approach of elastic bouncing proposed by Blickhan (1989). The Fv is crucial for spring-mass parameter calculations and depends on the running technique, principally the L and fstep adapted from a more efficient speed, to select frequencies for lower oxygen consumption (Cavanagh and Williams, 1982). Interestingly, the alleged high kvert and small tc of human running have played a critical role in the understanding of the mechanical determinants of the distance running performance (Arampatzis et al., 1999; Morin et al., 2007; Santos-Concejero et al., 2017). Nevertheless, the mechanical concept of stiffness is not equal to elasticity and, therefore, these concepts should not used equivalently. In fact, it has been shown that the elastic mechanism is impaired in old men, and the kvert was remained unchanged (Cavagna et al., 2008a). Given the contradictory previous findings, we claim that the role of the elastic function on running performance be investigated not only by applying punctual and indirect aspects of spring-mass model (as kvert and tc, respectively) but also including key asymmetries of spring-mass model related to the asymmetry of rebound (tce/tae) and landing-takeoff asymmetry (tpush/tbrake).
The higher running speeds contribute to increased kvert and diminished leg stiffness (Blickhan, 1989; Arampatzis et al., 1999). During a 400-m run, kvert starts higher and decreases throughout the race, and is also related to speed decreased (Hobara et al., 2010). It is possible to observe that in addition to speed, in Phigh also has greater kvert, and besides the speed, the athletic level is a marker that alters the elastic bouncing. The greatest differences were found at speeds close to those that athletes ran in their 3000 m test, and at speeds from 18 km.h−1, kvert values were very close. We hypothesized that athletes exhibit optimized elastic bouncing at speeds for training and competition.
At Plow, the higher fstep than at Phigh is due to a lower ta, and not to a higher fsist (larger in Phigh) which means that the system was in greater vertical oscillation and greater L. The amplitude of the vertical oscillation is indeed reduced in old subjects, resulting in an approximately 20% smaller elastic recovery and a greater fstep (Cavagna et al., 2008a). It is worth considering that we also found dissimilarities between the groups, nevertheless, at a lower magnitude, which is an indicator that the effects of performance are less responsible than aging for these mechanical alterations on running. In other study, subjects consumed less energy when they could maintain stiffness, so that the fsist of the model was close to the real fstep (Dalleau et al., 1998). This finding coincides with the view that Phigh has been more elastic since fsist = 1/2tce. Integratively, these findings suggest that the more “elastic” may induce to a higher mechanical efficiency and economy (Peyré-Tartaruga and Coertjens, 2018). Nevertheless, that assumption remains to be tested via controlled experiment.
In conclusion, elastic bouncing is dependent on the level of performance. More trained runners presented a spring-mass system oscillating at a higher frequency and larger vertical amplitude. These responses, in turn, result in a greater stride length.
Limitations
The main limitations of the study are related to biomechanical differences between run on treadmill versus overground, limb dominancy symmetry and size effects. There are systematic differences found in studies using force platforms on the ground versus force sensors instrumented in treadmills. For example, the tae is consistently lower in treadmill (170 ms at 20 km h−1) than in overground (approximately 210 ms at 20 km h−1, Cavagna, 2006). Possibly, a higher complacence in the treadmill should be affecting these results, particularly at high horizontal speeds where the heart rate and perceptual measures seem to be most affected (Miller et al., 2019). Thus, even not invalidating the main messages, our absolute values are restricted to treadmill running. The dominancy limb symmetry was not evaluated here, and future studies may examining whether the lateral asymmetry (dominant vs. non-dominant) of elastic mechanism influences the performance level, therefore, extending previous findings (Carpes et al., 2010; Pappas et al., 2015). And, further analysis should be performed analyzing the size effects on the elastic mechanism due to inherent role of body dimension on running mechanics and energetics, even including the allometric approach (Tartaruga et al., 2009, 2010).
Ethics Statement
This study was carried out in accordance with the recommendations of UFRGS Committee with written informed consent from all subjects. All subjects gave written informed consent in accordance with the Declaration of Helsinki. The protocol was approved by the UFRGS Committee.
Author Contributions
LP-T and RdR conceived of the study and designed the experiments. LP-T obtained the funding. RdR, HO, NG, MM, EdS, AZ, AdC, PS, and LP-T carried out the analysis, interpreted the statistical results, and drafted the manuscript. RdR, HO, NG, MM, EdS, AZ, AdC, and PS collected the data. All authors contributed to the manuscript writing, read, and approved the final manuscript.
Funding
RdR was supported by the CAPES/Brazil LP-T. was recipient of a PostDoc CNPq/Brazil fellowship (233293/2014-0). The study was supported by the CNPq/Brazil (422193/2016-0).
Conflict of Interest Statement
The authors declare that the research was conducted in the absence of any commercial or financial relationships that could be construed as a potential conflict of interest.
Acknowledgments
We are grateful to the Locomotion Group of the Universidade Federal do Rio Grande do Sul for discussions and comments. We extend our acknowledgments to all Brazilian citizens who, through the payment of their taxes, allow so many researchers to improve their scientific knowledge in public graduate programs.
Supplementary Material
The Supplementary Material for this article can be found online at: https://www.frontiersin.org/articles/10.3389/fphys.2019.00415/full#supplementary-material
TABLE S1 | The table contains sheets including individual data for all variables.
Abbreviations
av, Vertical acceleration; BCoM, Center of Mass; Ecm, Mechanical energy of the center of mass; fsist, Elastic system frequency; fstep, Step frequency; Fv, Vertical force; kvert, Vertical stiffness; L, Step length; Mb, Body mass; Sae, Vertical displacement in aerial time; Sce, Vertical displacement in contact time; Sv, Vertical displacement; ta, Aerial time; tae, Effective aerial time; tbreak, Negative work time; tc, Contact time; tce, Effective contact time; tpush, Positive work time; VO2, Oxygen consumption; Vv, Vertical velocity.
Footnotes
References
Arampatzis, A., Brüggemann, G. P., and Metzler, V. (1999). The effect of speed on leg stiffness and joint kinetics in human running. J. Biomech. 32, 1349–1353. doi: 10.1016/S0021-9290(99)00133-5
Blickhan, R. (1989). The spring-mass model for running and hopping. J. Biomech. 22, 1217–1227. doi: 10.1016/0021-9290(89)90224-8
Carpes, F. P., Mota, C. B., and Faria, I. E. (2010). On the bilateral asymmetry during running and cycling–a review considering leg preference. Phys. Ther. Sport 11, 136–142. doi: 10.1016/j.ptsp.2010.06.005
Cavagna, G. A. (2006). The landing-take-off asymmetry in human running. J. Exp. Biol. 209, 4051–4060. doi: 10.1242/jeb.02344
Cavagna, G. A., Mantovani, M., Willems, P. A., and Musch, G. (1997). The resonant step frequency in human running. Pflügers Archiv 434, 678–684. doi: 10.1007/s004240050451
Cavagna, G. A. (2009). The two asymmetries of the bouncing step. Eur. J. Appl. Physiol. 107:739. doi: 10.1007/s00421-009-1179-2
Cavagna, G. A. (2010). Symmetry and asymmetry in bouncing gaits. Symmetry 2, 1270–1321. doi: 10.3390/sym2031270
Cavagna, G. A., Franzetti, P., and Detrembleur, C. (1991). The two power limits conditioning step frequency in human running. J. Physiol. 437, 95–108. doi: 10.1113/jphysiol.1991.sp018586
Cavagna, G. A., Franzetti, P., and Willems, P. (1988). The Determinants of the step frequency in running, trotting and hopping in man and other vertebrates. J. Physiol. 399, 81–92. doi: 10.1113/jphysiol.1988.sp017069
Cavagna, G. A., Franzetti, P., and Willems, P. A. (2005). Effect of an increase in gravity on the power output and the rebound of the body in human running. J. Exp. Biol. 208(Pt 12), 2333–2346. doi: 10.1242/jeb.01661
Cavagna, G. A., and Legramandi, M. A. (2015). Running, hopping and trotting: tuning step frequency to the resonant frequency of the bouncing system favors larger animals. J. Exp. Biol. 218, 3276–3283. doi: 10.1242/jeb.127142
Cavagna, G. A., Legramandi, M. A and Peyr-Tartaruga, L. A (2008a) “Old Men Running: Mechanical Work and Elastic Bounce.” Proceedings of the Royal Society B: Biological Sciences. 275, 411418. doi: 10.1098/rspb.2007.1288
Cavagna, G. A., Legramandi, M. A., and Peyre-Tartaruga, L. A. (2008b). The landing-take-off asymmetry of human running is enhanced in old age. J. Exp. Biol. 211, 1571–1578. doi: 10.1242/jeb.013805
Cavanagh, P. R., and Williams, K. R. (1982). The effect of stride length variation on oxygen uptake during distance running. Med. Sci. Sports Exerc. 14, 30–35. doi: 10.1249/00005768-198214010-00006
Dalleau, G., Belli, A., Bourdin, M., and Lacour, J. R. (1998). The spring-mass model and the energy cost of treadmill running. Eur. J. Appl. Physiol. 77, 257–263. doi: 10.1007/s004210050330
De Pauw, K. D., Roelands, B., Cheung, S. S., De Geus, B., Rietjens, G., and Meeusen, R. (2013). Guidelines to classify subject groups in sport-science research. Int. J. Sports Physiol. Perform. 8, 111–122. doi: 10.1123/ijspp.8.2.111
Fischer, G., Storniolo, J. L., and Peyré-Tartaruga, L. A. (2015). Effects of fatigue on running mechanics: spring-mass behavior in recreational runners after 60 seconds of countermovement jumps. J. Appl. Biomech. 31, 445–451. doi: 10.1123/jab.2014-0235
Hobara, H. K. I., Gomi, K., Sakamoto, M., Muraoka, T., Iso, S., and Kanosue, K. (2010). Continuous change in spring-mass characteristics during a 400 m sprint. J. Sci. Med. Sport 13, 256–261. doi: 10.1016/j.jsams.2009.02.002
Jones, A. M., and Doust, J. H. (1996). A 1% treadmill grade most accurately reflects the energetic cost of outdoor running. J. Sports Sci. 14, 321–327. doi: 10.1080/02640419608727717
Kentta, G., and Hassmen, P. (1998). Overtraining and recovery: a conceptual model surentrainement et recuperation: un modele conceptuel. Sports Med. 26, 1–16. doi: 10.2165/00007256-199826010-00001
Kram, R., and Dawson, T. J. (1998). Energetics and biomechanics of locomotion by red kangaroos (Macropus Rufus). Comp. Biochem. Physiol. 120, 41–49. doi: 10.1016/S0305-0491(98)00022-4
Kubo, K., Kanehisa, H., Kawakami, Y., and Fukunaga, T. (2000). Elastic properties of muscle-tendon complex in long-distance runners. Eur. J. Appl. Physiol. 81, 181–187. doi: 10.1007/s00421-015-3156-2
Legramandi, M. A., Schepens, B., and Cavagna, G. A. (2013). Running humans attain optimal elastic bounce in their teens. Sci. Rep. 3:310. doi: 10.1038/srep01310
Lourenço, T. F., Martins, L. E. B., Brenzikofer, R., and Macedo, D. V. (2011). Reproducibility of an incremental treadmill vo 2max test with gas exchange analysis for runners. J. Strength Cond. Res. 25, 1994–1999. doi: 10.1519/JSC.0b013e3181e501d6
McMahon, T. A., and Cheng, G. C. (1990). The mechanics of running: how does stiffness couple with speed? J. Biomech. 23(Suppl. 1), 65–78. doi: 10.1016/0021-9290(90)90042-2
Miller, J. R., Van Hooren, B., Bishop, C., and Fuller, J. T. (2019). A systematic review and meta-analysis of crossover studies comparing physiological, perceptual and performance measures between treadmill and overground running. Sports Med. doi: 10.1007/s40279-019-01087-9 [Epub ahead of print].
Moore, I. S. (2016). Is there an economical running technique? a review of modifiable biomechanical factors affecting running economy. Sports Med. 46, 793–807. doi: 10.1007/s40279-016-0474-4
Morin, J. B., Samozino, P., Zameziati, K., and Belli, A. (2007). Effects of altered stride frequency and contact time on leg-spring behavior in human running∗. J. Biomech. 40, 3341–3348. doi: 10.1016/j.jbiomech.2007.05.001
Nakagawa, S., and Schielzeth, H. (2013). A general and simple method for obtaining R2 from generalized linear mixed-effects models. Methods Ecol. Evol. 4, 133–142. doi: 10.1111/j.2041-210x.2012.00261.x
Pantoja, P. D., Peyré-Tartaruga, L. A., and Brisswalter, J. (2016). Running energy cost and spring-mass behavior in young versus older trained athletes. Med. Sci. Sports Exerc. 48, 1779–1786. doi: 10.1249/MSS.0000000000000959
Pappas, P., Paradisis, G., and Vagenas, G. (2015). Leg and vertical stiffness (a)symmetry between dominant and non-dominant legs in young male runners. Hum. Mov. Sci. 40, 273–283. doi: 10.1016/j.humov.2015.01.005
Peyré-Tartaruga, L. A., and Coertjens, M. (2018). Locomotion as a powerful model to study integrative physiology: efficiency, economy, and power relationship. Front. Physiol.. 9:1789. doi: 10.3389/fphys.2018.01789
Rubenson, J., Lloyd, D. G., Heliams, D. B., Besier, T. F., and Fournier, P. A. (2011). “Adaptations for economical bipedal running: the effect of limb structure on three-dimensional joint mechanics”. J. R. Soc. Inter. 8, 740–755. doi: 10.1098/rsif.2010.0466
Santos-Concejero, J., Tam, N., Oliván, J., and Tucker, R. (2017). Are gait characteristics and ground reaction forces related to energy cost of running in elite kenyan runners? J. Sports Sci. 35, 531–538. doi: 10.1080/02640414.2016.1175655
Støren, Ø, Helgerud, J., and Hoff, J. (2011). Running stride peak forces inversely determine running economy in elite runners. J. Strength Cond. Res. 25, 117–123. doi: 10.1519/JSC.0b013e3181b62c8a
Tartaruga, M. P., De Medeiros, M. H., Peyré-Tartaruga, L. A., Coertjens, M., and Kruel, L. F. M. (2010). Application of the allometric scale for the submaximal oxygen uptake in runners and rowers. Biol. Sport 27, 297–300. doi: 10.5604/20831862.927496
Keywords: kinetic, forces, spring-mass system, muscle function, biomechanics, physical endurance
Citation: da Rosa RG, Oliveira HB, Gomeñuka NA, Masiero MPB, da Silva ES, Zanardi APJ, de Carvalho AR, Schons P and Peyré-Tartaruga LA (2019) Landing-Takeoff Asymmetries Applied to Running Mechanics: A New Perspective for Performance. Front. Physiol. 10:415. doi: 10.3389/fphys.2019.00415
Received: 11 November 2018; Accepted: 27 March 2019;
Published: 16 April 2019.
Edited by:
Yury Ivanenko, Fondazione Santa Lucia (IRCCS), ItalyReviewed by:
Andrew Franklyn-Miller, Sports Surgery Clinic (SSC), IrelandWanda Forczek, University of Physical Education in Krakow, Poland
Copyright © 2019 da Rosa, Oliveira, Gomeñuka, Masiero, da Silva, Zanardi, de Carvalho, Schons and Peyré-Tartaruga. This is an open-access article distributed under the terms of the Creative Commons Attribution License (CC BY). The use, distribution or reproduction in other forums is permitted, provided the original author(s) and the copyright owner(s) are credited and that the original publication in this journal is cited, in accordance with accepted academic practice. No use, distribution or reproduction is permitted which does not comply with these terms.
*Correspondence: Leonardo Alexandre Peyré-Tartaruga, bGVvbmFyZG8udGFydGFydWdhQHVmcmdzLmJy; bGVvdGFydGFydWdhQGdtYWlsLmNvbQ==