 Jean-Sébastien Rougier1*
 Maria C. Essers1
 Ludovic Gillet1,2,3
 Sabrina Guichard1Stephan Sonntag4Doron Shmerling4
 Hugues Abriel1
- 1Institute of Biochemistry and Molecular Medicine, University of Bern, Bern, Switzerland
- 2Pain Center, Department of Anesthesiology, Lausanne University Hospital, Lausanne, Switzerland
- 3Department of Fundamental Neurosciences, University of Lausanne, Lausanne, Switzerland
- 4PolyGene AG, Rümlang, Switzerland
Background: In cardiac ventricular muscle cells, the presence of voltage-gated sodium channels Nav1.5 at the lateral membrane depends in part on the interaction between the dystrophin–syntrophin complex and the Nav1.5 C-terminal PDZ-domain-binding sequence Ser-Ile-Val (SIV motif). α1-Syntrophin, a PDZ-domain adaptor protein, mediates the interaction between Nav1.5 and dystrophin at the lateral membrane of cardiac cells. Using the cell-attached patch-clamp approach on cardiomyocytes expressing Nav1.5 in which the SIV motif is deleted (ΔSIV), sodium current (INa) recordings from the lateral membrane revealed a SIV-motif-independent INa. Since immunostaining has suggested that Nav1.5 is expressed in transverse (T-) tubules, this remaining INa might be carried by channels in the T-tubules. Of note, a recent study using heterologous expression systems showed that α1-syntrophin also interacts with the Nav1.5 N-terminus, which may explain the SIV-motif independent INa at the lateral membrane of cardiomyocytes.
Aim: To address the role of α1-syntrophin in regulating the INa at the lateral membrane of cardiac cells.
Methods and Results: Patch-clamp experiments in cell-attached configuration were performed on the lateral membranes of wild-type, α1-syntrophin knockdown, and ΔSIV ventricular mouse cardiomyocytes. Compared to wild-type, a reduction of the lateral INa was observed in myocytes from α1-syntrophin knockdown hearts. Similar to ΔSIV myocytes, a remaining INa was still recorded. In addition, cell-attached INa recordings from lateral membrane did not differ significantly between non-detubulated and detubulated ΔSIV cardiomyocytes. Lastly, we obtained evidence suggesting that cell-attached patch-clamp experiments on the lateral membrane cannot record currents carried by channels in T-tubules such as calcium channels.
Conclusion: Altogether, these results suggest the presence of a sub-pool of sodium channels at the lateral membrane of cardiomyocytes that is independent of α1-syntrophin and the PDZ-binding motif of Nav1.5, located in membrane domains outside of T-tubules. The question of a T-tubular pool of Nav1.5 channels, however, remains open.
Introduction
The sarcolemma of rod-shaped adult ventricular cardiomyocytes can be divided into two principal regions. Firstly, the intercalated disc (ID) allows the electrical and physical coupling between adjacent cardiac cells via ID-ID connections. Secondly, the lateral membrane, including transverse (T-) tubules, contains focal adhesions crucial for the interaction between cardiomyocytes and the extracellular matrix (Kaprielian and Severs, 2000; Noorman et al., 2009; Vermij et al., 2017). The voltage-gated sodium channel Nav1.5 is expressed in these membrane domains. Nav1.5 is the major isoform of the Nav1.x family in cardiomyocytes (Chevalier et al., 2018). These channels are involved in the generation and propagation of the cardiac action potential (AP) (Gavillet et al., 2006; Petitprez et al., 2011). A few years ago, we and other groups investigating Nav1.5 started to unveil the complex localization of this channel in cardiac cells. We showed that at least two pools of Nav1.5 channels are present in murine ventricular cardiomyocytes based on their expression pattern and interaction with cytoplasmic proteins (Abriel et al., 2015). The first pool is located at the ID and plays a crucial role in the propagation of the electrical impulse. Based on results from heterologous expression systems and transfected cardiac cells, the regulation of this pool has been proposed to depend on SAP97 (synapse-associated protein 97), although in vivo experiments using cardiac-specific SAP97 knockdown mice did not support such observations (Petitprez et al., 2011; Milstein et al., 2012; Gillet et al., 2015). Recently, Makara et al. (2014) have convincingly shown the crucial role of ankyrin-G in the regulation and targeting of Nav1.5 channel at the ID in vivo. The second pool of Nav1.5 channels has been described outside the ID domain comprising the lateral membrane and the T-tubular system (Gavillet et al., 2006; Albesa et al., 2011; Shy et al., 2014). Contrary to what was thought commonly, the presence of Nav1.5 channels at the lateral membrane seems to be important for cardiac conduction (Baba et al., 2005; Shy et al., 2014). At the lateral membrane, the presence of Nav1.5 channels mainly depends on the protein dystrophin and the PDZ-binding motif of Nav1.5 comprising its last three C-terminal amino acids Ser, Ile, and Val (SIV). The stability of Nav1.5 at the lateral membrane has been shown to depend on the interaction between the dystrophin–syntrophin complex and the SIV motif (Gavillet et al., 2006; Shy et al., 2014). In this interaction, syntrophin, containing a PDZ domain, act as an adaptor protein between the SIV motif of Nav1.5 and dystrophin. Depending on the species, dystrophin can interact with different isoforms of syntrophin (Iwata et al., 2005). The syntrophin family comprises five isoforms of ∼60 kD each: α1, ß1, ß2, γ1, and γ2. α1-Syntrophin is abundantly expressed in mouse heart (Yang et al., 1995). The γ-isoforms are mainly expressed in the brain and skeletal muscle. α- and ß- isoforms are expressed in many tissues including the heart. In hamster, rat, and canine ventricular cardiomyocytes, dystrophin has been shown to interact preferentially with the α1-, β1-, and β2-isoforms of syntrophin (Iwata et al., 2005). In human and rabbit ventricles, mainly the α1-isoform interacts with dystrophin (Iwata et al., 2005). Using the cell-attached patch-clamp recording method on ventricular cardiomyocytes from genetically modified mice expressing Nav1.5 lacking the SIV motif (ΔSIV mouse model), a ∼60% reduction, but not an abolition, of INa has been observed at the lateral membrane (Shy et al., 2014). In addition, the biophysical properties of the remaining INa at the lateral membrane of ΔSIV myocytes were similar to the wild-type cells from littermate mice (Shy et al., 2014). Shy et al. (2014) proposed that this remaining current originates from Nav1.5 channels at the T-tubules. However, the presence of Nav1.5 in T-tubular system is still under debate. Although immunofluorescence staining for Nav1.5 has shown a T-tubular-like pattern in ventricular cardiomyocytes, other experiments suggest that other Nav1.x isoforms might be the main isoforms in this structure (Brette and Orchard, 2006; Westenbroek et al., 2013; Shy et al., 2014). Interestingly, Matamoros and colleagues, have shown in heterologous expression systems that α1-syntrophin cannot only interact with the C-terminal SIV motif but also with the sequence comprising three N-terminal amino acids Ser, Leu, Ala (SLA) of Nav1.5 channels (Matamoros et al., 2016). Based on this observation, the remaining INa observed on the lateral membrane of ΔSIV mice could also depend on α1-syntrophin interacting with Nav1.5 through the N-terminal SLA motif.
Taken together, one might explain the remaining INa outside the ID in ΔSIV ventricular cardiomyocytes as follows: (1) Nav1.5 channels also interact with the dystrophin–syntrophin complex via another mechanism; and/or (2) a subset of Nav1.5 channels at the lateral membrane are independent of the dystrophin–syntrophin complex; and/or (3) Nav1.5 channels are present inside the T-tubular system. In this work, we aimed to test these hypotheses.
Materials and Methods
All experiments involving animals were performed according to the Swiss Federal Animal Protection Law and had been approved by the Cantonal Veterinary Administration, Bern. This investigation conforms to the Guide for the Care and Use of Laboratory Animals, published by the US National Institutes of Health (NIH publication no. 85–23, revised 1996).
Generation of Constitutive ΔSIV (Scn5a-p.S2017Stop) Knockin Mice
Generation of mice containing the ΔSIV knockin deletion was accomplished through the Cre/lox technique and homologous recombination. Briefly, the serine 2017 residue was mutated to a stop codon and a silent EcoRV site was introduced within the 3′ UTR to allow genotyping. Heterozygous Scn5a-p.S2017STOP mice were crossbred to obtain homozygous Scn5a-p.S2017STOP mice. Wild-type littermates served as control mice (Shy et al., 2014).
Generation of Constitutive Cardiac-Specific α1-Syntrophin Knockdown Mice
To study the function of α1-syntrophin (Sntα1), a conditional mouse model was generated that allows tissue or time-point specific inactivation of the Snta1 gene by the use of the Cre-/loxP-system. The design of the mouse model is based on a modified Snta1 locus with two loxP sites flanking part of Snta1 exon1. One loxP site is inserted in the 5′ UTR in exon1, whereas the second loxP site is located in intron 1. Upon breeding with a heart-specific Cre-transgenic mouse line (i.e., MHC-Cre), the coding region on exon 1 of Snta1 is deleted, restricted to the cardiac muscle that is studied. For the introduction of loxP sites into the Snta1 locus, a targeting vector (pSnta1 TV) was generated that contained homology regions of 2.2 kb (short homology region) and 5.6 kb (long homology region). The 3′ loxP site was inserted together with an FRT-flanked neomycin cassette into a KpnI restriction site 269 bp downstream of Snta1 exon 1. The 5′ loxP site was inserted 50 bp downstream of the start of exon 1 and 78 bp upstream of the ATG start codon in the 5′ untranslated region (5′ UTR). In total a region of 639 bp was flanked by loxP sites, containing the coding part of Snta1 exon 1. After transfection of 20 mg of the targeting vector into 107 129Ola derived embryonic stem cells and selection with 200 mg/ml G418 for 10 days, 100 clones were isolated and screened for insertion into the Snta1 locus via Southern blot analysis using PstI digested genomic DNA and a 5′ external probe (Supplementary Figure S1A). Eight positive clones were identified and further analyzed by Southern blot using PstI digested genomic DNA and a 3′ external probe (Supplementary Figure S1B). Two clones with a correct karyotype were injected into C57BL/6 derived blastocysts. Male mice with a high degree of coat color chimerism were mated to Flp-deleter mice (C57Bl/6 background) to generate heterozygous Snta1-flox mice. For genotyping, two primers flanking the 5′ loxP site were used (Supplementary Figure S1A). Primers E072.32 (5′-ACGAGCTACGGTCCAATC-3′) and E072.33 (5′-ATCTTCGCCTCGAAGTCC-3′) detect a 391 bp fragment in the wild-type allele, whereas the insertion of the loxP site in the Snta1-flox allele results in a slightly larger fragment of 437 bp.
Cell Line Preparations
Human embryonic kidney (HEK-293) cells were cultured in DMEM (Gibco, Basel, Switzerland) supplemented with 10% FBS, 0.5% penicillin, and streptomycin (10,000 U/mL) at 37°C in a 5% CO2 incubator.
Transfections
For electrophysiological studies, T25 cm2 flasks of HEK-293 cells were transiently co-transfected using Jet-Pei® reagent (Polyplus-transfection SA, Illkirch, France) with 10 μg of human Nav1.4 cDNA. All transfections included 0.3 μg of cDNA encoding CD8. For patch clamp experiments, anti-CD8 beads (Dynal®, Oslo, Norway) were used. Only cells decorated with anti-CD8 beads were analyzed.
Isolation of Mouse Ventricular Myocytes
Single cardiomyocytes were isolated according to a modified procedure of established enzymatic methods (Gavillet et al., 2006). Briefly, mice were euthanized by cervical dislocation. Hearts were rapidly excised, cannulated and mounted on a Langendorff column for retrograde perfusion at 37°C. Hearts were rinsed free of blood with a nominally Ca2+-free solution containing (in mM): 135 NaCl, 4 KCl, 1.2 MgCl2, 1.2 NaH2PO4, 10 HEPES, 11 glucose, pH 7.4 (NaOH adjusted), and subsequently digested by a solution supplemented with 50 μM Ca2+ and collagenase type II (1 mg/mL, Worthington, Allschwil, Switzerland) for 15 min. Following digestion, the atria were removed and the ventricles transferred to nominally Ca2+-free solution, where they were minced into small pieces. Single cardiac myocytes were liberated by gentle trituration of the digested ventricular tissue and filtered through a 100 μm nylon mesh. Ventricular mouse cardiomyocytes were used after an extracellular calcium increase procedure to avoid calcium overload when applying extracellular solutions in electrophysiology assays.
Detubulation
Isolated cardiomyocytes were detubulated via osmotic shock using formamide solution (Brette et al., 2002). Briefly, cardiac cells were suspended in 2 mL of 1.5 M formamide solution for 15 min at room temperature (RT) then washed twice with an extracellular solution before use. For morphological experiments, 1 μM di-8 ANEPPS, diluted in dimethyl sulfoxide containing pluronic F-127, was applied to living cardiomyocytes for 15 min, and imaged on a confocal microscope (LSM710, Zeiss, Germany).
Whole-Cell Electrophysiology
Cardiac APs and ionic currents [INa, calcium current (ICa), transient outward potassium current (Ito), and the inward rectifier potassium current (IK1)] were recorded in the whole-cell configuration at RT (22–23°C) using a VE-2 amplifier (Alembic Instruments, United States). Borosilicate glass pipettes were pulled to a series resistance of ∼2 MΩ. pClamp software, version 8 (Axon Instruments, Union City, CA, United States) was used for recordings. Data were analyzed using pClamp software, version 8 (Axon Instruments) and OriginPro, version 7.5 (OriginLab Corporation, Northampton, MA, United States). Current densities (pA/pF) were calculated by dividing the peak current by the cell capacitance. For sodium currents, current–voltage relationship curves (I–V) were fitted with the equation, y = g∗(Vm-Vrev)/((1+exp[(Vm-V1/2)/K])). To determine the voltage dependence of steady-state activation and inactivation curves, the data from individual cells were fitted with the Boltzmann equation, y = 1/(1+exp[(Vm-V1/2)/K]). Y is the normalized current or conductance, Vm is the membrane potential, V1/2 is the voltage at which half of the channels are activated or inactivated, K is the slope factor, and Vrev the reversal potential.
For cardiac AP recordings, cardiomyocytes were bathed in a solution containing (in mM) NaCl 140, KCl 5.4, CaCl2 1.8, MgCl2 1.2, HEPES 10, and glucose 5 (pH was adjusted to 7.4 with NaOH). Cardiomyocytes were initially voltage-clamped (holding potential -80 mV) and dialyzed with an internal solution containing (in mM) KCl 120, CaCl2 1.5, MgCl2 5.5, Na2ATP 5, K2-EGTA 5, and HEPES 10 (pH was adjusted to 7.2 with KOH). APs were elicited at 0.5 Hz with rectangular pulses (5 ms at 125% threshold) in current-clamp mode. Elicited APs were allowed to stabilize before one or more sequences of ∼1 min each were acquired from each cell. AP recordings were digitized at a sampling frequency of 20 kHz. Electrophysiological data were analyzed off-line, where the resting membrane potential, amplitude, maximal upstroke velocity (dV/dt)max and durations at 30, 50, and 90% repolarization were averaged from each sequence of APs.
INa in α1-syntrophin knockdown (Snta1 fl/fl+) or α1-syntrophin wild-type littermate (Snta1 fl/fl-) cardiomyocytes were carried out using an internal solution containing (in mM) CsCl 60, Cs-aspartate 70, CaCl2 1, MgCl2 1, HEPES 10, EGTA 11, and Na2ATP 5 (pH was adjusted to 7.2 with CsOH). Cardiomyocytes were bathed in a solution containing (in mM) NaCl 5, NMDG-Cl 125, CaCl2 2, MgCl2 1.2, CsCl 5, HEPES 10, and glucose 5 (pH was adjusted to 7.4 with CsOH). Nifedipine (10 μM) and cobalt chloride (CoCl2) (10 μM) were added to the extracellular solution in order to inhibit calcium currents.
To assess the functional consequences of detubulation, currents carried by the calcium channel Cav1.2 (IBa) were recorded using the internal pipette solution composed of (in mM) 60 CsCl, 70 Cs-aspartate, 1 MgCl2, 10 HEPES, 11 EGTA and 5 Mg-ATP (pH was adjusted to 7.2 with CsOH). The external solution contained (in mM) 5 NaCl, 125 NMDG-Cl, 5.6 CsCl, 5 BaCl2, 1 MgCl2, 10 HEPES and 5 D-glucose (pH was adjusted to 7.4 with CsOH).
Ito and IK1 recordings were performed using an internal solution containing (in mM): KCl 130, Mg-ATP 4, NaCl 12, MgCl2 1, CaCl2 1, EGTA 10, and HEPES 10 (pH was adjusted to 7.2 with KOH). Myocytes were bathed with a solution containing (in mM): NaCl 140, KCl 5.4, CaCl2 1.8, MgCl2 1, HEPES 10, and Glucose 5 (pH was adjusted to 7.4 with NaOH). Voltage-gated sodium channels were blocked with 50 μM of Tetrodotoxin (TTX). L-type voltage-gated calcium channels were blocked with 3 mM CoCl2. IK1 barium-sensitive current was calculated by subtracting potassium current recorded after perfusion of an extracellular solution containing 100 μM barium chloride (BaCl2) from potassium current recorded before application of BaCl2.To record Ito, 100 μM BaCl2 was added to the extracellular solution to block IK1 current. I–V curves were not fitted.
Terminology: MaxI corresponds to the maximum current (in absolute value) recorded during the protocol used to determine the relationship between currents and membrane voltages (IV curve). For INa, this is the maximum inward current recorded. For Ito, the maximum current is the outward current measured for a membrane voltage of +50 mV. For IK1, the maximum current is the inward current measured for a membrane voltage of -130 mV.
Cell-Attached Electrophysiology
INa macro recordings were recorded in the cell-attached configuration either on the lateral membrane of cardiomyocytes or on plasma membrane of HEK-293 cells transiently expressing Nav1.4. All cell-attached recordings were performed at RT (22–23°C), using a low-noise Axopatch 200B amplifier (Molecular Devices, Sunnyvale, CA, United States). Borosilicate glass pipettes were pulled to a series resistance of ∼1.5 MΩ (diameter of opening ∼20 μm2). No statistical difference was noticed in averages pipette resistance between all conditions indicating that a similar membrane areas was patched. The internal pipette (intrapipette) solution was composed of (in mM) 148 NaCl, 1.8 CaCl2, 1 MgCl2, 5 D-glucose, and 10 HEPES (pH was adjusted to 7.4 with NaOH). The external solution, to depolarize the cell membrane ∼0 mV, contained (in mM) 125 KCl, 30 KOH, 10 EGTA, 2 CaCl2, and 5 HEPES (pH was adjusted to 7.15 with KOH). TTX-sensitive voltage-gated sodium channels (Nav1.1, Nav1.2, Nav1.3, Nav1.4, Nav1.6, and Nav1.7) were inhibited by 50 nM TTX in the intrapipette solution. A 4-pole Bessel low-pass filter at 2 kHz, was applied during the recording and a sampling rate of 20 kHz was used for the acquisition of the raw traces. P over 4 protocol was applied. pClamp software, version 8 (Axon Instruments, Union City, CA, United States) was used for recordings. Data were analyzed using pClamp software, version 8 (Axon Instruments) and OriginPro, version 7.5 (OriginLab Corporation, Northampton, MA, United States). I–V sodium currents curves were fitted with the equation, y = g∗(Vm-Vrev)/(1+exp[(Vm-V1/2)/K]). To determine the voltage dependence of steady-state activation and inactivation curves, the data from individual cells were fitted with the Boltzmann equation, y = 1/(1+exp[(Vm-V1/2)/K]). Y is the normalized current or conductance, Vm is the membrane potential, V1/2 is the voltage at which half of the channels are activated or inactivated, K is the slope factor, and Vrev the reversal potential.
Single channel barium recordings have been performed in cell-attached configuration. Average pipette size was 1.5 MΩ. Currents were measured at RT (22–23°C) using a low-noise Axopatch 200B amplifier (Molecular Devices, Sunnyvale, CA, United States). The internal pipette solution was composed of (in mM) 110 BaCl, 10 TEA-Cl, and 5 HEPES (pH was adjusted to 7.4 with NMDG-OH). To depolarize the cell membrane ∼0 mV, the external solution contained (in mM) 125 KCl, 30 KOH, 10 EGTA, 2 CaCl2, and 5 HEPES (pH was adjusted to 7.15 with KOH). A 4-pole Bessel low-pass filter at 2 kHz was applied during the recording at sampling rate of 20 kHz for the acquisition of raw traces. For each cell, a single depolarizing protocol at -10 mV from a holding potential at -120 mV was applied at least 150 times. Post-acquisition, data were filtered using a low pass Gaussian filter and analyzed using pClamp software, version 9.2 (Axon Instruments, Union City, CA, United States).
Proximity Ligation Assay
Duolink® (Olink Bioscience, Uppsala, Sweden) is a proximity ligation assay (PLA) that enables the visualization of protein-protein interactions allowing the in situ detection of epitopes that are near each other (<40 nm apart). Two primary antibodies raised in different species recognize the target antigen or antigens of interest. Species-specific secondary antibodies, called PLA probes, each with a unique short DNA strand attached to it, bind to the primary antibodies. When PLA probes are nearby, the DNA strands can interact through subsequent addition of two other circle-forming DNA oligonucleotides. After joining of the two oligonucleotides by enzymatic ligation, they are amplified via rolling circle amplification using a polymerase. After the amplification reaction, several-hundredfold replication of the DNA circle has occurred, and labeled complementary oligonucleotide probes highlight the product. The resulting high concentration of fluorescence in each single-molecule amplification product is easily visible as a distinct bright dot when viewed with a fluorescence microscope. Experiments were performed according to the manufacturer’s recommendations. Briefly, isolated mouse ventricular cardiac cells were fixed in 4% paraformaldehyde for 10 min and incubated twice for 7 min in PBS with 0.02% Triton X-100 at RT. Subsequently, cells were incubated 15 min in blocking solution containing 1% bovine serum albumin (BSA). Cardiomyocytes from α1-syntrophin knockdown or α1-syntrophin wild-type littermate were then incubated with commercially available mouse monoclonal anti-pan-syntrophin and polyclonal anti-Nav1.5 primary antibodies as specified below at a dilution of 1/100 and 1/200, respectively. Subsequent incubation steps were performed at 37°C and the appropriate washing buffers were used after each incubation, as specified in the protocol. After washing 3 times in PBS to remove the primary antibody, Duolink® secondary antibodies conjugated to PLA probes were added to the tissue for a 1 h incubation. These PLA probes consist of oligonucleotides that were subsequently joined together in a circle after the addition of a ligation solution (containing ligase enzyme) and incubation for 30 min. Next, the rolling circle amplification of this circular template was achieved by the addition of an amplification solution, containing polymerase, and fluorescently labeled oligonucleotides, which hybridized to the circular template during a 100 min incubation. Samples were then mounted with Duolink® in situ mounting medium with DAPI (1 μl/200 μl PBS) and viewed with a confocal microscope (LSM710, Zeiss, Germany).
Protein Extraction and Western Blots
Whole hearts were extracted from mice and the atria were removed before homogenization of the ventricles in 1.5 mL lysis buffer (50 mM HEPES, 150 mM NaCl, 1 mM EGTA, 10% glycerol, 1.5 mM MgCl2, and Complete® protease inhibitor cocktail from Roche, Basel, Switzerland) using a Polytron. Triton X-100 was then added to make a final concentration of 1% (final volume 3 mL) before lysis of the samples on a rotating wheel for 1 h at 4°C. Soluble fractions of the mouse heart were obtained by subsequent centrifugation for 15 min at 13,000 rpm at 4°C. To determine the correct volume of sample needed to load equivalent amounts of protein on a gel, the protein concentration of each of the lysate samples was measured in triplicate by Bradford assay and interpolated by a BSA standard curve. Samples were denatured at 95°C for 5 min before loading them on a gel. To analyze and compare protein content in whole mouse hearts, 25 or 50 μg of ventricular mouse heart lysate samples were loaded on a 1.0 mm-thick 10% Tris–acetate gel for high molecular weight proteins (Invitrogen). Gels were run at 150 V for 1 h and then subsequently transferred to nitrocellulose membranes using the Biorad Turbo Transfer System (Biorad, Hercules, CA, United States). All membranes were stained with Ponceau as a qualitative check for equivalent loading of total protein. Membranes were then rinsed twice with PBS before using the SNAP i.d. system (Millipore, Zug, Switzerland) for western blotting. 1% BSA was used as a blocking solution and incubated with membranes for 10 min before incubation with the primary antibodies for 10 min. Membranes were subsequently washed four times in PBS + 0.1% Tween before incubating with fluorescent secondary antibodies for 10 min. After four more washes with PBS + 0.1% Tween and three washes in PBS, membranes were scanned with the Odyssey® Infrared Imaging System (LI-COR Biosciences, Bad Homberg, Germany) for detection of fluorescent protein.
Immunocytochemistry
Following cardiomyocyte isolation, cells from α1-syntrophin knockdown and α1-syntrophin wild-type littermate hearts were fixed with cold methanol at -20°C for 10 min. Cells were subsequently washed twice in PBS before permeabilization with PBS containing 0.02% Triton X-100 for 14 min. Then, the cardiomyocytes were blocked for 15 min at RT with 10% goat serum in TBS containing 2.3% of fab fragment donkey anti-mouse IgG (H+L) (Jackson Immuno Research, Baltimore, United States) at 1.3 mg/mL. Cardiomyocytes were then incubated overnight with primary antibodies diluted in 3% goat serum in TBS containing 0.02% Triton X-100. Afterward, cells were washed four times with 3% goat serum in TBS for 5 min each, and then incubated with secondary antibodies for 2 h at RT. Cells were then washed four times in PBS (5 min each). Finally, DAPI solution (1 μl/200 μl PBS) was applied on cardiac cells for 20 min at RT. Before examination with the confocal microscope (LSM710, Zeiss, Germany), cardiomyocytes were embedded in FluorSaveTM Reagent (Calbiochem). Total signal intensity was calculated using Zen 2.1 software version 11 from Carl Zeiss (Germany).
Antibodies
For western blots, the antibody against pan-syntrophin (MAI-745, Affinity BioReagents, Golden, CO, United States) was used at a dilution of 1/200. A custom rabbit polyclonal antibody against α1-syntrophin (Pineda Antibody Service, Berlin) was used at a dilution of 1/1000. The antibodies against Cre (69050; Novagen, EMD Millipore-MERK, Schaffhausen, Switzerland) was used at a dilution of 1/500 and the antibody against calnexin (C4731; Sigma-Aldrich, St. Louis, MO, United States) was used at 1/1000. For Duolink® experiments, the antibody against syntrophin (pan-syntrophin, MAI-745, Affinity BioReagents, Golden, CO, United States) was used at a dilution of 1/100 and custom rabbit polyclonal antibody against Nav1.5 (Pineda Antibody Service, Berlin) was used at a dilution of 1/200. For staining, the anti-pan-syntrophin antibody (MAI-745, Affinity BioReagents, Golden, CO, United States) was used at a dilution of 1/200. The antibody against Cre (69050; Novagen, EMD Millipore-MERK, Schaffhausen, Switzerland) was used at a dilution of 1/1000.
Drugs
TTX was purchased from Alomone Labs (Jerusalem, Israel) and dissolved in intrapipette solution. The μ-conotoxin CnIIIC was purchased from Smartox (Saint Martin d’Heres, France) and dissolved in water.
Statistical Analyses
Data are represented as means ± S.E.M. Statistical analyses were performed using Prism7 GraphPadTM software. A Mann–Whitney U two-tailed test was used to compare two groups due to the small samples size. p < 0.05 was considered significant.
Results
Characterization of a Cardiac-Specific α1-Syntrophin Knockdown Mouse Tissue and Cells
The remaining INa at the lateral membrane of Nav1.5 ΔSIV mouse cardiomyocytes (Shy et al., 2014) raised the question which molecular determinants are involved in this lateral membrane pool of Nav1.5 channels. Although the Nav1.5 SIV motif mediates the interaction with α1-syntrophin of the dystrophin–syntrophin complex, Nav1.5 contains a similar motif (Ser-Leu-Ala) in its N-terminal domain, which was previously shown to interact with α1-syntrophin (Matamoros et al., 2016). Motivated by these observations, we generated a cardiac-specific α1-syntrophin knockdown mouse strain (described in Supplementary Figure S1) and investigated the consequences of α1-syntrophin knockdown on the INa of ventricular cardiomyocytes. Using either pan-syntrophin (targetting all members of the syntrophin family) or α1-syntrophin antibodies, western blots confirmed the cardiac-specific reduction of the α1-syntrophin expression in Snta1 fl/fl+ cardiac tissues compared to the control Snta1 fl/fl- (Figures 1A,B). In addition, immunostaining experiments using the pan-syntrophin antibody showed a significant decrease of syntrophin expression in isolated ventricular cardiomyocytes Snta1 fl/fl+ compared to Snta1 fl/fl- cardiac cells (Figures 2A,B). Finally, PLA experiments showed a substantial decrease of the interaction (based on the absence of red dots) between Nav1.5 and α1-syntrophin in Snta1 fl/fl+ cardiomyocytes compared to the control, suggesting that α1-syntrophin and Nav1.5 no longer interact in α1-syntrophin knockdown cells (Figure 2C). In parallel to the molecular characterization, functional investigations were performed. Whole-cell INa was recorded in freshly isolated ventricular cardiomyocytes. As shown in Figures 3A,B, comparing knockdown cardiomyocytes to the wild-type cells, a significant reduction of the INa was observed (Snta1 fl/fl- Max inward INa: 33 ± 2 pA/pF, n = 16; Snta1 fl/fl+ Max inward INa: 22 ± 2 pA/pF, n = 13, p < 0.05), without alteration of either cell membrane capacitance (Snta1 fl/fl-: 166 ± 8 pF, n = 16; Snta1 fl/fl+: 159 ± 12 pF, n = 13, p > 0.05) or INa biophysical properties (Table 2, Figures 3A,B, and Supplementary Figure S2). Cardiac AP recordings moreover did not show any alteration of neither the resting membrane potential nor AP duration (Table 1 and Figures 4A,C). Only the upstroke velocity was significantly decreased in α1-syntrophin knockdown cells compared to controls (Table 1 and Figures 4B,C). Using heterologous expression systems, (Matamoros et al., 2016) have also demonstrated that α1-syntrophin interacts with Kv4.2/4.3 and Kir2.1 potassium channels, which conduct the Ito and IK1 currents, respectively. Although the decrease of the upstroke velocity of the AP suggests that only INa is altered in α1-syntrophin knockdown conditions, we recorded the Ito and IK1 currents in the absence of α1-syntrophin. As shown in Figures 5, 6, no alteration was observed in α1-syntrophin knockdown cells compared to the control for both currents (Snta1 fl/fl- MaxIto at +50 mV: 51 ± 6 pA/pF [176 ± 11 pF], n = 12; Snta1 fl/fl+ MaxIto at +50 mV: 50 ± 6 pA/pF [151 ± 11 pF], n = 13, p > 0.05; Figures 5A,B), and (Snta1 fl/fl- MaxIK1 at -130 mV: 6.4 ± 0.6 pA/pF [183 ± 16 pF], n = 12; Snta1 fl/fl+ MaxIK1 at -130 mV: 7.0 ± 0.6 pA/pF [159 ± 10 pF], n = 15, p > 0.05; Figures 6A,B) suggesting that mainly the Nav1.5-mediated current is down-regulated in this α1-syntrophin knockdown model.
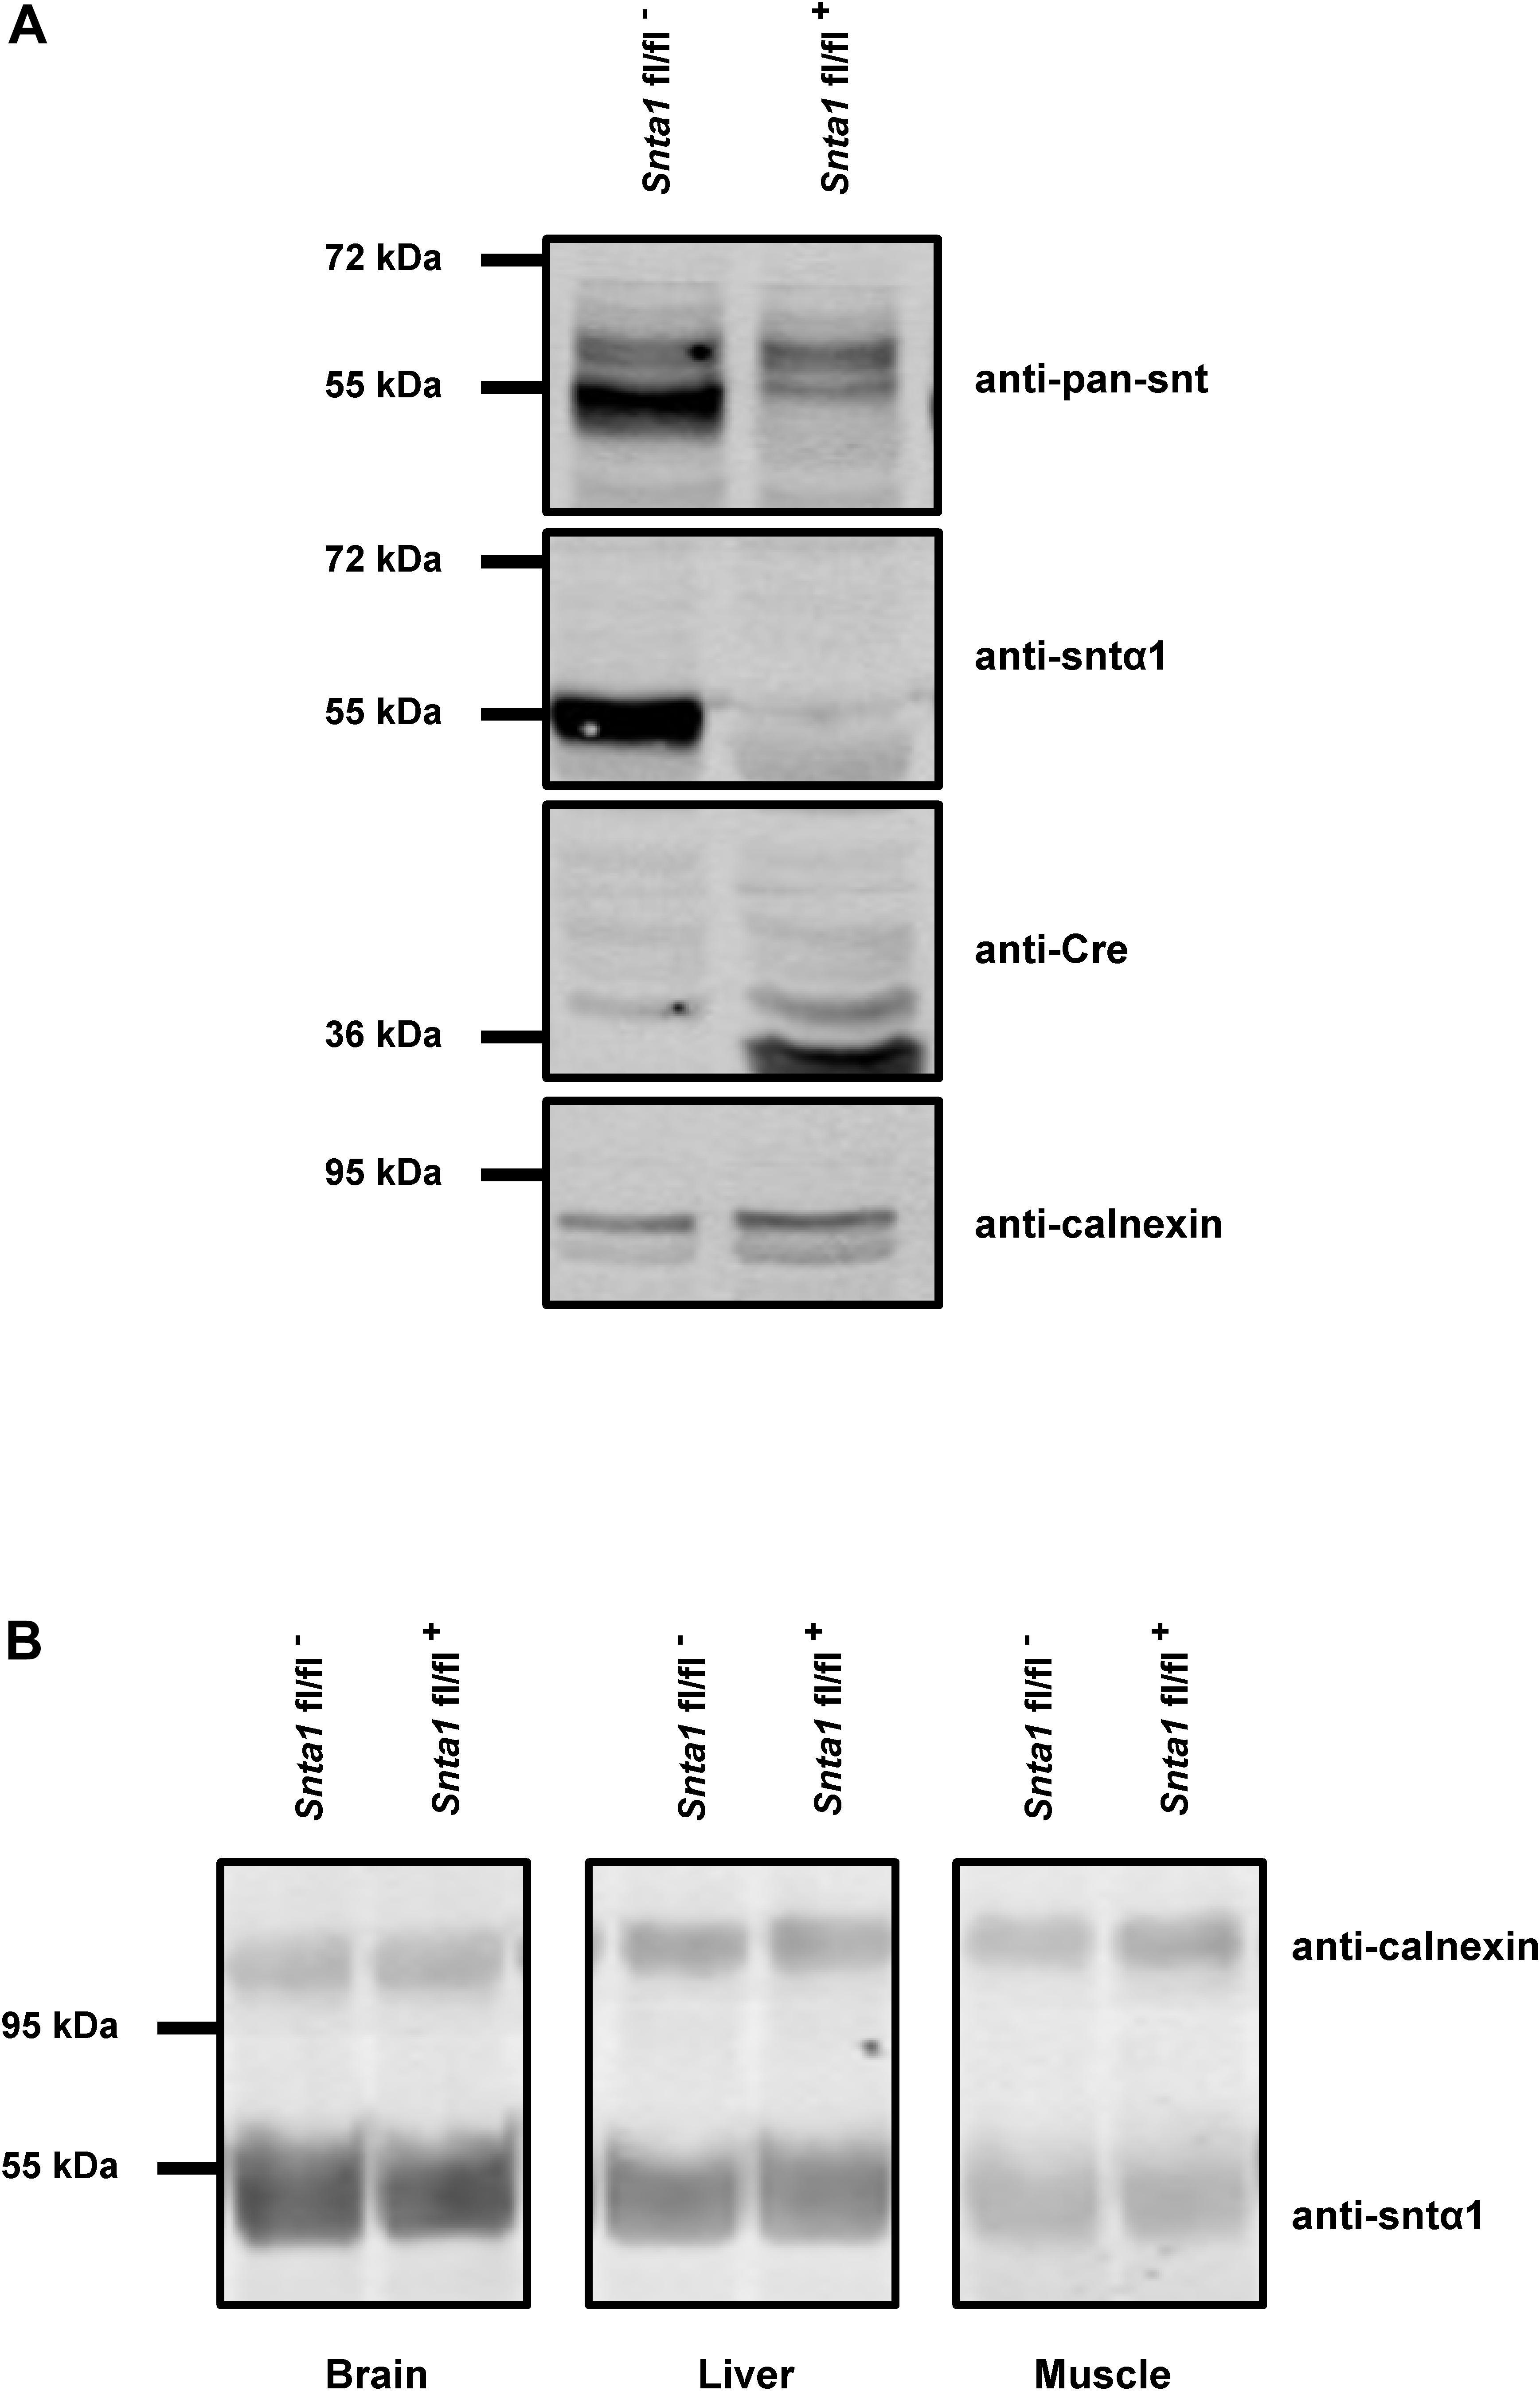
Figure 1. α1-Syntrophin expression in wild-type and knockdown α1-syntrophin knockdown tissues. (A) Western blots of whole hearts from wild-type (Snta1 fl/fl-) and α1-syntrophin cardiac specific knockdown (Snta1 fl/fl+) mice show a significant decrease of the α1-syntrophin protein (anti-Sntα1 antibody) and the absence of compensatory effects via other syntrophin isoforms (anti-pan-syntrophin (Snt) antibody). (B) Western blots from brain, liver and muscle from wild-type (Snta1 fl/fl-) and α1-syntrophin cardiac specific knockdown (Snta1 fl/fl+) mice show no effect on α1-syntrophin protein in other organs than the heart.
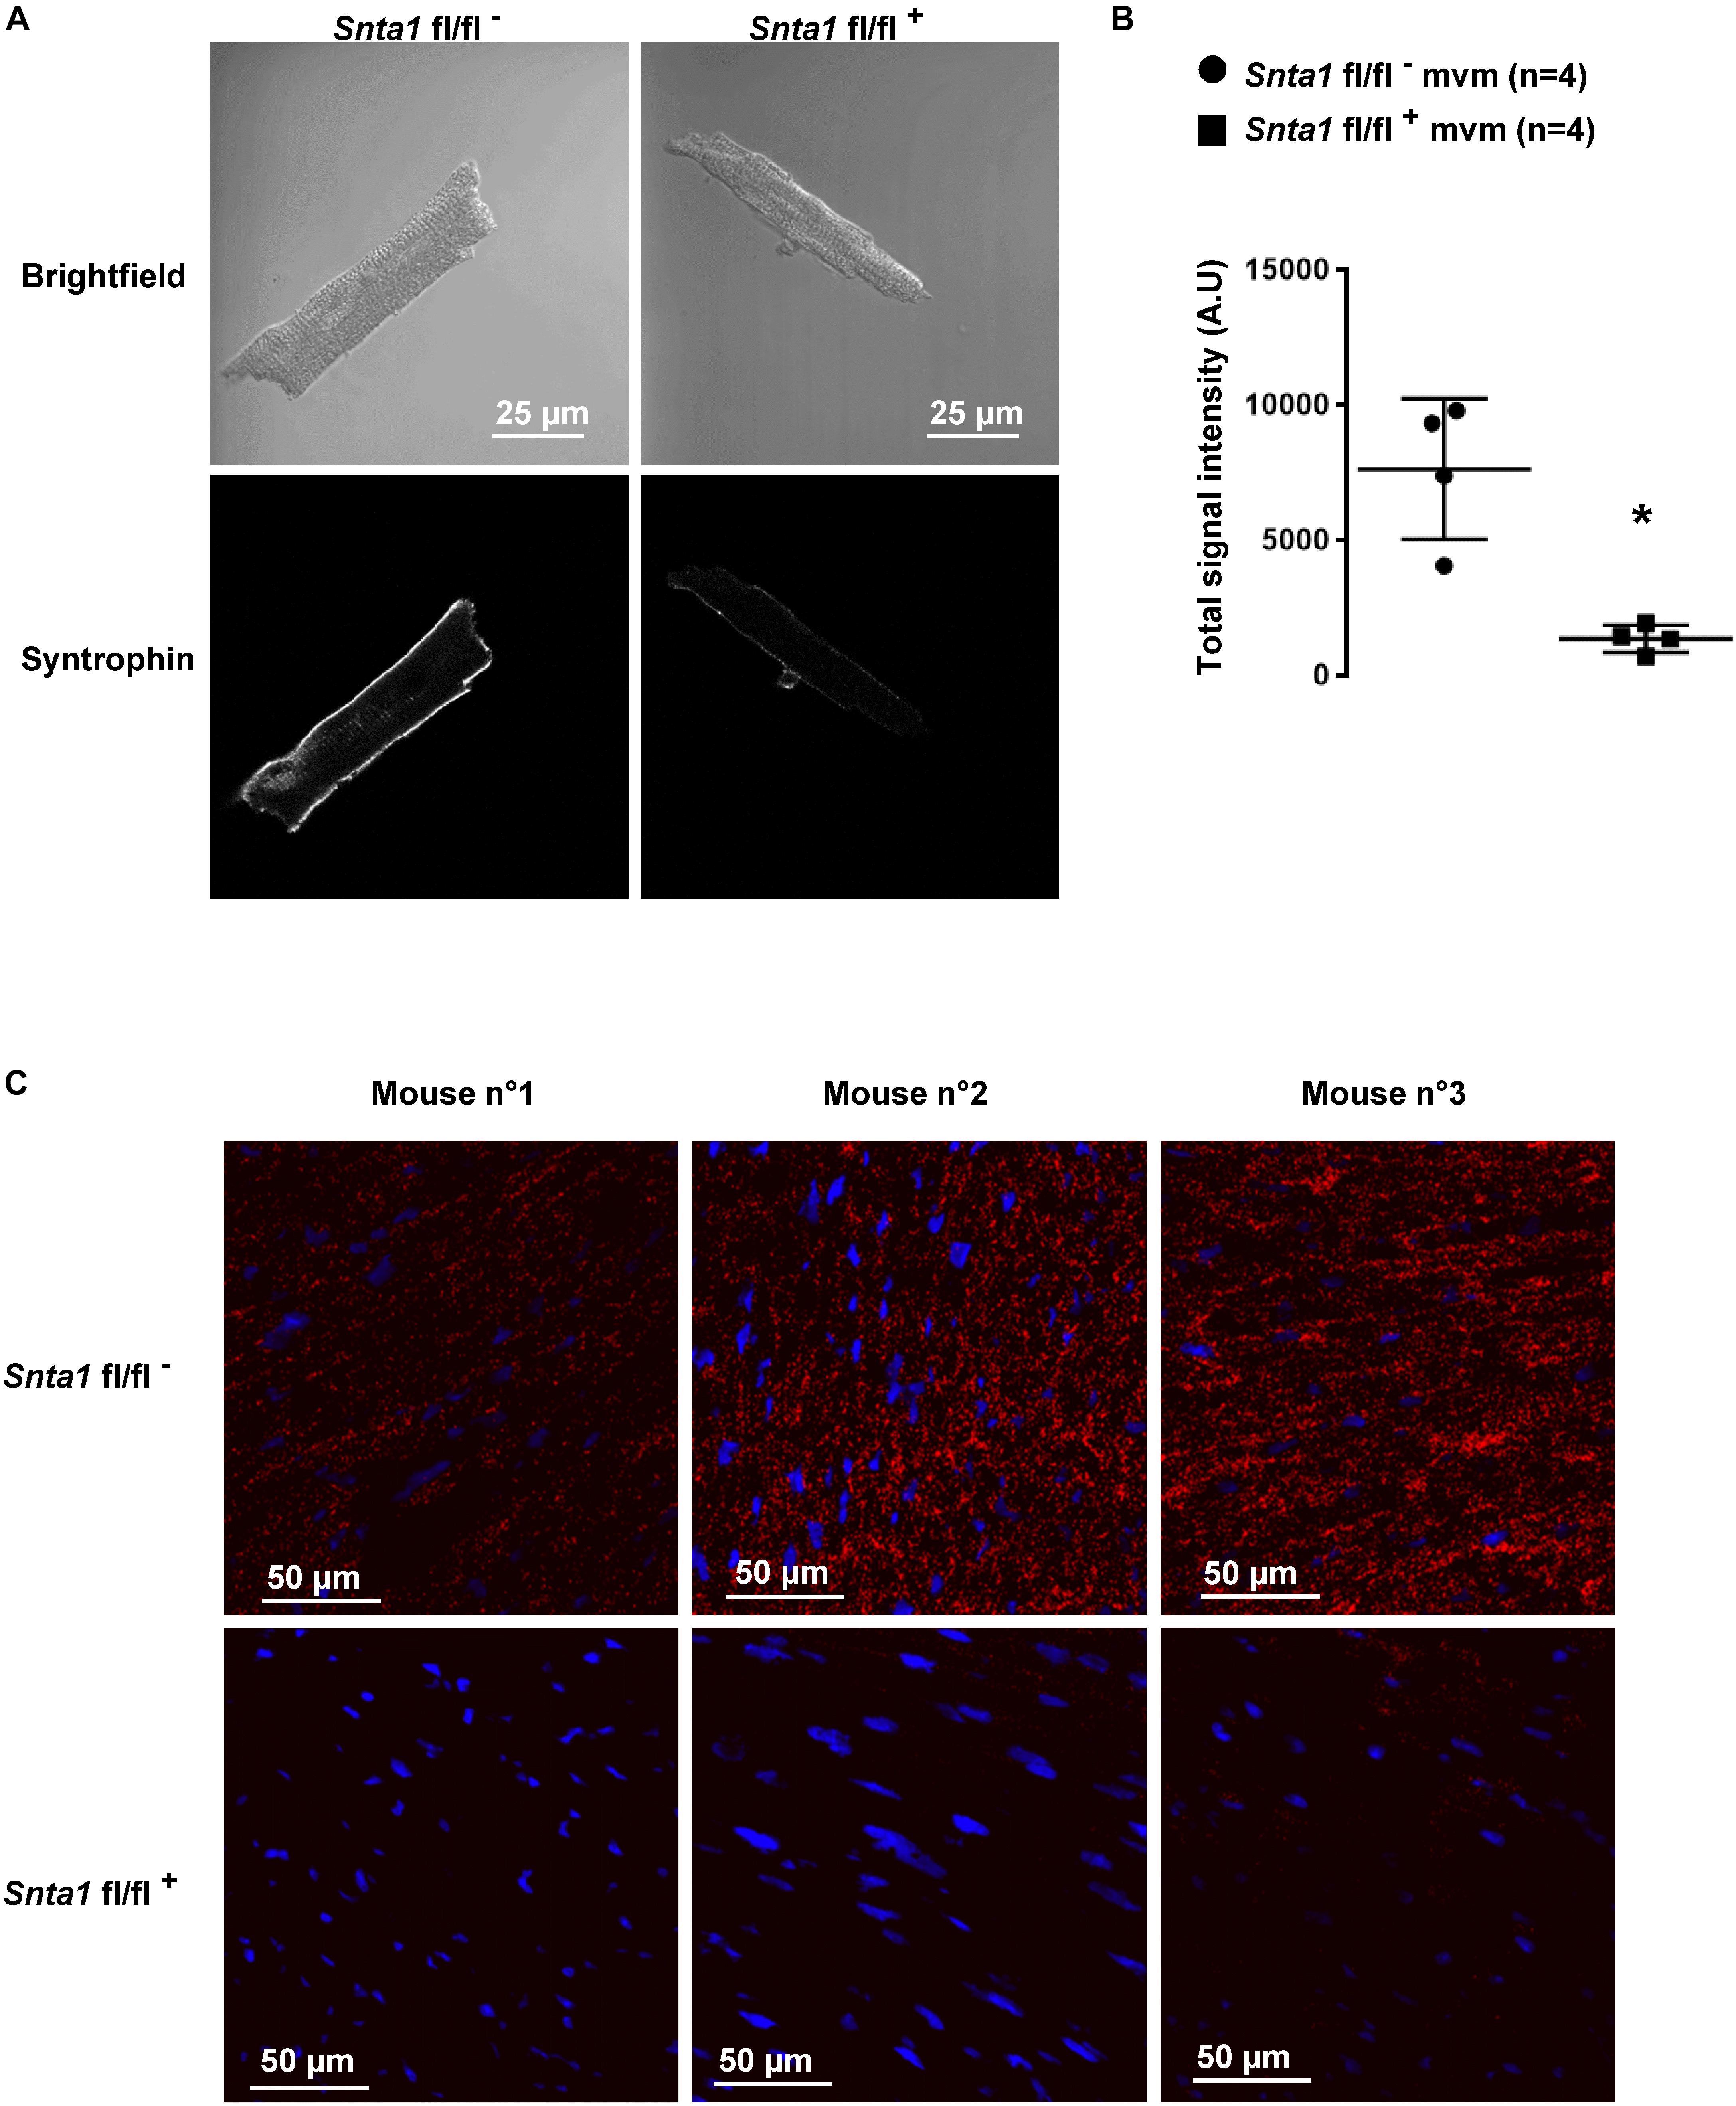
Figure 2. α1-Syntrophin staining in wild-type and knockdown α1-syntrophin knockdown cardiac sections and cardiomyocytes. (A) Immunostaining, using a pan-syntrophin antibody, of syntrophin in wild-type (Snta1 fl/fl-) and cardiac-specific α1-syntrophin knockdown murine cardiomyocytes (mvm) (Snta1 fl/fl+). (B) Intensity quantification of syntrophin signal of four cells confirming the significant decrease of syntrophin in knockdown mice. (∗p < 0.05). The number of cells is indicated in parentheses. (C) Duolink® experiments showing a significant decrease in interaction (red dots) between Nav1.5 and syntrophin in α1-syntrophin cardiac specific knockdown cardiomyocytes (Snta1 fl/fl+) compared to wild-type (Snta1 fl/fl-).
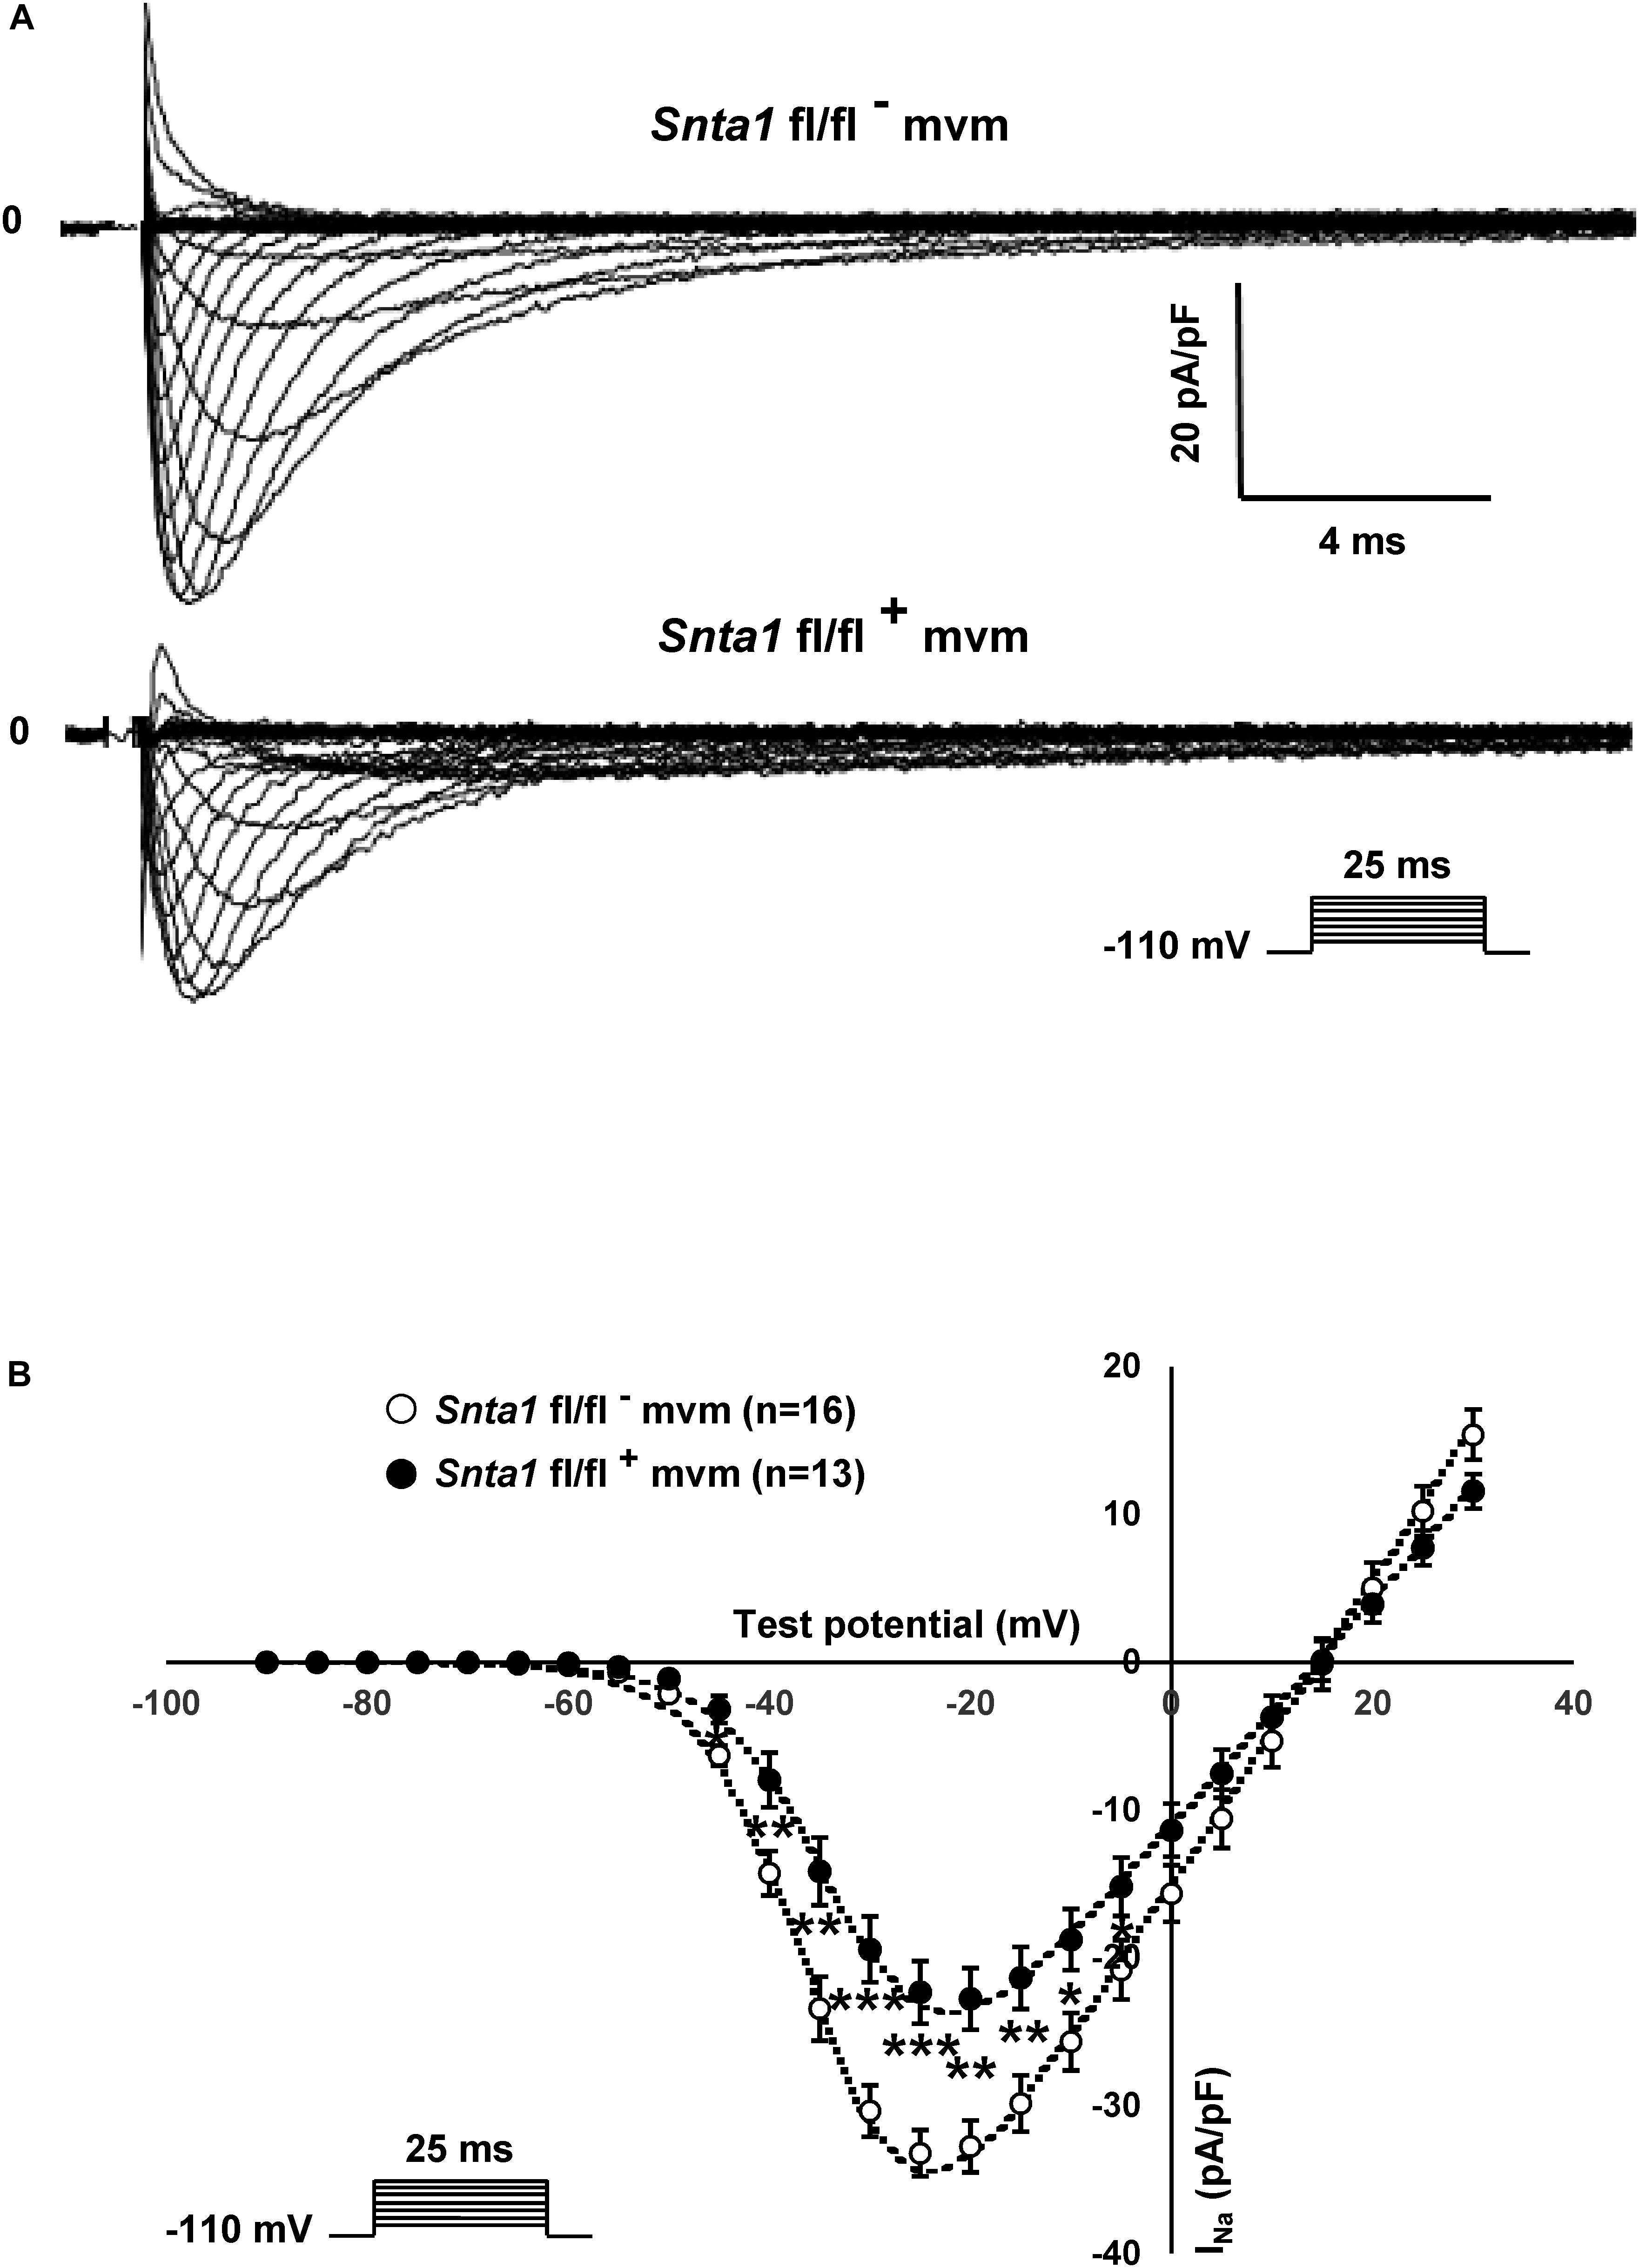
Figure 3. Sodium current measurements in in wild-type and knockdown α1-syntrophin knockdown cardiomyocytes. (A) Raw traces of whole-cell sodium currents recorded in adult ventricular cardiomyocytes from wild-type (Snta1 fl/fl-) and α1-syntrophin cardiac specific knockdown cardiomyocytes (Snta1 fl/fl+). (B), Whole-cell sodium current I–V curves show a significant decrease in the current density in knockdown cardiomyocytes compared to wild-type littermate cells. (∗p < 0.05, ∗∗p < 0.01, ∗∗∗p < 0.001). The number of cells is indicated in parentheses.
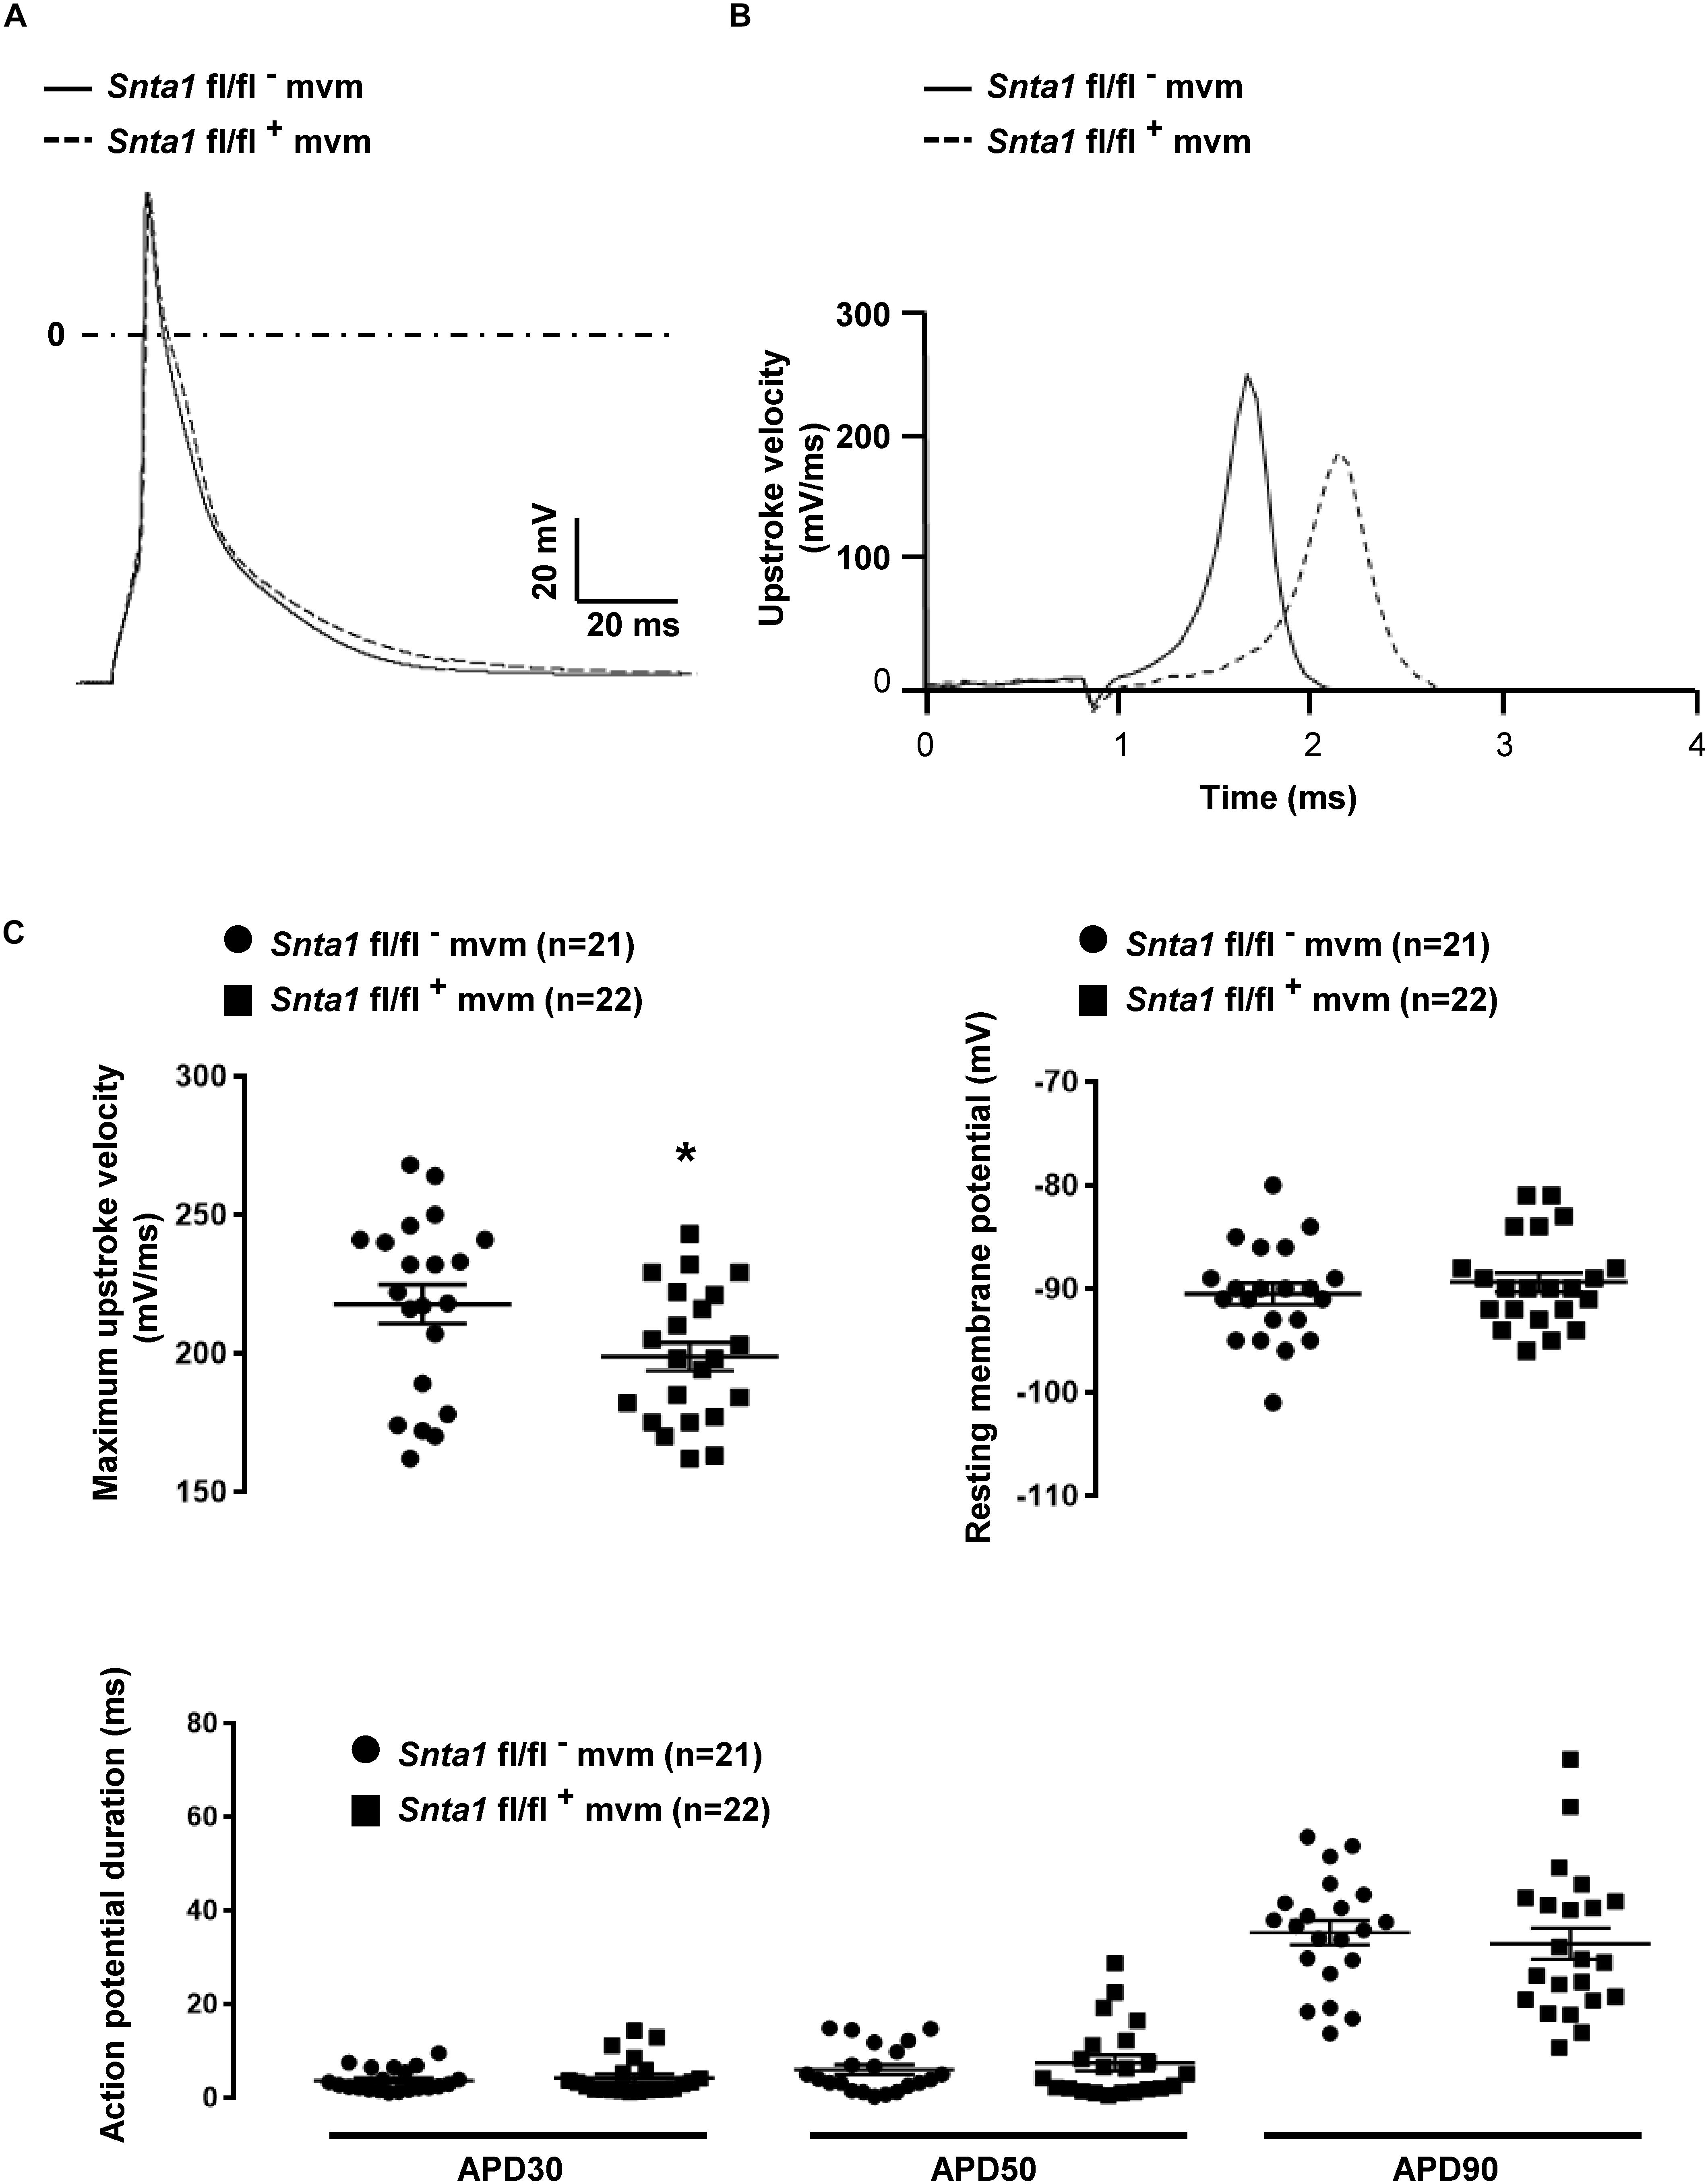
Figure 4. Cardiac action potentials measurements in in wild-type and knockdown α1-syntrophin knockdown cardiomyocytes. (A) Raw traces of cardiac action potential recorded in wild-type adult ventricular cardiomyocytes (Snta1 fl/fl-) and α1-syntrophin cardiac specific knockdown cardiomyocytes (Sntα1 fl/fl+). (B) Upstroke velocity of cardiac action potential recorded in A from wild-type adult ventricular cardiomyocytes (Snta1 fl/fl-) and α1-syntrophin cardiac specific knockdown cardiomyocytes (Sntα1 fl/fl+) showing the slowing of the upstroke velocity in action potential from knockdown cardiomyocytes. (C) Cardiac action potential parameters measured in wild-type (Snta1 fl/fl-) and α1-syntrophin cardiac specific knockdown cardiomyocytes (Snta1 fl/fl+) reveal the significant decrease of the maximal upstroke velocity.
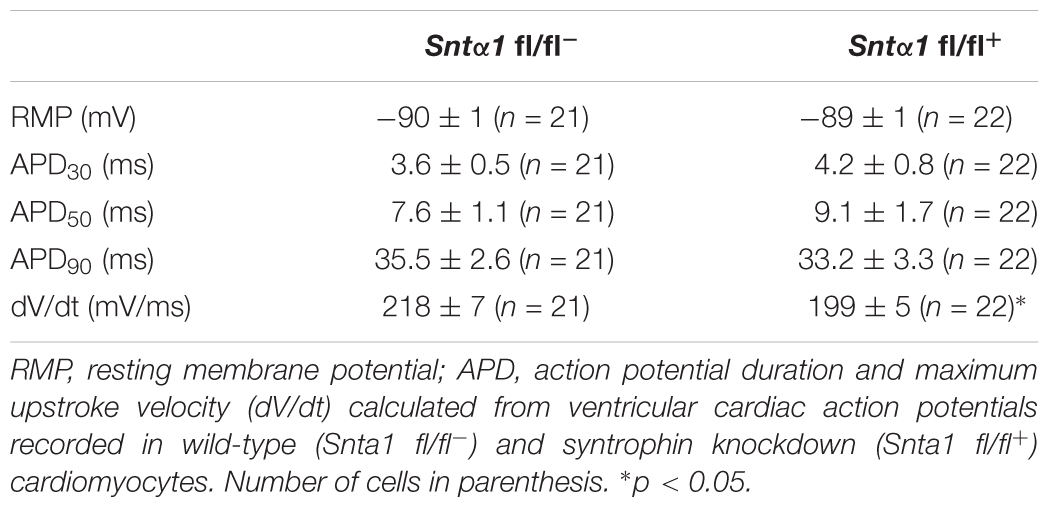
Table 1. Cardiac action potential parameters.
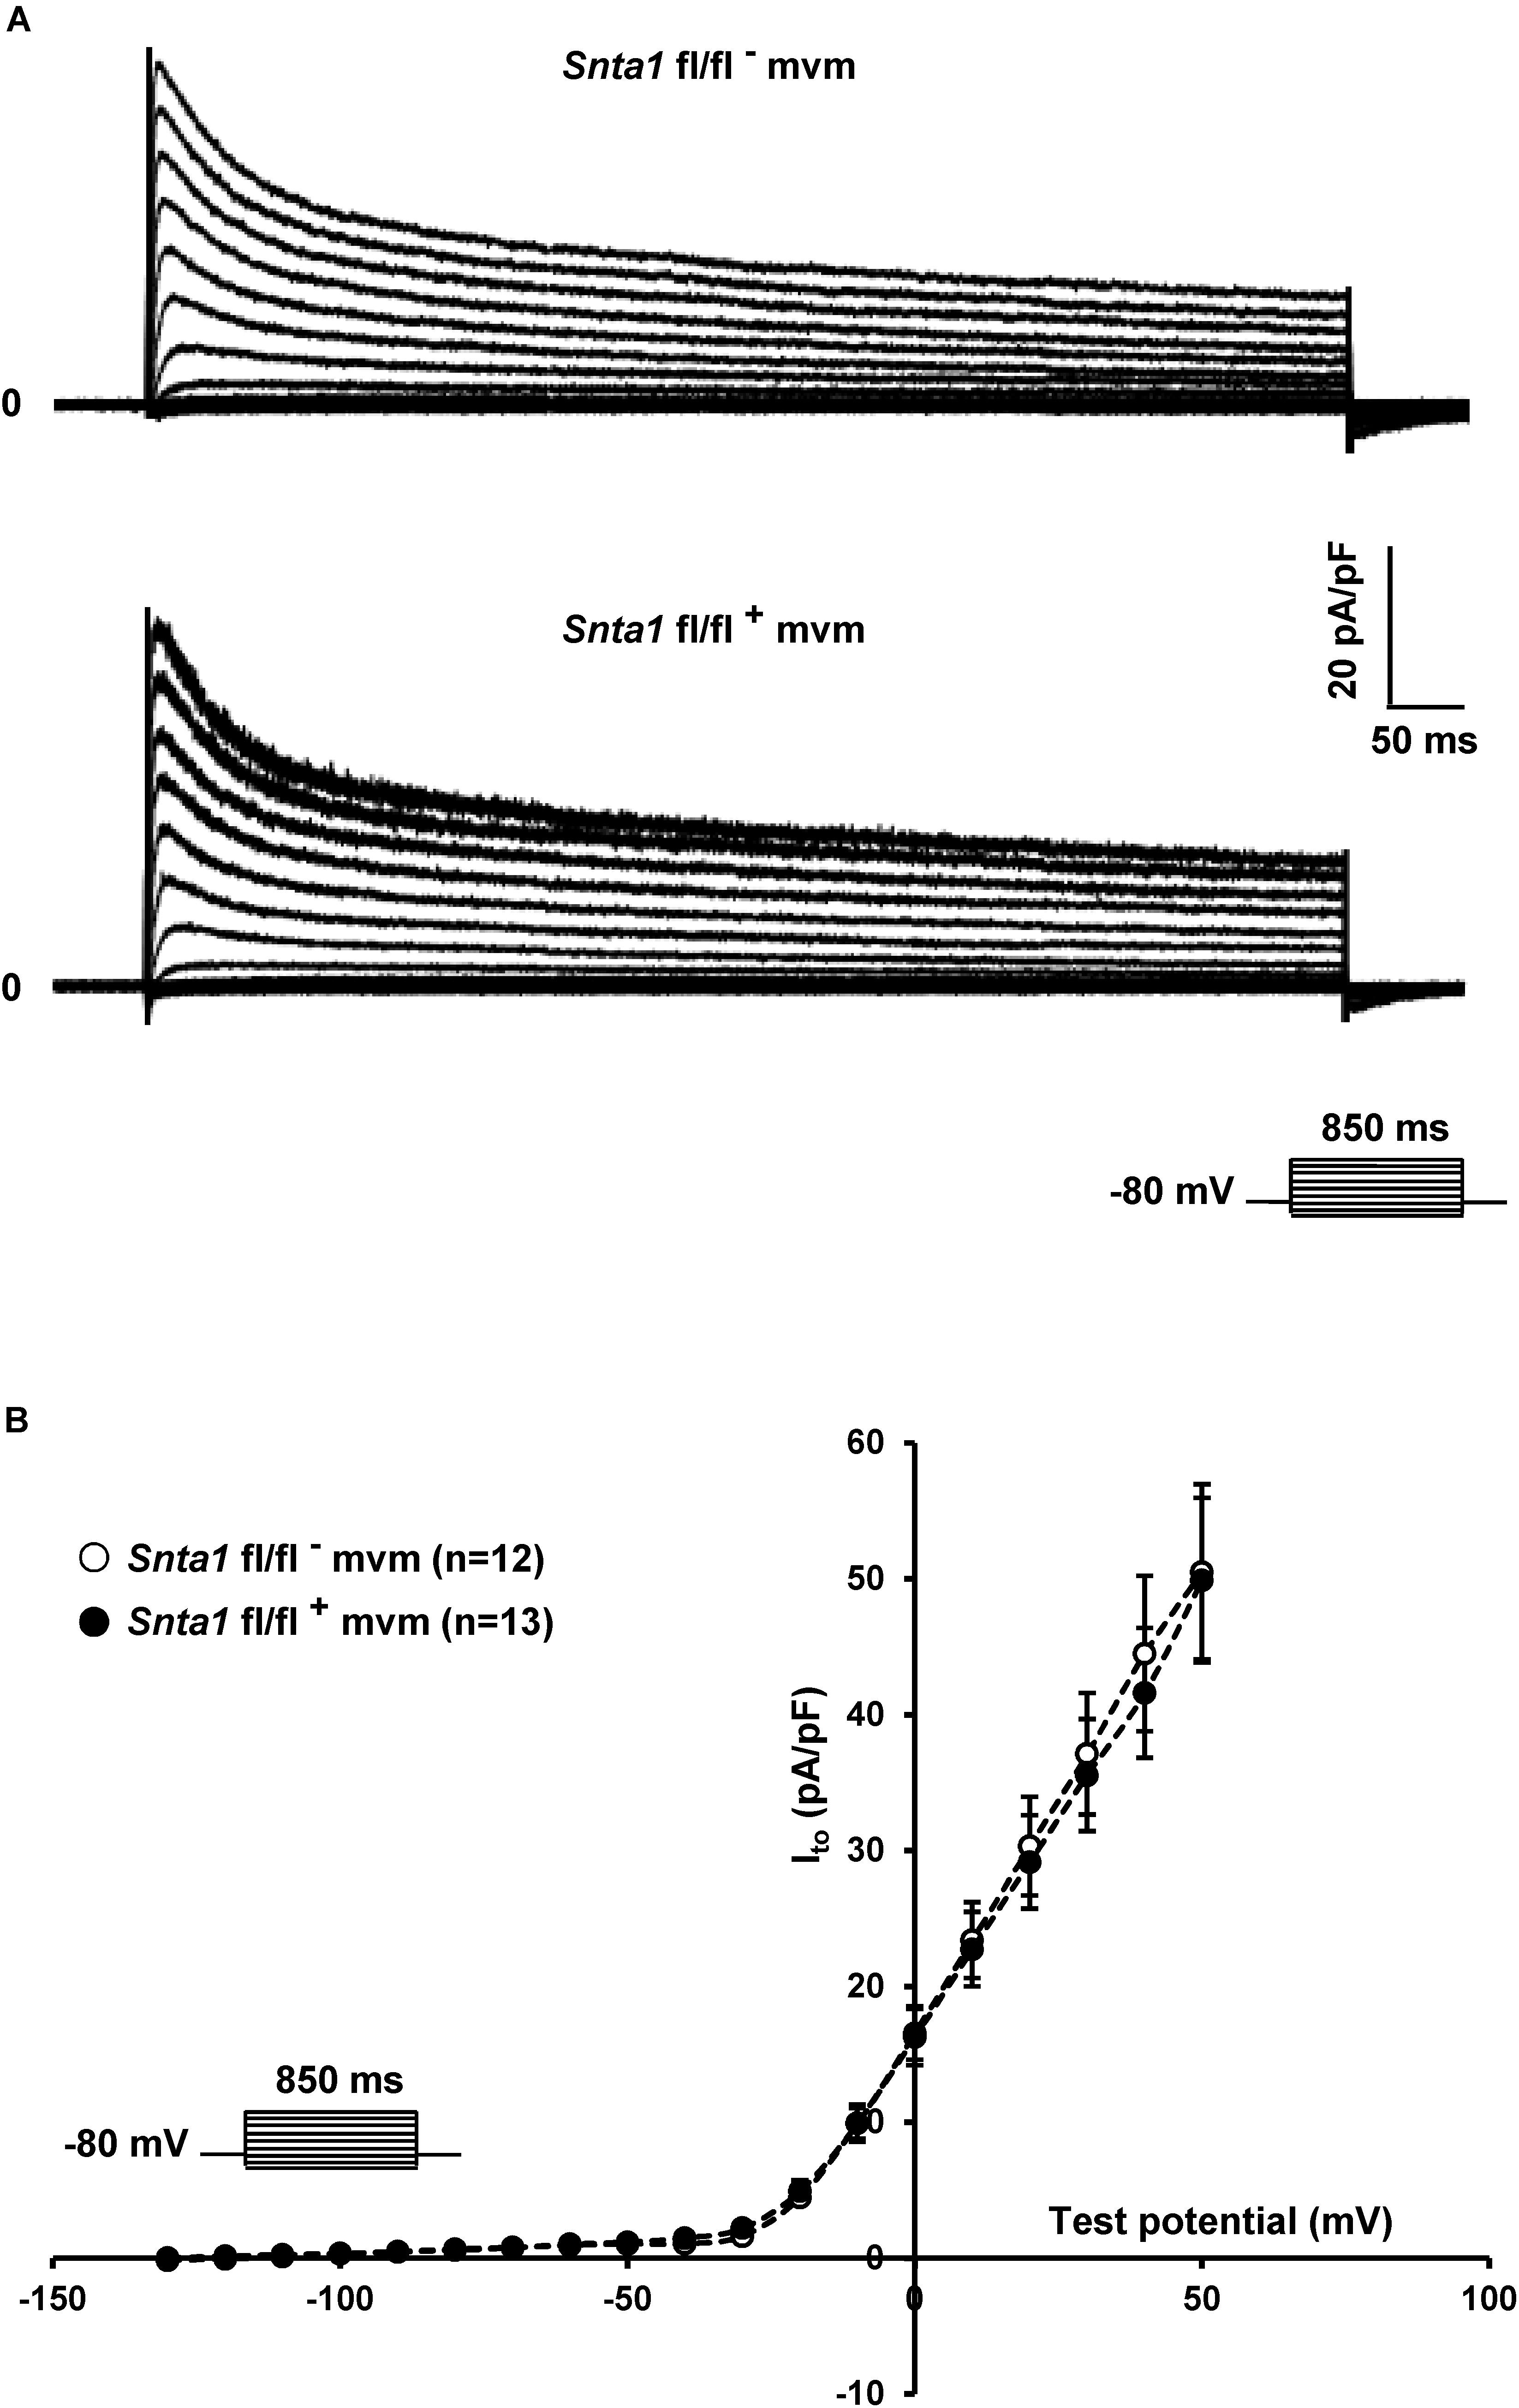
Figure 5. Potassium current Ito measurements in wild-type and knockdown α1-syntrophin knockdown cardiomyocytes. (A,B) Raw traces and potassium current I–V relationships show that knockdown of α1-syntrophin has no effect on these parameters in cardiac cells. The number of cells is indicated in parentheses. The dashed lines are drawn to connect data points and do not represent lines of best fit.
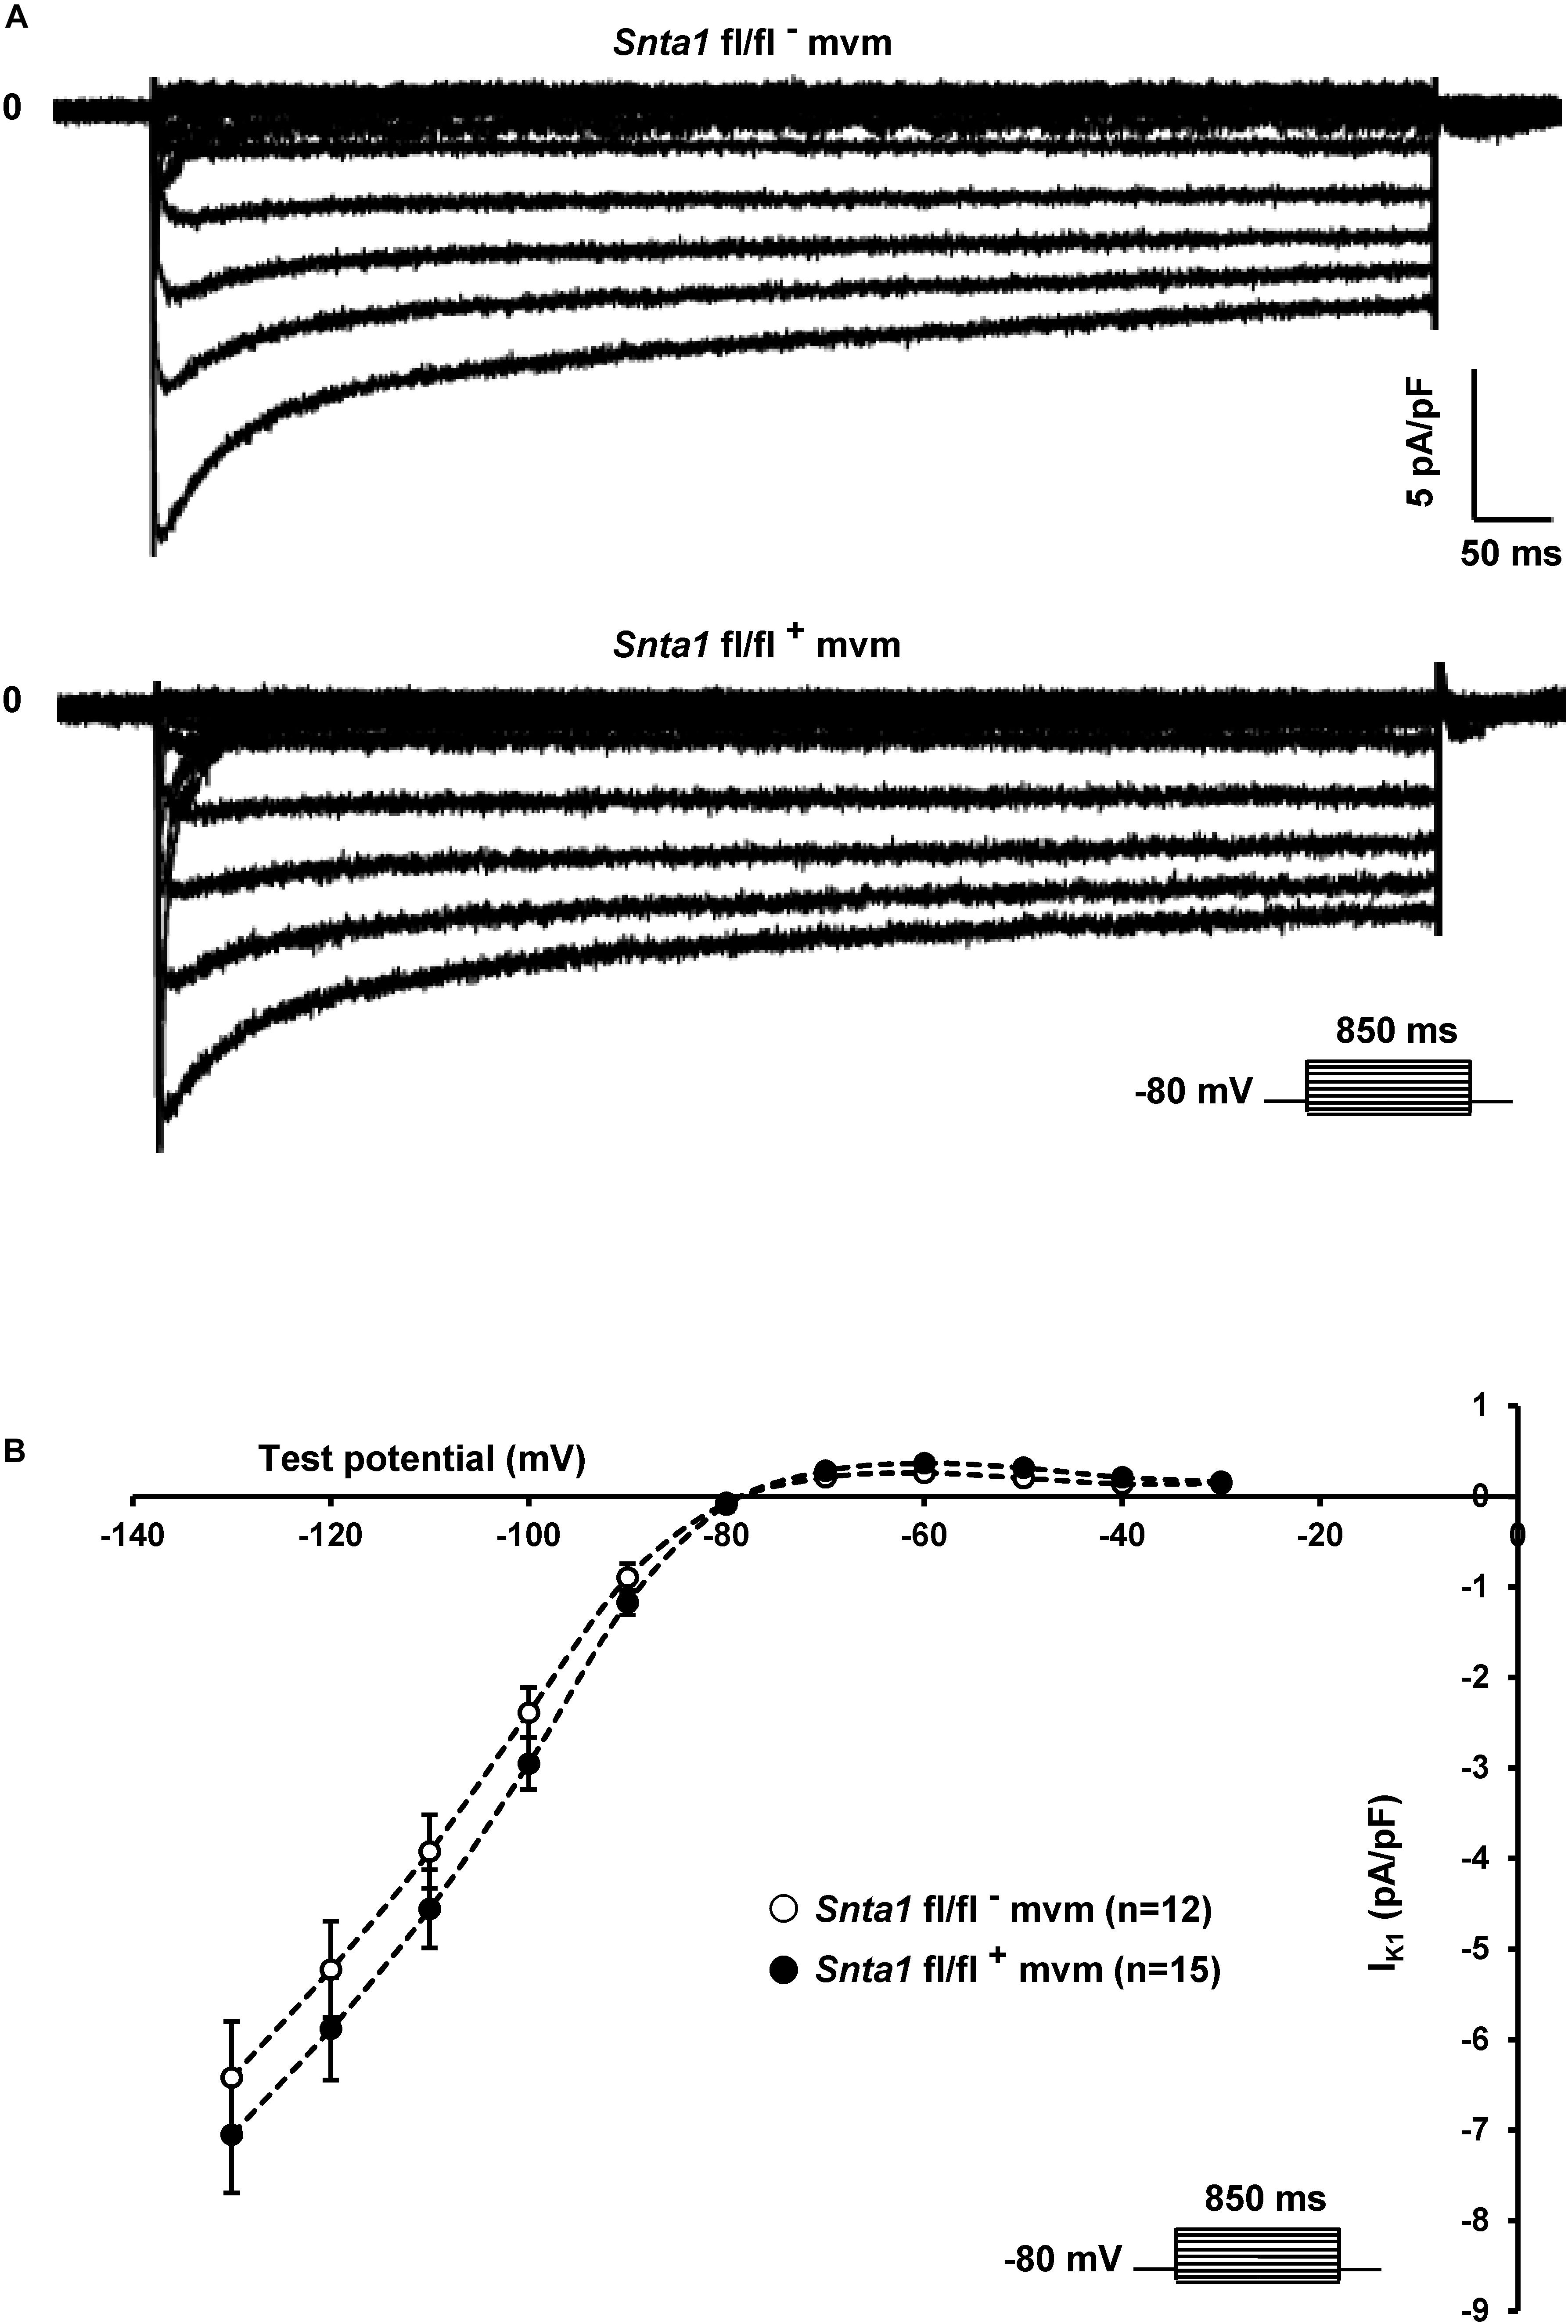
Figure 6. Potassium current IK1 measurements in wild-type and knockdown α1-syntrophin knockdown cardiomyocytes. (A,B) Raw traces and potassium current I–V relationships show that knockdown of α1-syntrophin had no effect on these parameters in cardiac cells. The number of cells is indicated in parentheses. The dashed lines are drawn to connect data points and do not represent lines of best fit.
INa at the Lateral Membrane of α1-Syntrophin Knockdown Cardiomyocytes
Using the cell-attached patch-clamp configuration, we then recorded the INa specifically at the lateral membrane of α1-syntrophin knockdown cardiomyocytes. As shown in Figures 7A,B, using an intrapipette solution with 50 nM of TTX to block TTX-sensitive sodium channels (see section “Materials and Methods”), a sizable TTX-resistant sodium current was recorded in α1-syntrophin knockdown myocytes (Figures 7A,B). This INa is, however, smaller (without any alteration of the main biophysical properties) than the currents recorded in control cells (Snta1 fl/fl- Max inward INa: 143 ± 18 pA, n = 16; Snta1 fl/fl+ Max inward INa: 105 ± 9 pA, n = 22, p < 0.05; glass pipette resistances: Snta1 fl/fl-: 1.41 ± 0.08 MΩ, n = 16; Snta1 fl/fl+: 1.45 ± 0.05 MΩ, n = 22, p > 0.05; Table 2, Figures 7A,B, and Supplementary Figure S3). Altogether, these results suggest that the reduction of α1-syntrophin expression in ventricular cardiomyocytes leads to a decrease of lateral membrane Nav1.5 currents similar to the findings reported by Shy et al. (2014) in ΔSIV mice.
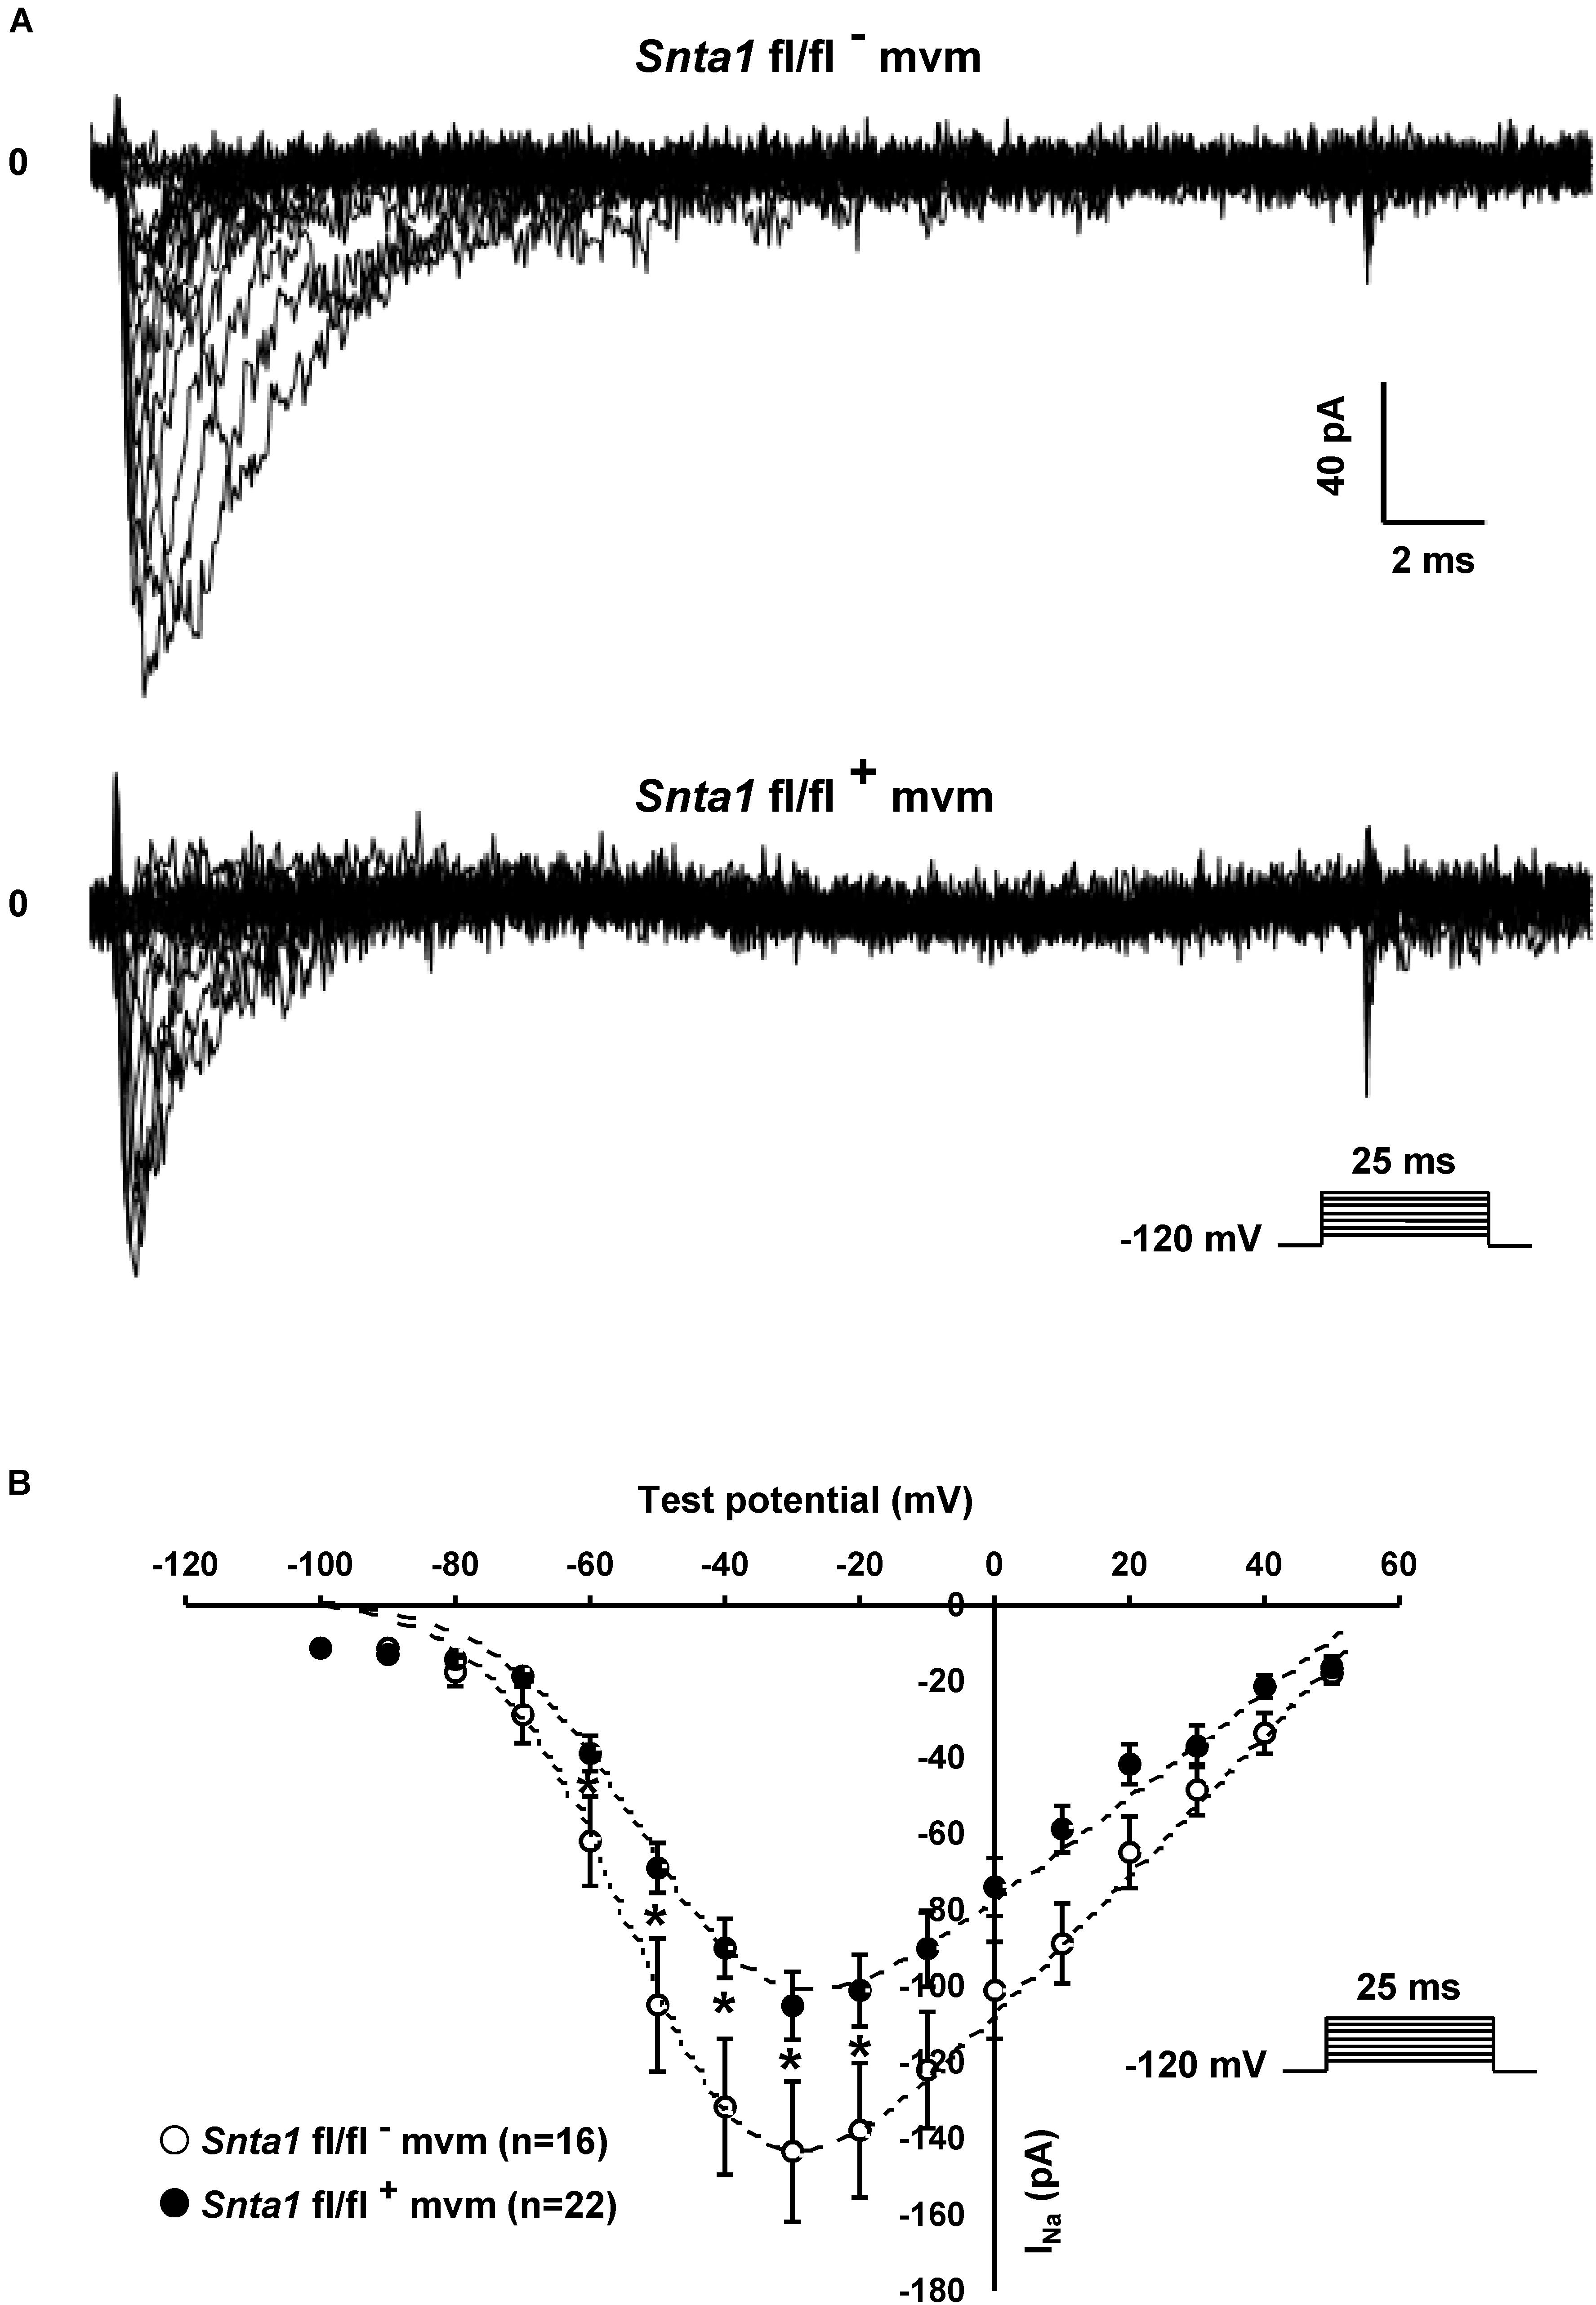
Figure 7. Lateral sodium currents measurements in cell-attached configuration in wild-type and α1-syntrophin knockdown cardiomyocytes. (A), Raw traces of cell-attached sodium currents recorded from adult ventricular cardiomyocytes from wild-type (Snta1 fl/fl-) and α1-syntrophin cardiac specific knockdown cardiomyocytes (Snta1 fl/fl+). (B) Sodium current I–V curves from α1-syntrophin cardiac specific knockdown cardiomyocytes (Snta1 fl/fl+) (∙) reveal a decrease of the lateral sodium current compared to the control (Snta1 fl/fl-) (∘).
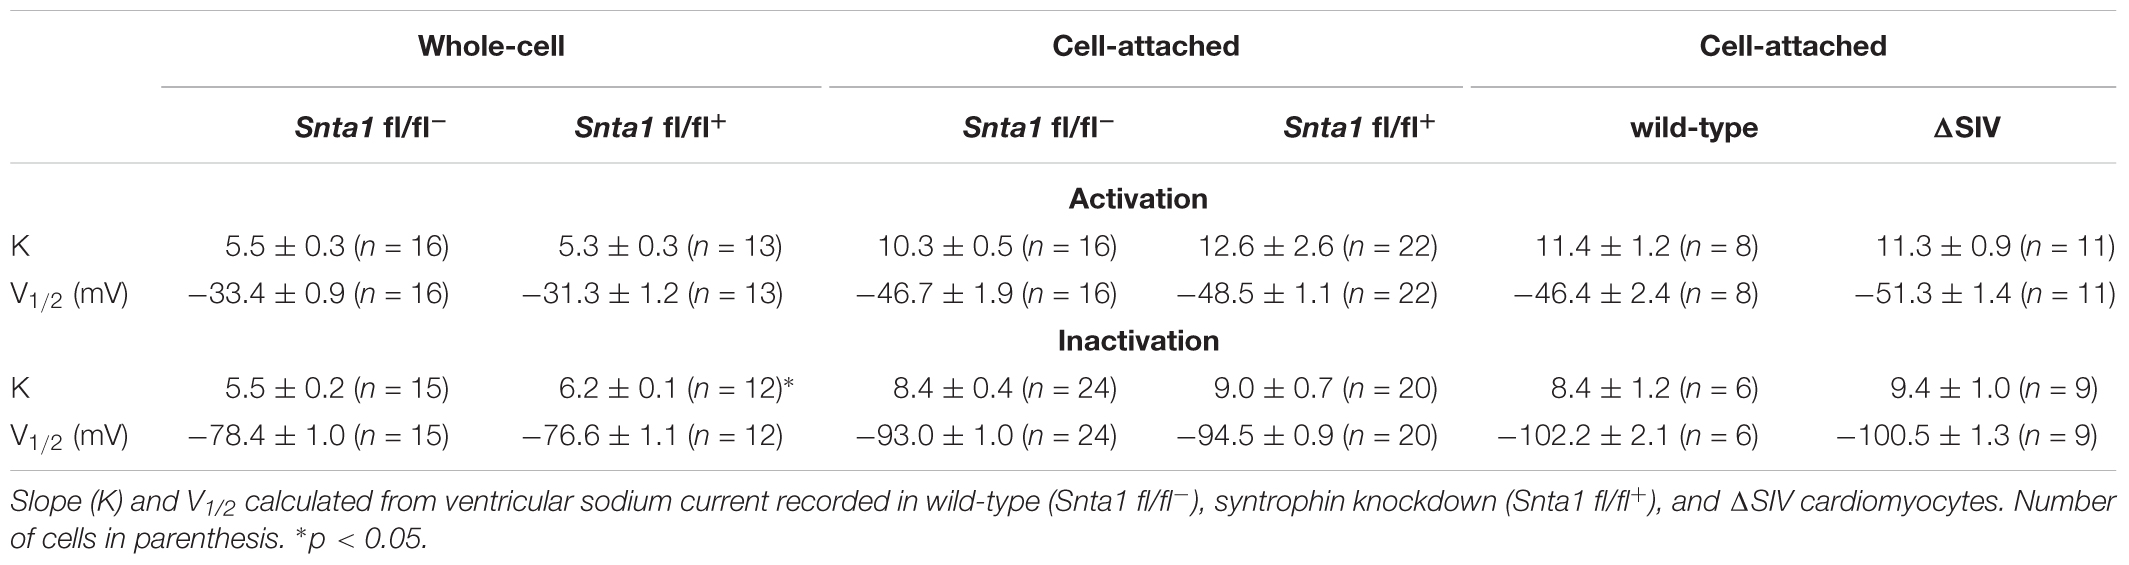
Table 2. Activation and steady state inactivation curve parameters.
INa From α1-Syntrophin Knockdown and ΔSIV Cardiomyocytes
We then performed INa recordings using the cell-attached patch-clamp configuration on isolated ventricular cardiomyocytes from wild-type and ΔSIV mice. Again, similar to the observations by Shy et al. (2014), the TTX-resistant maximum INa at the lateral membrane was significantly decreased in ΔSIV cardiomyocytes compared to controls (wild-type Max inward INa: 198 ± 39 pA, n = 10; ΔSIV Max inward INa: 107 ± 14 pA, n = 13, p < 0.05; glass pipette resistances: wild-type: 1.33 ± 0.09 MΩ, n = 10; ΔSIV: 1.46 ± 0.04 MΩ, n = 13, p > 0.05; Supplementary Figure S4). As already reported, the biophysical properties (steady-state inactivation and activation curves) did not differ between wild-type and ΔSIV INa (Table 2 and Supplementary Figure S5; Shy et al., 2014). Of note, the peak INa also did not differ significantly between lateral membranes of ΔSIV and α1-syntrophin knockdown cardiomyocytes (ΔSIV Max inward INa: 100 ± 8 pA, n = 42; Snta1 fl/fl+ Max inward INa: 116 ± 12 pA, n = 26, p > 0.05) (Figure 8A). In summary, these results suggest that a sizable fraction of the TTX-resistant INa at the lateral membrane of ventricular cardiomyocytes depends neither on the Nav1.5 SIV motif nor on α1-syntrophin.
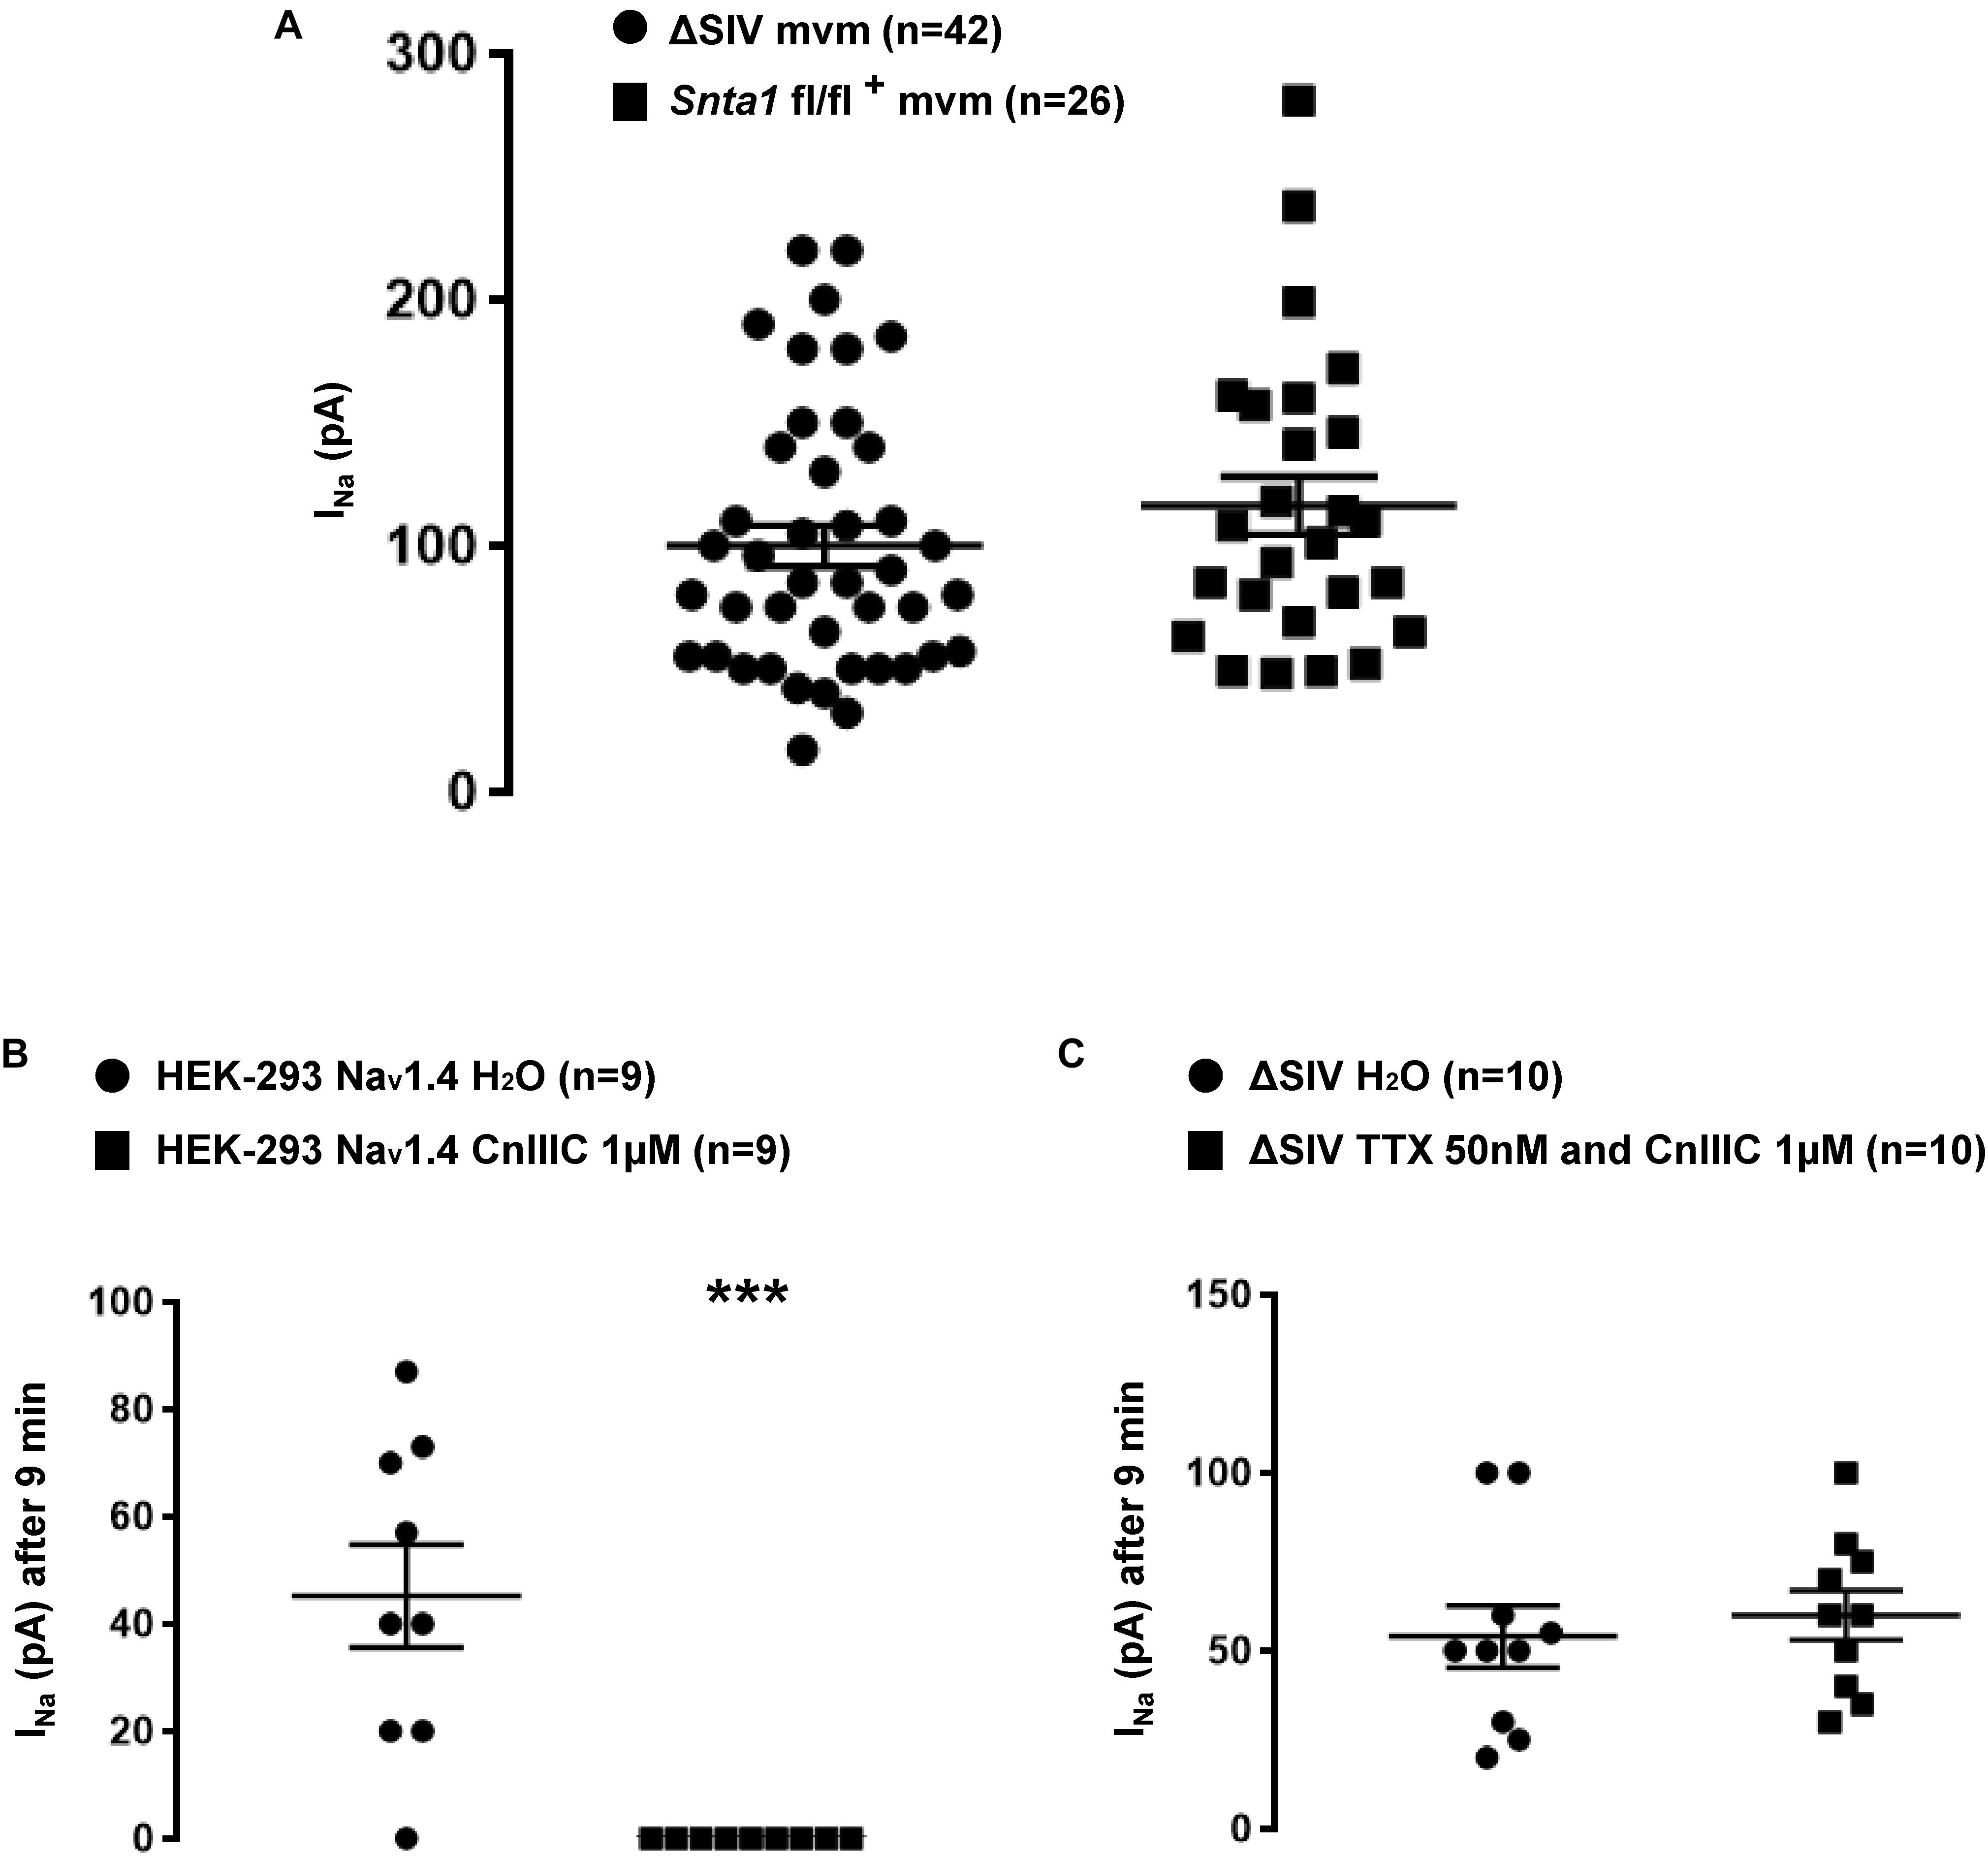
Figure 8. Pharmacological characterization of the remaining sodium current at the lateral membrane of cardiomyocytes. (A) Plot chart showing the similarity in average sodium currents recorded at the lateral membrane of cardiomyocytes from ΔSIV and α1-syntrophin cardiac specific knockdown (Snta1 fl/fl+) cardiomyocytes using cell-attached configuration. (B) μ-conotoxin CnIIIC (CnIIIC) mediated the reduction in Nav1.4 INa after 9 min of application in HEK-293 cell line. (C) Tetrodotoxin (TTX) and μ-conotoxin CnIIIC (CnIIIC) did not mediate any effect on INa recorded on the lateral membrane of ΔSIV cardiomyocytes using the cell-attached configuration (∗p < 0.05, ∗∗p < 0.01, ∗∗∗p < 0.001). The number of cells is indicated in parentheses.
Nav1.5 Channels and the Remaining INa at the Lateral Membrane
Several studies reported that other Nav1.x isoforms may be expressed in cardiac cells in addition to Nav1.5, such as Nav1.1 (Westenbroek et al., 2013), Nav1.2 (Stoetzer et al., 2016), Nav1.3 (Westenbroek et al., 2013), Nav1.4 (Westenbroek et al., 2013), Nav1.6 (Westenbroek et al., 2013), and Nav1.8 (Yang et al., 2012). Although we performed the aforementioned INa recordings in the presence of 50 nM TTX, which efficiently inhibits Nav1.1 (IC50 ∼10 nM), Nav1.2 (IC50 ∼10 nM), Nav1.3 (IC50 ∼10 nM), and Nav1.6 (IC50 ∼5 nM), INa from Nav1.4 (IC50 ∼25 nM) and Nav1.8 (IC50 > 50 μM) could still be present. As shown in Supplementary Figure S4, in recordings from ΔSIV cells, the I–V relationship presents the maximum INa at a membrane voltage of around -30 mV. This suggests that the majority of this remaining current is not carried by Nav1.8, whose maximum current lies at more depolarized values (around 0 mV) (Stroud et al., 2016). We then addressed the question whether Nav1.4 contributes to the remaining current. HEK-293 cells were transfected with a Nav1.4 construct, and currents were recorded using the cell-attached patch-clamp approach in the presence of several drugs. As shown in Supplementary Figure S6A, INa was only recorded in cells transfected with Nav1.4 (Supplementary Figure S6A). Addition of 50 nM TTX in the intrapipette solution strongly decreased the Nav1.4 INa after 3 min of pipette seal (H2O Max inward INa: 54 ± 21 pA, n = 7; TTX 50 nM Max inward INa: 6 ± 3 pA, n = 9, p < 0.05) (Supplementary Figure S6B). In parallel, 9 min after pipette seal, an intrapipette solution containing 1 μM μ-conotoxin CnIIIC, a specific blocker of Nav1.4 (IC50 ∼1.4 nM) compared to Nav1.5 (IC50 > 10 μM) (Favreau et al., 2012), completely abolished Nav1.4 currents (H2O Max inward INa: 45 ± 10 pA, n = 9; CnIIIC 1 μM Max inward INa: 0 ± 0 pA, n = 9, p < 0.05; Figure 8B). Based on these observations, an intrapipette cocktail solution containing 50 nM of TTX and 1 μM μ-conotoxin CnIIIC was then used to repeat the INa recordings from the lateral membrane of ΔSIV cardiomyocytes. As shown in Figure 8C, 9 min after sealing the pipette, no alteration of the INa amplitude was observed (H2O Max inward INa: 54 ± 9 pA, n = 10; cocktail Max inward INa: 60 ± 10 pA, n = 10, p > 0.05; Figure 8C). These results suggest that the remaining lateral membrane INa in ΔSIV cardiomyocytes is mainly carried by Nav1.5 channels.
Role of T-Tubules in Generating the Lateral Membrane INa
We then aimed to investigate whether lateral membrane INa is of T-tubular origin, following a protocol described by Brette et al. (2002) to detubulate cardiac ventricular cells. As shown in Figure 9A, di-8-ANEPPS staining on living non-detubulated wild-type mouse cardiomyocytes presented a striated pattern reflecting the presence of T-tubules (Figure 9A). This striated pattern was absent in detubulated wild-type cells, validating the detubulation procedure (Figure 9A). To assess the functional consequences of detubulation, we first recorded the electrical capacitance of the cells, which approximates the surface of the plasma membrane, and, as a positive control, Cav1.2-mediated currents using Ba2+ as charge carrier (Figures 9B–D). Detubulation significantly decreased the capacitance of the cardiac cells by 30 ± 4%, (non-detubulated: 159 ± 14 pF, n = 7; detubulated: 111 ± 6 pF, n = 7, p < 0.05; Figure 9B), and the maximum Ba2+ current by 57 ± 7% (non-detubulated Max inward IBa: 4377 ± 270 pA, n = 7; detubulated Max inward IBa: 1879 ± 306 pA, n = 7, p < 0.05; Figure 9C). Consequently, the Ba2+ current density (pA/pF) was also significantly decreased by 42 ± 9 % (non-detubulated Max inward IBa: 29 ± 3 pA/pF, n = 7; detubulated Max inward IBa: 17 ± 3 pA/pF, n = 7, p < 0.05; Figure 9D). These results validate the procedure of cardiomyocyte detubulation by formamide treatment. Then, lateral INa was recorded in non-detubulated and detubulated ΔSIV cardiomyocytes. As shown in Figures 10A,B, the maximum INa of detubulated cardiac cells compared to non-detubulated cardiomyocytes was not modified (non-detubulated Max inward INa: 95 ± 10 pA, n = 29; detubulated Max inward INa: 80 ± 6 pA, n = 29, p > 0.05; Figures 10A,B). These findings suggest that the remaining lateral membrane INa in ΔSIV myocytes is not carried by Nav1.5 channels in the T-tubular system, but rather by a distinct lateral membrane pool of Nav1.5 channels that is independent of the PDZ-binding motif SIV.
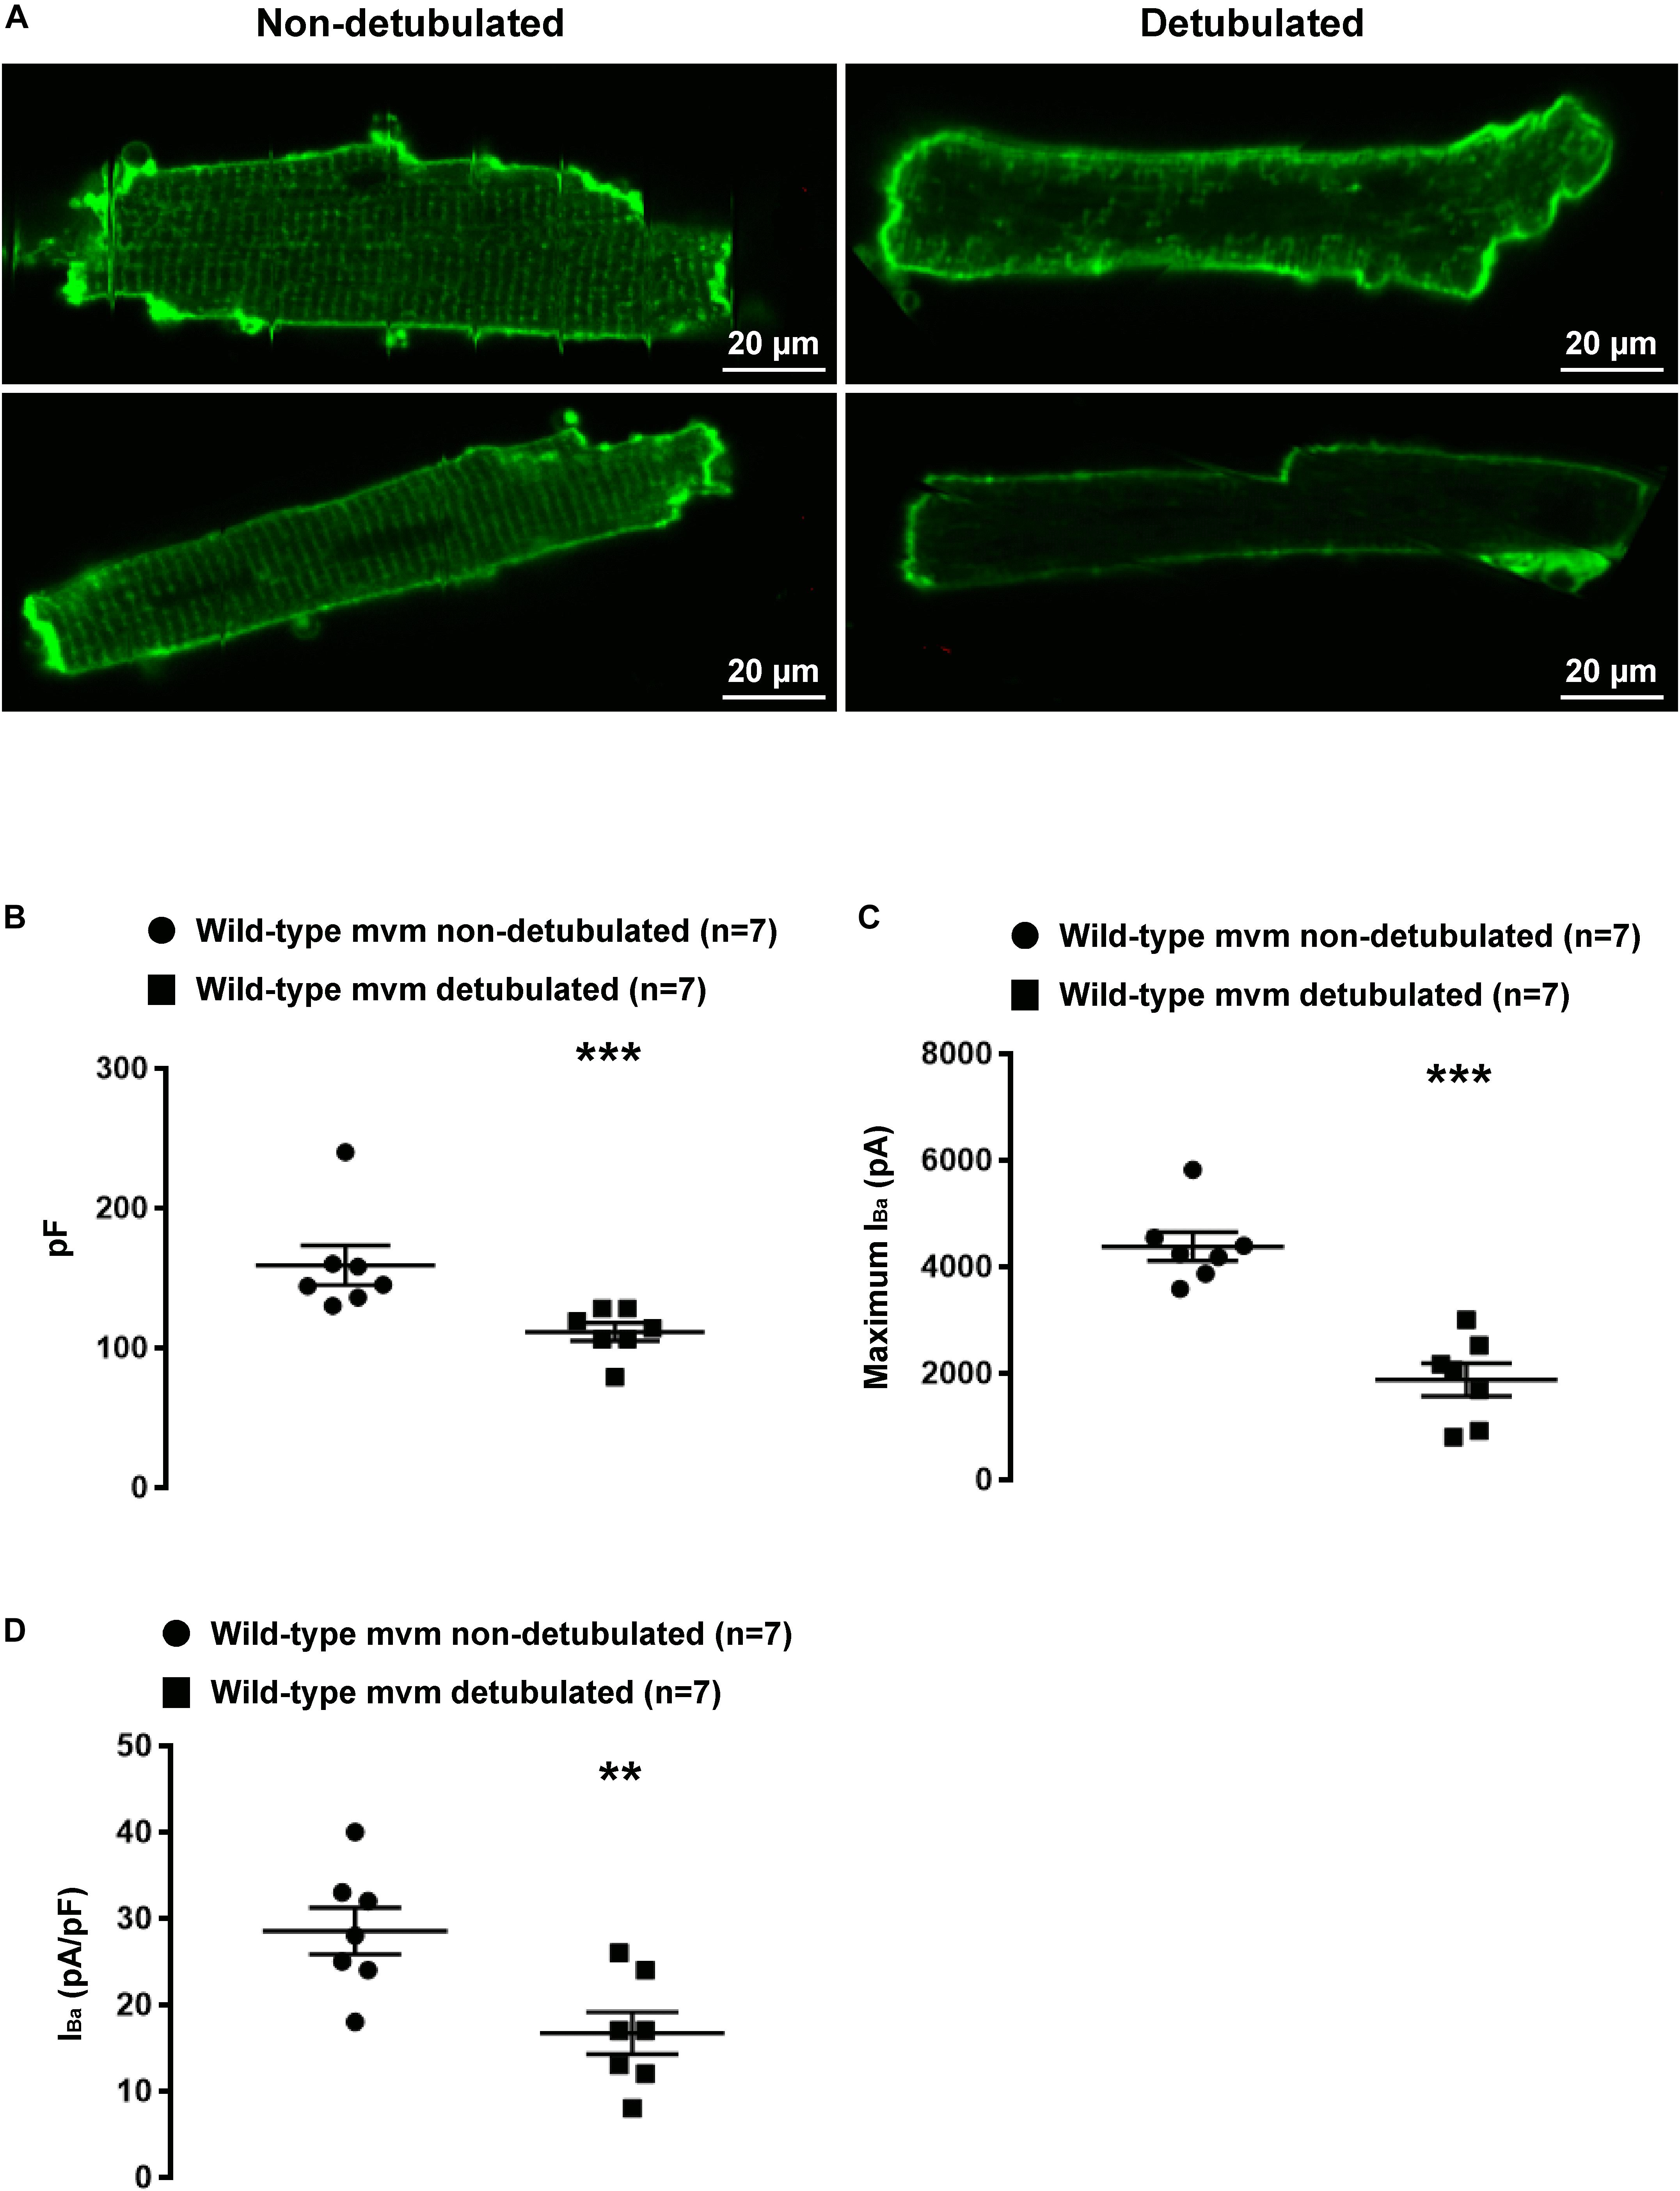
Figure 9. Validation of the detubulation procedure. (A) Confocal images showing detubulation mediated by formamide treatment on living cardiomyocytes. (B) Effect of detubulation on cell capacitance (pF). (C,D) functional consequences of detubulation on barium currents (IBa) carried by calcium channels. (∗∗p < 0.01, ∗∗∗p < 0.001). The number of cells is indicated in parentheses.
Assessing the T-Tubular Pool of Ion Channels Using the Cell-Attached Patch Clamp Configuration
Lastly, we assessed whether the cell-attached patch-clamp configuration allows the recording of T-tubular currents. In theory, the pipettes used in this study had an opening large enough (∼20 μm2) to catch the mouth of 3–5 T-tubules. We recorded ICa from lateral membrane on wild-type ventricular myocytes using an intrapipette solution with only barium as the charge carrier. Note that most of the cardiac voltage-gated calcium channels Cav1.2 are located in T-tubules (Kawai et al., 1999). Contrary to the expected macroscopic ICa, only single-channel current activities were observed, most likely arising from calcium channels (Figures 11A,B). To characterize these currents, 3 μM of the calcium channel opener Bay-K-8644 was added to the intrapipette solution. Bay-K-8644 significantly increased the number of events (vehicle: 39,677 events, n = 3; Bay-K-8644: 83,697 events, n = 3, p < 0.05; Figures 11A,B). Altogether, these results demonstrate that the cell-attached patch-clamp configuration on the lateral membrane does not permit to investigate ion channels activity at the T-tubules, since the size of the recorded ICa was much smaller than the one expected from T-tubules.
Discussion
The present study shows that (1) a distinct population of Nav1.5 channels at the lateral membrane of mouse cardiomyocytes does not depend on either the PDZ-binding SIV motif or the α1-syntrophin protein; (2) the remaining INa at the lateral membrane of Nav1.5 ΔSIV myocytes is carried by sodium channels that are most likely not located in the T-tubules; (3) the identity of this sub-pool of sodium channels remaining at the lateral membrane is probably Nav1.5; and (4) the cell-attached patch-clamp configuration does not allow the investigation of ion channels expressed in the T-tubular system.
Although other Nav1.x channels (so-called neuronal isoforms) have been proposed to be expressed in the T-tubular system, recent transcriptomic analyses from freshly isolated murine ventricular myocytes suggests that only transcripts encoding Nav1.5 and Nav1.4 channels are significantly expressed (Chevalier et al., 2018). However, the presence of a Nav1.5 channel population in T-tubules of murine cardiomyocytes is still an open question. In ventricular cardiomyocytes, the punctate pattern observed in staining by Shy et al. and colleagues suggesting the presence of Nav1.5 channels inside the T-tubules could be due to either their presence at the Z-line level, a structure close to the T-tubules, or unspecific staining (Ziane et al., 2010; Shy et al., 2014). Cell-attached patch-clamp configuration on lateral membrane of wild-type and detubulated ventricular cardiomyocytes to record sodium currents has been proposed as an approach to decipher if sodium channels are expressed in T-tubules. Assuming that the T-tubular system accounts for an important percentage of the cell surface area, ∼30% decrease after detubulation of the cell capacitance measured in this study and in others suggest a poor detubulation procedure that may lead to a misinterpretation the results (Brette et al., 2002). Optical measurements have shown that a decrease of 32% of the cell capacitance, after formamide detubulation, corresponds de facto to 65% decrease of the cell surface area (Pasek et al., 2008). Based on these data, the results presented in Figure 10 clearly suggest that the cell-attached configuration does not allow the recording of the activity of sodium channels located in T-tubules. This conclusion is also supported by the recordings of unitary calcium conductances (as in Figure 11) that are most likely reflecting Cav1.2 channel activity around the opening of T-tubule as reported by Lab et al. (2013).
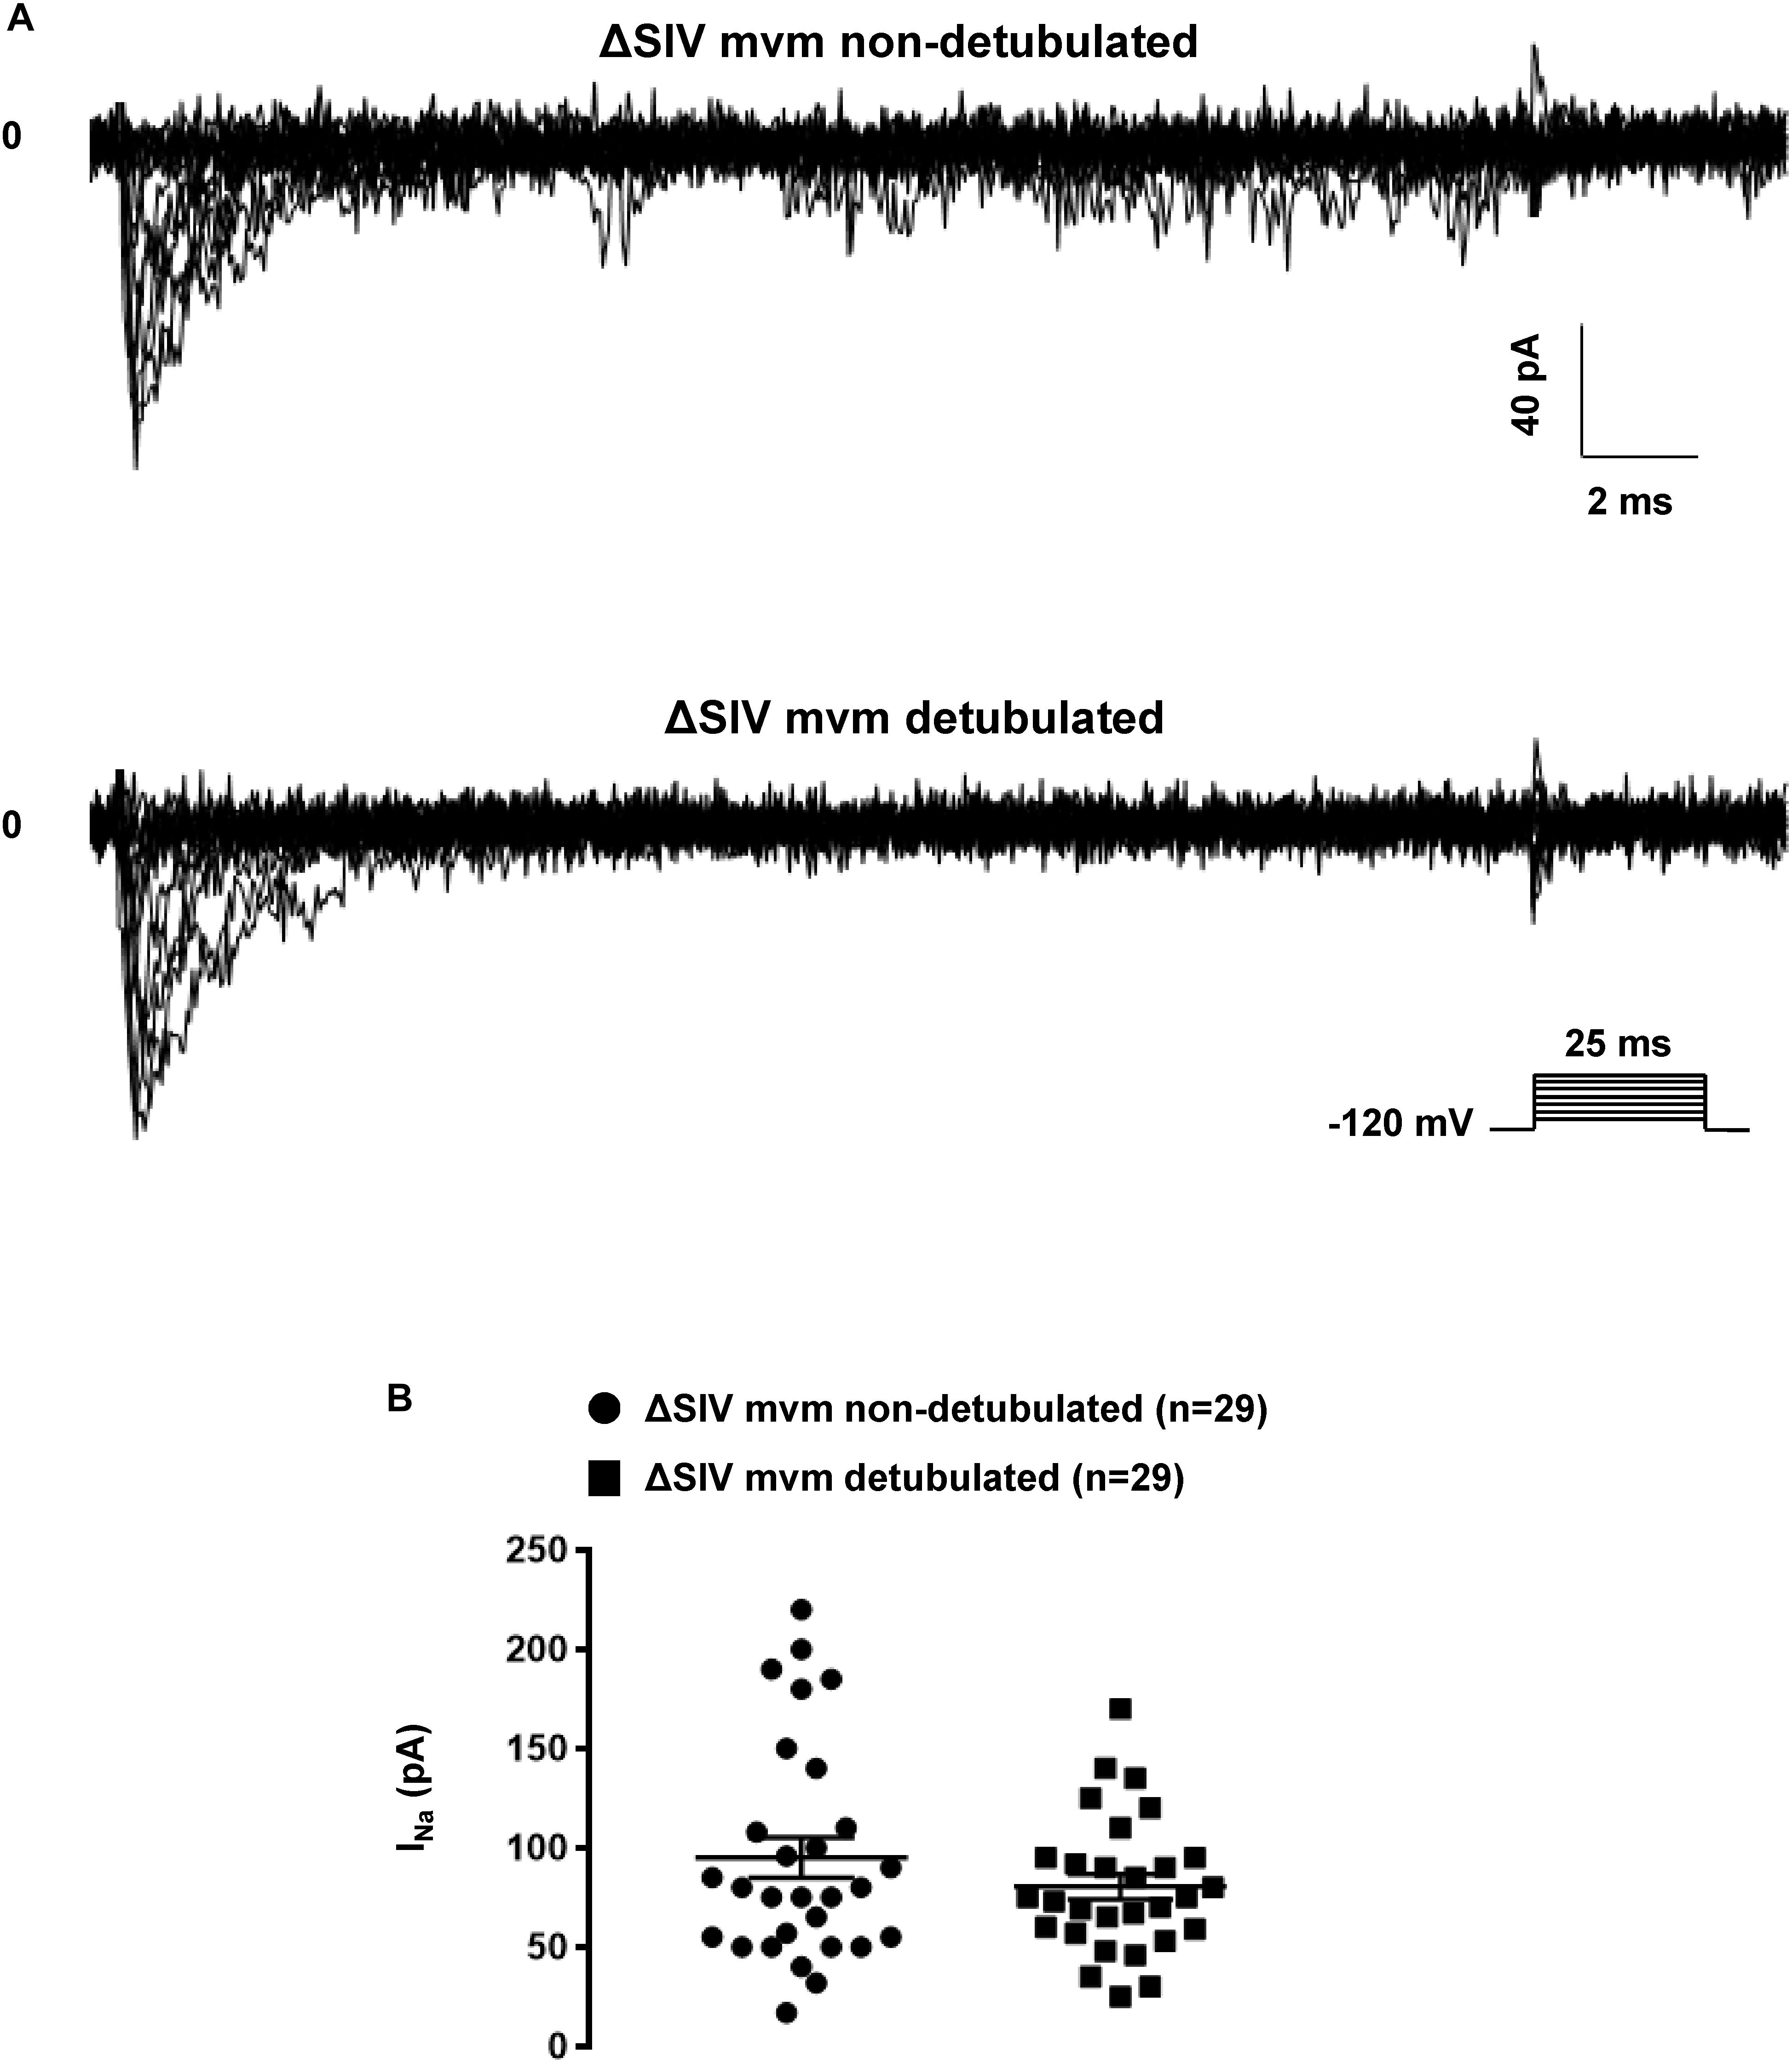
Figure 10. Effects of the detubulation on lateral sodium current. (A) Raw traces of cell-attached sodium currents recorded from non-detubulated and detubulated ΔSIV adult ventricular cardiomyocytes. (B) Consequences on peak current amplitudes of detubulation on lateral sodium currents from ΔSIV cardiomyocytes. The number of cells is indicated in parentheses.
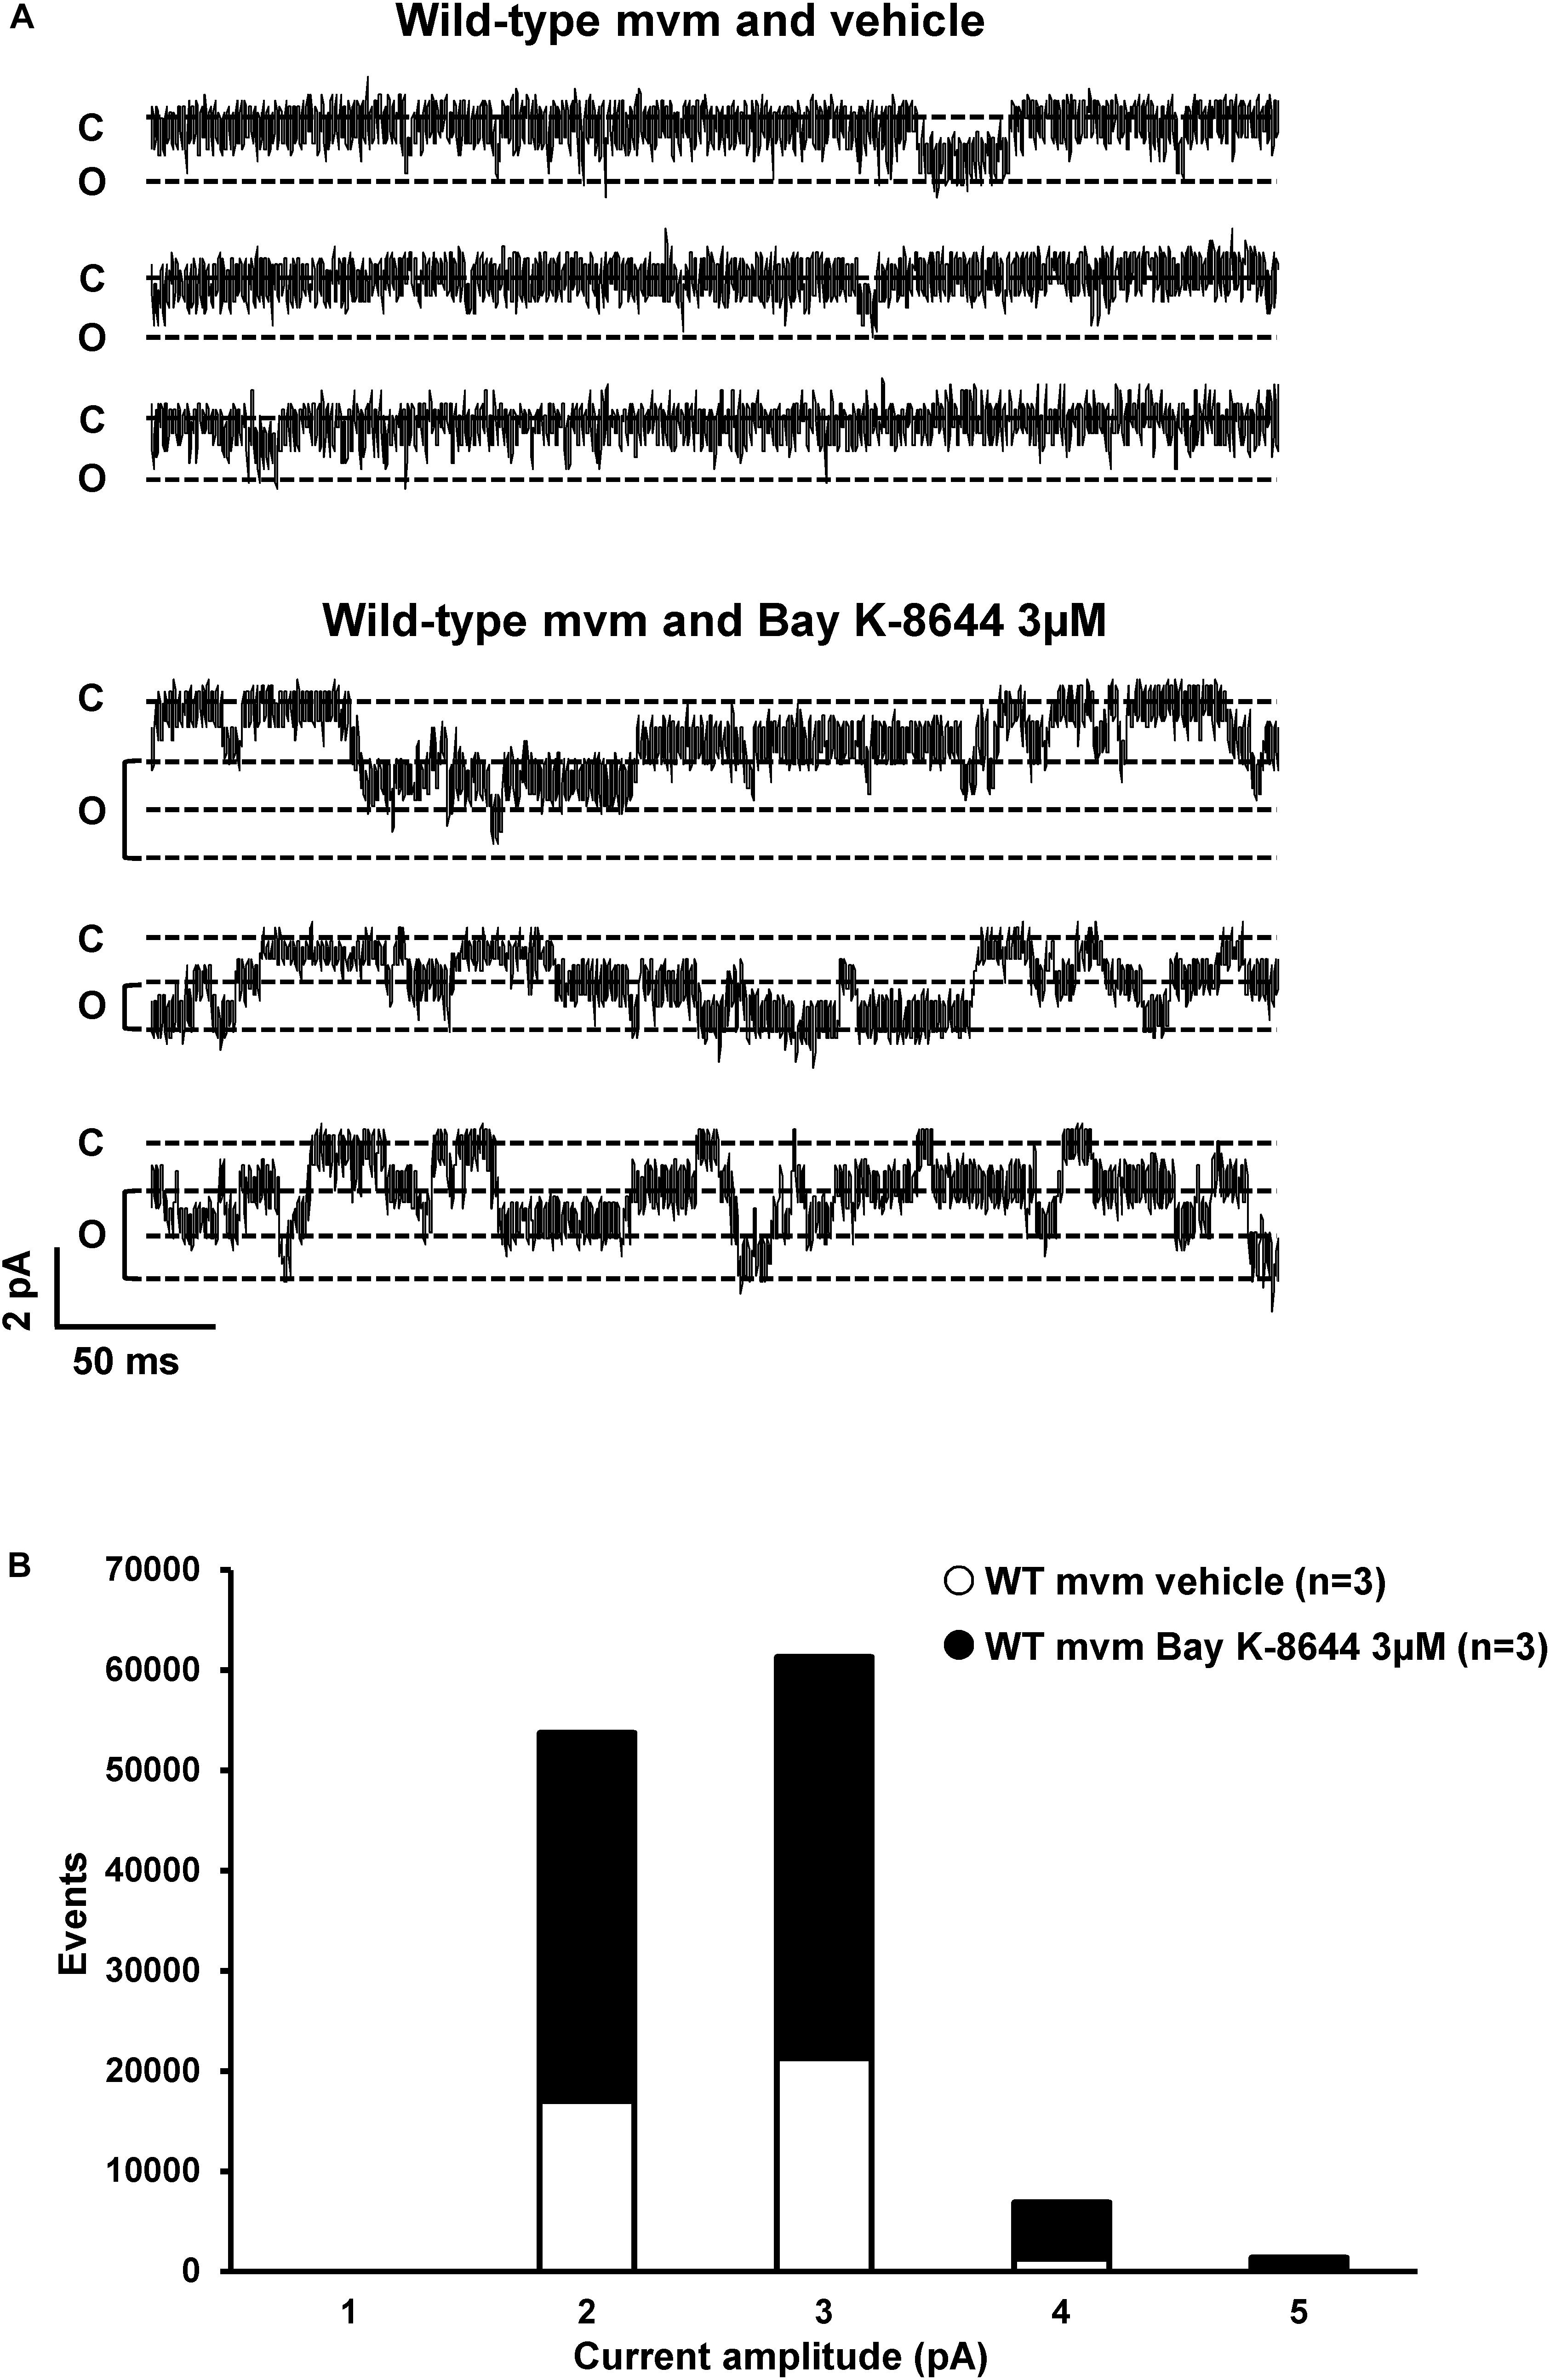
Figure 11. Calcium current recordings and cell-attached configuration. (A) Single currents recorded using cell-attached configuration on the lateral membrane of wild-type cardiomyocytes with only calcium inside the pipette. The calcium channel opener Bay K-8644 affects calcium currents, suggesting that this single current is a calcium current. (B) Quantification of events observed in panel (A) without (∘) or with (∙) Bay K-8644. The number of cells is indicated in parentheses.
The novel findings from the cardiac-specific α1-syntrophin knockdown mouse line suggest that the remaining INa at the lateral membrane is indeed independent of the interaction between α1-syntrophin with the Nav1.5 C-terminal SIV motif or, as Shy et al. (2014) and Matamoros et al. (2016) proposed, via the N-terminal SLA motif. Surprisingly, the decrease of the lateral membrane INa is somewhat less pronounced in α1-syntrophin knockdown than in ΔSIV cardiomyocytes suggesting that the SIV-motif may interact with other partners. However, one has to take into account that both mouse lines are on different genetic backgrounds. Therefore, caution should be taken before comparing these two set of data. Further experiments using a double ΔSIV-α1-syntrophin knockdown mouse model will have to be carried out to challenge this question. Such experiments would indubitably show whether the remaining INa at the lateral membrane is independent of both the SIV motif and α1-syntrophin.
It may seem surprising that the AP duration in cardiac-specific α1-syntrophin knockdown myocytes was not prolonged. It has been reported that mutations in the gene coding for α1-syntrophin lead to an increase of the late sodium current, and hence prolong the AP duration (Ueda et al., 2008; Cheng et al., 2009). This mechanism has been proposed to be caused by a decrease of interaction between mutant α1-syntrophin and the plasma membrane Ca2+ ATPase subtype 4b (PMCA4b) and scavenging nNOS. The concomitant upregulation of nNOS, and hyper-S-nitrosylation of Nav1.5 channel was proposed to underlie the increase of the late sodium current (Ueda et al., 2008; Cheng et al., 2009). Since in the α1-syntrophin knockdown model of this study the syntrophin protein is absent (Figures 1A, 2A), we speculate that the macro-molecular complex comprising Nav1.5, PMCA4b, nNOS, and α1-syntrophin is entirely dissociated. This may explain why no effect on the cardiac AP duration was observed.
The finding that only INa and not Ito and IK1 was altered in α1-syntrophin knockdown cardiomyocytes is at odds with the recent studies by Iwata et al. (2005) and Matamoros et al. (2016). This discrepancy may reflect fundamental differences when studying ion channel regulation using in vitro vs. in vivo models as already observed with the regulation of Nav1.5 by SAP97 (Petitprez et al., 2011; Milstein et al., 2012; Gillet et al., 2015; Matamoros et al., 2016). It appears unlikely that the remaining sodium channels at the lateral membrane interacts with other syntrophin isoforms since α1-syntrophin accounts for ∼90% of all syntrophin mRNA expressed in murine cardiac cells (Iwata et al., 2005; Chevalier et al., 2018). However, further experiments have to be performed using all-syntrophin isoform knockdown mouse strain to challenge this possibility. Moreover, although western blots and immunostaining experiments strongly suggest that α1-syntrophin expression is almost completely abolished, we cannot exclude the option that a very low amount of α1-syntrophin is still present in the knockdown model, which could contribute to a small portion of the remaining lateral membrane INa.
The main limitations of the present study are primarily related to the methodological approaches. Future experiments could investigate the precise localization of these syntrophin-independent sub-pools of Nav1.5 channels at the lateral membrane using the scanning ion conductance microscopy (SICM) method. In addition, the different techniques used in this study were insufficient to unequivocally demonstrate whether Nav1.5 channels are present or absent inside T-tubules. Furthermore, when interpreting these data, we have to keep in mind that the compartmentalization of sodium channels in cardiomyocytes may be species-dependent. Using a similar approach as in the present study, Verkerk et al. (2007) showed that TTX-resistant voltage-gated sodium channels including Nav1.5 are absent at the lateral membrane of rabbit ventricular cardiomyocytes.
In summary, these results suggest the presence of a sub-pool of Nav1.5 channels at the lateral membrane of murine cardiomyocytes, outside the T-tubules, that is independent of α1-syntrophin and the SIV motif of Nav1.5. Future experiments will help to understand the functional roles of these distinct pools of sodium channels in specific membrane compartments of cardiomyocytes.
Ethics Statement
All experiments involving animals were performed according to the Swiss Federal Animal Protection Law and had been approved by the Cantonal Veterinary Administration, Bern. This investigation conforms to the Guide for the Care and Use of Laboratory Animals, published by the US National Institutes of Health (NIH publication no. 85–23, revised 1996).
Author Contributions
J-SR and HA conceived and designed the experiments. J-SR, HA, ME, LG, and SG collected, analyzed, and interpreted the data. SS and DS produced the alpha1-syntrophin transgenic mouse model. J-SR and HA drafted the manuscript and revised it critically for important intellectual content.
Funding
This research was leading to these study results received funding from the European Community’s Seventh Framework Program FP7/2007–2013 under grant agreement No. HEALTH-F2-2009-241526, from EUTrigTreat, and the Swiss National Science Foundation (310030_165741).
Conflict of Interest Statement
SS and DS were employed by the company PolyGene AG, Rümlang, Switzerland.
The remaining authors declare that the research was conducted in the absence of any commercial or financial relationships that could be construed as a potential conflict of interest.
Acknowledgments
We thank Dr. Pascal Peschard, Dr. Lijo Ozhathil, and Sarah Vermij for their useful comments on previous versions of this manuscript. We acknowledge the Microscopy Imaging Center of the University of Bern (MIC) for their contributions to this study.
Supplementary Material
The Supplementary Material for this article can be found online at: https://www.frontiersin.org/articles/10.3389/fphys.2019.00834/full#supplementary-material
FIGURE S1 | Generation of the Snta1-flox mouse model. (A) The diagram shows homologous recombination of the Snta1 locus (Snta1-WT) with the targeting vector pSnta1-TV and the resulting targeted Snta1 alleles. Two loxP sites are inserted into the Snta1 locus, flanking a region of 0.7 kb that contains part of exon 1 of Snta1. One loxP site is inserted into the 5′ untranslated region (5′ UTR) of exon 1, whereas the second site is located in intron 1. Directly upstream of the 3′ loxP site, a neomycin resistance cassette (neo) is inserted, which is flanked by FRT-sites, the recognition sites for the Flp-recombinase (Snta1-neoflox allele). Upon breeding to Flp-deleter mice, the neomycin resistance cassette is deleted, and only a single FRT site is remaining in the Snta1-flox allele. The short (SA) and long homology regions (LA) are indicated as gray boxes. Positions of primers and sizes of products for genotyping PCR, as well as restriction sites and the probes for Southern blot analyses, are indicated. (B) Representative result of Southern blot analysis with genomic DNA from Snta1 wt/wt and Snta1 neoflox/wt (1C9) ES cells cut with PstI and probed using either a sequence upstream of exon 1 or downstream of exon 2 of Snta1. This resulted in a 14.3 kb signal for the wild-type allele with both probes and either a 4.7 kb signal for the 5′ probe and a 9.0 kb signal for the 3′ probe in the Snta1-neoflox allele. (C) PCR analysis of all three genotypes using the primer depicted in A. The wild-type (WT) allele resulted in a PCR product of 274 bp, whereas a 443 bp fragment was generated for the Snta1-flox allele (Flox).
FIGURE S2 | Whole-cell biophysical properties of wild-type and Snta1-flox cardiomyocytes. (A,B) Activation (A) and steady-state inactivation curves (B) calculated from whole-cell recordings of sodium currents show no alteration of the biophysical properties between adult ventricular cardiomyocytes from wild-type (Snta1 fl/fl-) and α1-syntrophin cardiac specific knockdown cardiomyocytes (Snta1 fl/fl+). The number of cells is indicated in parentheses.
FIGURE S3 | Cell-attached biophysical properties of wild-type and Snta1-flox cardiomyocytes. (A,B) Activation (A) and steady-state inactivation curves (B) calculated from cell-attached recordings of sodium currents show no alteration of the biophysical properties between adult ventricular cardiomyocytes from wild-type (Snta1 fl/fl-) and α1-syntrophin cardiac specific knockdown cardiomyocytes (Snta1 fl/fl+). The number of cells is indicated in parentheses.
FIGURE S4 | Lateral sodium current measurements in wild-type and ΔSIV cardiomyocytes. (A) representative cell-attached recordings of sodium currents from the lateral membrane of wild-type and ΔSIV cardiomyocytes. (B) Current-voltage (I–V) curve showing a significant decrease in the sodium current recorded in ΔSIV cardiomyocytes (∙) compared to the control (∘) (∗p < 0.05). The number of cells is indicated in parentheses.
FIGURE S5 | Cell-attached biophysical properties of wild-type and ΔSIV cardiomyocytes. (A,B) Activation (A) and steady-state inactivation curves (B) calculated from cell-attached recordings of sodium currents show no alteration of the biophysical properties between adult ventricular cardiomyocytes from wild-type and ΔSIV cardiomyocytes. The number of cells is indicated in parentheses.
FIGURE S6 | Pharmacological block of Nav1.4 current in HEK-293 cells. (A) Representative cell-attached Nav1.4 currents recorded in transiently transfected HEK-293 cells. (B) INa reduction mediated by tetrodotoxin (TTX) after 3 min of application (∗∗p < 0.01). The number of cells is indicated in parentheses.
References
Abriel, H., Rougier, J. S., and Jalife, J. (2015). Ion channel macromolecular complexes in cardiomyocytes: roles in sudden cardiac death. Circ. Res. 116, 1971–1988. doi: 10.1161/CIRCRESAHA.116.305017
Albesa, M., Ogrodnik, J., Rougier, J. S., and Abriel, H. (2011). Regulation of the cardiac sodium channel Nav1.5 by utrophin in dystrophin-deficient mice. Cardiovasc. Res. 89, 320–328. doi: 10.1093/cvr/cvq326
Baba, S., Dun, W., Cabo, C., and Boyden, P. A. (2005). Remodeling in cells from different regions of the reentrant circuit during ventricular tachycardia. Circulation 112, 2386–2396.
Brette, F., Komukai, K., and Orchard, C. H. (2002). Validation of formamide as a detubulation agent in isolated rat cardiac cells. Am. J. Physiol. Heart Circ. Physiol. 283, H1720–H1728.
Brette, F., and Orchard, C. H. (2006). No apparent requirement for neuronal sodium channels in excitation-contraction coupling in rat ventricular myocytes. Circ. Res. 98, 667–674.
Cheng, J., Van Norstrand, D. W., Medeiros-Domingo, A., Valdivia, C., Tan, B. H., Ye, B., et al. (2009). Alpha1-syntrophin mutations identified in sudden infant death syndrome cause an increase in late cardiac sodium current. Circ. Arrhythm. Electrophysiol. 2, 667–676. doi: 10.1161/CIRCEP.109.891440
Chevalier, M., Vermij, S. H., Wyler, K., Gillet, L., Keller, I., and Abriel, H. (2018). Transcriptomic analyses of murine ventricular cardiomyocytes. Sci. Data 5:180170. doi: 10.1038/sdata.2018.170
Favreau, P., Benoit, E., Hocking, H. G., Carlier, L., D’ Hoedt, D., Leipold, E., et al. (2012). A novel micro-conopeptide, CnIIIC, exerts potent and preferential inhibition of NaV1.2/1.4 channels and blocks neuronal nicotinic acetylcholine receptors. Br. J. Pharmacol. 166, 1654–1668. doi: 10.1111/j.1476-5381.2012.01837.x
Gavillet, B., Rougier, J. S., Domenighetti, A. A., Behar, R., Boixel, C., Ruchat, P., et al. (2006). Cardiac sodium channel Nav1.5 is regulated by a multiprotein complex composed of syntrophins and dystrophin. Circ. Res. 99, 407–414.
Gillet, L., Rougier, J. S., Shy, D., Sonntag, S., Mougenot, N., Essers, M., et al. (2015). Cardiac-specific ablation of synapse-associated protein SAP97 in mice decreases potassium currents but not sodium current. Heart Rhythm. 12, 181–192. doi: 10.1016/j.hrthm.2014.09.057
Iwata, Y., Shigekawa, M., and Wakabayashi, S. (2005). Cardiac syntrophin isoforms: species-dependent expression, association with dystrophin complex and subcellular localization. Mol. Cell Biochem. 268, 59–66.
Kaprielian, R. R., and Severs, N. J. (2000). Dystrophin and the cardiomyocyte membrane cytoskeleton in the healthy and failing heart. Heart Fail. Rev. 5, 221–238.
Kawai, M., Hussain, M., and Orchard, C. H. (1999). Excitation-contraction coupling in rat ventricular myocytes after formamide-induced detubulation. Am. J. Physiol. 277, H603–H609. doi: 10.1152/ajpheart.1999.277.2.H603
Lab, M. J., Bhargava, A., Wright, P. T., and Gorelik, J. (2013). The scanning ion conductance microscope for cellular physiology. Am. J. Physiol. Heart Circ. Physiol. 304, H1–H11. doi: 10.1152/ajpheart.00499.2012
Makara, M. A., Curran, J., Little, S. C., Musa, H., Polina, I., Smith, S. A., et al. (2014). Ankyrin-G coordinates intercalated disc signaling platform to regulate cardiac excitability in vivo. Circ. Res. 115, 929–938. doi: 10.1161/CIRCRESAHA.115.305154
Matamoros, M., Perez-Hernandez, M., Guerrero-Serna, G., Amoros, I., Barana, A., Nunez, M., et al. (2016). Nav1.5 N-terminal domain binding to alpha1-syntrophin increases membrane density of human Kir2.1, Kir2.2 and Nav1.5 channels. Cardiovasc. Res. 110, 279–290. doi: 10.1093/cvr/cvw009
Milstein, M. L., Musa, H., Balbuena, D. P., Anumonwo, J. M., Auerbach, D. S., Furspan, P. B., et al. (2012). Dynamic reciprocity of sodium and potassium channel expression in a macromolecular complex controls cardiac excitability and arrhythmia. Proc. Natl. Acad. Sci. U.S.A. 109, E2134–E2143. doi: 10.1073/pnas.1109370109
Noorman, M., Van Der Heyden, M. A., Van Veen, T. A., Cox, M. G., Hauer, R. N., De Bakker, J. M., et al. (2009). Cardiac cell-cell junctions in health and disease: electrical versus mechanical coupling. J. Mol. Cell Cardiol. 47, 23–31. doi: 10.1016/j.yjmcc.2009.03.016
Pasek, M., Brette, F., Nelson, A., Pearce, C., Qaiser, A., Christe, G., et al. (2008). Quantification of t-tubule area and protein distribution in rat cardiac ventricular myocytes. Prog. Biophys. Mol. Biol. 96, 244–257.
Petitprez, S., Zmoos, A. F., Ogrodnik, J., Balse, E., Raad, N., El-Haou, S., et al. (2011). SAP97 and dystrophin macromolecular complexes determine two pools of cardiac sodium channels Nav1.5 in cardiomyocytes. Circ. Res. 108, 294–304. doi: 10.1161/CIRCRESAHA.110.228312
Shy, D., Gillet, L., Ogrodnik, J., Albesa, M., Verkerk, A. O., Wolswinkel, R., et al. (2014). PDZ domain-binding motif regulates cardiomyocyte compartment-specific NaV1.5 channel expression and function. Circulation 130, 147–160. doi: 10.1161/CIRCULATIONAHA.113.007852
Stoetzer, C., Doll, T., Stueber, T., Herzog, C., Echtermeyer, F., Greulich, F., et al. (2016). Tetrodotoxin-sensitive alpha-subunits of voltage-gated sodium channels are relevant for inhibition of cardiac sodium currents by local anesthetics. Naunyn Schmiedebergs Arch. Pharmacol. 389, 625–636. doi: 10.1007/s00210-016-1231-9
Stroud, D. M., Yang, T., Bersell, K., Kryshtal, D. O., Nagao, S., Shaffer, C., et al. (2016). Contrasting Nav1.8 Activity in Scn10a-/- ventricular myocytes and the intact heart. J. Am. Heart Assoc. 5:e002946.
Ueda, K., Valdivia, C., Medeiros-Domingo, A., Tester, D. J., Vatta, M., Farrugia, G., et al. (2008). Syntrophin mutation associated with long QT syndrome through activation of the nNOS-SCN5A macromolecular complex. Proc. Natl. Acad. Sci. U.S.A. 105, 9355–9360. doi: 10.1073/pnas.0801294105
Verkerk, A. O., Van Ginneken, A. C., Van Veen, T. A., and Tan, H. L. (2007). Effects of heart failure on brain-type Na+ channels in rabbit ventricular myocytes. Europace 9, 571–577.
Vermij, S. H., Abriel, H., and Van Veen, T. A. (2017). Refining the molecular organization of the cardiac intercalated disc. Cardiovasc. Res. 113, 259–275. doi: 10.1093/cvr/cvw259
Westenbroek, R. E., Bischoff, S., Fu, Y., Maier, S. K., Catterall, W. A., and Scheuer, T. (2013). Localization of sodium channel subtypes in mouse ventricular myocytes using quantitative immunocytochemistry. J. Mol. Cell Cardiol. 64, 69–78. doi: 10.1016/j.yjmcc.2013.08.004
Yang, B., Jung, D., Rafael, J. A., Chamberlain, J. S., and Campbell, K. P. (1995). Identification of alpha-syntrophin binding to syntrophin triplet, dystrophin, and utrophin. J. Biol. Chem. 270, 4975–4978.
Yang, T., Atack, T. C., Stroud, D. M., Zhang, W., Hall, L., and Roden, D. M. (2012). Blocking SCN10A channels in heart reduces late sodium current and is antiarrhythmic. Circ. Res. 111, 322–332. doi: 10.1161/CIRCRESAHA.112.265173
Keywords: voltage-gated sodium channel, lateral membrane of cardiomyocytes, α1-syntrophin, dystrophin, electrophysiology
Citation: Rougier J-S, Essers MC, Gillet L, Guichard S, Sonntag S, Shmerling D and Abriel H (2019) A Distinct Pool of Nav1.5 Channels at the Lateral Membrane of Murine Ventricular Cardiomyocytes. Front. Physiol. 10:834. doi: 10.3389/fphys.2019.00834
Received: 08 February 2019; Accepted: 17 June 2019;
Published: 03 July 2019.
Edited by:
Jichao Zhao, The University of Auckland, New ZealandReviewed by:
Andrew F. James, University of Bristol, United KingdomMathilde R. Rivaud, Netherlands Heart Institute, Netherlands
Karlheinz Hilber, Medical University of Vienna, Austria
Hannes Todt, Medical University of Vienna, Austria
Copyright © 2019 Rougier, Essers, Gillet, Guichard, Sonntag, Shmerling and Abriel. This is an open-access article distributed under the terms of the Creative Commons Attribution License (CC BY). The use, distribution or reproduction in other forums is permitted, provided the original author(s) and the copyright owner(s) are credited and that the original publication in this journal is cited, in accordance with accepted academic practice. No use, distribution or reproduction is permitted which does not comply with these terms.
*Correspondence: Jean-Sébastien Rougier, amVhbi1zZWJhc3RpZW4ucm91Z2llckBpYm1tLnVuaWJlLmNo