 Eva Maria Støa
 Jan Helgerud
 Bent R. Rønnestad
 Joar Hansen
 Stian Ellefsen
 Øyvind Støren
- 1Department of Sports, Physical Education and Outdoor Studies, University of South-Eastern Norway, Bø, Norway
- 2Department of Circulation and Medical Imaging, Norwegian University of Science and Technology, Trondheim, Norway
- 3Myworkout, Medical Rehabilitation Clinic, Trondheim, Norway
- 4Section for Health and Exercise Physiology, Institute of Public Health and Sport Sciences, Inland Norway University of Applied Sciences, Lillehammer, Norway
Background: The primary aim was to examine the relationship between lactate threshold (LT) expressed as percentage of maximal oxygen uptake (VO2max) and running velocity at LT (LTV). A secondary aim was to investigate to what extent VO2max, oxygen cost of running (CR), and maximal aerobic speed (MAS) determined LTV. A third aim was to investigate potential differences in LT and LTV between elite, national and recreational runners, as well as possible gender differences regarding VO2max, CR, LT, and LTV.
Methods: Seventy-five competitive runners (37 males and 38 females) with an average VO2max of 63.0 ± 9.3 mL⋅kg–1⋅min–1, and an average LTV of 13.6 ± 2.3 km⋅h–1 were tested for VO2max, LT, LTV, MAS, and CR.
Results: Lactate threshold did not correlate with LTV. With an r – value of 0.95 (p < 0.001) and a standard error of estimate of 4.0%, the product of MAS and individual LT determined 90% of LTV, outside a range of ±0.27 km⋅h–1. LTV increased with higher performance level. However, LT did not differ between elite, national and recreational runners. Female runners had 2.5% higher LT, 8% lower LTV, and 21% lower VO2max, but 9% better CR than male runners.
Conclusion: Lactate threshold did not correlate with LTV. The product of MAS and LT correlated strongly with LTV. There were no differences between elite, national and recreational runners regarding LT, but female runners had higher LT than the male runners. Female runners at the same relative performance level had lower LTV and VO2max, but better CR than male runners.
Introduction
Long-distance running performance is mainly determined by maximal oxygen uptake (VO2max), fractional utilization of VO2max or lactate threshold (LT), and oxygen cost of running (CR) (Conley and Krahenbuhl, 1980; Pate and Kriska, 1984; Rabadán et al., 2011). LT has been defined as the highest work intensity where there is a balance between lactate production and removal (Brooks, 1986), i.e., the highest intensity point before the lactate concentration starts to increase during continuous exercise (Davis, 1985), called the maximal lactate steady state (MLSS). While the MLSS is an accurate method to determine LT, it is time consuming, and therefore a number of short-stage methods are more commonly used, such as a warm up value + 1.5 mmol⋅L–1 (Støren et al., 2014). LT may be expressed in absolute values, for example running velocity (LTV), or in relative values as a percentage of VO2max (LT). In trained endurance athletes, LT usually represents an intensity between 75 and 90% of VO2max (Joyner and Coyle, 2008).
In cycling, elite athletes have shown somewhat higher LT than regional athletes (Støren et al., 2014), which is in line with the expectations that well-trained endurance athletes in general have a higher LT than moderately trained athletes (Joyner and Coyle, 2008). However, McLaughlin et al. (2010) found nearly similar LT among runners at different performance levels.
In running, the most common way to express workload at LT seems to be as LTV (Yoshida et al., 1987). LTV has been found to primarily depend on VO2max and work economy (C) in well-trained and elite endurance athletes (Yoshida et al., 1987; Bishop et al., 2000; Nicholson and Sleivert, 2001; Støren et al., 2008, 2013; McLaughlin et al., 2010). In previous studies, VO2max divided by C has been defined as maximal aerobic speed (MAS) (Støren et al., 2008, 2012, 2014; Helgerud et al., 2010; Sunde et al., 2010, 2019; Bratland-Sanda et al., 2020; Johansen et al., 2020), and found to be a main determinant of aerobic endurance performance and LTV (Støren et al., 2012, 2014; Sunde et al., 2019; Bratland-Sanda et al., 2020; Johansen et al., 2020). In accordance with the importance of MAS on LTV, elite long-distance runners have higher LTV than national runners (Yoshida et al., 1987; Nicholson and Sleivert, 2001). Among runners with similar VO2max, a higher LTV is typically due to a better CR (Laye et al., 2015).
Several training interventions that have reported improved endurance running performance, also found improved LTV (Ferrauti et al., 2010; Enoksen et al., 2011; Hottenrott et al., 2012). These improvements should therefore logically relate to either an improvement in VO2max, in C or in LT. However, studies reporting improved LT after training interventions among already well-trained endurance athletes are lacking. On the contrary, several studies have found no adaptations in LT after training interventions (Bangsbo, 1994; Helgerud et al., 2007; Støren et al., 2008; Sunde et al., 2010; Rønnestad et al., 2015). This implies that improvements in LTV are most probably due to either an improvement in VO2max, an improvement in C, or both.
Studies assessing gender differences at the same relative performance level have found approximately 10–15% higher VO2max, and 10–15% higher LTV in men than in women (Pollock, 1977; Pate et al., 1987; Helgerud, 1994; McLaughlin et al., 2010). Studies comparing CR among men and women have found both better (Daniels and Daniels, 1992), similar (Bunc and Heller, 1989) and worse (Helgerud et al., 2010) CR in men compared to women. In a study by Helgerud et al. (2010), female runners were found to have 10% better CR than male runners, when CR was expressed as ml⋅kg–0.75⋅m–1, which contradicts the findings of Daniels and Daniels (1992) and Bunc and Heller (1989). Few studies have reported gender differences in LT when expressed in relation to running performance, but Maldonado-Martin et al. (2004) found better LT in women marathon runners than in their male counterparts. It would thus be of interest to assess possible gender differences in LT or in the impact of LTV determining variables.
In previous studies, the relative importance of LTV on endurance performance have only been reported in relatively small cohorts. Studies on runners, such as Støren et al. (2008); Enoksen et al. (2011), Hottenrott et al. (2012) have not included more than 34 subjects at the most. In Støren et al. (2014), a large number of cyclists (n = 108) participated, enabling the calculation of a new model for predicting power output at LT (LTW) by using the following equation (Equation 1), where LTW is the power output at LT, LT%VO2max is LT%, and CC is cycling economy (oxygen cost of cycling).
The model correlated nearly perfect with measured LTW (r = 0.98, p < 0.0001, SEE = 2.8%). This model for predicting LTV is the same model as used for predicting performance in running distance races by McLaughlin et al. (2010). In short, the equation from Støren et al. (2014) is based on the product of LT and MAS. Given the proposition in Støren et al. (2014) that LT does not change in already well trained athletes, the first rationale to apply this equation also in runners is that it is a time-saving method to assess LTV. As proposed in Støren et al. (2014), a full LT profile test is then only needed once. For all subsequent tests, only MAS is needed. Further, if this equation applies also in running, this could be an argument to focus more on MAS, i.e., VO2max and CR, and less on LT.
From both a practical and a theoretical point of view, it is of interest to identify relationships between LTV and other physiological variables shown to affect endurance running performance. The aims of the present study were thus to investigate:
1. The impact of LT on LTV in running, as well as the impact of VO2max and CR on LTV.
2. The fit of the equation for cyclists used in Støren et al. (2014) applied on runners.
3. Potential differences in LT and LTV between elite, national and recreational runners.
4. Potential gender differences in point 1–3.
The hypothesis were that:
1. VO2max and CR would have a strong impact on LTV, while LT would not.
2. The equation for cyclists used in Støren et al. (2014) would fit also for runners.
3. Both LT and LTV would be higher with higher performance level.
4. Male runners would have higher VO2max, CR, and LTV than female runners, but similar LT.
Materials and Methods
Subjects
Seventy-five (37 male and 38 female) long-distance runners from Norway, with performance levels ranging from elite to regional, participated in the present study. Subject characteristics are presented in Tables 1, 2. Due to the large number of runners, we were not able to arrange a test-run over, e.g., 5000 m or 3000 m for all the runners. However, by collection of race results the same year as the physiological tests were performed, the range of performance was found to be from 8.05 to 13.30 min in 3000 m.
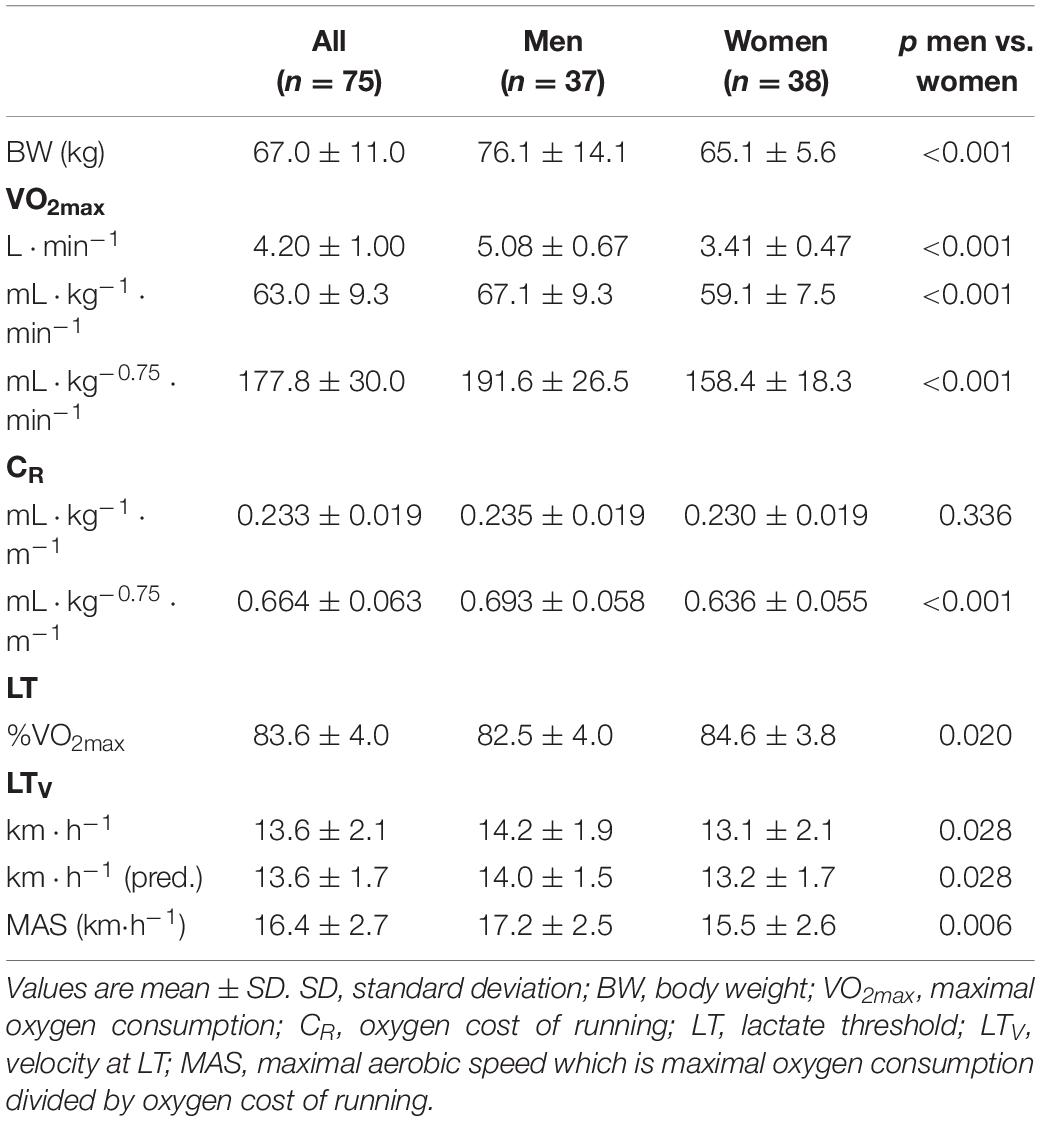
Table 1. Characteristics of runners by gender.
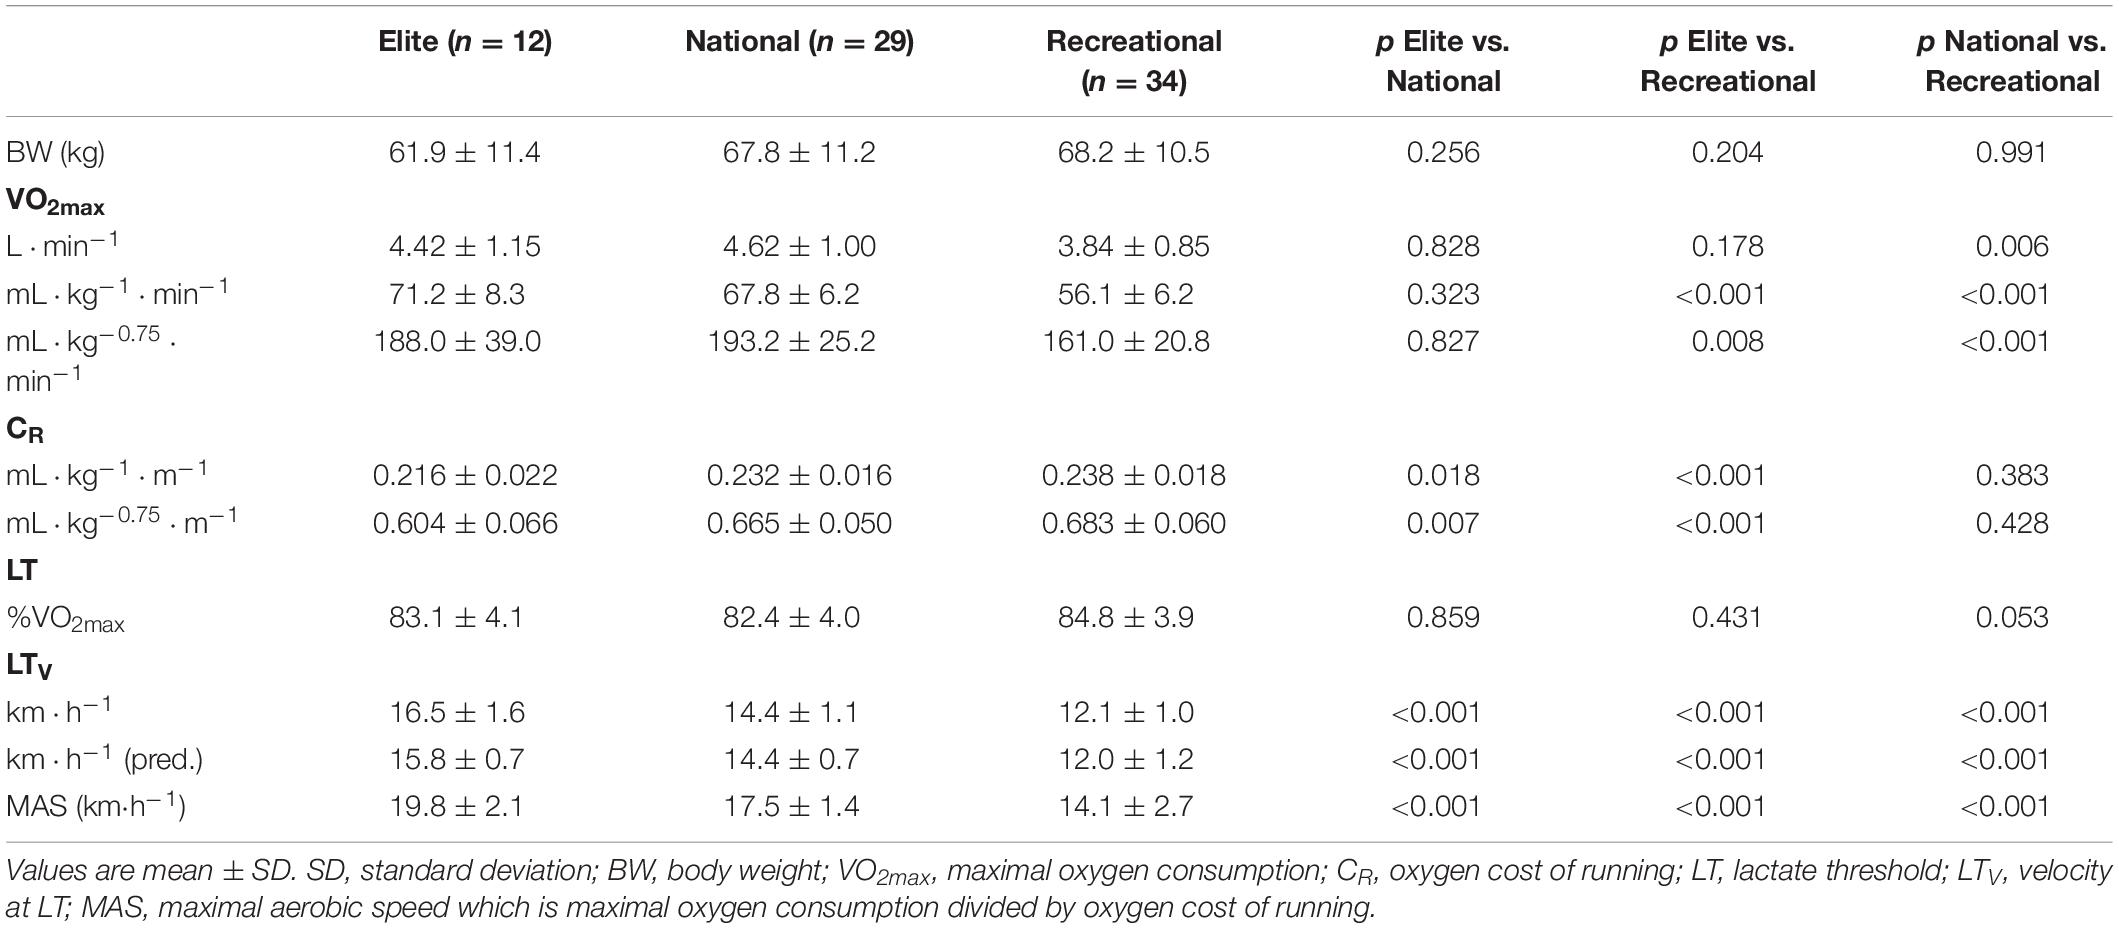
Table 2. Characteristics of runners by competitive level.
All subjects gave their written consent before participating, according to the regional ethical committee of the South-East of Norway. The study was approved by the institutional review board at USN.
Design
The study was a cross-sectional multi-center study, aiming to identify factors influencing running velocity at lactate threshold in male and female runners at different levels of performance.
Methodology
The subjects were tested in three different laboratories, at the University of South-Eastern Norway (USN), at Inland Norway University of Applied Sciences (INN), and at the Norwegian School of Sport Sciences (NSSS).
Test protocols were identical in all three laboratories. The same type of treadmill (Woodway PPS 55 Sport, Waukesha, Germany) and heart rate (HR) equipment (Polar Electro, Kempele, Finland) were used at all three locations. For lactate measurements, Arkray Lactate Pro LT-1710 analyzer (Arkray Inc., Kyoto, Japan) was used at USN and INN, while YSI 1500 Sports Lactate analyzer (Yellow Springs, Ohio, United States) was used at NSSS. Two different types of metabolic test systems were used; at USN, Sensor Medics Vmax Spectra (Sensor Medics 229, Yorba Linda, CA, United States), and at INN and NSSS, Oxycon Pro (Erich Jaeger, Höchberg, Germany). The different systems were validated against each other for the range of measures that included all of the participants.
In the treadmill tests, the subjects started at a velocity of at least 3 km⋅h–1 below their expected LTV (representing approximately 50% of VO2max). To account for this expectancy, the first velocity was adjusted if it did not represent 65–75% of maximal heart rate (HRmax). All subjects knew their HRmax before the tests. Every 5 min, the running velocity increased by 1–1.5 km⋅h–1, until the test terminated just above the subjects’ LT.
The 5 min stages have in previous studies (Helgerud, 1994; Helgerud et al., 2010; Støren et al., 2008, 2013, 2014; Sunde et al., 2010) proved sufficient to reach steady state HR and VO2 in each step. To increase speed by 1–1.5 km⋅h–1 for each step, has in previous studies (Helgerud, 1994; Helgerud et al., 2010; Støren et al., 2008) proven adequate to reach LT in four to five steps.
Lactate threshold was defined as the warm up [La–]b value (i.e., measured after the lowest running velocity) + 2.3 mmol⋅L–1, using the Arkray Lactate Pro LT-1710 analyzer (Arkray Inc., Kyoto, Japan). This is in accordance with the method of Helgerud (1994) and Helgerud et al. (2007), using the YSI 1500 Sports Lactate analyzer (Yellow Springs, Ohio, United States), with LT defined as the warm up [La–]b value + 1.5 mmol⋅L–1. The difference in [La–]b values between the two analyzers is constant, and due to the difference in [La–]b values between hemolyzed blood (Arkray) and whole blood (YSI). Medbø et al. (2000) have reported the YSI to measure 67% of the lactate Pro values, meaning that 2.3 mmol⋅L–1 with lactate Pro equals 1.5 mmol⋅L–1 with YSI. Medbø et al. (2000) reported the exact same error of regression measured against enzyme photo fluorometry for the YSI and the lactate Pro. The LT assessment method in the present study was initiated by Helgerud et al. (1990), and has previously been used in several studies (Helgerud, 1994, Helgerud et al., 2010; Sunde et al., 2010; Støren et al., 2013, 2014). This method has also been recommended by Medbø et al. (2000). The main advantage of using individual warm up values plus a constant, compared to a fixed 4 mmol⋅L–1, is that it is less vulnerable to day to day variations in subjects [La–]b (Støren et al., 2014). However, compared to a fixed model of 4 mmol⋅L–1, the model based on a warm-up [La–]b value + 2.3 mmol⋅L–1, may result in lower LT% and LTV (Støren et al., 2014). In Støren et al. (2014) on cycling, the latter model resulted in a LT of 77%, while the use of a fixed 4 mmol⋅L–1 resulted in a LT of 81%.
A VO2max test was performed 5–10 min after the LT assessment. An incremental protocol regarding velocity was used, with an elevation of the treadmill of 3%, 5% or 10%. The subjects started at a velocity representing LTV, rounded to the nearest km⋅h–1. Every 30 or 60 s, the velocity was increased by 0.5–1.0 km⋅h–1. This protocol was used to ensure a test duration between 3 and 8 min, as used in Støren et al. (2008). The test terminated at voluntary fatigue by the runners. A possible flattening of the VO2 curve (<1 ml⋅kg–1⋅min–1 increase in VO2 during the last three subsequent recordings), HR ≥ 95% HRmax, respiratory exchange ratio (RER) ≥ 1.05, and [La–]b ≥ 8.0 mmol⋅L–1 were used as criteria to evaluate if VO2max was obtained.
Oxygen cost of running was calculated at the velocity representing 70% VO2max, as in Støren et al. (2008) and Helgerud et al. (2010). With several submaximal VO2 values at different submaximal running velocities in the LT assessment test, and with the VO2max value from the VO2max test, this was possible. The submaximal running velocities were plotted against the corresponding VO2 values, representing a linear regression with r–values never below 0.99. From this linear regression, 70% of VO2max was plotted, representing a running velocity. By dividing 70% of VO2max by this velocity, e.g., 40 mL⋅kg–1⋅min–1 /200 m⋅min–1, CR was expressed as the oxygen cost of running per meter, e.g., 0.200 ml⋅kg–1⋅m–1.
Maximal aerobic speed was set as the velocity point where the horizontal line representing VO2max meets the extrapolated linear regression representing the submaximal VO2 measured in the LT assessment. The linearity from this regression in previous studies (Støren et al., 2008, 2014; Helgerud et al., 2010; Sunde et al., 2010) has been reported to be very good (r > 0.99, p < 0.001). This method to define MAS implies that MAS equals VO2max /CR. Since VO2max may be expressed as mL⋅kg–1⋅min–1, and CR as mL⋅kg–1⋅min–1, VO2max /CR is expressed as m⋅min–1, i.e., a velocity.
Maximal oxygen uptake values were expressed in both mL⋅kg–1⋅min–1, mL⋅kg–0.75⋅min–1, and in L⋅min–1 as proposed by Bergh et al. (1991). The importance of allometric scaling in running was shown by Helgerud (1994).
A mathematical model for predicting LTV (Equation 2), based on the equation in Støren et al. (2014) was used in the present study:
LTV is the running velocity at LT, LT% is LT in percent of VO2max, and CR is the oxygen cost of running.
Statistical Analysis
Data were tested for normality by use of QQ-plots and the Kolmogorov Smirnov test, and found to represent a normal distribution for VO2max, CR and LT. All table values were therefore expressed descriptively as mean ± standard deviation (SD), or the correlation factor r with confidence intervals. The Pearson Bivariate two-tailed correlation test was used to determine correlations between variables. The correlation coefficient definitions by Hopkins et al. (2009) where r values of 0.3–0.5 = moderate, 0.5–0.7 = large, 0.7–0.9 = very large, 0.9 = nearly perfect, and 1.0 = perfect, were used to describe correlations. A General Linear Model (GLM) with Tukey post hoc test was performed to detect possible differences between the three groups divided by competition level. Statistical analyses were performed using the software program SPSS, version 19.0 (Statistical Package for Social Science, Chicago, IL, United States). A p-value < 0.05 was accepted as statistically significant for all tests, including between group differences and correlations.
Results
Characteristics of runners by competitive level are shown in Table 2. Scaled for body mass to the power of 0.75, the elite runners had 17% higher VO2max than the recreational runners (p = 0.01), but there was no difference between the elite and the national runners. However, a GLM showed increasing VO2max with higher performance level overall (p < 0.001). The elite runners had 10% better CR than the national runners (p < 0.001). There was no difference in CR between national and recreational runners, but the GLM showed better CR with higher performance level overall (p < 0.001). There were no differences between the three performance levels regarding LT, but the elite runners had 15% better LTV than the national runners (p < 0.001), who in turn had 20% better LTV than the recreational runners (p < 0.001). Also, GLM showed increasing LTV with higher performance level overall (p < 0.001). MAS increased with increasing performance level (p < 0.001), where elite runners had 13% higher MAS than national runners (p < 0.001) who in turn had 24% higher MAS than recreational runners (p < 0.001).
Characteristics of runners by gender are shown in Table 1. Expressed as mL⋅kg–0.75⋅min–1, the male runners had 21% higher VO2max (p < 0.001), but 9% poorer CR than the female runners (p < 0.001). The female runners had 2.5 percentage point higher LT (p = 0.020), but 8% lower LTV than the male runners (p = 0.028).
Regardless of competitive level or gender, the mathematical model (Equation 2) showed that LTV was almost identical to the measured LTV (13.6 ± 2.1 vs. 13.6 ± 1.7 km⋅h–1, p = 0.78).
Correlations are presented in Table 3. LT did not correlate with LTV (r = −0.15, p = 0.187) as presented in Figure 1. MAS, calculated by VO2max/CR, correlated nearly perfect (r = 0.92 p < 0.001) with LTV (Figure 2). The product of LT and MAS (Equation 2), correlated nearly perfect (r = 0.95 p < 0.001) with LTV (Figure 3). Based on the r2 of 0.90 between calculated and measured LTV, and the r2 of 0.85 between MAS and measured LTV, the relative importance of LT on LTV was 0.90 – 0.85 = 5%.
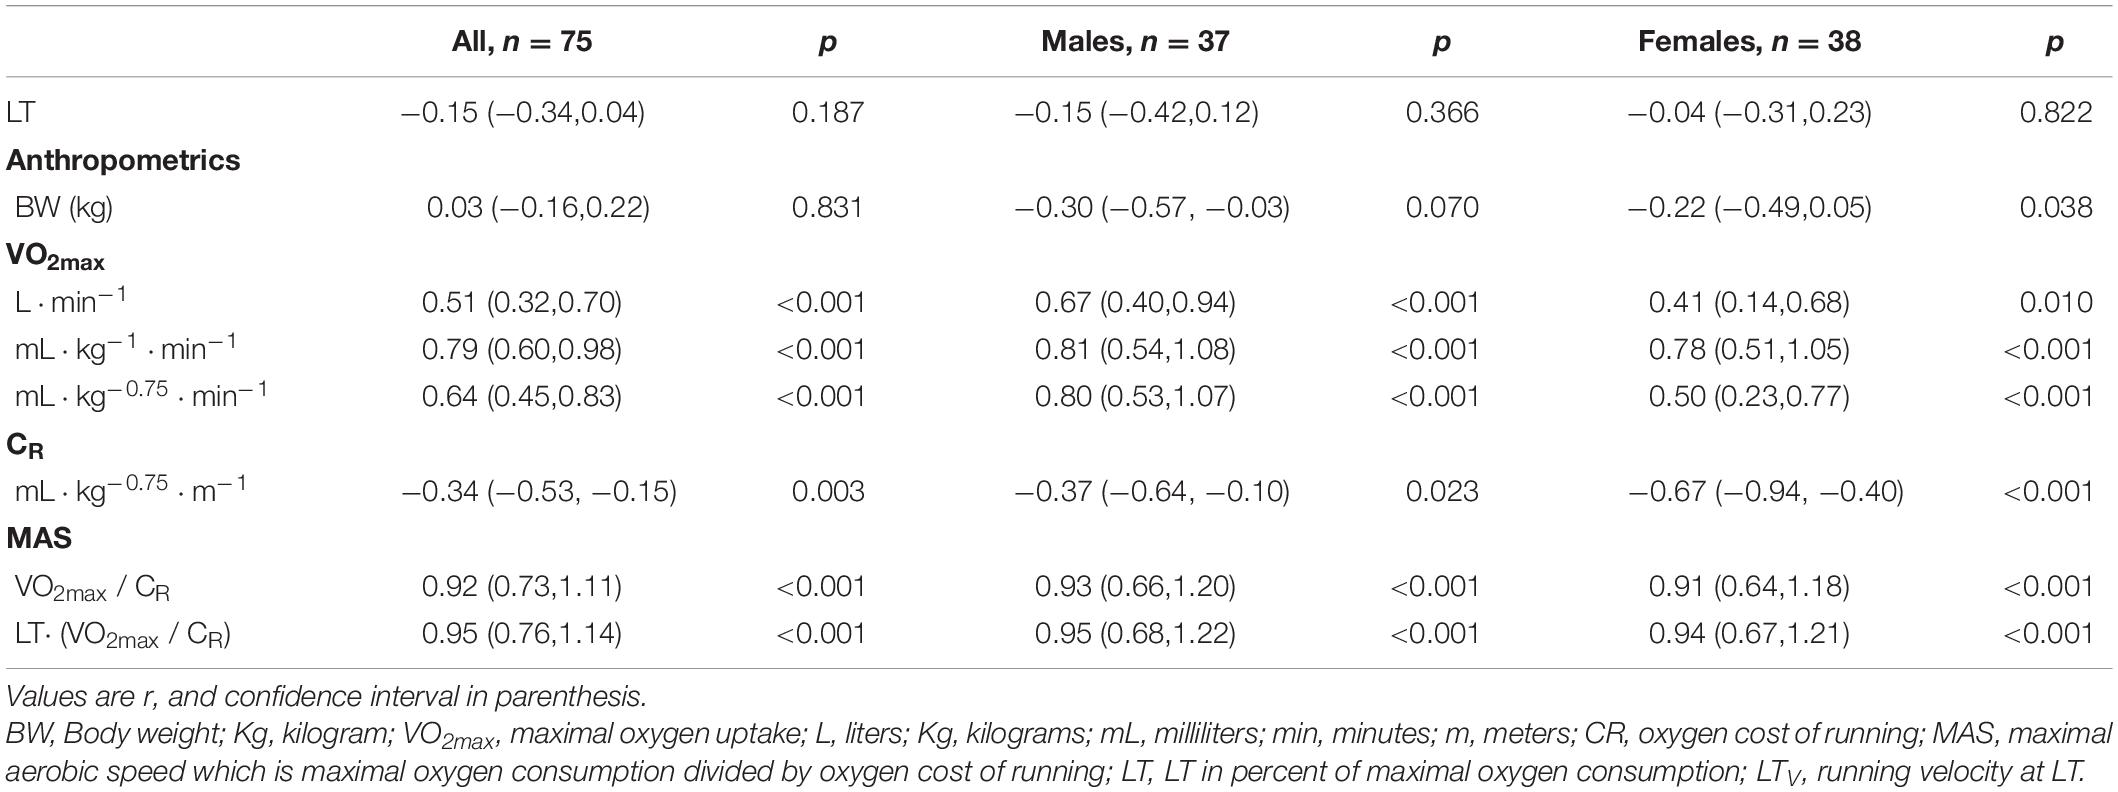
Table 3. Relationship between different variables and running velocity at the lactate threshold.
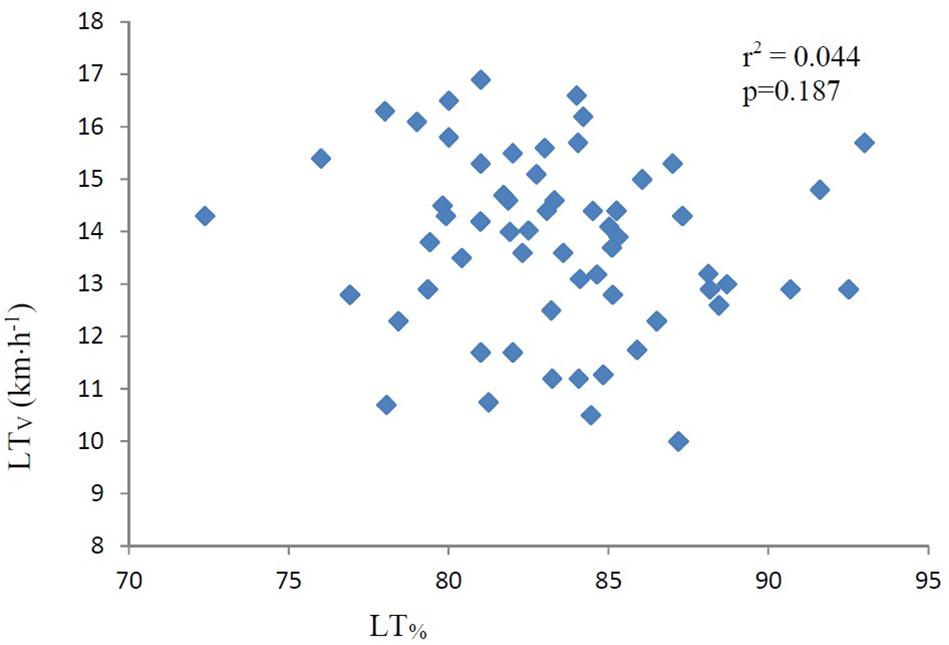
Figure 1. LT vs. LTV (km⋅h–1). The figure also displays the determining r (r2). LT, lactate threshold in percent of maximal oxygen consumption (VO2max). LTV, running velocity at lactate threshold. km⋅h–1, kilometers per hour. The correlation is not significant (p = 0.187).
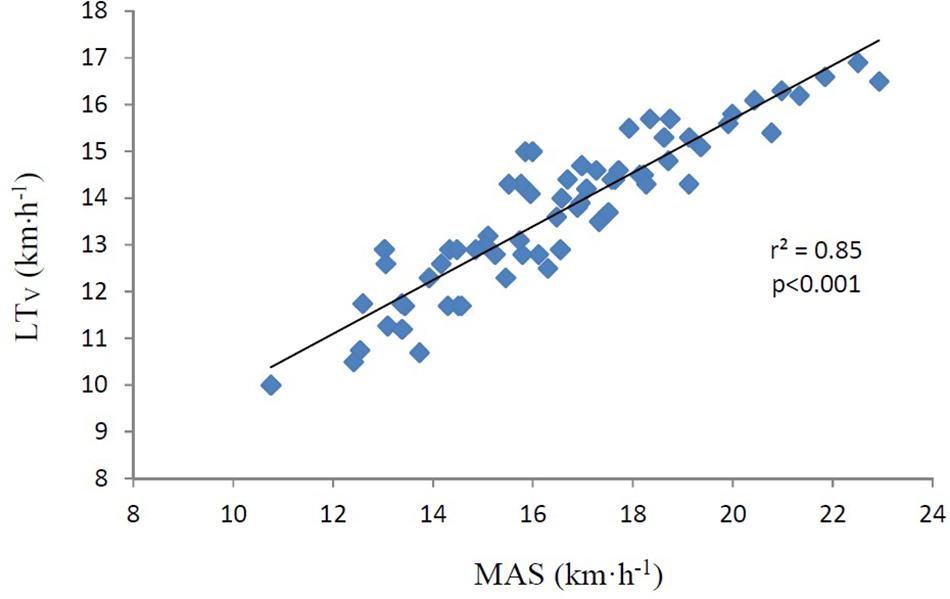
Figure 2. MAS (km⋅h–1) vs. LTV (km⋅h–1). The figure also displays the determining r (r2). MAS, maximal aerobic speed, which is maximal oxygen consumption divided by oxygen cost of running. LTV, running velocity at lactate threshold. km⋅h–1, kilometers per hour. The correlation is significant (p < 0.001).
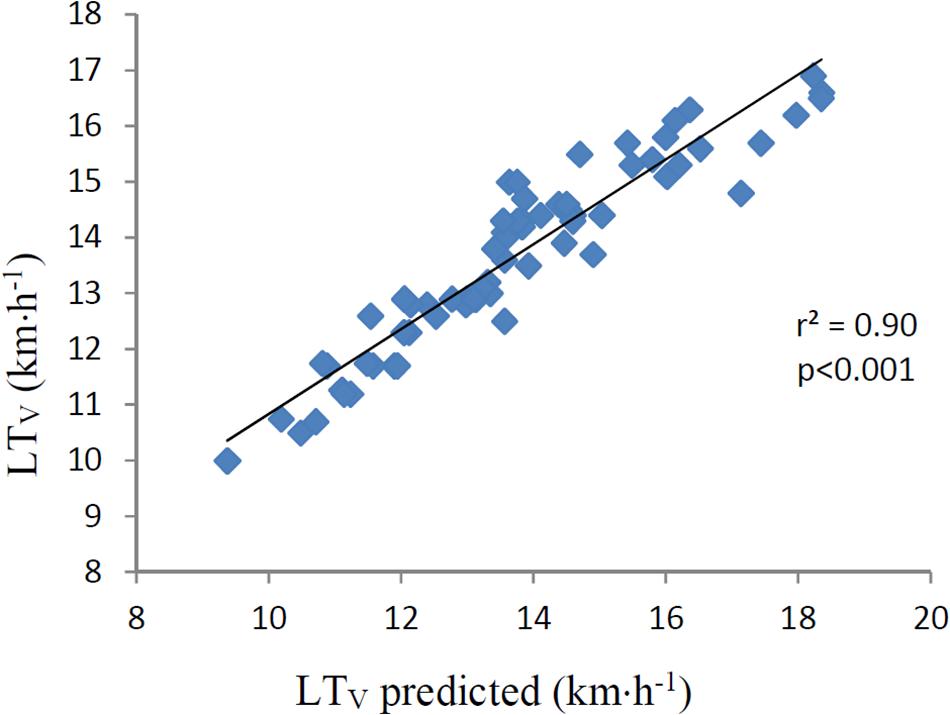
Figure 3. LTV (km⋅h–1) predicted vs. LTV (km⋅h–1). The figure also displays the determining r (r2). Predicted LTV is the product of individual LT% and MAS. LT, lactate threshold in percent of maximal oxygen consumption (VO2max). LTV, running velocity at lactate threshold. km⋅h–1, kilometers per hour. MAS, maximal aerobic speed, which is maximal oxygen consumption divided by oxygen cost of running. The correlation is significant (p < 0.001).
VO2max (r = 0.64, p < 0.001) and CR (r = 0.34, p = 0.003) showed large and moderate correlations, respectively, with LTV.
There were no gender differences in correlations between LTV and the other physiological variables, with one exception. The female runners had a stronger correlation between LTV and CR (r = 0.67, p < 0.001) than the male runners (r = 0.37, p = 0.023).
Discussion
The main findings in the present study were that:
1. LT did not correlate with LTV, neither when the runners were divided by competitive level, by gender, or when all runners were taken together in one group. Both VO2max and CR correlated separately with LTV, but the strongest correlation with LTV was when VO2max was divided by CR, expressing MAS.
2. The product of LT and MAS (Equation 2), expressed an even stronger correlation with LTV, indicating a good fit of the equation presented in Støren et al. (2014).
3. There were no differences between elite, national and recreational runners regarding LT, but LTV, VO2max and CR were found to be higher with higher performance level.
4. Female runners had slightly higher LT than the male runners. Male runners had higher VO2max, but not as good CR as the female runners. The female runners had a stronger correlation between LTV and CR than the male runners.
LT as a Percent of VO2max
Lactate threshold was not different between elite, national and recreational runners in the present study. Elite runners would most probably have performed a large amount of endurance training to reach their level. If extensive aerobic endurance training were to improve LT substantially, we would expect elite runners to have a higher LT than less competitive runners. We have found no intervention studies reporting improved LT after endurance training in already well-trained endurance athletes, but several reports of no adaptations in LT (Bangsbo, 1994; Helgerud et al., 2007; Støren et al., 2008; Sunde et al., 2010; Rønnestad et al., 2015).
The finding that LT in the present study did not correlate with LTV, supports the assumption that LT is not a major determinant of aerobic endurance performance. This is in accordance with McLaughlin et al. (2010) who did not find a correlation between LT and endurance race time performance. The present results are not entirely in line with previous results from cycling (Støren et al., 2014), where a correlation between LT and LTV was found. However, LT was in Støren et al. (2014) found to be a poor determinant, -and explained only 15% of the variability in work load at LT.
The 2.5 percentage point better LT in the female runners as opposed to the males in the present study could of course be by coincidence, as it is a minor difference in this context. On the other hand, with as many as 38 females and 37 males, the statistical power is quite strong. Few studies have reported gender differences in LT, but Maldonado-Martin et al. (2004) found women marathon runners to have better LT than their male counterparts, thus in accordance with the present results. It may be argued that two short-stage methods to determine LT, as used in the present study, is not as accurate as the determination of MLSS based on several stages of 20–30 min of continuous work (Faude et al., 2009). However, the two different methods used in the present study are both based on the work by Helgerud et al. (1990) resulting in a warm up value + 1.5 mmol⋅L–1, and found to represent MLSS within the warm up value + 1.3 – 1.7 mmol⋅L–1.
LT Velocity
Running velocity at LT was found to be higher at higher performance levels in the present study. This is in line with several studies on both running and cycling where LTV has been associated with aerobic endurance performance (Yoshida et al., 1987; Helgerud, 1994; Bishop et al., 2000; Nicholson and Sleivert, 2001; Støren et al., 2008, 2013, 2014; McLaughlin et al., 2010). Based on the nearly perfect fit between Equation 2 and LTV, it was natural to assume that the main determinants for LTV was LT, VO2max, and CR. Further, as LT did not correlate with LTV in the present study, it had probably very little impact on the differences in LTV between the different performance levels. This is further supported by the lack of difference in LT between these three groups. VO2max, on the other hand was found to be higher in elite than in recreational runners, and CR was found to be better in elite than in national and recreational runners in the present study. The finding that both VO2max and CR correlated with LTV was therefore not surprising. In both male and females, VO2max determined LTV with approximately 45–50% based on r2 – values, which was about three times the determining factor for CR. Although VO2max and CR correlated separately with LTV, the strongest correlation with LTV was when VO2max was divided by CR, expressing MAS. Based on the r2 –value, MAS predicted LTV by 85%. This is in accordance with McLaughlin et al. (2010), finding that the product of VO2max and CR correlated by r = 0.97 (r2 = 0.94) with endurance race time performance. In the present study, we used the same equation for predicting LTV as in cycling in Støren et al. (2014) (Equation 2). Interestingly, results from the present study expressed the same nearly perfect correlation between predicted and measured LTV as in Støren et al. (2014). With an r –value of 0.95 and a SEE of 4.0%, the product of MAS and individual LT thus explained 90% of LTV, outside a range of ±0.27 km⋅h–1. These results may indicate that the equation for calculating LTW in cycling (Støren et al., 2014) can be used also in running (LTV). This model is time saving. For all LTV tests following the first initial LT assessment, the time spent per test would be less than half of a full incremental LTV test. This model only need capillary blood samples during the first initial LT assessment. From the second test on, no blood samples are needed.
VO2max and Cost of Running
The runners in the present study were representing a heterogeneous group regarding VO2max and CR, with a CV of 17% and 9%, respectively. The material in the present study was thus slightly more heterogeneous than the material in McLaughlin et al. (2010). Based on r2 –values in the present study, VO2max and CR predicted 62% and 12% of LTV, respectively. In a more homogeneous group regarding VO2max, CR would probably be of greater importance, as shown in Conley and Krahenbuhl (1980). However, the female runners in the present study had both a 9% better CR, and a better correlation between LTV and CR than the male runners. This is not in accordance with McLaughlin et al. (2010) reporting better CR among the male runners. Also, Daniels and Daniels (1992) reported male runners to have approximately 7% better CR than female runners. However, neither McLaughlin et al. (2010) or Daniels and Daniels (1992) scaled for body weight raced to the power of 0.75, as in the present study. If not allometrically scaled, CR in the present study was not significantly different between males and females. This underlines the importance of allometric scaling when comparing male and female runners. The determining factor (based on the r2 – values) of CR on LTV in the present study, was more than three times higher for the female than the male runners. The latter cannot be explained by a smaller CV in VO2max in the female runners. The better CR in the female runners was in accordance with the results from Helgerud et al. (2010). As only six female runners participated in the study by Helgerud et al. (2010), the generalizing value is apparently low, although strengthened by the similar results from the present study. Why female runners may have a better CR than male runners of the same relative competitive level is a question with no apparent answer.
Practical Implications
From the results of the present study, we suggest that the same equation previously used in cycling also could be used in running. The present results further imply that training to improve LTv should be focused toward increasing VO2max and or CR. In order to accomplish such improvements, we propose high intensity aerobic interval training (Østerås et al., 2002; Helgerud et al., 2007; Støren et al., 2012) in order to improve VO2max, and maximal strength training (Østerås et al., 2002; Støren et al., 2008; Sunde et al., 2010) to improve CR. As LTV seemed to be dependent on MAS and not LT%, we propose the testing of MAS rather than LT in order to evaluate training achievements in competitive runners.
Conclusion
Lactate threshold was not related to LTV or performance level in the present study. As hypothesized, VO2max and CR were found to be better with increasing performance level, and correlated well with LTV. This highlights the importance of VO2max and CR on LTV. LT was not found to be higher with higher performance levels, as opposed to the hypothesis. There were no gender differences in the relative impact of the factors determining LTv, with one exception. CR seemed to have a larger impact on LTV in females compared to males. Also, the females had a higher LT and a better CR than their male counterparts. The equation for assessing LTV previously used in cycling was found applicable also for assessing LTV in running as hypothesized. We propose testing of MAS, rather than LT when evaluating training achievements in competitive runners of both genders.
Data Availability Statement
The raw data supporting the conclusions of this article will be made available by the authors, without undue reservation.
Ethics Statement
The studies involving human participants were reviewed and approved by the Institutional Review Board at USN. The patients/participants provided their written informed consent to participate in this study.
Author Contributions
ES, ØS, and JaH designed and planned the project. The interpretation of the data was led by ØS. ES led the writing of the manuscript. All authors took part in the data collection, as well as contributing in the different parts of data analyses, and edited, reviewed and approved the final manuscript.
Conflict of Interest
The authors declare that the research was conducted in the absence of any commercial or financial relationships that could be construed as a potential conflict of interest.
Acknowledgments
We wish to thank all the participants in the study for great co-operation during the testing sessions and during the intervention period.
References
Bangsbo, J. (1994). Estimation of lactate release from contracting muscles in man. Acta Physiol. Scand. 150, 349–350. doi: 10.1111/j.1748-1716.1994.tb09697.x
Bergh, U., Sjødin, B., Forsberg, A., and Svedenhag, J. (1991). The relationship between body mass and oxygen uptake during running in humans. Med. Sci. Sports Exerc. 23, 205–211. doi: 10.1249/00005768-199102000-00010
Bishop, D., Jenkins, D. G., McEniery, M., and Carey, M. F. (2000). Relationship between plasma lactate parameters and muscle characteristics in female cyclists. Med. Sci. Sports Exerc. 32, 1088–1093. doi: 10.1097/00005768-200006000-00008
Bratland-Sanda, S., Pedersen, F. G., Haave, M. N., Helgerud, J., and Støren, Ø (2020). Large inter-individual differences in responses to a block of high intensity aerobic interval training: a case series in national-level cyclists and triathletes. Int. J. Exerc. Sci. 13, 480–487.
Brooks, G. A. (1986). Lactate production under fully aerobic conditions: the lactate shuttle during rest and exercise. Fed. Proc. 45, 2924–2929.
Bunc, V., and Heller, J. (1989). Energy cost of running in similarly trained men and women. Eur. J. Appl. Physiol. Occup. Physiol. 59, 178–183. doi: 10.1007/bf02386184
Conley, D. L., and Krahenbuhl, G. S. (1980). Running economy and distance running performance of highly trained athletes. Med. Sci. Sports Exerc. 12, 357–360. doi: 10.1249/00005768-198012050-00010
Daniels, J., and Daniels, N. (1992). Running economy of elite male and elite female runners. Med. Sci. Sports Exerc. 24, 483–489. doi: 10.1249/00005768-199204000-00015
Davis, J. A. (1985). Anaerobic threshold: review of the concepts and directions of future research. Med. Sci. Sports Exerc. 17:1985. doi: 10.1249/00005768-198502000-00003
Enoksen, E., Shalfawi, S. A. I., and Tønnessen, E. (2011). The effect of high- vs. low-intensity training on aerobic capacity in welltrained male middle-distance runners. J. Strength Cond Res. 25, 812–818. doi: 10.1519/jsc.0b013e3181cc2291
Faude, O., Kindermann, W., and Meyer, T. (2009). Lactate threshold concepts: how valid are they? Sports Med. 39, 469–490. doi: 10.2165/00007256-200939060-00003
Ferrauti, A., Bergermann, M., and Fernandez-Fernandez, J. (2010). Effects of a concurrent strength and endurance training on running performance and running economy in recreational marathon runners. J. Strength. Cond. Res. 24, 2770–2778. doi: 10.1519/jsc.0b013e3181d64e9c
Helgerud, J. (1994). Maximal oxygen uptake, anaerobic threshold and running economy in women and men with similar performances level in marathons. Eur. J. Appl. Physiol. Occup. Physiol. 68, 155–1561. doi: 10.1007/bf00244029
Helgerud, J., Høydal, K., Wang, E., Karlsen, T., Berg, P., Bjerkaas, M., et al. (2007). Aerobic high-intensity intervals improve VO2max more than moderate training. Med. Sci. Sports Exerc. 39, 665–671. doi: 10.1249/mss.0b013e3180304570
Helgerud, J., Ingjer, F., and Strømme, S. (1990). Sex differences in performance-matched marathon runners. Eur. J. Appl. Physiol. 61, 433–439. doi: 10.1007/bf00236064
Helgerud, J., Støren, Ø, and Hoff, J. (2010). Are there differences in running economy at different velocities for well-trained distance runners? Eur. J. Appl. Physiol. 108, 1099–1105. doi: 10.1007/s00421-009-1218-z
Hopkins, W. G., Marshall, S. W., Batterham, A. M., and Hanin, J. (2009). Progressive statistics for studies in sports medicine and exercise science. Med. Sci. Sports Exerc. 41, 3–13. doi: 10.1249/mss.0b013e31818cb278
Hottenrott, K., Ludyga, S., and Schulze, S. (2012). Effects of high intensity training and continuous endurance training on aerobic capacity and body composition in recreationally active runners. J. Sports Sci. Med. 11, 483–488.
Johansen, J. M., Eriksen, S., Sunde, A., Slettemeås, Ø, Helgerud, J., and Støren, Ø (2020). Improving utilization of maximal oxygen uptake and work economy in recreational cross-country skiers with high-intensity double-poling intervals. Int. J. Sports Physiol. Perform 30, 1–8. doi: 10.1123/ijspp.2019-0689
Joyner, M. J., and Coyle, E. F. (2008). Endurance exercise performance: the physiology of champions. J. Physiol. 586, 35–44. doi: 10.1113/jphysiol.2007.143834
Laye, M. J., Nielsen, M. B., Hansen, L. S., Knudsen, T., and Pedersen, B. K. (2015). Physical activity enhances metabolic fitness independently of cardiorespiratory fitness in marathon runners. Dis. Markers 15:806418. doi: 10.1155/2015/806418
Maldonado-Martin, S., Mujika, I., and Padilla, S. (2004). Physiological variables to use in the gender comparison in highly trained runners. J. Sports Med. Phys. Fitness 44, 8–14.
McLaughlin, J. E., Howley, E. T., Bassett, D. R. Jr., Thompson, D. L., and Fitzhugh, E. C. (2010). Test of the classic model for predicting endurance running performance. Med. Sci. Sports Exerc. 42, 991–997. doi: 10.1249/MSS.0b013e3181c0669d
Medbø, J. I., Mamen, A., Olsen, O. H., and Evertsen, F. (2000). Examination of four different instruments for measuring the blood lactate concentration. Scand J. Clin. Lab. Invest. 60, 367–379. doi: 10.1080/003655100750019279
Nicholson, R. M., and Sleivert, G. G. (2001). Indices of lactate threshold and their relationship with 10-km running velocity. Med. Sci. Sports Exerc. 33, 339–342. doi: 10.1097/00005768-200102000-00026
Østerås, H., Helgerud, J., and Hoff, J. (2002). Maximal strength-training effects on force-velocity and force-power relationships explain increases in aerobic performance in humans. Eur. J. Appl. Physiol. 88, 255–263. doi: 10.1007/s00421-002-0717-y
Pate, R. R., and Kriska, A. (1984). Physiological basis of the sex difference in cardiorespiratori endurance. Sports Med. 1, 87–98. doi: 10.2165/00007256-198401020-00001
Pate, R. R., Sparkling, P. B., Wilson, G. E., Cureton, K. J., and Miller, B. J. (1987). Cardiorespiratory and metabolic responses to submaximal and maximal exercise in elite women distance runners. Int. J. Sports Med. 8, 91–95. doi: 10.1055/s-2008-1025712
Pollock, M. L. (1977). Submaximal and maximal working capacity of elite distance runners. Part 1. Cardiorespiratory aspects. Ann. N. Y. Acad. Sci. 301, 310–322. doi: 10.1111/j.1749-6632.1977.tb38209.x
Rabadán, M., Díaz, V., Calderón, F. J., Benito, P. J., Peinado, A. B., and Maffulli, N. (2011). Physiological determinants of speciality of elite middle- and long-distance runners. J. Sports Sci. 29, 975–982. doi: 10.1080/02640414.2011.571271
Rønnestad, B. R., Hansen, J., Hollan, I., and Ellefsen, S. (2015). Strength training improves performance and pedalling characteristics in elite cyclists. Scand J. Med. Sci. Sports 25, e89–e98. doi: 10.1111/sms.12257
Støren, Ø, Bratland-Sanda, S., Haave, M., and Helgerud, J. (2012). Improved VO2max and time trial performance with more high aerobic intensity interval training and reduced training volume: a case study on an elite national cyclist. J. Strength Cond. Res. 26, 2705–2711. doi: 10.1519/jsc.0b013e318241deec
Støren, Ø, Helgerud, J., Sæbø, M., Støa, E. M., Bratland-Sanda, S., Unhjem, R. J., et al. (2017). The effect of age on the V⋅O2max response to high-intensity interval training. Med. Sci. Sports Exerc. 49, 78–85. doi: 10.1249/MSS.0000000000001070
Støren, Ø, Helgerud, J., Støa, E. M., and Hoff, J. (2008). Maximal strength training improves running economy in distance runners. Med. Sci. Sports Exerc. 40, 1087–1092. doi: 10.1249/mss.0b013e318168da2f
Støren, Ø, Rønnestad, B. R., Sunde, A., Hansen, J., Ellefsen, S., and Helgerud, J. (2014). A time-saving method to assess power output at lactate threshold in well-trained and elite cyclists. J. Strength Cond. Res. 28, 622–629. doi: 10.1519/jsc.0b013e3182a73e70
Støren, Ø, Ulevåg, K., Larsen, M. H., Støa, E. M., and Helgerud, J. (2013). Physiological determinants of the cycling time trial. J. Strength Cond. Res. 27, 2366–2373. doi: 10.1519/jsc.0b013e31827f5427
Sunde, A., Johansen, J.-M., Gjøra, M., Paulsen, G., Bråten, M., Helgerud, J., et al. (2019). Stronger is better: the impact of upper body strength in double poling performance. Front. Physiol. 10:1091. doi: 10.3389/fphys.2019.01091
Sunde, A., Støren, Ø, Bjerkaas, M., Larsen, M. H., Hoff, J., and Helgerud, J. (2010). Maximal strength training improves cycling economy in competitive cyclists. J. Strength Cond. Res. 24, 2157–2165. doi: 10.1519/jsc.0b013e3181aeb16a
Keywords: lactate threshold, running performance, maximal aerobic speed, long-distance running, lactate threshold training, percentage of maximal oxygen uptake, velocity at LT
Citation: Støa EM, Helgerud J, Rønnestad BR, Hansen J, Ellefsen S and Støren Ø (2020) Factors Influencing Running Velocity at Lactate Threshold in Male and Female Runners at Different Levels of Performance. Front. Physiol. 11:585267. doi: 10.3389/fphys.2020.585267
Received: 20 July 2020; Accepted: 08 October 2020;
Published: 04 November 2020.
Edited by:
Luca Paolo Ardigò, University of Verona, ItalyReviewed by:
Alessandro Moura Zagatto, São Paulo State University, BrazilCaio Victor Sousa, Northeastern University, United States
Copyright © 2020 Støa, Helgerud, Rønnestad, Hansen, Ellefsen and Støren. This is an open-access article distributed under the terms of the Creative Commons Attribution License (CC BY). The use, distribution or reproduction in other forums is permitted, provided the original author(s) and the copyright owner(s) are credited and that the original publication in this journal is cited, in accordance with accepted academic practice. No use, distribution or reproduction is permitted which does not comply with these terms.
*Correspondence: Eva Maria Støa, ZXZhLm0uc3RvYUB1c24ubm8=