 Andrew P. Koutnik1,2*
 Michelle E. Favre3
 Karina Noboa2
 Marcos A. Sanchez-Gonzalez4
 Sara E. Moss2
 Bishoy Goubran5
 Csilla Ari6,7
 Angela M. Poff2
 Chris Q. Rogers2Janine M. DeBlasi2Bishoy Samy3
 Mark Moussa2
 Jorge M. Serrador3,8Dominic P. D’Agostino1,2,7
- 1Human Health, Resilience, & Performance, Institute for Human and Machine Cognition, Pensacola, FL, United States
- 2Department of Molecular Pharmacology and Physiology, Morsani College of Medicine, University of South Florida, Tampa, FL, United States
- 3Department of Pharmacology, Physiology and Neuroscience, Rutgers Biomedical and Health Sciences, Newark, NJ, United States
- 4Division of Clinical & Translational Research, Larkin Health System, Miami, FL, United States
- 5Department of Psychiatry, Larkin Health System, Miami, FL, United States
- 6Department of Psychology, Hyperbaric Neuroscience Research Laboratory, University of South Florida, Tampa, FL, United States
- 7Ketone Technologies LLC, Tampa, FL, United States
- 8Department of Cardiovascular Electronics, National University of Ireland Galway, Galway, Ireland
Human adaptation to extreme environments has been explored for over a century to understand human psychology, integrated physiology, comparative pathologies, and exploratory potential. It has been demonstrated that these environments can provide multiple external stimuli and stressors, which are sufficient to disrupt internal homeostasis and induce adaptation processes. Multiday hyperbaric and/or saturated (HBS) environments represent the most understudied of environmental extremes due to inherent experimental, analytical, technical, temporal, and safety limitations. National Aeronautic Space Agency (NASA) Extreme Environment Mission Operation (NEEMO) is a space-flight analog mission conducted within Florida International University’s Aquarius Undersea Research Laboratory (AURL), the only existing operational and habitable undersea saturated environment. To investigate human objective and subjective adaptations to multiday HBS, we evaluated aquanauts living at saturation for 9–10 days via NASA NEEMO 22 and 23, across psychologic, cardiac, respiratory, autonomic, thermic, hemodynamic, sleep, and body composition parameters. We found that aquanauts exposed to saturation over 9–10 days experienced intrapersonal physical and mental burden, sustained good mood and work satisfaction, decreased heart and respiratory rates, increased parasympathetic and reduced sympathetic modulation, lower cerebral blood flow velocity, intact cerebral autoregulation and maintenance of baroreflex functionality, as well as losses in systemic bodyweight and adipose tissue. Together, these findings illustrate novel insights into human adaptation across multiple body systems in response to multiday hyperbaric saturation.
Introduction
Extreme environments have been explored for over a century to understand human adaptation, extrapolate insights into comparative pathology, and extend human exploration (Tipton, 2016). Salient examples include microgravity, hypobaric, hyperbaric, hypothermic, and hyperthermic environments. These environments provide individual or multiple external stimuli and stressors which are sufficient to disrupt internal homeostasis and induce adaptation processes (Taylor and Cotter, 2006; Tipton, 2016). Adaptations have been observed in subjective psychology and multiple body systems, including cardiovascular, autonomic, musculoskeletal, circadian, pulmonary, endocrine, vestibular, neurosensory, hematological, thermoregulatory, and others (Webb, 1995; Taylor and Cotter, 2006; Kanas and Manzey, 2008; Williams et al., 2009; Pendergast et al., 2015; Tipton, 2016).
Hyperbaric and/or saturation (HBS) environments impact divers (recreation, sport, or professional), personnel operating below sea level (bridge construction, submarine, etc.), and/or patients within pressurized chambers used for hyperbaric oxygen (O2) therapy or hyperbaric research. Pendergast et al. (2015) described that these environmental conditions include one or more stimuli including pressure (depth), temperature extremes, and/or an unbreathable ambient medium (Pendergast et al., 2015). Inherent across all HBS environments is the increased partial pressure of inspired gases (PI) (Ciarlone et al., 2019). PI is determined by the fractional concentration of gas multiplied by the barometric pressure. At sea level, the barometric pressure is 1 atmosphere absolute (1 ATA/760 mmHg) with 21% O2 (0.21 PO2) and 78% nitrogen (0.78 PN2). Increased sea level depth (+1 ATA per 10 m depth) or forced air compression elevates PI, causing O2 and/or N2 arterial pressure to rise, a physiologic state termed “saturation.” Increased arterial PO2 and/or PN2 have been demonstrated to increase reactive N2 and O2 species (RNOS) production, modify redox balance, and impact neurosensory, pulmonary, autonomic, and cardiovascular systems (D’Agostino et al., 2013; Poff et al., 2016; Ari et al., 2019; Ciarlone et al., 2019). Beyond pressure and gas extremes, acute aquatic HBS also influences cardiorespiratory, endocrine, thermoregulatory and renal responses (Pendergast et al., 2015). While much has been learned about acute responses to HBS stressors in controlled laboratory conditions, HBS still remains the most understudied environmental extreme due to inherent experimental, analytical, technical, temporal, and safety limitations (Pendergast et al., 2015; Tipton, 2016), with even less known on the chronic adaptive response in ecological HBS environments as only a small number of historical reports exist in undersea habitats (O’Neal et al., 1965; Pauli and Clapper, 1967; Bayles, 1970; Pauli and Cole, 1970; Anderson and Herrmann, 1971; Nowlis et al., 1972) or pressurized sea level chambers (Seo et al., 1999; Buguet, 2007) at varying depths and lengths of exposure.
Florida International University’s (FIU) Aquarius Undersea Research Laboratory (AURL) is a submerged 400 square feet 74,389 kg habitat 9 km offshore and is considered the world’s only existing underwater research laboratory allowing individuals to live and operate at HBS for up to 3 weeks. The National Aeronautic Space Agency (NASA) Extreme Environment Mission Operation (NEEMO) is a space-flight analog mission conducted within AURL, with similarities to space-flight missions, including mission task load and demands, communication logistics, geographical isolation, extravehicular activities (EVAs), associated risks, and others. Consequently, the NASA NEEMO AURL provides an operational relevant research environment for elucidating the multiday adaption impact of real-world HBS on free-living, highly trained operators (aquanauts: individuals who successfully inhabit AURL for >24 h without resurfacing), allowing for advanced analyses into the multiday adaptive impact of HBS on human psychology and integrated physiology, allowing potential insight into comparative medical pathologies, and/or aiding in the development of mitigative strategies or augmentics to extend human exploration (Smith et al., 2004; Zwart et al., 2009; Strewe et al., 2015; Tipton, 2016; Kim et al., 2018).
To investigate human objective and subjective adaptation to multiday HBS, we evaluated each aquanaut’s psychological, cardiac, respiratory, autonomic, thermic, peripheral and central hemodynamics, sleep, and body composition parameters while living at saturation for 9–10 days across NASA NEEMO 22 and 23. We hypothesized that aquanauts would experience psychological burden, reduced mood and work satisfaction, increased heart rate (HR), decrease respiratory rate, increased sympathetic and reduced parasympathetic modulation, elevated skin temperature, hemodynamic dysfunction, reduced sleep quality and quantity, bodyweight and fat-free mass loss, without change in adipose tissue, due to accumulated exposure to AURL HBS multi-stressors. However, we discovered that humans living at HBS for 9–10 days experienced intrapersonal physical and mental burden, sustained good mood and work satisfaction, decreased HR and respiratory rates, increased parasympathetic and reduced sympathetic modulation, lower cerebral blood flow velocity, intact cerebral autoregulation and maintenance of baroreflex functionality, and losses in systemic bodyweight and adipose tissue (Figure 1). These data illustrate multiple novel advancements in understanding human adaption prior to, during, and following multiday HBS in an operationally relevant environmental setting with clear overlap and distinctions between other environmental extremes.
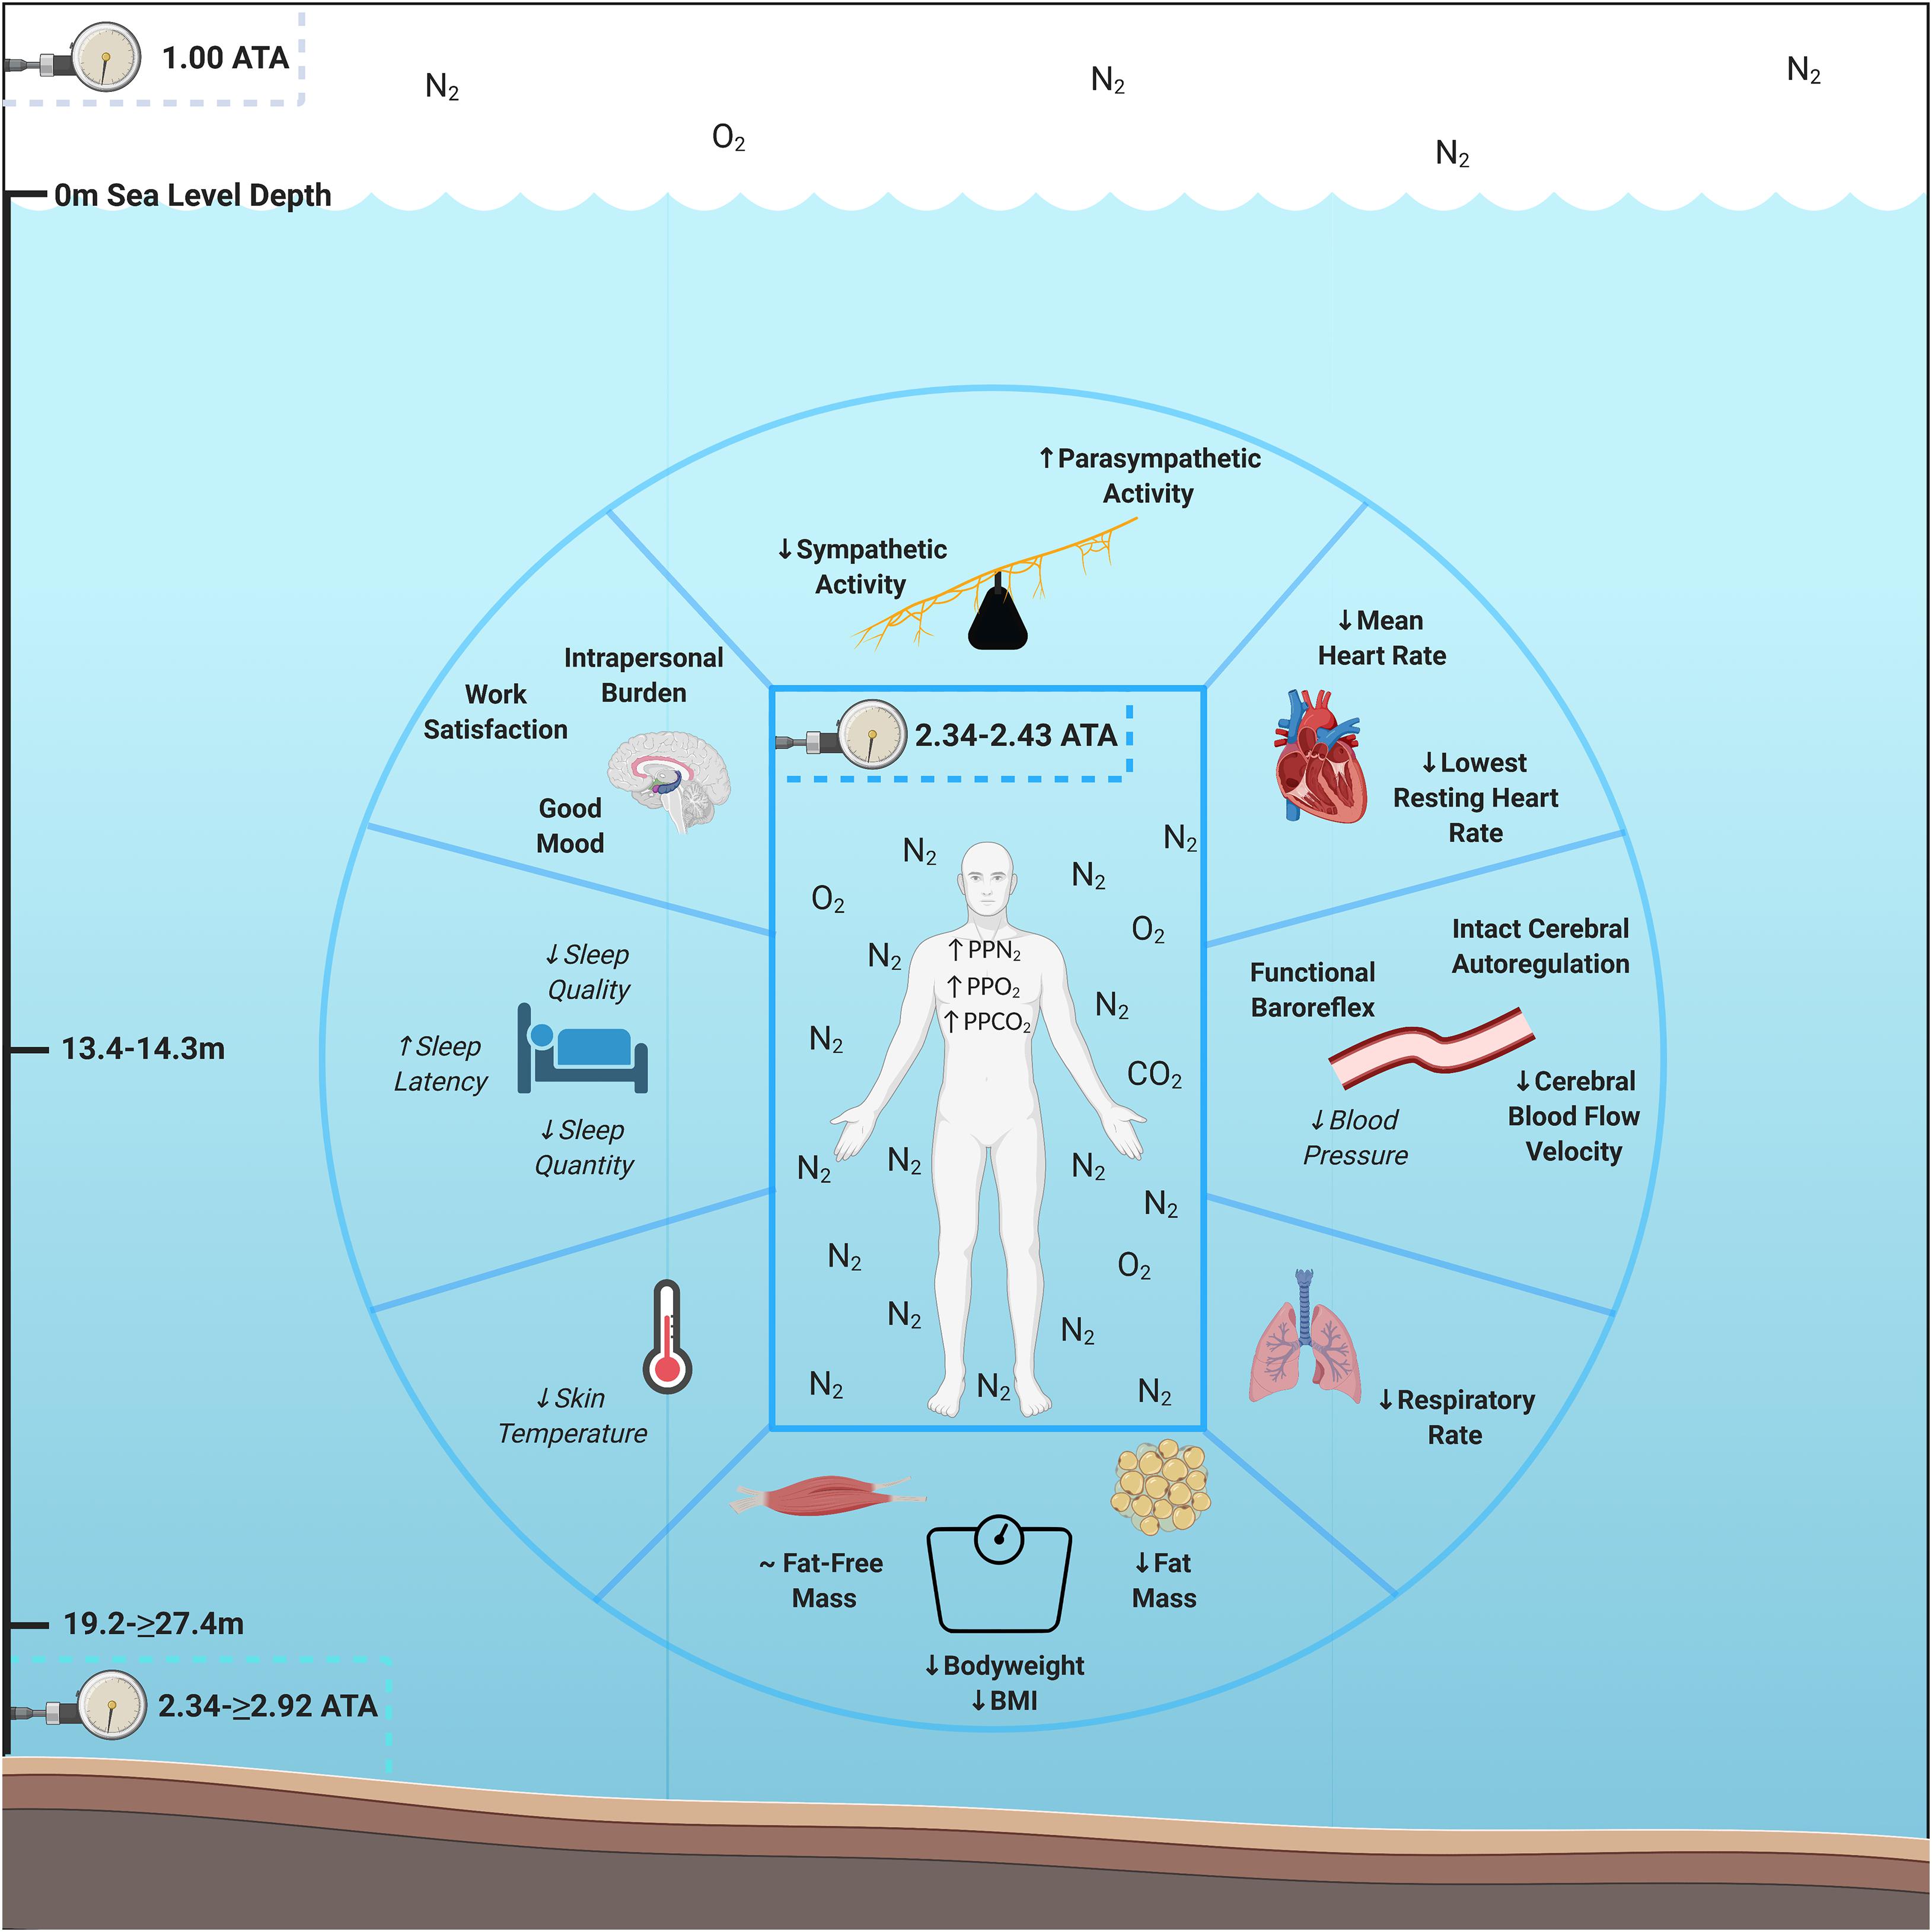
Figure 1. Psychological and physiological adaptations to multiday saturation. Aquanauts exposed to hyperbaric saturation from 2.34 to ≥2.92 atmospheres absolute (ATA) over 9–10 days experienced intrapersonal physical and mental burden, sustained good mood and work satisfaction, decreased heart and respiratory rates, increased parasympathetic and reduced sympathetic modulation, lower cerebral blood flow velocity, intact cerebral autoregulation and maintenance of baroreflex functionality, and losses in systemic bodyweight and adipose tissue. Reductions in skin temperature (5/6 aquanauts) and blood pressure (3/3 aquanauts), as well as elevations in sleep quality (4/6 aquanauts) were observed. Abbreviations: ATA, atmospheres absolute; PP, partial pressure; O2, oxygen; N2, nitrogen, CO2, carbon dioxide; BMI, Body Mass Index. Italicized and un-bolded text indicates non-significance changes.
Materials and Methods
NASA NEEMO Subject Population, Selection, and Mission Logistics
NASA NEEMO 22 and 23 missions planning began in January 2017 and January 2019, respectively. Eleven aquanauts (male, n = 7; female, n = 4) composed of astronauts (n = 4), research scientists (n = 4), and/or professional habitat technicians (n = 3) underwent a multistep verification process including, medical and physical evaluation, confirmation of accredited national or international diving certification and experience, and mission training at NASA Johnson Space Center (JSC) to participate in NASA NEEMO 22 and 23. Upon selections, aquanauts underwent continual internet-based planning, training and familiarization along with a week-long mission training and evaluation program at JSC involving equipment, timeline, research projects, and personnel familiarization. 7 days before entering HBS, participants arrived at FIU On-Shore Mission Control Facility in Islamorada, Florida where they underwent pre-mission preparation involving training, planning, dives, etc. JSC and/or ARB training week provided an analogous physical and mental task load environment to within habitat HBS and was used as a normobaric pre-saturation control timepoint. Following 7 days of ARB training, aquanauts dove into the HBS environment (AURL) where they lived and executed full-day mission objectives for 9–10 days which included extravehicular activities, continual communication with FIU On-Shore Mission Control, research implementation, and other activities, analogizing space-flight operational demands and inherent risks. Throughout HBS, aquanauts were supported by Navy Medical Divers and additional support divers to ensure safe mission completion. Within 24 h of resurfacing, aquanauts underwent a 14–18 h desaturation protocol to lower arterial PN2. Following resurfacing, participants underwent 2-days of mission debriefing. This period was used for the normobaric post-saturation recovery timepoints. Intrapersonal physical burden, mental burden, mood, work satisfaction, cardiac function, autonomic function, sleep quality, subjective sleep, respiration, and body temperature measurements were taken twice pre-saturation (ARB Pre-Saturation Day 4&5), twice in saturation (Mission Day 4&8), and once post-saturation (Debriefing Day 1). Peripheral and cerebrovascular hemodynamics were measured once pre-saturation (JSC Pre-Saturation), three time during saturation (Mission Day 2 or 3, 5 or 6, 8 or 9), and once post-saturation (Debriefing Day 1). Body composition was measured 24 h prior to saturation and within 24 h of resurfacing. All crewmembers gave informed consent, as approved by the Institute for Human and Machine Cognition, Johns Hopkins University, NASA JSC, and/or European Space Agency Institutional Review Boards. Aquanaut baseline anthropometric characteristics are described in Table 1.
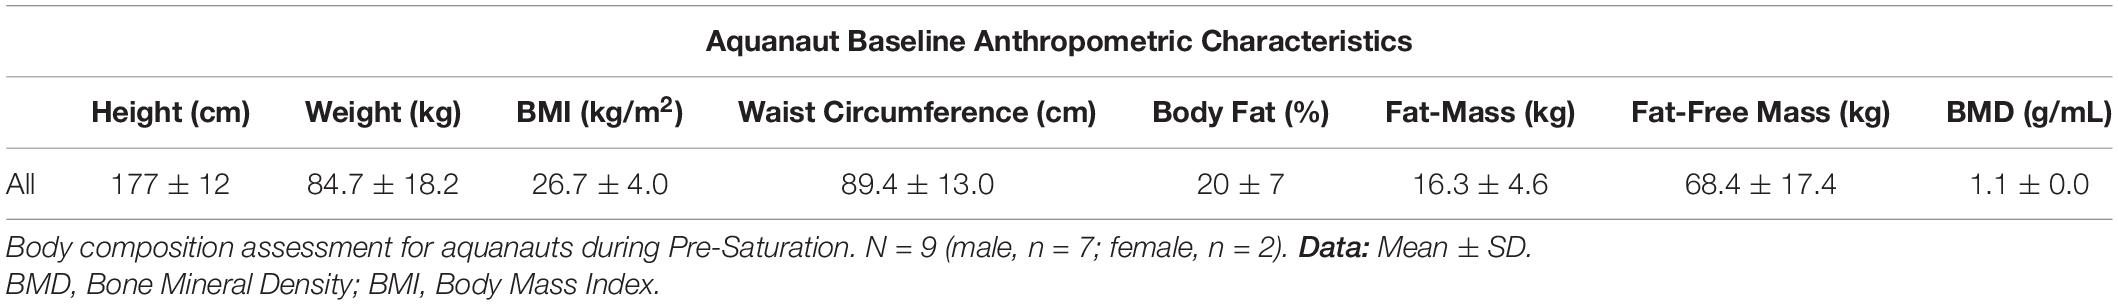
Table 1. Aquanaut baseline anthropometric characteristics.
Hyperbaric Saturation and Aquarius Underwater Research Laboratory
Sea-level air (21% O2, 78% N2, and trace gases) was pumped into AURL via high pressure air compressors from a sea level life support buoy into high pressure gas cylinders. AURL is positioned at 19.2 m sea water depth (2.92 ATA/2219 mmHg) where aquanauts lived and operated primarily at ∼13.4–14.3 m sea water depth (2.34–2.43ATA/1778–1847 mmHg) depending on oceanic tide with intermittent multi-hour EVAs at ≥ 19.2 meters depth (≥2.92 ATA/ ≥ 2219 mmHg). Throughout EVAs, aquanaut buoyancy was set to replicate Mars microgravity and they were monitored for sea water depth to ensure individuals remained within “no decompression” limits under continuous saturated diving conditions. PPgas in each environment was calculated as gas fractional concentration multiplied by total pressure. Corresponding PPO2, PPN2, and PPCO2 are indicated in Table 2. AURL CO2 was recorded at 0.3–1.5% surface equivalence value throughout mission, similar to PPCO2 observed within the international space station (Law et al., 2014). Fresh sodasorb and ventilation were used to attenuate further CO2 rise.
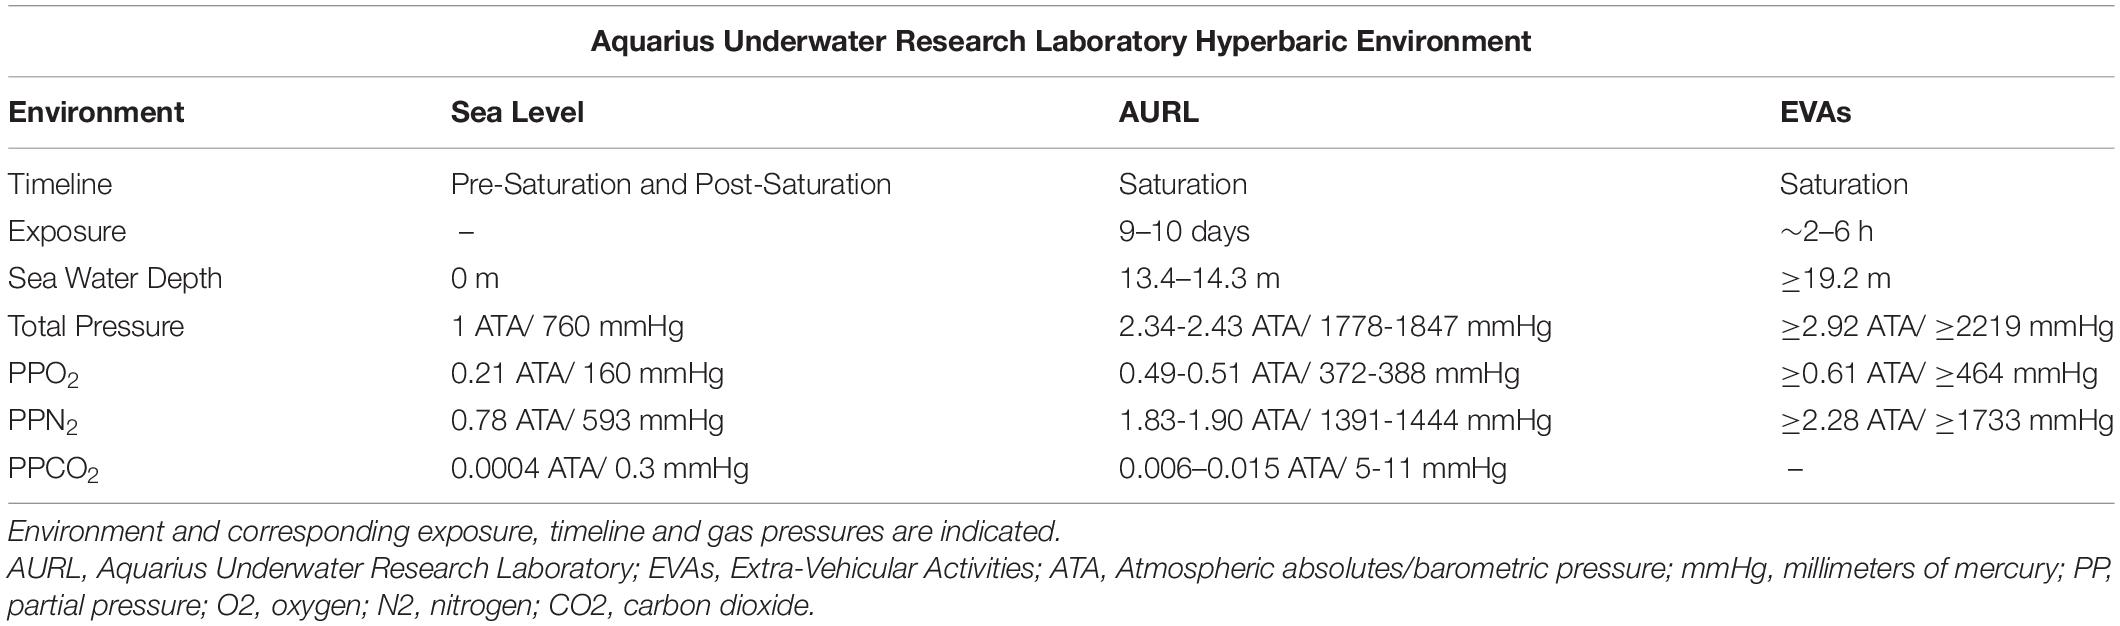
Table 2. Aquarius underwater research laboratory hyperbaric environmental parameters.
Intrapersonal Physical Burden, Mental Burden, Mood and Work Satisfaction
Aquanauts completed a multi-question intrapersonal mental burden, physical burden, mood, and work satisfaction survey to evaluate the busy/hectic, physically strenuous, mentally taxing, post-mission day fatigue, tenseness, and stiffness, headache and pain using a 1–10 Likert scale at different timepoints, always at the end of each day as previously described (O’Griofa et al., 2013). Intensity scores were separated into five categories: 1–2, 3–4, 5–6, 7–8, and 9–10 which were interpreted as none, very mild, mild, moderate, and severe, respectively. Cumulative mission impact on subjective quality metrics of mood and work satisfaction. Quality scores were separated into five categories: 1–2, 3–4, 5–6, 7–8, and 9–10 which were interpreted as very poor, poor, fair, good, and excellent, respectively. Eight subjects (male, n = 6; female, n = 2) complied with all timepoints and were included in analyses.
Cardiac and Autonomic Function
Aquanauts cardiovascular and autonomic function were measured throughout rest. Polar V800 (Polar, Kempele, Finland) Watch and H7 Chest Strap technology was utilized to gather electrocardiographic signals (R–R intervals) across rest and activity (Giles et al., 2016; Caminal et al., 2018). Briefly, prior to bed, subjects dampened the H7 chest strap, affixed the chest strap inferior to pectoral muscles and superficial to xyphoid process, verified recording initiation via V800 (HR) display, underwent troubleshooting procedures if continuous HR was not accurately displayed, wore both the watch and chest strap throughout the duration of sleep, and stopped recording upon cessation of sleep. To ensure that subjects wore devices on designated days, internal measurement dates were validated. Cardiovascular and autonomic function were analyzed from R–R intervals using Kubios 3.3.1 (Kubios Oy, Kuopio, Finland) software. Heart rate variability parameters were measured, analyzed, and interpreted per consensus guideline (Malik, 1996) as previously described by our group (Sanchez-Gonzalez and Figueroa, 2013). All R–R intervals were manually inspected for artifacts, premature beats and non-sinus tachycardia episodes by a trained researcher for the entire sampling period. Artifacts were then manually removed via interpolation excluding non-analyzable and non-reliable raw data. First hour of recording therefore was eliminated uniformly across all samples to account for sleep latency and to minimize artifacts related to physical movement and missing data due to malfunctioning devices. A sample size of 4 h was used regardless of sleep onset and phases to reflect sleep cycles and in a similar approach to previous studies (Finley and Nugent, 1995; Goto et al., 1997; Herzig et al., 2017; Jawabri and Raja, 2020), Kubios artifact correction algorithm with medium threshold was utilized to remove artifacted waveforms automatically (Gisselman et al., 2020), R–R time series interpolation rate of 4 HZ was used. The HRV frequency bands utilized were very low frequency (VLF) (0–0.04 Hz), low frequency (LF) (0.04–0.15 Hz), and high frequency (HF) (0.15–0.4 Hz). The spectrum for the selected R–R interval sample was calculated with Welch’s periodogram method (FFT spectrum), 300 S window width, and window overlap 50% (Li et al., 2019). Seven subjects (male, n = 5; female, n = 2) complied with all timepoint measurements, did not obtain errors in data collection, and were included in analyses.
Peripheral and Cerebrovascular Hemodynamics
Aquanauts were assessed during waking hours to determine beat-by-beat middle cerebral artery flow velocity (MCAv), systolic blood pressure (SBP), diastolic blood pressure (DBP), mean arterial pressure (MAP), and estimated HR. Transcranial Doppler measurements were obtained at the trans-temporal window with a 2 MHz probe (DWL, Germany) as previously described (Aaslid et al., 1982). The Doppler probe was initially fitted for each aquanaut during JSC pre-saturation. The angle of the probe was glued in place using a custom-made probe holder and was attached via custom-made Velcro headbands. Beat-by-beat blood pressure was determined by finger plethysmography (Portapres, Finapres Medical Systems, Netherlands) on the non-dominant hand. A height correction unit (Finapres Medical Systems, Netherlands) was worn to correct for blood pressure measurements. Subjects completed baseline standing measurements, and a prone-to-stand protocol. During the prone-to-stand protocol, aquanauts began lying prone 2 min, followed by standing for 1 min. Aquanauts repeated this protocol at least once. Any stands with dropouts in data were removed, and the remaining stands were averaged for each mission day. The change in MCAv, MAP, and estimated HR between prone and standing conditions were computed from the averaged values in the 25-s sections immediately before and 30 s after the aquanauts stood up. The drop in MCAv and MAP during the stand were determined as well as measures of cerebral autoregulation by measuring autoregulatory index and the time it took to reach the lowest MCAv value (nadir). Autoregulatory index was used to assess cerebral autoregulation based on Tiecks’ predicted curve fit modeling method (Tiecks et al., 1995), which uses a mathematical model calculating theoretical cerebral blood flow responses to the given blood pressure input. The lowest mean square error between the actual and theoretical MCAv yields the curve of best fit on a scale from 0 to 9, 0 indicating no autoregulation when MCAv passively changes with MAP, and 9 indicating the best observed autoregulatory response when MCAv remains relatively constant despite a change in MAP. Data were acquired using DATAQ acquisition software with a sampling rate of 1,000 Hz. Both MCAv and blood pressure were visually inspected, and any artifacts or signal loss identified were removed and linearly interpolated using a custom-written MATLAB script (MathWorks, Natick, MA, United States) prior to analyses. Static blood pressure was obtained at the brachial artery using a sphygmomanometer and stethoscope. From six male participating subjects, four aquanauts complied with all timepoint measurements during baseline standing conditions (male, n = 4) and three completed the prone-to-stand protocol (male, n = 3).
Sleep Quality, Respiration and Body Temperature
Aquanauts were evaluated for sleep quantity, quality, respiration and skin temperature throughout rest (sleep) using OURA which is a 15 g multisensory technology (de Zambotti et al., 2017; Maijala et al., 2019). This technology uses infrared light and a photosensor to gather beat-by-beat blood volume pulse architecture on the dominant ring finger palmar artery. 3D accelerometer gathered body movement amplitude and intensity with 30 s frequency resolution. Negative temperature coefficient thermistor gathered finger skin temperature with a 60 s and 0.07°C resolution. Sleep–wake patterns and characteristics were derived from combination of pulse rate, features from bb intervals, pulse amplitude, and motions obtained via standard actigraphy (de Zambotti et al., 2017). OURA devices were pre-fitted for dominant hand ring finger at JSC pre-mission training week to ensure individualized ring size fit. To ensure aquanauts wore devices on designated days, internal device dates were validated. Total sleep (hours), rapid eye movement (REM; hours), deep (hours), REM/total, deep/total, latency to sleep (minutes), average HR variability (Root Mean Square of Successive Differences, RMSSD; ms), average HR (beats per minute), lowest rest HR (beats per minutes), respiratory rate (breaths per minutes), and skin temperature (Celsius; °C) were gathered. Six aquanauts were instructed to wear the device on the same hand and finger throughout all measurements with 100% compliance across timepoints. All obtained data were included in analyses (male, n = 6).
Subjective Sleep Assessment
Immediately before and upon completion of sleep, participants completed a modified Pittsburg Sleep Diary adapted to evaluate subjective sleep pre-, during, and post-saturation for trouble falling asleep, sleep quality, sleeplessness, pre-mission day fatigue, and alertness in extreme environmental conditions (Griofa et al., 2011), using a 1–10 Likert scale. Intensity scores were separated into five categories: 1–2, 3–4, 5–6, 7–8, and 9–10 were interpreted as none, very mild, mild, moderate, and severe, respectively. Number of Sleep Disturbances were quantified upon waking. Seven subjects (male, n = 5; female, n = 2) complied with all timepoints and were included in analyses.
Body Composition
Aquanauts underwent anthropometric assessment to determine both systemic and region-specific alterations in tissue composition. Subject daily routines were pre-assigned throughout. Anthropometric data were gathered across the same environment and routine at similar daily timepoints (10:00–14:00) which illustrated overlapping pre-saturation and post-saturation subject timepoints to control for lifestyle-induced variability. Anatomical landmarks were indicated with a marking pen to ensure measurements were gathered at the same anatomical sites. Weight (±0.1 kg) and height (nearest cm) were gathered using a digital scale and stadiometer, respectively. The dominant extremity was used for gathering remaining anthropometric data. Waist circumference was measured between the right and left iliac crest using standard measuring tape. Leg circumference was measured halfway between the greater trochanter and patella. Arm circumference was gathered between the lateral humerus greater tuberosity and olecranon. Three-point sex-specific caliper skinfolds (male: mid-chest, mid-thigh, abdominal; female: mid-upper arm, mid-thigh, suprailiac; Schmidt and Carter, 1990) were evaluated as previously described (Jackson and Pollock, 1985). A-mode ultrasound muscle thickness (chest and mid-thigh; mm; BodyMetrix Pro, Brentwood, CA, United States) were gathered across corresponding skinfold regions (Utter and Hager, 2008; Wagner, 2013). All scans where performed with the transducer held perpendicular to the skin and starting at the visible lateral muscular border and finishing at the visible medial muscular border. All measurements were performed twice. If measurements were no within 0.1 kg, 1 cm, 5, 2, and 2 mm across weight, height, circumference, skinfold, and ultrasound, respectively, a third was taken. Values were averaged across timepoints. Body mass index (BMI; kg/m2), body fat (%), fat-mass (kg), fat-free mass (kg), and bone density (g/mL) were calculated from anthropometric data (Jackson and Pollock, 1985). Nine subjects (male, n = 7 and female, n = 2) were available within 24 h post-resurfacing for body composition pre- to post-analyses. Of the nine subjects, six subjects gathered multiple muscle thickness measurements and were included in analyses (male, n = 6).
Statistical Analyses
GraphPad Prism 8 software was used for all statistical analyses. Within subject parameters were averaged within timepoint (Pre-Saturation, Saturation, Post-Saturation). The Shapiro–Wilk test was performed to determine normal distribution. Logarithmic transformation was performed for all parameters determined to not be normally distributed. Paired t-tests were performed for the comparison of two timepoints (Pre-Saturation versus Post-Saturation). Repeated Measures One-Way ANOVA followed by Tukey’s post hoc was used for >3 comparisons and Fisher LSD post hoc for ≤3 comparisons to control for family wise error. Pearson correlation analyses were conducted where overlapping timepoints and measurements were reported between OURA and Polar devices (Mean HR and RMSSD). Significance is indicated where p < 0.05. Data are reported as mean ± SD.
Results
Intrapersonal Physical Burden, Mental Burden, Mood and Work Satisfaction
Aquanauts reported mild and moderate levels of business/hecticness at pre-saturation and saturation, respective. However, business/hecticness was significantly reduced from saturation to very mild post-saturation (Figure 2A; p = 0.026). Physical strenuousness was mild at pre-saturation and saturation but reduced significantly to none post-saturation compared to pre-saturation (p = 0.012) and saturation (Figure 2B; p = 0.004). Mental taxation was mild at pre-saturation and saturation, and very mild post-saturation, but was not significantly different across timepoints (Figure 2C). Post-mission day fatigue was mild at pre-saturation and saturation, but moderate post-saturation, but was not significantly different across timepoints (Figure 2D). Tenseness was very mild at pre-saturation and saturation, but significantly decreased to none post-saturation compared to other timepoints (Figure 2E; p = 0.005). No stiffness, headaches, and pain were indicated across timepoints (Figure 2F). Mood and work satisfaction were good throughout all timepoints (Figures 2G,H).
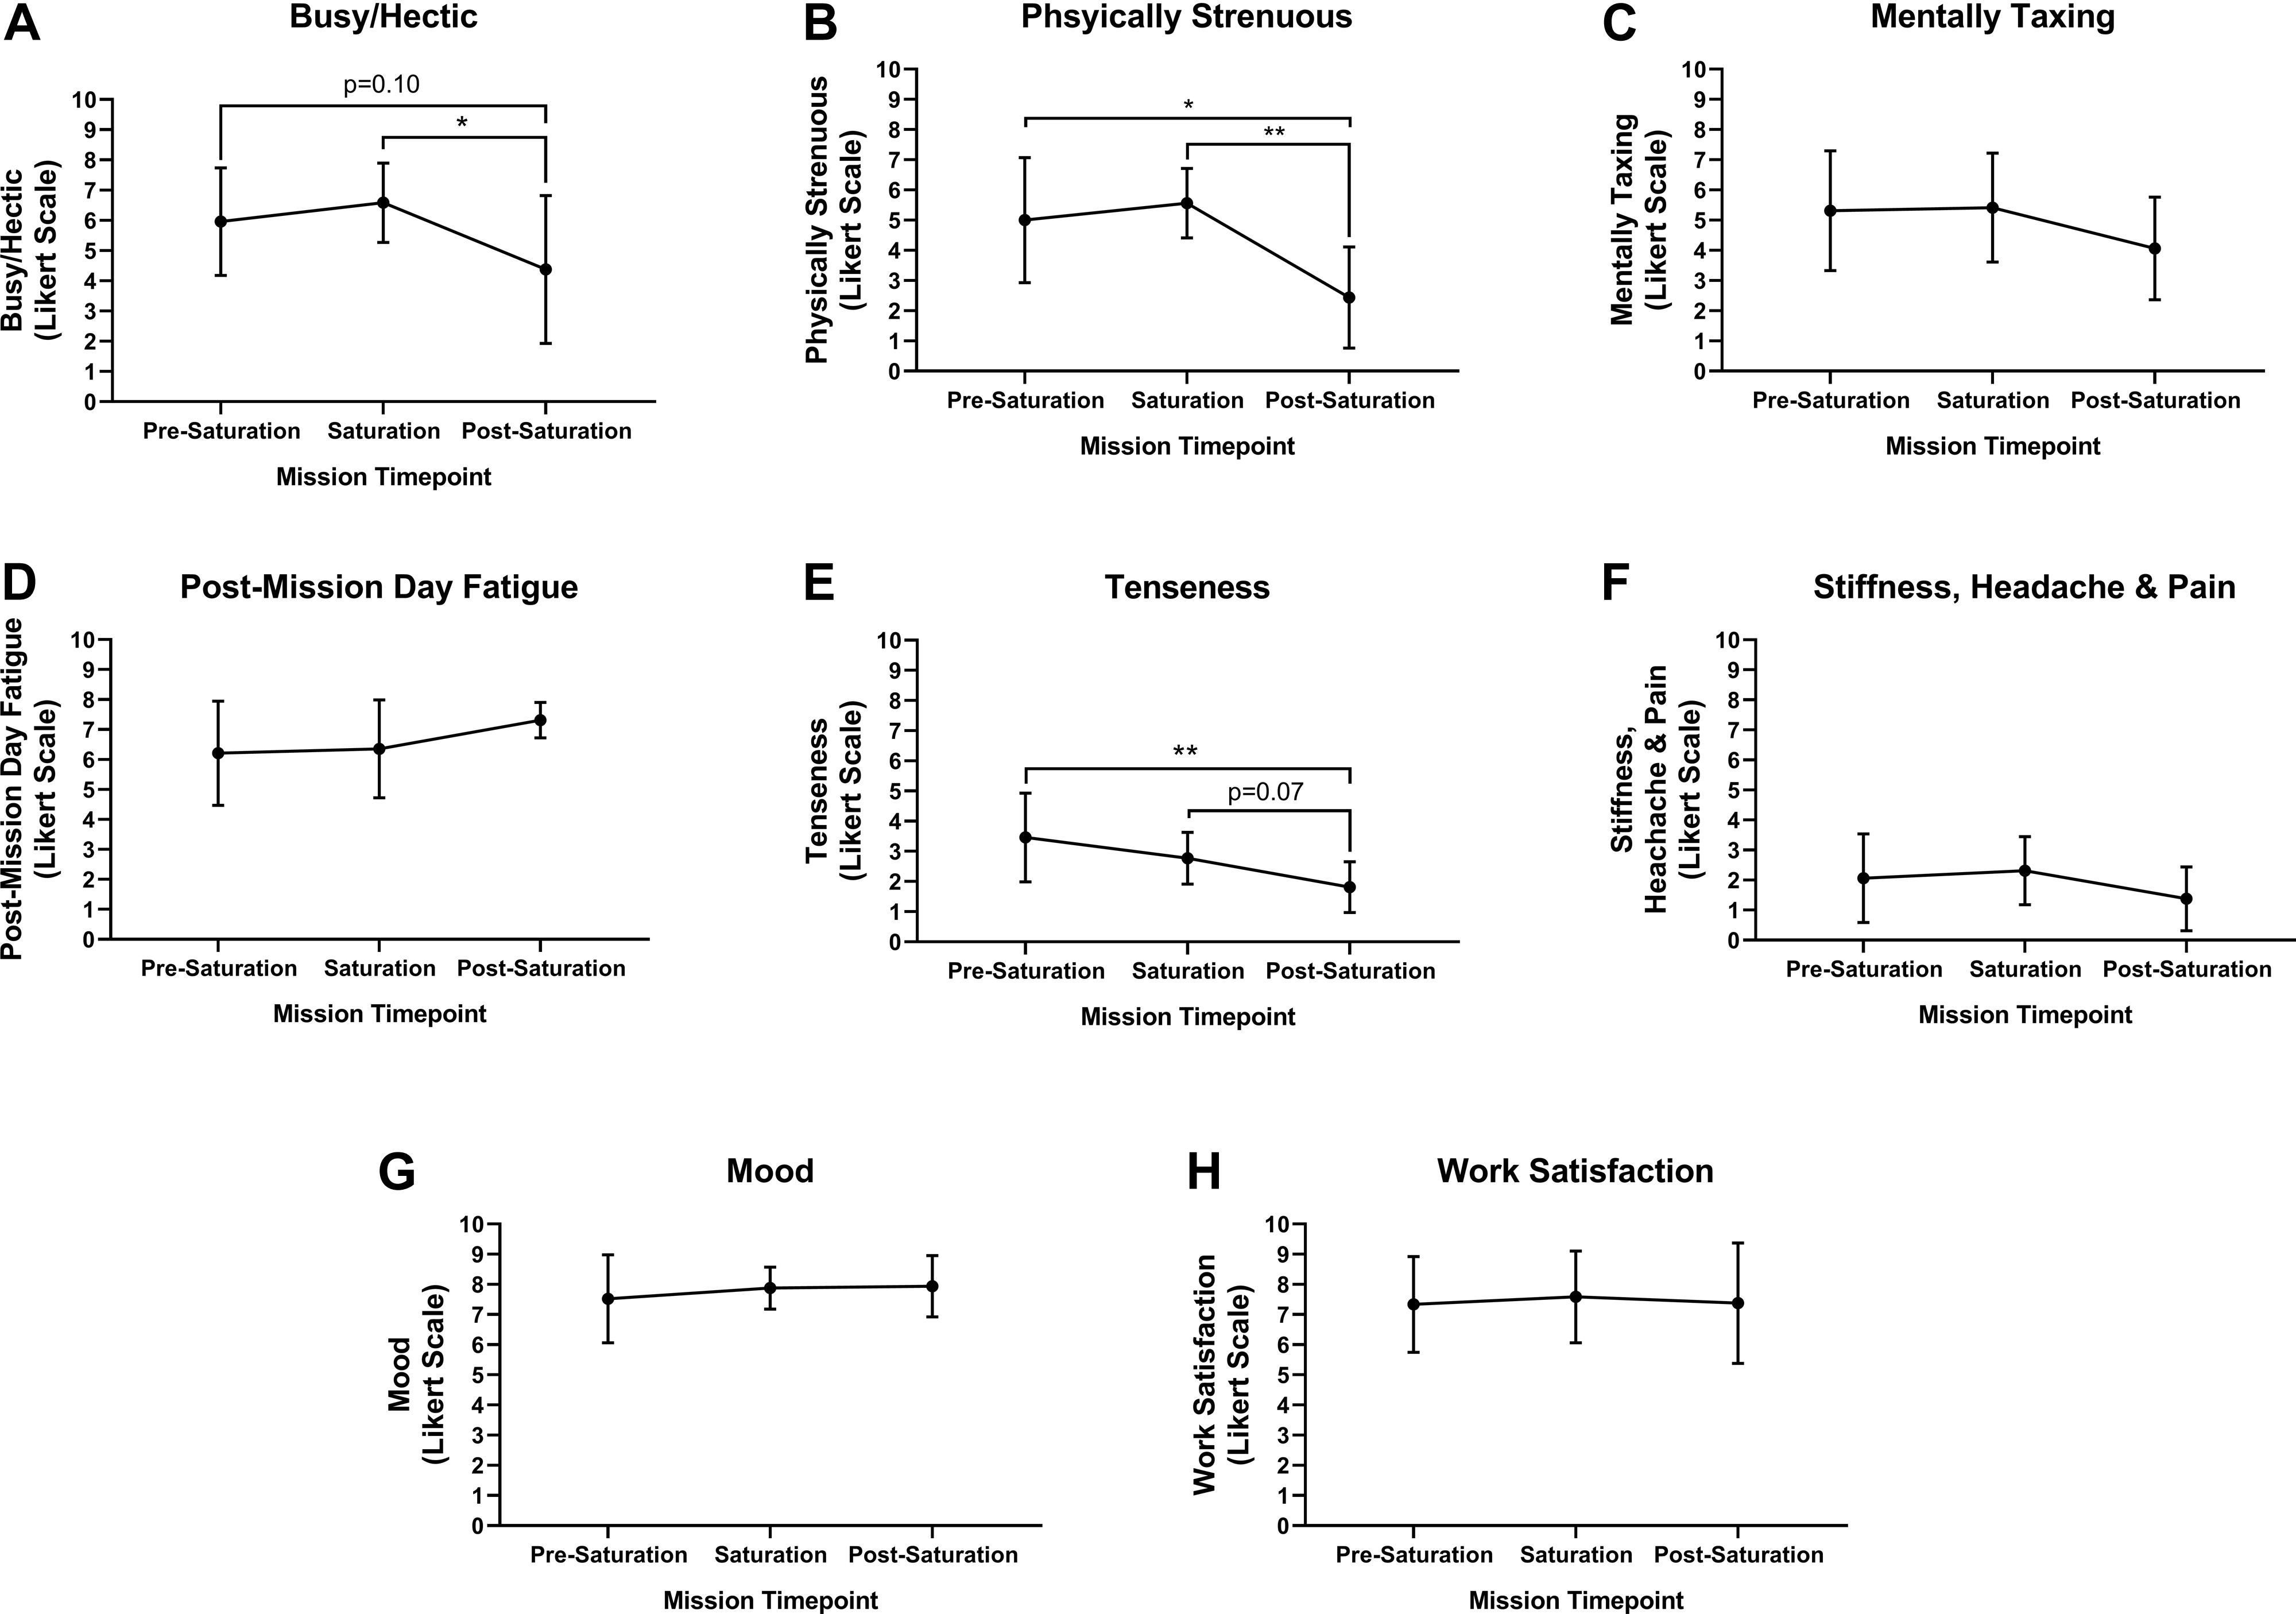
Figure 2. Intrapersonal burden, mood and work satisfaction. Subjective assessment of (A) Busy/Hectic, (B) Physical Strenuous, (C) Mentally Taxing, (D) Post-Mission Day Fatigue, (E) Tenseness, (F) Stiffness, Headaches and Pain were assessed using Likert Scaling to determine intrapersonal physical and mental burden. Subjective assessment of (G) Mood and (H) Work Satisfaction were quantified using Likert Scaling. N = 8 (male, n = 6; female, n = 2). Data: Mean ± SD. *p < 0.05, **p < 0.01. Raw p-values are reported for non-significant changes where p ≤ 0.10.
Cardiorespiratory, Autonomic and Temperature Regulation
Heart rate was significantly lower during saturation compared to pre-saturation (p = 0.049), while trending lower from during saturation compared to post-saturation (Figure 3A; p = 0.089). Lowest resting HR was trending lower during saturation compared to pre-saturation (p = 0.069), while significantly lower during saturation compared to post-saturation (Figure 3B; p = 0.008). Respiratory rate was significantly lower in saturation compared to pre- (p = 0.012) and post-saturation (Figure 3C; p = 0.039). R–R Interval, RMSSD, Total Power, VLF, LF, HF, Poincaré Perpendicular Standard Deviation (SD1), Poincaré Parallel Standard Deviation (SD2), SD1/SD2, and PNS index were significantly higher during saturation compared to either pre- or post-saturation timepoints (Figures 3D–H,J,L–N,S; p < 0.050). Alternatively, nLF, LF/HF, Short-Term Detrended Fluctuation Analysis (DFAα1), Long-Term Detrended Fluctuation Analysis (DFAα2), and Stress Index were all significantly lower during saturation compared to pre- and post-saturation timepoints (Figures 3I–K,O–Q; p < 0.050). SNS Index showed trends for reductions during saturation compared to pre- (p = 0.077) and post-saturation timepoints (Figure 3R; p = 0.071). While 5/6 aquanauts observed a reduction in skin temperature during saturation, this was not significant across timepoints (Figure 3T).
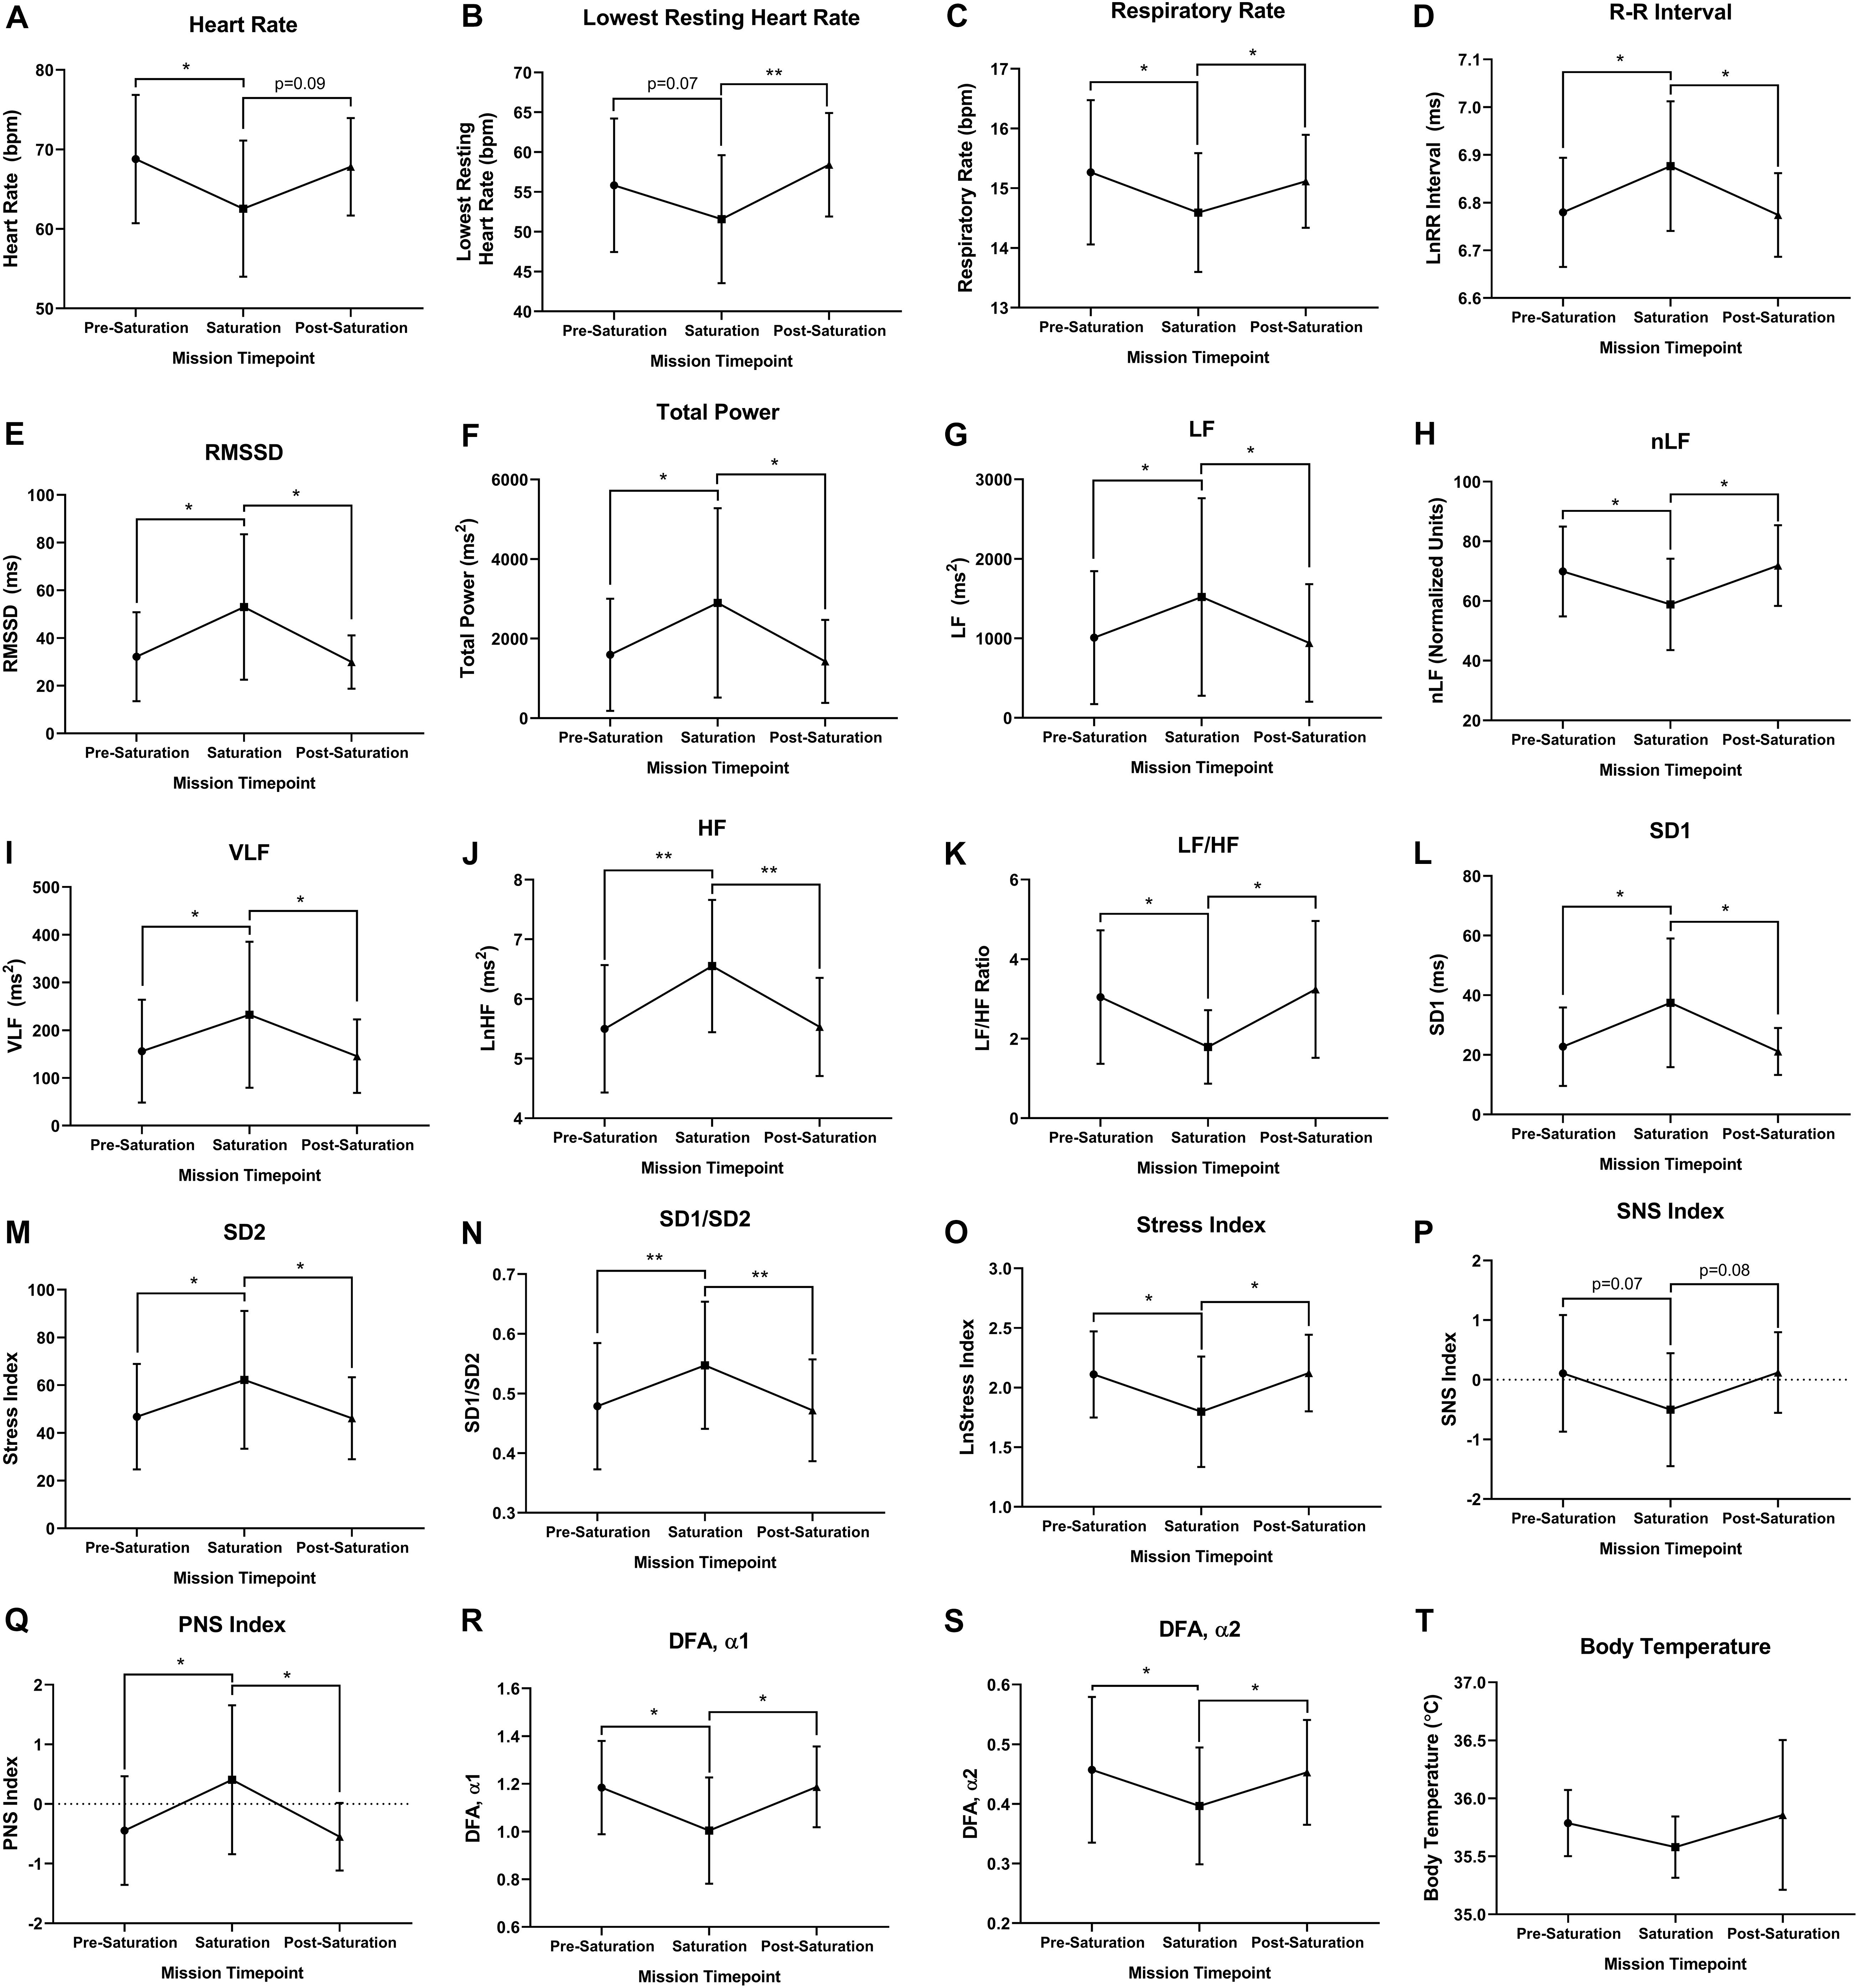
Figure 3. Cardiorespiratory, autonomic, and thermal regulation. (A) Mean and (B) lowest heart rate were quantified via electrocardiography at rest. (C) Respiratory rate was algorithmically determined via beat-by-beat R–R intervals at rest. (D) Autonomic time domain mean R–R intervals and (E) mean Root Mean Square of Successive Differences (RMSSD) were derived from electrocardiography R to R time intervals at rest. R–R intervals were not normally distributed and logarithmically transformed lnRR. (F) Autonomic frequency domain mean Total power, (G) very low frequency (VLF; <0.04 Hz), (H) low frequency (LF; 0.04–0.15 Hz), (I) normalized low frequency [nLF; nLF = (LF/(Total Power-VLF)], (J) high frequency (HF; 0.15–0.4 Hz), and (K) ratio of low frequency to high frequency (LF/HF) were all quantified from resting electrocardiography R to R time intervals at rest. (L) Poincaré perpendicular (SD1), (M) parallel (SD2) standard deviation, and (N) SD1/SD2 were determined via non-linear assessment of heart rate variability by quantitative two-dimensional vector analysis of a Poincaré plot at rest. (O) Short- (DFAα1) and (P) long-term detrended fluctuation analysis (DFAα2) used to analyze non-stationary systems at rest. (Q) Stress, (R) sympathetic nervous system (SNS), and (S) parasympathetic nervous system (PNS) were analyzed as composite metrics of each respective arm of autonomic regulation at rest. (T) Body temperature was gathered via skin thermistor during rest. (A,D–S) N = 7 (male, n = 5; female, n = 2). (B,C,T) N = 6 (male, n = 6) Data: Mean ± SD. RMSSD, Root Mean Square of Successive Differences; VLF, very low frequency; LF, low frequency; nLF, normalized low frequency; HF, high frequency; SD1, Poincaré Perpendicular Standard Deviation; SD2, Poincaré Parallel Standard Deviation; DFAα1, short-term detrended fluctuation analysis; DFAα2, long-term detrended fluctuation analysis; SNS, sympathetic nervous system; PNS, parasympathetic nervous system. *p < 0.05, **p < 0.01. Raw p-values are reported for non-significant changes where p ≤ 0.10.
Peripheral and Cerebrovascular Hemodynamics
Baseline middle cerebral artery velocity (MCAv) when standing significantly decreased 11.8% during saturation compared to pre-saturation (p = 0.017, Figure 4A). The peripheral and cerebrovascular responses during the prone-to-stand protocol are illustrated in Figure 4B and Table 3. Despite no significant differences across timepoints in any variable when prone, there was an overall reduction in blood pressure (MAP and SBP) measures during saturation in 3/3 aquanauts. When assessing the change from prone when in steady-state standing conditions 30 s after the aquanauts stood up, estimated HR (ΔHR) was significantly elevated in saturation compared to pre-saturation (p = 0.005) with similarly elevated, but more variable ΔHR in post-saturation (p = 0.056). There were no significant differences in ΔMAP or ΔMCAv when standing, but there was a 16% reduction in MCAv during saturation compared to only 8% reduction during pre-saturation. There were no significant differences in cerebral autoregulatory index when assessing cerebral autoregulatory response during transition from prone to standing. There were also no differences in the magnitude of the drop in MAP or MCAv across timepoints.
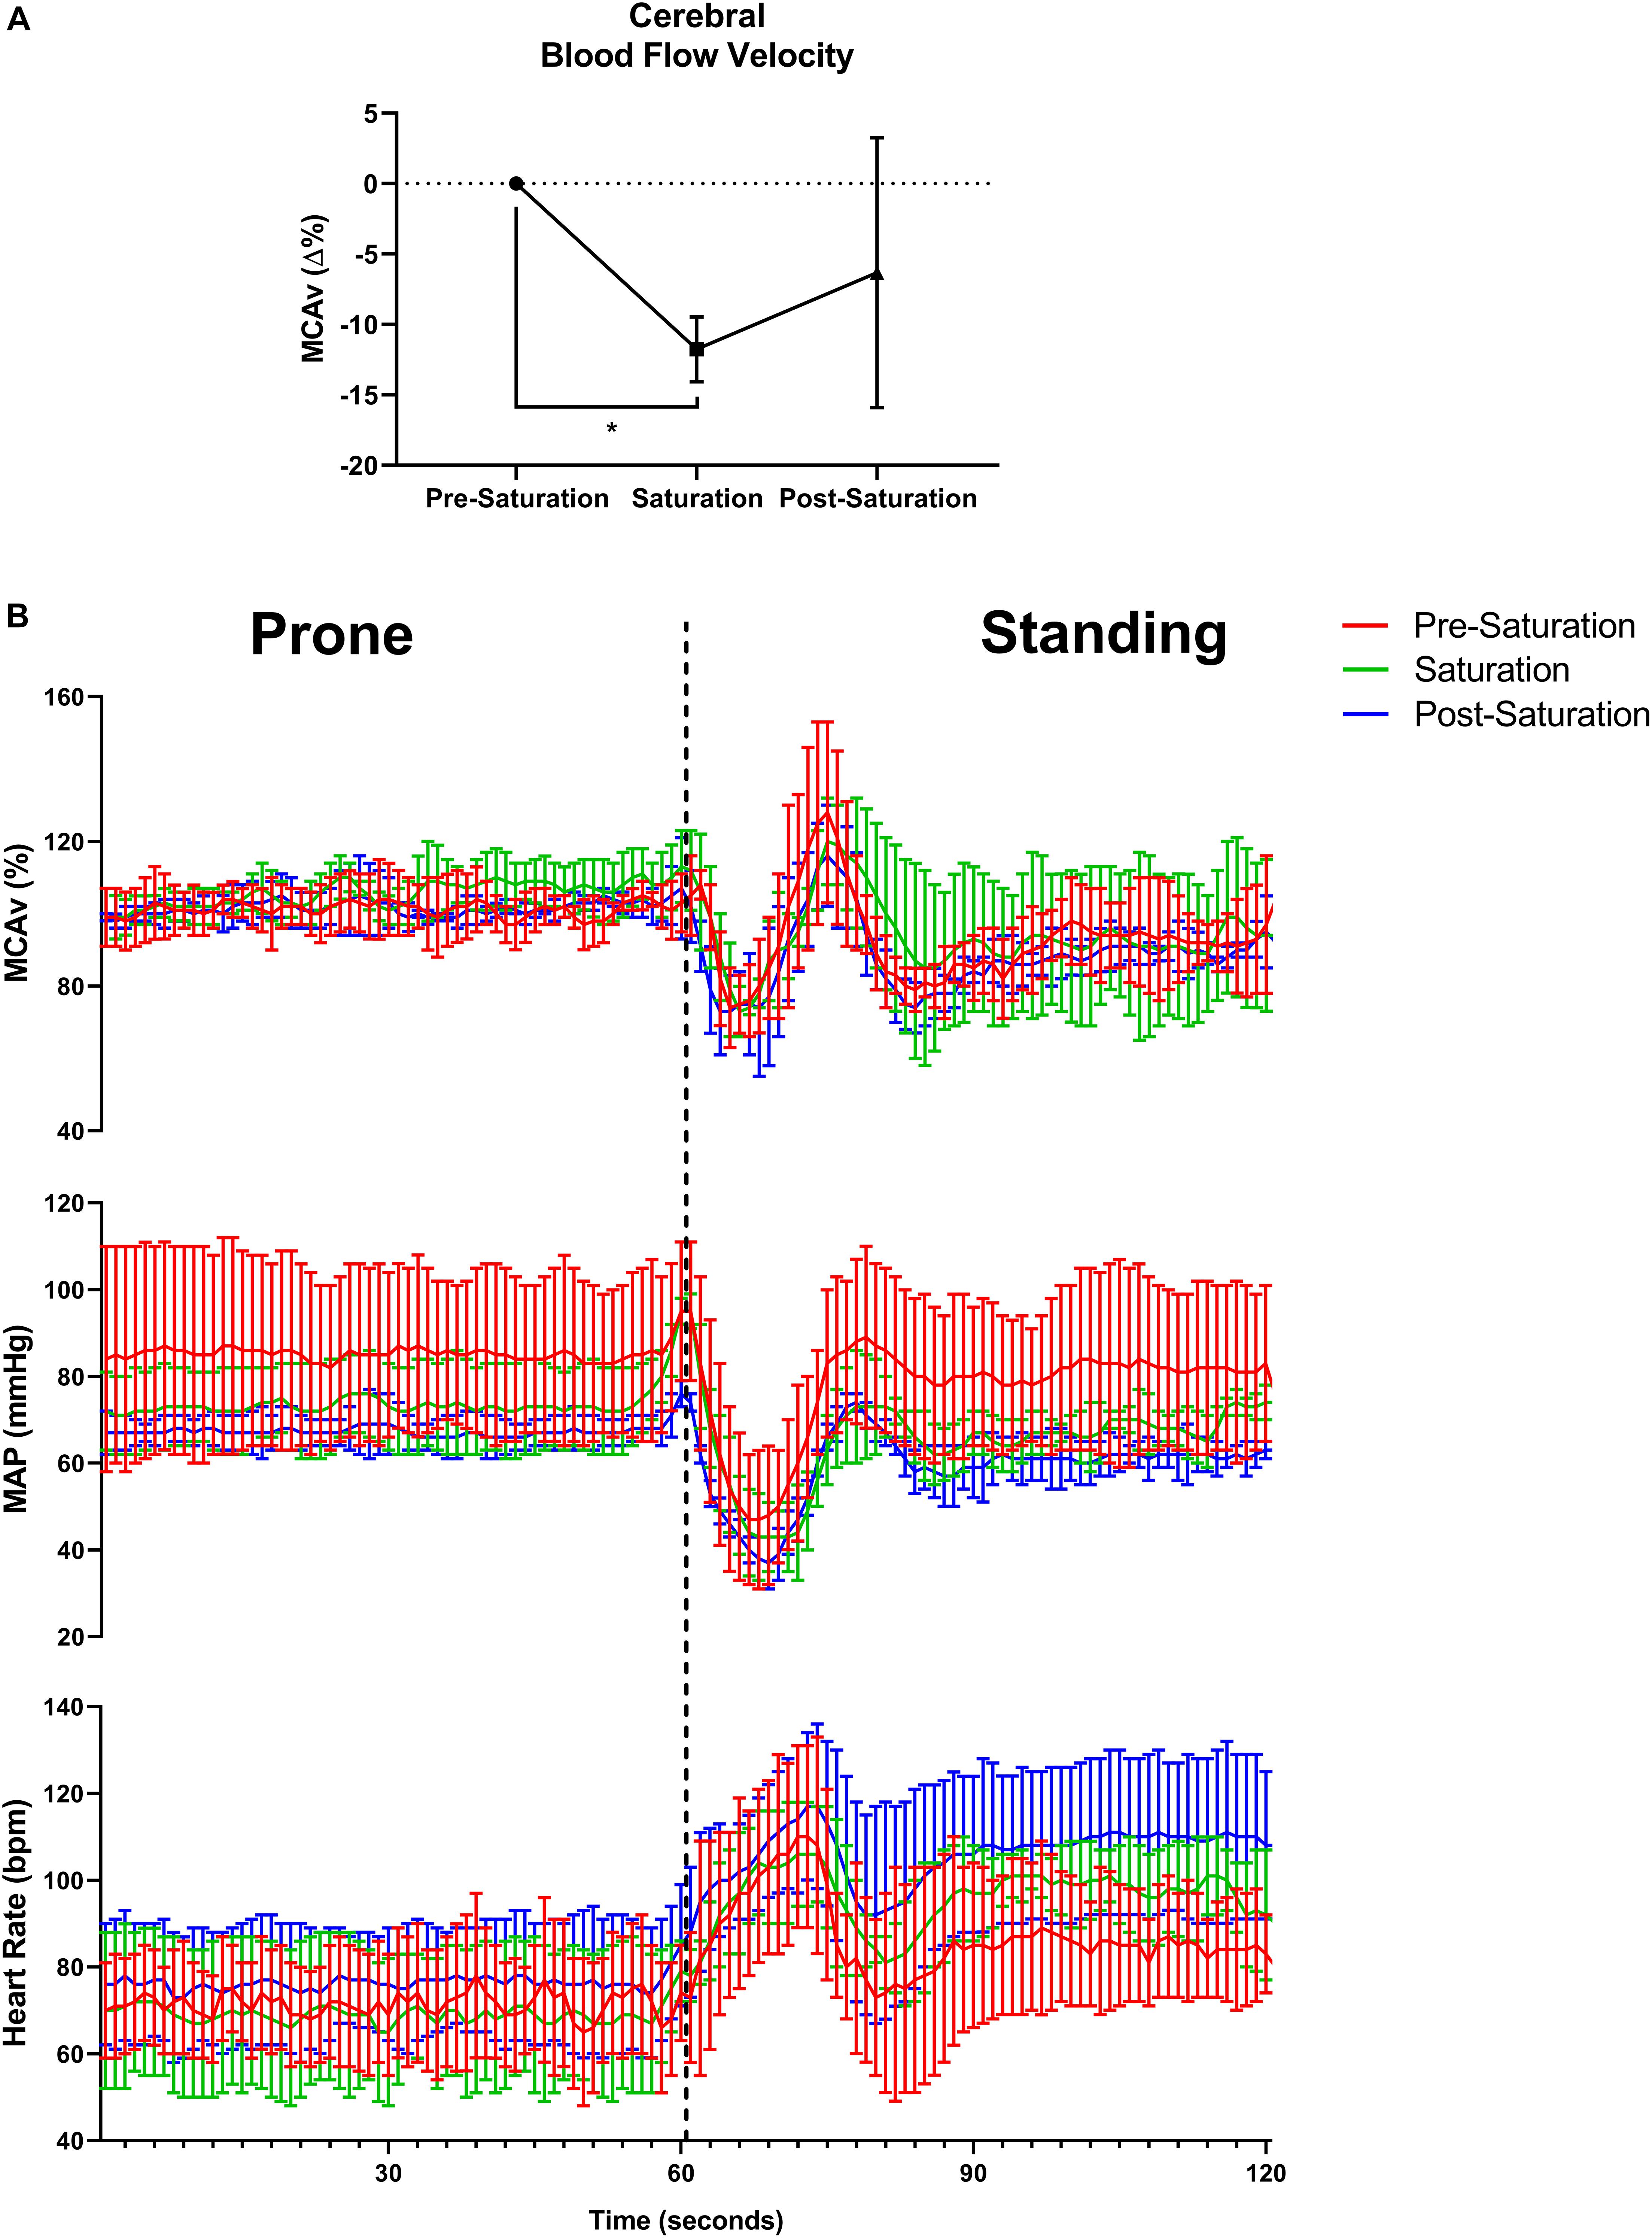
Figure 4. Baseline cerebral blood flow velocity, cerebral autoregulatory and baroreflex responses. (A) Percent change in baseline cerebral blood flow velocity from pre-saturation measured at the middle cerebral artery (MCAv%) across timepoints. N = 4 (male, n = 4). (B) One-second averages of beat-by-beat MCAv, mean arterial pressure (MAP), and estimated heart rate derived from systolic blood pressure peaks during waking prone (lying) position into standing position capturing the cerebral autoregulatory and baroreflex responses. N = 3 (male, n = 3). Data: Mean ± SD. MCAv%, middle cerebral artery velocity percent change; MAP, mean arterial pressure. *p < 0.05.
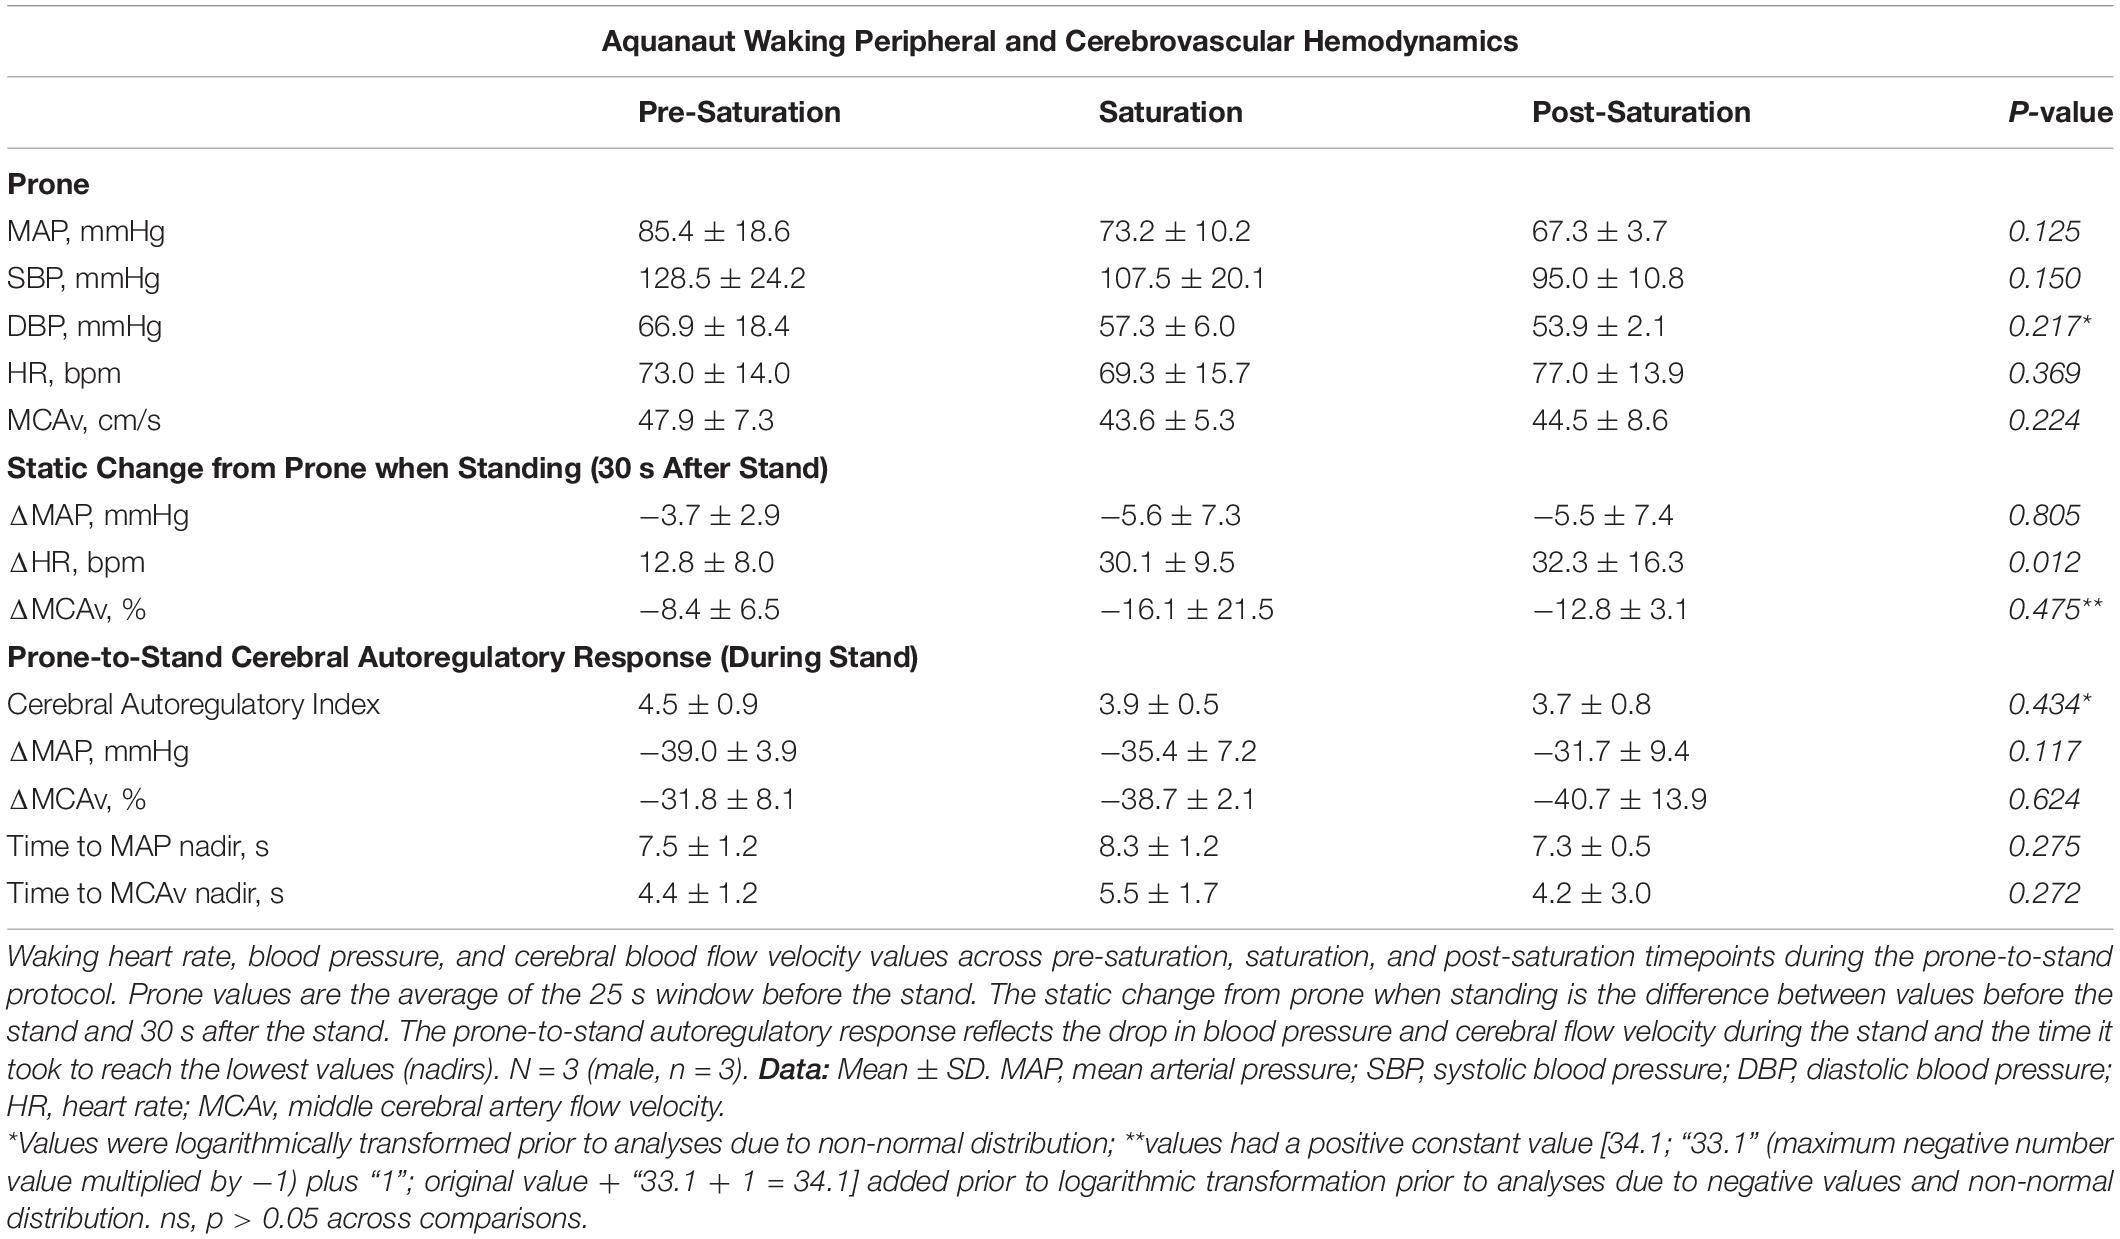
Table 3. Aquanaut waking peripheral and cerebrovascular hemodynamic parameters.
Sleep Quantity and Quality
Objective Sleep
No significant differences were found across sleep parameters between the timepoints (Figures 5A–F). However, sleep latency (p = 0.061) and REM/total (p = 0.093) trended higher during saturation, compared to pre-saturation and post-saturation timepoints. 4/6 aquanauts experienced reduced total sleep along with increased REM and deep/total sleep.
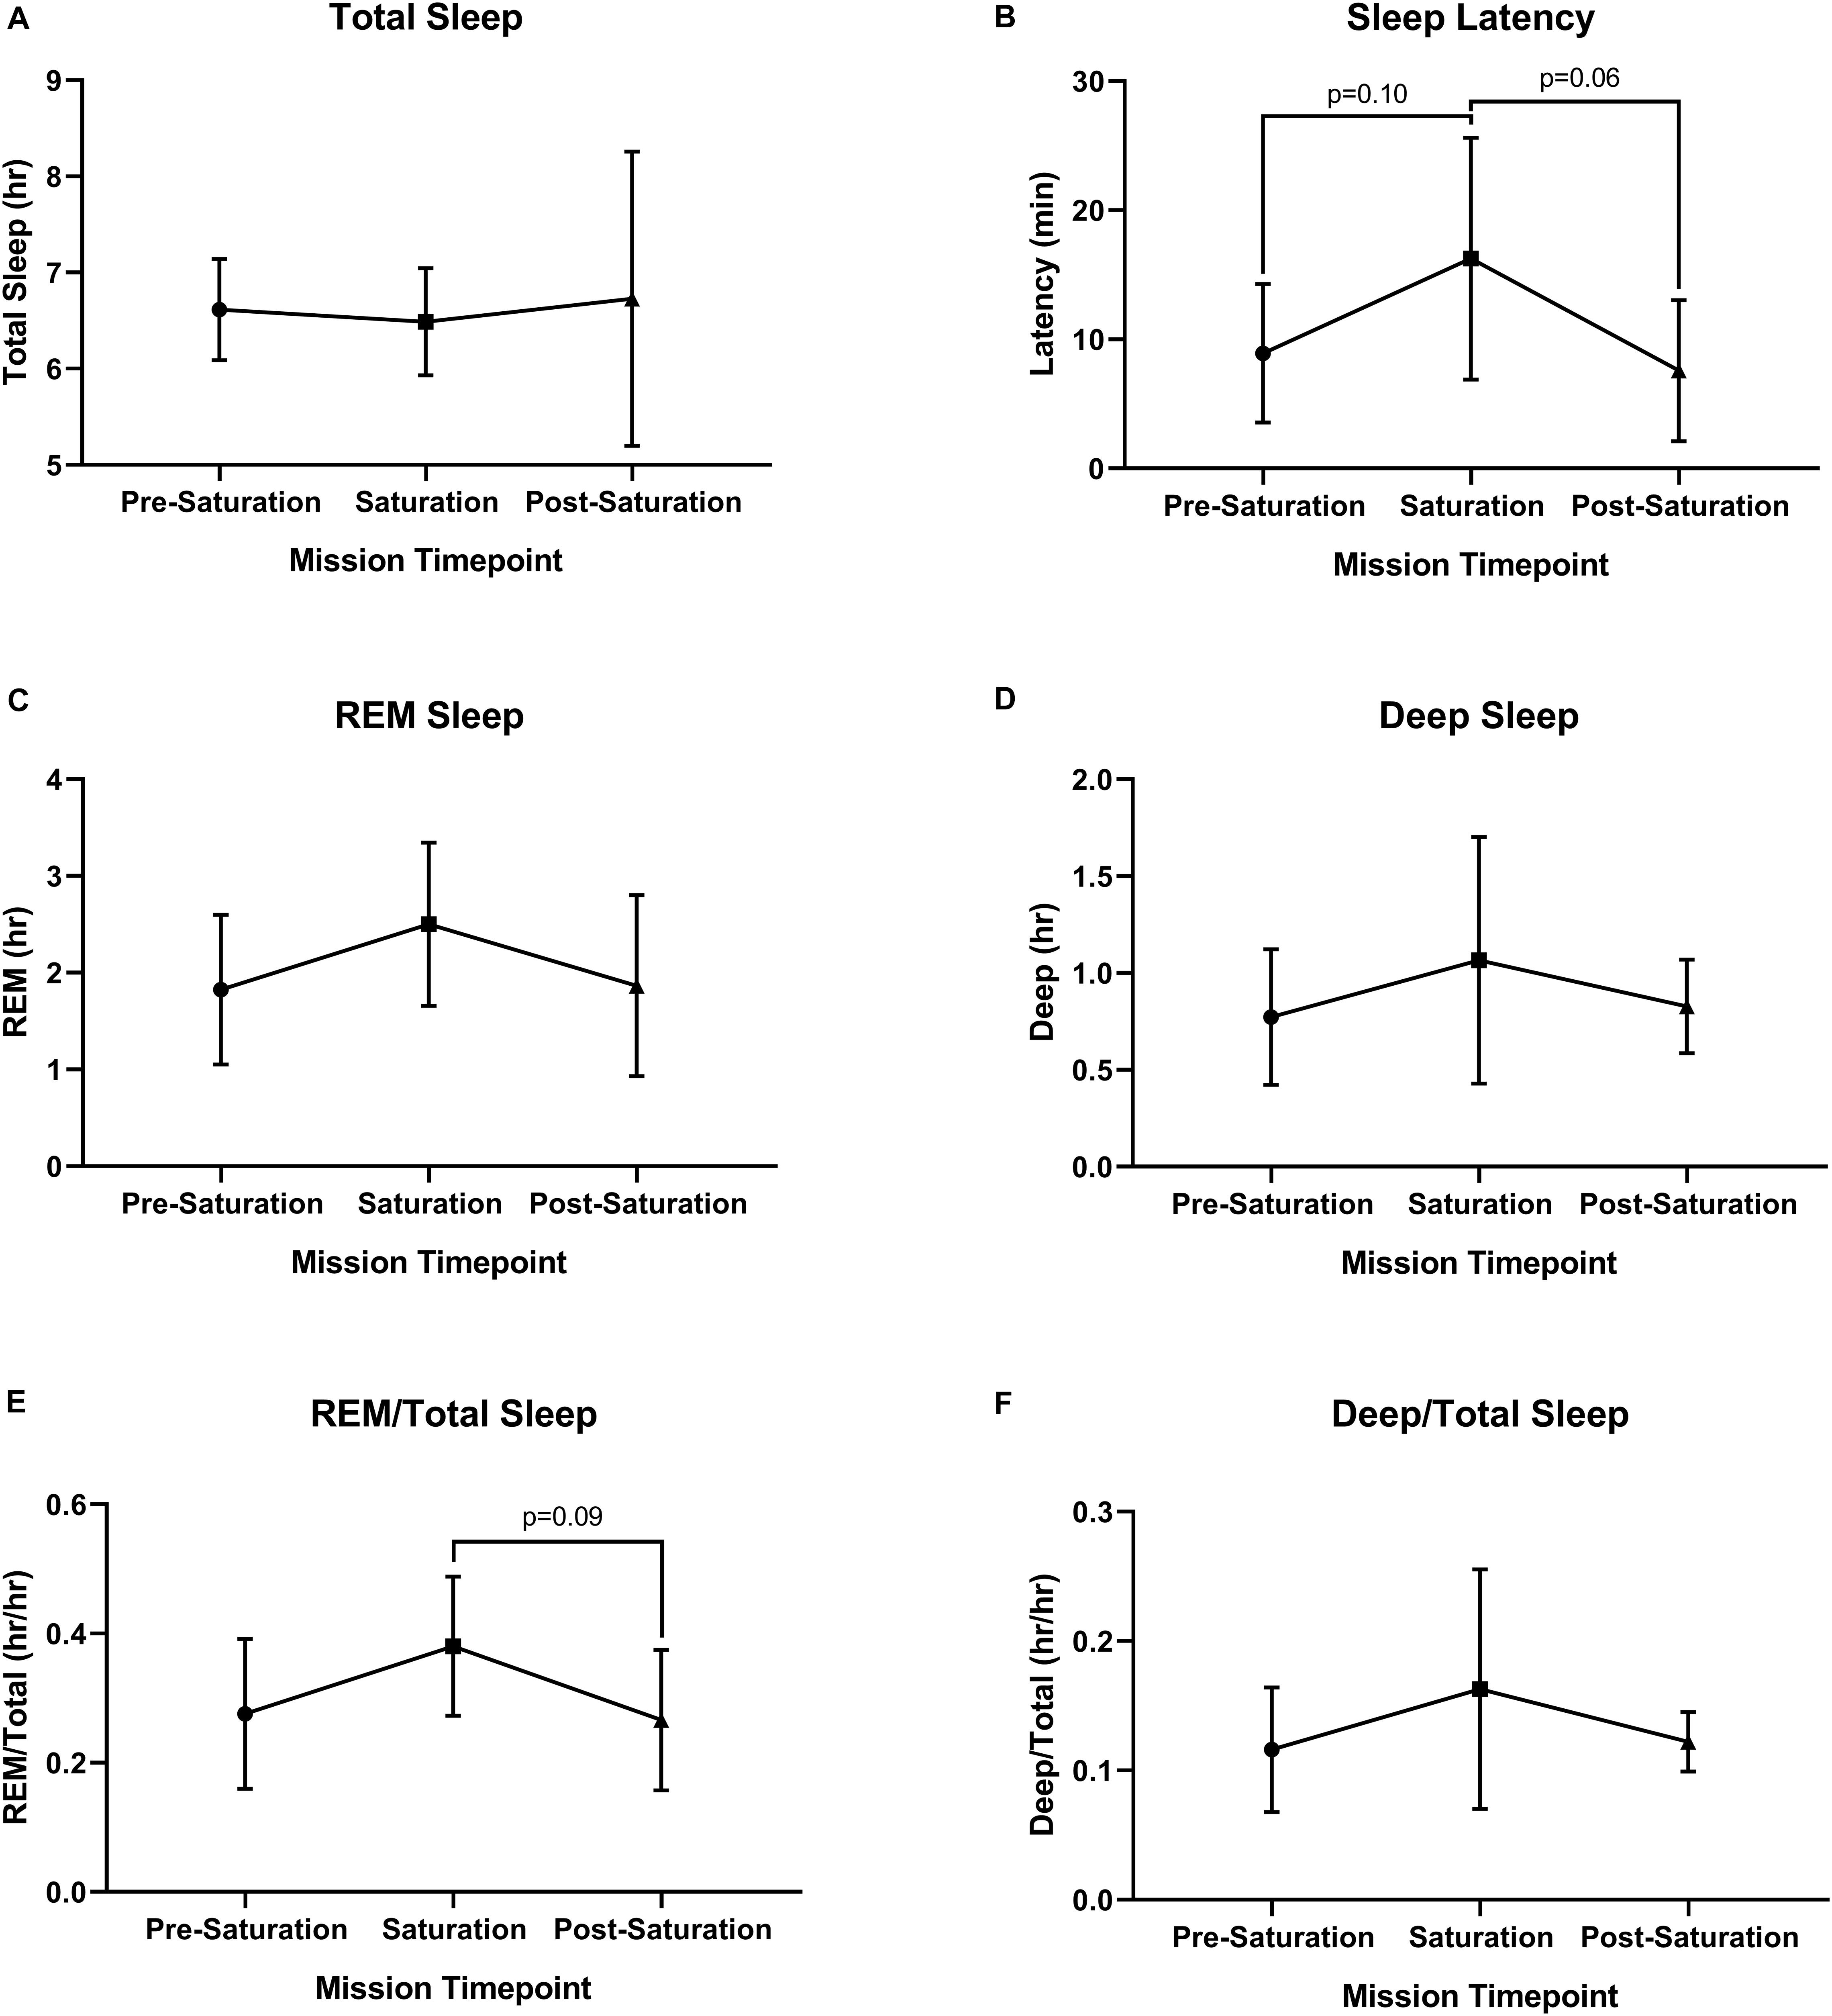
Figure 5. Objective sleep quantity and quality. (A) Total, (B) Latency, (C) Rapid Eye Movement (REM), (D) Deep, (E) ratio of REM to Total Sleep (REM/Total), and (F) ratio of Deep to Total Sleep (Deep/Total) were assessed during rest across timepoints. N = 6 (male, n = 6) Data: Mean ± SD. REM, rapid eye movement. Raw p-values are reported for non-significant changes where p ≤ 0.10.
Subjective Sleep
Aquanauts reported no trouble falling asleep at pre-saturation and saturation, and very mild trouble falling asleep post-saturation (Figure 6A). Total number of sleep disturbances was 1.7, 1.6, and 2.5 at pre-saturation, saturation, and post-saturation timepoints, respectively (Figure 6B). Sleep quality and alertness were moderate throughout all timepoints (Figures 6C,F). Moderate sleeplessness was reported pre-saturation (Figure 6D). Mild sleeplessness was reported during and post-saturation. Very mild pre-mission day fatigue was reported throughout. No significant changes were observed across all subjective sleep parameters (Figure 6).
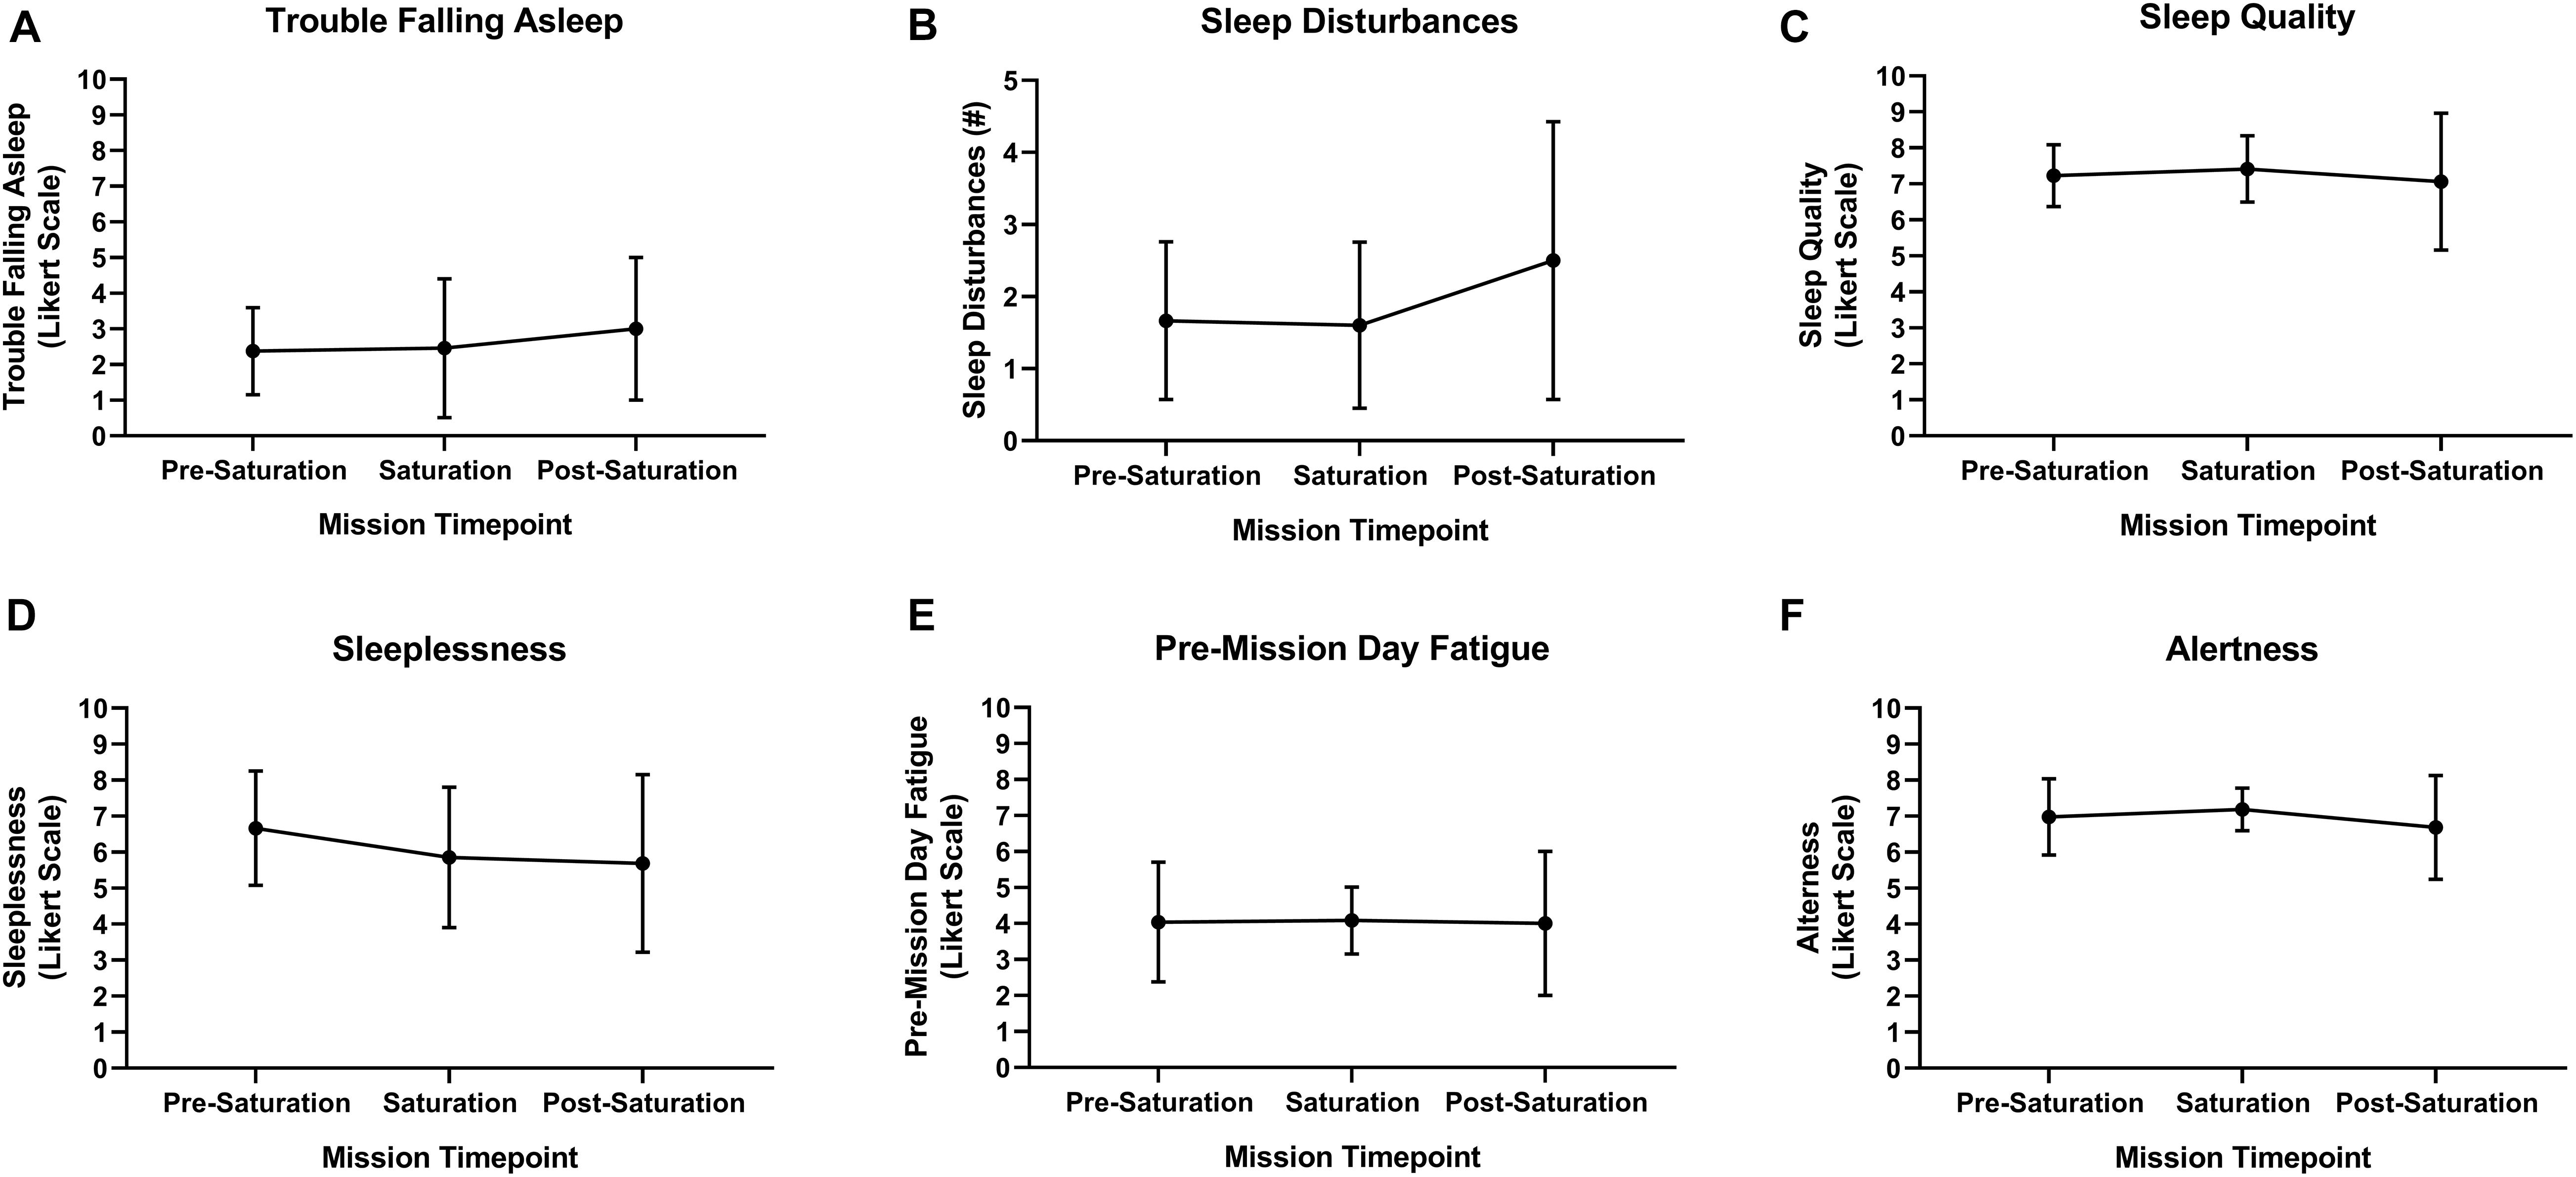
Figure 6. Subject sleep quality. (A) Trouble falling asleep, (B) sleep disturbances, (C) sleep quality, (D) sleeplessness, (E) pre-mission day fatigue, and (F) alertness were subjectively assessed upon waking via sleep diary. N = 8 (male, n = 6; female, n = 2). Data: Mean ± SD.
Body Composition
Aquanauts had significant reductions in bodyweight (−1.3 ± 0.7 kg; p = 0.0004), BMI (−0.5 ± 0.4 kg/m2; p = 0.003), fat mass (−1.7 ± 2.2 kg; p = 0.048), mid-thigh skinfold (−2.0 ± 2.3 mm; p = 0.027), and chest skinfold (−2.5 ± 2.4 mm; p = 0.036; Figures 7A,B,F,I,J). While all remaining peripheral and central circumference and skinfold measurements reduced post-saturation, they were not significantly altered (Figures 7C–E,G,H,K). Fat-free mass and muscle thickness measurements were not significantly altered (Figures 7L–N).
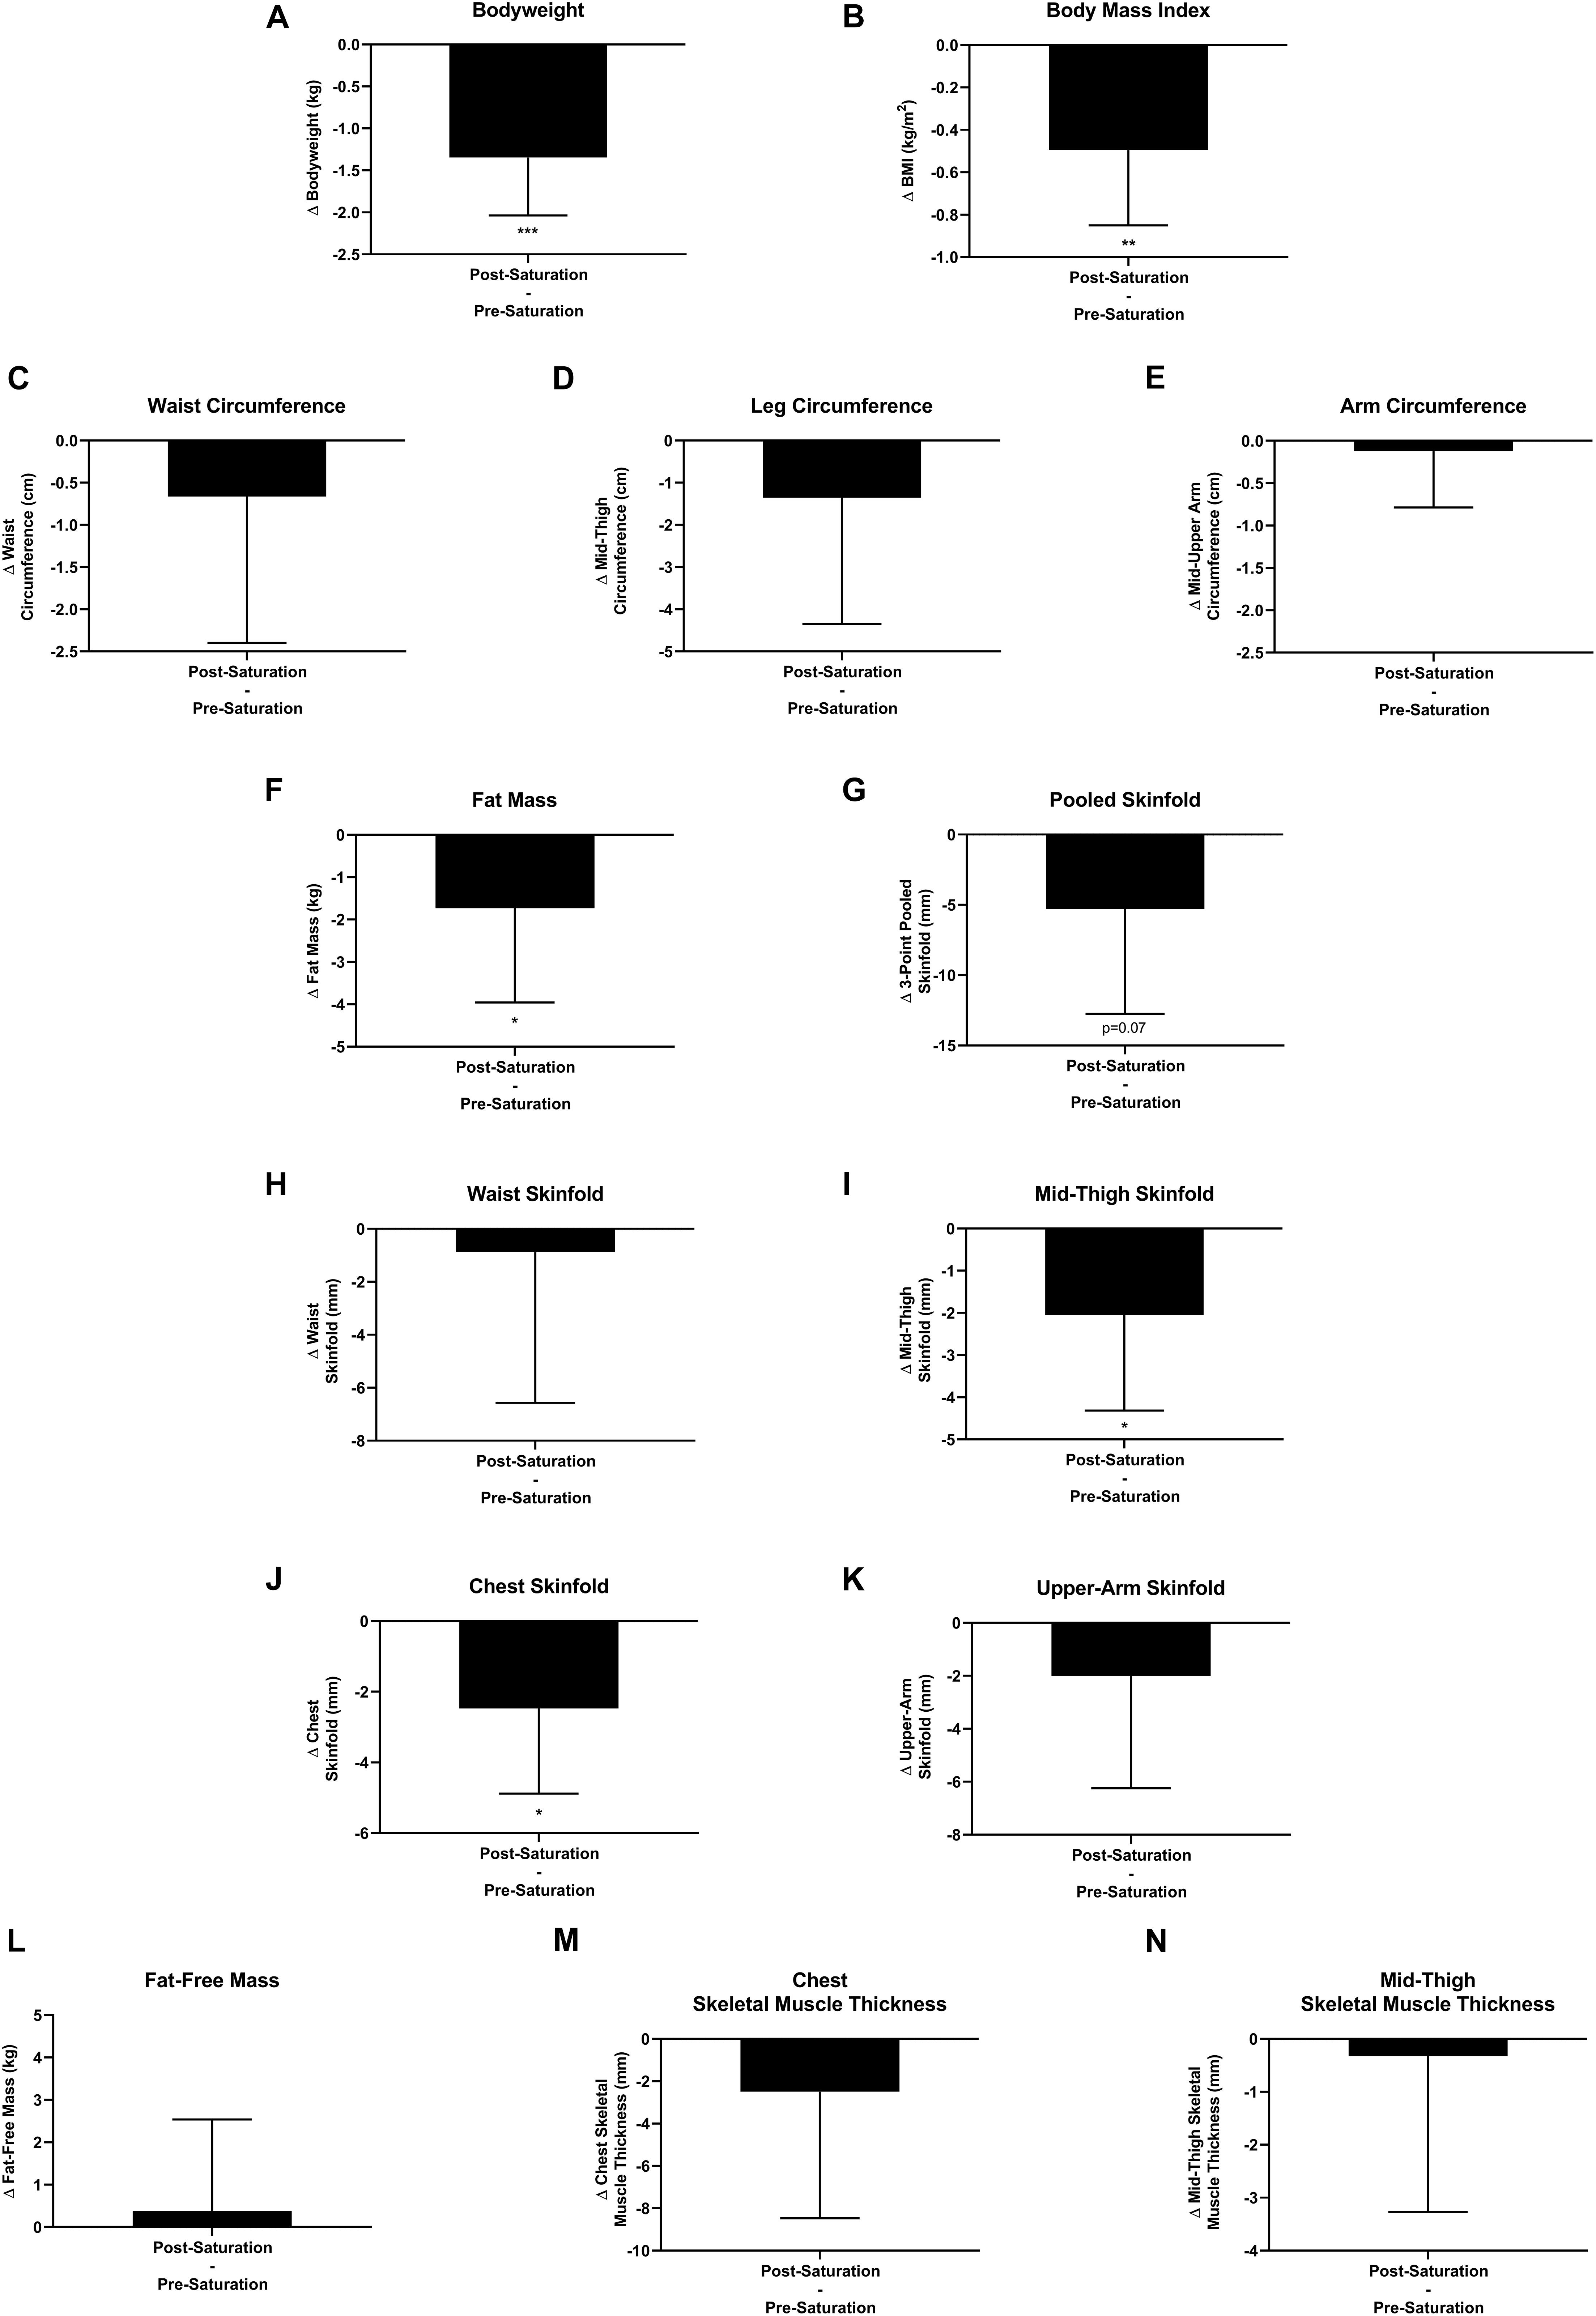
Figure 7. Body composition. Changes (Δ) in (A) body weight, (B) body mass index (BMI), and (C–E) multipoint circumference measurements, (F) fat mass, (G–K) multipoint skinfold, (L) fat-free mass, and (M,N) muscle thickness measurements were assessed pre-saturation and post-saturation. Data: Mean ± SD. (A–L) N = 9 (male, n = 7; female, n = 2). (M,N) N = 6 (male, n = 6). BMI, Body Mass Index. ∗p < 0.05, ∗∗p < 0.01, ∗∗∗p < 0.001. Raw p-values are reported for non-significant changes where p ≤ 0.10.
Discussion
Research into the HBS environmental adaptation response has been largely reliant on the acute setting (<24 h) due to well characterized difficulties and limitations assessing psychological and physiological responses in aqueous and pressurized gas mediums (O’Neal et al., 1965; Pauli and Clapper, 1967; Bayles, 1970; Pauli and Cole, 1970; Anderson and Herrmann, 1971; Nowlis et al., 1972; Buguet, 2007; Tipton, 2016). We found that highly trained aquanaut operators exposed to HBS over 9–10 days in the world’s only undersea laboratory (Smith et al., 2004; Zwart et al., 2009; Strewe et al., 2015; Kim et al., 2018) experienced intrapersonal physical and mental burden, sustained good mood and work satisfaction, decreased HR and respiratory rates, increased parasympathetic and reduced sympathetic modulation, lower cerebral blood flow velocity, intact cerebral autoregulation and maintenance of baroreflex functionality, and losses in systemic bodyweight and adipose tissue. These findings illustrate multiple novel insights into the unique human adaptation in response to multiday HBS. These findings also illustrate that NASA NEEMO multiday HBS acts as an analog to multiday spaceflight via similar highly trained operational population, inherent mission risks and demands, daily task schedule, confined space, psychological stressors, delayed communication medium, EVAs with matched buoyancy and weightlessness, elevated gas exposures, reduced sleep quantity, increased sleep latency, and reduced bodyweight and fat-free mass changes. However, NASA NEEMO HBS is dissimilar to spaceflight as it results in higher pressurized gas exposures, non-continuous microgravity only during EVAs, intact hemodynamics and baroreflex, increased parasympathetic modulation, reduced sympathetic modulation, and adipose tissue atrophy.
Intrapersonal Physical Burden, Mental Burden, Mood and Work Satisfaction
We report that aquanauts experienced intrapersonal and/or mental burden during pre-saturation and saturation timepoints which lowered post-saturation, except for post-mission day fatigue which remained elevated throughout. This psychological assessment confirms the stress experienced during pre-saturation and saturation, in agreement with prior studies in multiday HBS (Bayles, 1970; Nowlis et al., 1972) and extreme environments, such as space flight and microgravity (Kanas and Manzey, 2008; Barrett and Martin, 2014). Interestingly, while intrapersonal physical and mental burden were moderately high pre-saturation and post-saturation, mood and work satisfaction remained high throughout, paralleling short duration (13 days) spaceflight and bed rest (15 days) evaluations where astronauts and participants were able to maintain high positive mood and work satisfaction regardless of mission or study stressors, respectively (Lichao et al., 2014; Liu et al., 2016). Interestingly, socially isolating environments in combination with sleep deprivation for as short as 72 h has been shown to increase metrics of fatigue and negatively influence psychology and mood. Thus, the observed maintenance of good mood and work satisfaction in aquanauts, even with elevated fatigue, may be attributable, at least in part, to altered sleep quality. This bidirectional influence of psychological and physiological parameters is well established (Biddle, 2008), and has also been elucidated in space flight and analogs, as positive mood was associated with adaptive catecholamine and neurotransmitter response during a 500-day space flight simulation (Wang et al., 2014; Bartone et al., 2018). Unique to AURL is the saturated environment with elevated gas pressures and resulting increased circulating gas PP’s (Table 2). While subjects did not reach hyperoxia based on the Undersea Hyperbaric Medical Society classification of 1.4ATA at 100% O2 (1.4 PPO2), subjects were still exposed to elevated levels over a 9 or 10-day period, > 2.34x the typical amount of O2 and N2 inhaled. While not assessed in the present analyses, one of the few reports in multiday HBS confirmed the elevations in inflammatory and nitrogen/oxidative stress (RNOS) in this setting (Smith et al., 2004; Strewe et al., 2015). This is in line with the predicted consequences from elevated exposure to O2 likely uncoupled to cellular respiration and consequently shuttled to RNOS generation, commonly reported in the HBS environment (Dean and D’Agostino, 2008; Ciarlone et al., 2019). While oxidative stress has not been causally linked to psychological changes, it is associated with a number of psychological disorders and is hypothesized to be a facilitative aspect of psychological adaptations (Salim, 2014). Additionally, elevated PN2 and PCO2 have psychological impacts (Kirkland and Cooper, 2019; Patel et al., 2020). Interestingly, we did not observe any subjective elevations in intrapersonal physical burden, mental burden, mood, or work satisfaction within the saturated environment compared to pre-saturation. However, we cannot exclude that pre-selection of “psychologically fit,” highly trained populations (aquanauts) who may be uniquely equipped with “psychological counter measures,” may have influenced these subjective outcomes. Prior studies have found qualified and pre-selected operators were able to mitigate behavior and performance declines in an extreme environment for a similar duration (≤14 days) (Palinkas, 2001; Bartone et al., 2018). None the less, these results serve to confirm the intrapersonal physical and mental burden of NASA NEEMO training and execution before and after HBS, even though mood and work satisfaction remained good throughout, in accordance with prior HBS and other environmental extremes.
Cardiac, Respiratory, Autonomic, Thermic, and Hemodynamic Regulation
We observed that resting HR and respiratory rate were significantly depressed within multiday HBS. Lower HR and respiratory rate are both in line with reports in acute HBS environments (Adamiec, 1977; Goyal et al., 2020). While HR and respiration have been historically evaluated in multiday HBS using wrist pulse measurements, they were never compared across controlled timepoints or using overlapping objective analytic techniques, limiting interpretation and understanding in adaptive response (Bayles, 1970; Pauli and Cole, 1970). While skin temperature did not significantly deviate across timepoints, 5/6 aquanauts observed a reduction in skin temperature during saturation which is in line with the reduced metabolic rate driven by changes in cardiac, respiratory, temperature, and hemodynamic regulation. The most likely mechanism of reduced HR, respiratory rate, and skin temperature is an increase in vagal modulation. However, we cannot exclude possible alterations in cardiac efficiency and QT prolongation. Additionally, while evidence remains sparse, elevated PPN2 has been suggested to act as a beta-blocker, which may play a contributing role in the reduced HR at rest due to inherent elevations in PPN2 in AURL saturated environment. Lower respiratory rate may also be explained, in part, by the elevated airway resistance and respiratory muscle fatigue from inhaled gas density, but this has not been confirmed at atmospheric pressures < 6ATA (Dean and D’Agostino, 2008).
Increased parasympathetic and suppressed sympathetic modulation was confirmed by numerous metrics including time-domain (R–R intervals and RMSSD), frequency domain (nLF, HF, and LF/HF), Poincaré plot/non-linear (short-term autonomic regulation: SD1; long-term autonomic regulation: SD2), detrended fluctuation (DFA, α1 and DFA, α2) and composite metric (Stress and PNS Index) analyses. While LF was elevated, elevations in both LF and VLF are likely explained by increased global autonomic modulation in saturation, as LF controlled for total power (nLF) along with LF/HF were both decreased. These findings are in line with current evidence in acute HBS environment which have been shown to stimulate vagal modulation, reduced HR, and increased R–R interval variability and HF (Goyal et al., 2020). The increased vagal modulation in acute saturated environments has been attributed to both elevated O2 and increased pressure (independent of O2) (Lund et al., 1999). Mechanisms for this vagal responsiveness have been ascribed to vagal outflow compensating for O2 and/or pressure induced vasoconstriction (baroreflex), increased cardiac efficiency due to elevated PPO2 exposure in cardiac tissue, prolonged Q-T interval, and/or carotid chemoreflex inhibition (Demchenko et al., 2013; Paula-Ribeiro et al., 2019; Goyal et al., 2020).
Hemodynamic analyses revealed significant reductions in baseline cerebral blood flow velocity during saturation. Reductions in cerebral blood flow have also been observed in acute HBS (Omae et al., 1998) and hyperoxia in humans (Miller et al., 1970; Demchenko et al., 2000; Watson et al., 2000; Calvert et al., 2007). Reductions in cerebral blood flow are likely, in part, explained by the increased O2 availability in multiday HBS to cerebral and systemic tissues reducing tissue-driven blood flow demands. In support of this, Omae et al. (1998) found that the decreases in cerebral blood flow during 2 and 4 ATA were not due to increases in atmospheric pressure, but rather due to hyperoxemia. Our finding of reduced cerebral blood flow could also be explained by hypercapnia, but cerebral blood flow was also found reduced in hyperbaric O2 despite no change in arterial PCO2 (Omae et al., 1998). We did observe intact cerebral autoregulation as shown by the reduction in MAP but return of MCAv prior to the return of MAP during the prone-to-stand protocol. Although autoregulatory index was slightly reduced, the decrease in index was <1, which likely indicates a preserved cerebral autoregulatory mechanism, similar to previous studies examining autoregulation during hyperoxia (Nishimura et al., 2007; Ainslie et al., 2008). To our knowledge, cerebral autoregulation has not been investigated previously in hyperbaric conditions and the effects of higher gas pressures on the mechanism is unclear. We also observed a functional baroreflex response, primary mediator of cardiovascular and autonomic alterations to acute HBS exposure in model systems (Demchenko et al., 2013), as indicated by prone to standing reduced MAP and increased HR, similar to observations in acute saturation (Goyal et al., 2020).
Starting during early spaceflight (2–3 weeks) all the way to post spaceflight, HR and respiratory rate have been shown to progressively elevate over time (Xu et al., 2013), which is different from our observed depression and recovery of HR and respiratory rate during, and after multiday HBS, respectively. Body temperature has also been reported to be progressively elevated during spaceflight by up to 1°C (Stahn et al., 2017), another distinction from the 0.2°C reduction in skin temperature seen in the current study. Additionally, it has also been shown that various parameters of parasympathetic modulation decrease (SDRR, RMSSD, HF), while sympathetic parameters increase (LF/HF), during spaceflight at rest over similar exposure timeline to environmental stressors. Additionally, global autonomic modulation has been demonstrated to be repressed while α-DFA was unchanged in spaceflight, both different from what we observed in the multiday HBS detailed here. These observations in spaceflight (Fritsch-Yelle et al., 1994; Xu et al., 2013; Mandsager et al., 2015) are also in line with spaceflight simulation that investigated head-down bed rest, where parasympathetic modulation is consistently lowered (Crandall et al., 1994; Hughson et al., 1994; Sigaudo et al., 1996). One critical difference in physiologic stressors from spaceflight to the multiday HBS environment is gravitational impact on vascular flow and subsequent cardiac reactivity (baroreflex) (Fritsch-Yelle et al., 1994; Eckberg et al., 2010; Mandsager et al., 2015). We demonstrate that baroreflex sensitivity remains intact in the multiday HBS environment. Due to the critical nature of baroreflex across physiologic parameters, along with the critical nature of baroreflex ascribed to the autonomic regulation seen in acute HBS conditions (Demchenko et al., 2013), the altered hemodynamic function, subsequent baroreflex, and autonomic disruptions in microgravity provides the strongest rational for the inherent differences observed in multiday HBS versus the microgravitational extreme environment. Lastly, we confirmed the validity of the OURA ring device, which was able to accurately gather physiological recordings in accordance with the previously validated Polar V800 (HR and RMSSD; Supplementary Figure S1). Together, these findings demonstrate reduced HR, respiratory rate, skin temperature, and blood pressure likely explained by the intact baroreflex and global autonomic increase in parasympathetic and reduced sympathetic modulation in HBS. Additionally, our findings show reduced cerebral blood flow velocity and intact cerebral autoregulation, which may be explained by the increased O2 availability in HBS. These results demonstrate numerous similarities with acute HBS but are in stark contrast to adaptive responses observed in differential environmental extremes.
Sleep Quantity and Quality
Aquanauts experienced increased trends in sleep latency and sleep quality (REM and deep sleep; Figure 5) during saturation. These changes in total sleep quantity and latency are likely explained by the increased stress of the mission HBS environments. However, the improvements in REM and deep sleep may be influenced by the increase in cardiac and autonomic recovery metrics (increased parasympathetic modulation, lower average and resting HR). These findings agree with observations made in sea level HBS chambers pressurized to simulate 20 m depth for 7 days where participants observed reduced total sleep quantity, increased sleep latency, and increased fatigue (Seo et al., 1999). However, subjects exposed to a prolonged duration of HBS for 60 days experienced increased total sleep and REM (Pauli and Cole, 1970; Buguet, 2007). We observed no changes in subjective sleep, as aquanauts reported moderately high sleep quality and alertness, as well as very mild pre-mission day fatigue, but with mild to moderate sleeplessness. This indicates that changes in objective sleep metrics do not necessarily parallel reported, subjective sleep evaluations. Sleep disturbances have been observed across various extreme environments (Buguet, 2007). Microgravitational space flight has been reported to reduce sleep duration and prolong sleep latency (Buguet, 2007; Barger et al., 2014), similar to our observations. However, subject sleep quality and alertness, as well as REM sleep have been reported to be reduced during spaceflight (Barger et al., 2014; Wu et al., 2018), illustrating differences between space flight and HBS.
Body Composition
Aquanauts’ habituated to HBS for 9–10 days experienced weight loss (1.35 ± 0.23 kg) resulting from losses in systemic adipose tissue without detectable changes across muscle tissue metrics. While adipose tissue and skeletal muscle adaptations to multiday HBS have not been previously reported, bodyweight alone has been previously demonstrated to decrease by 2, 1.38, and 1.36 kg after 10, 45, and 60 days of saturation, respectively (Pauli and Clapper, 1967; Pauli and Cole, 1970; Zwart et al., 2009). Taken together, these four HBS studies suggest that the bodyweight adaptations likely occur within 10 days and subsequently stabilize. However, we cannot exclude the possibility for tissue composition change to progress for greater than 10 days. When comparing body composition changes in our analyses to other environmental extremes, the adaptive responses to bodyweight and fat-free mass appear to be similar across HBS, microgravity, and altitude for analyses of similar duration.
Acute and/or multiday body composition adaptations to other extreme environmental conditions have been previously described (Dunnwald et al., 2019; Laurens et al., 2019; Winnard et al., 2019). Microgravitational spaceflight or microgravity-modeled bed rest, has been shown to induce skeletal muscle and bone mineral density atrophy attributed to multiday mechanical underloading (disuse atrophy) (Laurens et al., 2019; Winnard et al., 2019). Observations across bed rest studies demonstrate modest effects on muscle function as early as 7 days. However, modest changes in muscle size (volume and cross sectional area) were not observed until 14 days (Winnard et al., 2019). Similarly, we also did not observe significant changes in muscle size within the less than a 14-day period of HBS exposure. Less investigation has been conducted on microgravity’s impact on adipose tissue because of the inherent abundance of such tissue. However, adipose tissue loss has been previously reported following space flight and bed-rest, where exercise (as a counter measure to combat muscle atrophy) was employed (Laurens et al., 2019). Of note, bed-rest participants allowed ad libitum food intake without exercise had unchanged fat mass (Blanc et al., 1998; Bergouignan et al., 2010). Conversely, bed-rest participants allowed ad libitum food intake with exercise had progressive adipose tissue atrophy (Bergouignan et al., 2010). Consequently, these prior studies suggest that adipose tissue loss in microgravity is driven by increased physical activity, not by microgravity itself. This demonstrates a clear discrepancy in tissue adaptation in the present observation of adipose tissue loss in HBS. Altitude has also been shown to induce adaptive changes in body composition (Dunnwald et al., 2019). A recent meta-analysis on altitude exposure details adaptive reductions in bodyweight, fat mass, and fat-free mass. However, like other environmental extremes, these tissue changes appear to be influenced by multiple factors including altitude level, length of exposure, physical activity, and alterations in nutritional status. In line with our findings, altitude exposure ≤ 10 days have commonly reported bodyweight and adipose tissue loss (Dunnwald et al., 2019), which appear progressive with prolonged exposure (Dunnwald et al., 2019; Laurens et al., 2019; Winnard et al., 2019). In disagreement with this hypothesis is the near identical weight loss observed in our study and longer HBS exposures (Pauli and Clapper, 1967; Pauli and Cole, 1970; Zwart et al., 2009). Together, these results demonstrate weight loss resulting from systemic adipose tissue loss without changes in muscle tissue.
Limitations
While NASA NEEMO provides one of the only research environments to evaluate hyperbaric habituation over multiple days and is an ideal space flight mission analog replicating the mission demands, strict laboratory conditions across some study parameters (indicated in each section) were unrealistic due to NASA NEEMO ecological research environment and the prioritization of safe mission completion. Additionally, mission logistics and safety inherently limited participant n in data measurements, analyses, and at times, an ability to drawing meaningful statistical conclusions. Not all parameters had equal distribution of males and females, limiting extrapolation of findings across sexes. While NASA NEEMO 22 and 23 were analogous in hyperbaric exposure, mission design, and mission demands, minor difference in saturation length (NASA NEEMO 22: 10-day saturation; NASA NEEMO 23: 9-day saturation), EVA exposures, and daily mission tasks were observed. In some instances, individual data points and sub-cohort analyses could not be reported to ensure compliance with NASA LSAH privacy policy.
Conclusion
Aquanauts living at HBS for 9–10 days during NASA NEEMO 22 and 23 experienced intrapersonal physical and mental burden, sustained good mood and work satisfaction, decreased HR and respiratory rates, increased parasympathetic and reduced sympathetic modulation, lower cerebral blood flow velocity, intact cerebral autoregulation and maintenance of baroreflex functionality, and losses in systemic bodyweight and adipose tissue. Together, these findings illustrate multiple novel insights into the unique human adaptation response to multiday HBS with clear overlap and distinction between other environmental extremes. Future studies should include the exploration of the molecular bases for these multi-component changes, and how these adaptations affect human response across other parameters of operational performance (Ari et al., 2020a,b,c).
Data Availability Statement
Datasets presented in this article are not publicly available. NASA IRB protocol required the reporting of mean data sets, not individual subject data points. Requests to access the datasets should be directed to AK, YWtvdXRuaWtAaWhtYy5vcmc= or YWtvdXRuaWtAdXNmLmVkdQ==.
Ethics Statement
The studies involving human participants were reviewed and approved by Institute for Human and Machine Cognition, John Hopkins University, National Aeronautics and Space Agency, and/or European Space Agency IRB(s). The patients/participants provided their written informed consent to participate in this study.
Author Contributions
AK, MF, CA, AP, JS, and DD led mission organization, development and implementation. All the authors were involved in mission organization, development and implementation, reviewed, revised, and approved final manuscript draft, agreed to accuracy and integrity of manuscript. AK led survey experimental design, sleep experimental design, sleep data processing, body composition data processing, and body composition experimental design and developed the original manuscript draft. AK and SM led survey data acquisition and processing. AK and MS-G led cardiorespiratory and autonomic experimental design and data acquisition. AK, MS-G, and BG led autonomic data processing. MF and JS led hemodynamic experimental design. MF, BS, and JS led hemodynamic data acquisition. MF, AK, and BS led hemodynamic data processing. AK, SM, and MM led sleep data acquisition. AK, KN, SM, JD, and CR led body composition data acquisition. AK, MF, and MS-G led statistical analyses. All authors contributed to the article and approved the submitted version.
Funding
This study was supported by Ketone Technologies LLC and NASA Human Research Program Grant (NNX10AO19G).
Conflict of Interest
The authors declare that this study received funding from Ketone Technologies LLC. Ketone Technologies LLC is an entity which supports research on extreme environments for which CA and DD serve as CEO and CSO, respectively. CA and DD received no personal compensation for these studies and were involved in project development, logistical implementation, and final manuscript development. These interests have been reviewed and managed by NASA in accordance with its Institutional and Individual Conflict of Interest policies.
The remaining authors declare that the research was conducted in the absence of any commercial or financial relationships that could be construed as a potential conflict of interest.
Acknowledgments
We would like to thank participating aquanauts. We would like to thank Bill Todd, Marc Reagan, Kristen Todd, Dawn Kernagis, Marc O’Griofa, NASA NEEMO Administration, FIU AURL, and remaining support staff for their continual technical and logistical assistance. We would like to thank Jay Dean and Geoff Ciarlone for discussion on HBS. We would like to thank Harpreet, Hannu Kinnunen, and the OURA team for providing OURA rings and/or mission support. We would like to thank Polar for providing V800 watches and H7 chest strap. We would also like to thank Chad Dolan and Eric Trexler for discussion revolving muscle thickness assessment.
Supplementary Material
The Supplementary Material for this article can be found online at: https://www.frontiersin.org/articles/10.3389/fphys.2020.610000/full#supplementary-material
Abbreviations
ATA, Atmospheres Absolute/Barometric Pressure; AURL, Aquarius Undersea Research Laboratory; BMD, bone mineral density; BMI, body mass index; CO2, carbon dioxide; DFA α 1, short-term detrended fluctuation analysis; DFA α 2, long-term detrended fluctuation analysis; DBP, diastolic blood pressure; EVAs, extravehicular activities; HBS, hyperbaric and/or saturated; HF, high-frequency; HR, heart rate; JSC, NASA Johnson Space Center; LF, low frequency; MAP, mean arterial pressure; MCAv, middle cerebral artery flow velocity; MCAv%, middle cerebral artery velocity percent change; NASA, National Aeronautic Space Agency; NEEMO, National Aeronautic Space Agency Extreme Environment Mission Operation; N2, nitrogen; Nu, normalized units; nLF, normalized low frequency; O2, oxygen; PP, partial pressure; PNS, parasympathetic nervous system; REM, rapid eye movement; RMSSD, Root Mean Square of Successive Differences; RNOS, reactive nitrogen and oxygen species; RR Interval, Mean R–R Interval; SBP, systolic blood pressure; SD1, Poincaré Perpendicular, Standard Deviation; SD2, Poincaré Parallel, Standard Deviation; SNS, sympathetic nervous system; VLF, very low frequency.
References
Aaslid, R., Markwalder, T. M., and Nornes, H. (1982). Noninvasive transcranial Doppler ultrasound recording of flow velocity in basal cerebral arteries. J. Neurosurg. 57, 769–774. doi: 10.3171/jns.1982.57.6.0769
Adamiec, L. (1977). Effect of hyperbaric oxygen therapy on some basic vital functions. Acta Physiol. Pol. 28, 215–224.
Ainslie, P. N., Ogoh, S., Burgess, K., Celi, L., McGrattan, K., Peebles, K., et al. (2008). Differential effects of acute hypoxia and high altitude on cerebral blood flow velocity and dynamic cerebral autoregulation: alterations with hyperoxia. J. Appl. Physiol. 104, 490–498. doi: 10.1152/japplphysiol.00778.2007
Anderson, D. G., and Herrmann, H. G. (1971). Technical Report - Seafloor Foundations: Analysis of Case Histories. Port Hueneme, CA: Naval Civil Engineering Laboratory.
Ari, C. S., D’Agostino, D. P., Bharwani, S., Rehsi, A., Moss, S., Schmer-Galunder, S., et al. (2020c). Changes in Motor Function in Response to Living in an Extreme Underwater Saturation Environment under High Stress and Increased Workload. FASEB J. 34:9603. doi: 10.1096/fasebj.2020.34.s1.09603
Ari, C., Bharwani, S., Rehsi, A., Moss, S., Schmer-Galunder, S., Fiore, S., et al. (2020a). Changes in Sensory Functions in Response to Living in an Extreme Underwater Saturation Environment. FASEB J. 34:9604. doi: 10.1096/fasebj.2020.34.s1.09604
Ari, C., D’Agostino, D. P., Bharwani, S., Rehsi, A., Moss, S., Schmer-Galunder, S., et al. (2020b). Changes in Individual and Team Cognition in High Stress Extreme Underwater Saturation Environment Under Intense Workload. FASEB J. 34:9601. doi: 10.1096/fasebj.2020.34.s1.09601
Ari, C., Koutnik, A. P., DeBlasi, J., Landon, C., Rogers, C. Q., Vallas, J., et al. (2019). Delaying latency to hyperbaric oxygen-induced CNS oxygen toxicity seizures by combinations of exogenous ketone supplements. Physiol. Rep. 7:e13961. doi: 10.14814/phy2.13961
Barger, L. K., Flynn-Evans, E. E., Kubey, A., Walsh, L., Ronda, J. M., Wang, W., et al. (2014). Prevalence of sleep deficiency and use of hypnotic drugs in astronauts before, during, and after spaceflight: an observational study. Lancet Neurol. 13, 904–912. doi: 10.1016/S1474-4422(14)70122-X
Barrett, E. C., and Martin, P. (2014). Extreme: Why some people thrive at the limits. Oxford: Oxford University Press.
Bartone, P. T., Krueger, G. P., and Bartone, J. V. (2018). Individual Differences in Adaptability to Isolated, Confined, and Extreme Environments. Aerosp. Med. Hum. Perform. 89, 536–546. doi: 10.3357/AMHP.4951.2018
Bayles, J. J. (1970). Salvage Work Projects Sealab III. Port Hueneme, CA: Naval Civil Engineering Laboratory.
Bergouignan, A., Momken, I., Schoeller, D. A., Normand, S., Zahariev, A., Lescure, B., et al. (2010). Regulation of energy balance during long-term physical inactivity induced by bed rest with and without exercise training. J. Clin. Endocrinol. Metab. 95, 1045–1053. doi: 10.1210/jc.2009-1005
Blanc, S., Normand, S., Ritz, P., Pachiaudi, C., Vico, L., Gharib, C., et al. (1998). Energy and water metabolism, body composition, and hormonal changes induced by 42 days of enforced inactivity and simulated weightlessness. J. Clin. Endocrinol. Metab. 83, 4289–4297. doi: 10.1210/jcem.83.12.5340
Buguet, A. (2007). Sleep under extreme environments: effects of heat and cold exposure, altitude, hyperbaric pressure and microgravity in space. J. Neurol. Sci. 262, 145–152. doi: 10.1016/j.jns.2007.06.040
Calvert, J. W., Cahill, J., and Zhang, J. H. (2007). Hyperbaric oxygen and cerebral physiology. Neurol. Res. 29, 132–141. doi: 10.1179/016164107X174156
Caminal, P., Sola, F., Gomis, P., Guasch, E., Perera, A., Soriano, N., et al. (2018). Validity of the Polar V800 monitor for measuring heart rate variability in mountain running route conditions. Eur. J. Appl. Physiol. 118, 669–677. doi: 10.1007/s00421-018-3808-0
Ciarlone, G. E., Hinojo, C. M., Stavitzski, N. M., and Dean, J. B. (2019). CNS function and dysfunction during exposure to hyperbaric oxygen in operational and clinical settings. Redox Biol. 27:101159. doi: 10.1016/j.redox.2019.101159
Crandall, C. G., Engelke, K. A., Pawelczyk, J. A., Raven, P. B., and Convertino, V. A. (1994). Power spectral and time based analysis of heart rate variability following 15 days head-down bed rest. Aviat. Space Environ. Med. 65, 1105–1109.
D’Agostino, D. P., Pilla, R., Held, H. E., Landon, C. S., Puchowicz, M., Brunengraber, H., et al. (2013). Therapeutic ketosis with ketone ester delays central nervous system oxygen toxicity seizures in rats. Am. J. Physiol. Regul. Integr. Comp. Physiol. 304, R829–R836. doi: 10.1152/ajpregu.00506.2012
de Zambotti, M., Rosas, L., Colrain, I. M., and Baker, F. C. (2017). The Sleep of the Ring: Comparison of the OURA Sleep Tracker Against Polysomnography. Behav. Sleep Med. 17, 124–136. doi: 10.1080/15402002.2017.1300587
Dean, J. B., and D’Agostino, D. P. (2008). “Pressure Effects on Human Physiology,” in Physiology and Medicine of Hyperbaric Oxygen Therapy, eds S. R. Thom and T. S. Neuman (Amsterdam: Elsevier).
Demchenko, I. T., Boso, A. E., Bennett, P. B., Whorton, A. R., and Piantadosi, C. A. (2000). Hyperbaric oxygen reduces cerebral blood flow by inactivating nitric oxide. Nitric Oxide 4, 597–608. doi: 10.1006/niox.2000.0313
Demchenko, I. T., Zhilyaev, S. Y., Moskvin, A. N., Krivchenko, A. I., Piantadosi, C. A., and Allen, B. W. (2013). Baroreflex-mediated cardiovascular responses to hyperbaric oxygen. J. Appl. Physiol. 115, 819–828. doi: 10.1152/japplphysiol.00625.2013
Dunnwald, T., Gatterer, H., Faulhaber, M., Arvandi, M., and Schobersberger, W. (2019). Body Composition and Body Weight Changes at Different Altitude Levels: A Systematic Review and Meta-Analysis. Front. Physiol. 10:430. doi: 10.3389/fphys.2019.00430
Eckberg, D. L., Halliwill, J. R., Beightol, L. A., Brown, T. E., Taylor, J. A., and Goble, R. (2010). Human vagal baroreflex mechanisms in space. J. Physiol. 588(Pt 7), 1129–1138. doi: 10.1113/jphysiol.2009.186650
Finley, J. P., and Nugent, S. T. (1995). Heart rate variability in infants, children and young adults. J. Auton Nerv. Syst. 51, 103–108. doi: 10.1016/0165-1838(94)00117-3
Fritsch-Yelle, J. M., Charles, J. B., Jones, M. M., Beightol, L. A., and Eckberg, D. L. (1994). Spaceflight alters autonomic regulation of arterial pressure in humans. J. Appl. Physiol. 77, 1776–1783. doi: 10.1152/jappl.1994.77.4.1776
Giles, D., Draper, N., and Neil, W. (2016). Validity of the Polar V800 heart rate monitor to measure RR intervals at rest. Eur. J. Appl. Physiol. 116, 563–571. doi: 10.1007/s00421-015-3303-9
Gisselman, A. S., D’Amico, M., and Smoliga, J. M. (2020). Optimizing Intersession Reliability of Heart Rate Variability-The Effects of Artifact Correction and Breathing Type. J. Strength. Cond. Res. 34, 3199–3207. doi: 10.1519/jsc.0000000000002258
Goto, M., Nagashima, M., Baba, R., Nagano, Y., Yokota, M., Nishibata, K., et al. (1997). Analysis of heart rate variability demonstrates effects of development on vagal modulation of heart rate in healthy children. J. Pediatr. 130, 725–729. doi: 10.1016/s0022-3476(97)80013-3
Goyal, A., Chonis, T., and Cooper, J. S. (2020). Hyperbaric Cardiovascular Effects. Treasure Island: StatPearls.
Griofa, M. O., Blue, R. S., Cohen, K. D., and O’Keeffe, D. T. (2011). Sleep stability and cognitive function in an Arctic Martian analogue. Aviat. Space Environ. Med. 82, 434–441. doi: 10.3357/asem.2570.2011
Herzig, D., Eser, P., Radtke, T., Wenger, A., Rusterholz, T., Wilhelm, M., et al. (2017). Relation of Heart Rate and its Variability during Sleep with Age, Physical Activity, and Body Composition in Young Children. Front. Physiol. 8:109. doi: 10.3389/fphys.2017.00109
Hughson, R. L., Yamamoto, Y., Blaber, A. P., Maillet, A., Fortrat, J. O., Pavy-LeTraon, A., et al. (1994). Effect of 28-day head-down bed rest with countermeasures on heart rate variability during LBNP. Aviat. Space Environ. Med. 65, 293–300.
Jackson, A. S., and Pollock, M. L. (1985). Practical Assessment of Body Composition. Phys. Sportsmed. 13, 76–90. doi: 10.1080/00913847.1985.11708790
Jawabri, K. H., and Raja, A. (2020). Physiology, Sleep Patterns. Treasure Island: StatPearls Publishing.
Kanas, N., and Manzey, D. (2008). Space Psychology and Psychiatry. Cham: Microcosm Press and Springer.
Kim, K. J., Gimmon, Y., Sorathia, S., Beaton, K. H., and Schubert, M. C. (2018). Exposure to an extreme environment comes at a sensorimotor cost. NPJ Microgravity 4:17. doi: 10.1038/s41526-018-0051-2
Kirkland, P. J., and Cooper, J. S. (2019). Nitrogen Narcosis In Diving. Treasure Island, FL: StatPearls.
Laurens, C., Simon, C., Vernikos, J., Gauquelin-Koch, G., Blanc, S., and Bergouignan, A. (2019). Revisiting the Role of Exercise Countermeasure on the Regulation of Energy Balance During Space Flight. Front. Physiol. 10:321. doi: 10.3389/fphys.2019.00321
Law, J., Van Baalen, M., Foy, M., Mason, S. S., Mendez, C., Wear, M. L., et al. (2014). Relationship between carbon dioxide levels and reported headaches on the international space station. J. Occup. Environ. Med. 56, 477–483. doi: 10.1097/JOM.0000000000000158
Li, K., Rüdiger, H., and Ziemssen, T. (2019). Spectral Analysis of Heart Rate Variability: Time Window Matters. Front. Neurol. 10:545. doi: 10.3389/fneur.2019.00545
Lichao, X., Cheng, T., Yihan, J., Renlai, Z., and Shanguang, C. (2014). Effects of 45 Days -6°Head-down Bed Rest on Males’ Frontal Alpha Asymmetry and Emotion. Acta Psychol. Sinica 46, 942–950. doi: 10.3724/sp.J.1041.2014.00942
Liu, Q., Zhou, R. L., Zhao, X., Chen, X. P., and Chen, S. G. (2016). Acclimation during space flight: effects on human emotion. Mil. Med. Res. 3:15. doi: 10.1186/s40779-016-0084-3
Lund, V. E., Kentala, E., Scheinin, H., Klossner, J., Helenius, H., Sariola-Heinonen, K., et al. (1999). Heart rate variability in healthy volunteers during normobaric and hyperbaric hyperoxia. Acta Physiol. Scand. 167, 29–35. doi: 10.1046/j.1365-201x.1999.00581.x
Maijala, A., Kinnunen, H., Koskimaki, H., Jamsa, T., and Kangas, M. (2019). Nocturnal finger skin temperature in menstrual cycle tracking: ambulatory pilot study using a wearable Oura ring. BMC Womens Health 19:150. doi: 10.1186/s12905-019-0844-9
Malik, M. (1996). Heart rate variability: standards of measurement, physiological interpretation and clinical use. Task Force of the European Society of Cardiology and the North American Society of Pacing and Electrophysiology. Circulation 93, 1043–1065.
Mandsager, K. T., Robertson, D., and Diedrich, A. (2015). The function of the autonomic nervous system during spaceflight. Clin. Auton Res. 25, 141–151. doi: 10.1007/s10286-015-0285-y
Miller, J. D., Ledingham, I. M., and Jennett, W. B. (1970). Effects of hyperbaric oxygen on intracranial pressure and cerebral blood flow in experimental cerebral oedema. J. Neurol. Neurosurg. Psychiatry 33, 745–755. doi: 10.1136/jnnp.33.6.745
Nishimura, N., Iwasaki, K., Ogawa, Y., and Shibata, S. (2007). Oxygen administration, cerebral blood flow velocity, and dynamic cerebral autoregulation. Aviat. Space Environ. Med. 78, 1121–1127. doi: 10.3357/asem.2177.2007
Nowlis, D. P., Wortz, E. C., and Watters, H. (1972). Tektite II: Habilability Research Program. Los Angeles, CA: NASA.
O’Griofa, M., O’Keeffe, D., Rai, B., Thomas, R., and Cohen, K. (2013). “Sleep Stability and Cognitive Function in Operational Extreme Environments,” in 84th Annual Scientific Meeting of the Aerospace Medical Association, (Chicago: ASMA).
Omae, T., Ibayashi, S., Kusuda, K., Nakamura, H., Yagi, H., and Fujishima, M. (1998). Effects of high atmospheric pressure and oxygen on middle cerebral blood flow velocity in humans measured by transcranial Doppler. Stroke 29, 94–97. doi: 10.1161/01.str.29.1.94
O’Neal, H. A., Bond, G., Lanphear, R., and Odum, T. (1965). Project Sealab Summary Report: An Experimental Eleven-Day Undersea Satuation Dive at 193 Feet. Washington D C: Office Of Naval Research.
Palinkas, L. A. (2001). Psychosocial issues in long-term space flight: overview. Gravit. Space Biol. Bull. 14, 25–33.
Patel, S., Miao, J. H., and Majmundar, S. H. (2020). Physiology, Carbon Dioxide Retention. Treasure Island, FL: StatPearls.
Paula-Ribeiro, M., Ribeiro, I. C., Aranda, L. C., Silva, T. M., Costa, C. M., Ramos, R. P., et al. (2019). Carotid chemoreflex activity restrains post-exercise cardiac autonomic control in healthy humans and in patients with pulmonary arterial hypertension. J. Physiol. 597, 1347–1360. doi: 10.1113/JP277190
Pauli, D. C., and Clapper, G. P. (1967). Project Sealab Report: An Experimental 45-Day Undersea Saturation Dive at 205 Feet. Washington DC: United States Government Publishing Office.
Pauli, D. C., and Cole, H. A. (1970). Project Tektite I: A Multiagency 60-Day Saturated Dive. Arlington: Office of Naval Research.
Pendergast, D. R., Moon, R. E., Krasney, J. J., Held, H. E., and Zamparo, P. (2015). Human Physiology in an Aquatic Environment. Compr. Physiol. 5, 1705–1750. doi: 10.1002/cphy.c140018
Poff, A. M., Kernagis, D., and D’Agostino, D. P. (2016). Hyperbaric Environment: Oxygen and Cellular Damage versus Protection. Compr. Physiol. 7, 213–234. doi: 10.1002/cphy.c150032
Salim, S. (2014). Oxidative stress and psychological disorders. Curr. Neuropharmacol. 12, 140–147. doi: 10.2174/1570159X11666131120230309
Sanchez-Gonzalez, M. A., and Figueroa, A. (2013). Cold exposure attenuates post exercise cardiovagal reactivation and sympathetic withdrawal. Auton Neurosci. 176, 95–97. doi: 10.1016/j.autneu.2013.02.002
Schmidt, P. K., and Carter, J. E. (1990). Static and dynamic differences among five types of skinfold calipers. Hum. Biol. 62, 369–388.
Seo, Y., Matsumoto, K., Park, Y., Mohri, M., and Matsuoka, S. (1999). Sleep patterns during 20-m nitrox saturation dives. Psychiatry Clin. Neurosci. 53, 125–127. doi: 10.1046/j.1440-1819.1999.00507.x
Sigaudo, D., Fortrat, J. O., Maillet, A., Allevard, A. M., Pavy-Le Traon, A., Hughson, R. L., et al. (1996). Comparison of a 4-day confinement and head-down tilt on endocrine response and cardiovascular variability in humans. Eur. J. Appl. Physiol. Occup. Physiol. 73, 28–37. doi: 10.1007/bf00262806
Smith, S. M., Davis-Street, J. E., Fesperman, J. V., Smith, M. D., Rice, B. L., and Zwart, S. R. (2004). Nutritional status changes in humans during a 14-day saturation dive: the NASA Extreme Environment Mission Operations V project. J. Nutr. 134, 1765–1771. doi: 10.1093/jn/134.7.1765
Stahn, A. C., Werner, A., Opatz, O., Maggioni, M. A., Steinach, M., von Ahlefeld, V. W., et al. (2017). Increased core body temperature in astronauts during long-duration space missions. Sci. Rep. 7:16180. doi: 10.1038/s41598-017-15560-w
Strewe, C., Crucian, B. E., Sams, C. F., Feuerecker, B., Stowe, R. P., Chouker, A., et al. (2015). Hyperbaric hyperoxia alters innate immune functional properties during NASA Extreme Environment Mission Operation (NEEMO). Brain Behav. Immun. 50, 52–57. doi: 10.1016/j.bbi.2015.06.017
Taylor, N., and Cotter, J. (2006). Heat adaptation: guidelines for the optimisation of human performance. Int. Sport Med. 7, 33–57.
Tiecks, F. P., Lam, A. M., Aaslid, R., and Newell, D. W. (1995). Comparison of static and dynamic cerebral autoregulation measurements. Stroke 26, 1014–1019. doi: 10.1161/01.str.26.6.1014
Tipton, M. J. (2016). Environmental extremes: origins, consequences and amelioration in humans. Exp. Physiol. 101, 1–14. doi: 10.1113/EP085362
Utter, A. C., and Hager, M. E. (2008). Evaluation of ultrasound in assessing body composition of high school wrestlers. Med. Sci. Sports Exerc. 40, 943–949. doi: 10.1249/MSS.0b013e318163f29e
Wagner, D. R. (2013). Ultrasound as a tool to assess body fat. J. Obes. 2013:280713. doi: 10.1155/2013/280713
Wang, Y., Jing, X., Lv, K., Wu, B., Bai, Y., Luo, Y., et al. (2014). During the long way to Mars: effects of 520 days of confinement (Mars500) on the assessment of affective stimuli and stage alteration in mood and plasma hormone levels. PLoS One 9:e87087. doi: 10.1371/journal.pone.0087087
Watson, N. A., Beards, S. C., Altaf, N., Kassner, A., and Jackson, A. (2000). The effect of hyperoxia on cerebral blood flow: a study in healthy volunteers using magnetic resonance phase-contrast angiography. Eur. J. Anaesthesiol. 17, 152–159. doi: 10.1046/j.1365-2346.2000.00640.x
Webb, P. (1995). The physiology of heat regulation. Am. J. Physiol. 268(4 Pt 2), R838–R850. doi: 10.1152/ajpregu.1995.268.4.R838
Williams, D., Kuipers, A., Mukai, C., and Thirsk, R. (2009). Acclimation during space flight: effects on human physiology. CMAJ 180, 1317–1323. doi: 10.1503/cmaj.090628
Winnard, A., Scott, J., Waters, N., Vance, M., and Caplan, N. (2019). Effect of Time on Human Muscle Outcomes During Simulated Microgravity Exposure Without Countermeasures-Systematic Review. Front. Physiol. 10:1046. doi: 10.3389/fphys.2019.01046
Wu, B., Wang, Y., Wu, X., Liu, D., Xu, D., and Wang, F. (2018). On-orbit sleep problems of astronauts and countermeasures. Mil. Med. Res. 5:17. doi: 10.1186/s40779-018-0165-6
Xu, D., Shoemaker, J. K., Blaber, A. P., Arbeille, P., Fraser, K., and Hughson, R. L. (2013). Reduced heart rate variability during sleep in long-duration spaceflight. Am. J. Physiol. Regul. Integr. Comp. Physiol. 305, R164–R170. doi: 10.1152/ajpregu.00423.2012
Keywords: NASA, hyperbaric (underwater), extreme environment, adaptation, saturation
Citation: Koutnik AP, Favre ME, Noboa K, Sanchez-Gonzalez MA, Moss SE, Goubran B, Ari C, Poff AM, Rogers CQ, DeBlasi JM, Samy B, Moussa M, Serrador JM and D’Agostino DP (2021) Human Adaptations to Multiday Saturation on NASA NEEMO. Front. Physiol. 11:610000. doi: 10.3389/fphys.2020.610000
Received: 24 September 2020; Accepted: 16 December 2020;
Published: 12 January 2021.
Edited by:
Neal William Pollock, Laval University, CanadaReviewed by:
Satoshi Iwase, Aichi Medical University, JapanTiago Peçanha, University of São Paulo, Brazil
Dawn Kernagis, University of North Carolina at Chapel Hill, United States
Copyright © 2021 Koutnik, Favre, Noboa, Sanchez-Gonzalez, Moss, Goubran, Ari, Poff, Rogers, DeBlasi, Samy, Moussa, Serrador and D’Agostino. This is an open-access article distributed under the terms of the Creative Commons Attribution License (CC BY). The use, distribution or reproduction in other forums is permitted, provided the original author(s) and the copyright owner(s) are credited and that the original publication in this journal is cited, in accordance with accepted academic practice. No use, distribution or reproduction is permitted which does not comply with these terms.
*Correspondence: Andrew P. Koutnik, YWtvdXRuaWtAdXNmLmVkdQ==; YWtvdXRuaWtAaWhtYy5vcmc=