 Ola Eriksrud
 Fredrik Ahlbeck1
 Damian Harper
 Øyvind Gløersen
- 1Department of Physical Performance, Norwegian School of Sport Sciences, Oslo, Norway
- 2School of Sport and Health Sciences, Institute of Coaching and Performance, University of Central Lancashire, Preston, United Kingdom
The aim of this study was to determine validity of velocity measurements of a motorized resistance device (MRD) during change of direction (CoD). Eight male (age: 22.1 ± 4.2 yrs; weight: 83.3 ± 17.1 kg; height: 181.6 ± 12.6 cm) and three female participants (age: 21.7 ± 1.5 yrs; mass: 69.7 ± 2.4 kg; height: 167.0 ± 3.6 cm) completed the modified 505 CoD test (m505) with turning off the left and right foot while exposed to external loads (3, 6, and 9 kg) provided by the MRD. Three-dimensional kinematic data were measured (200 Hz) for all tests using a full-body marker set with an additional marker placed on the pulley used to attach the carabiner (CAR) at the end of the line from the MRD to the participant. Average velocity of overall center of mass (COMvel), pelvis (COMpelvis_vel), and pulley (CARvel) was then calculated and compared to the velocity measured by MRD (MRDvel) in 0.5 s intervals 1.5 s before and after CoD. Average velocities from these intervals were then compared using correlational, Bland–Altman analysis, coefficient of variation (CV), and statistical parametric mapping (SPM). Mostly, excellent correlations were observed and ranged from 0.93 to 1.00, 0.53 to 1.00 and 0.93 to 1.00 for the 3, 6, and 9 kg load conditions, respectively. CV values ranged from 0.3 to 3.2%, 0.8 to 4.3%, and 1.5 to 7.7% for the CARvel, COMpelvis_vel, and COMvel comparisons, respectively. The biases for CARvel comparisons ranged from −0.027 to 0.05 m/s, −0.246 to 0.128 m/s and −0.486 to 0.082 m/s across all load conditions and time intervals for the CARvel, COMpelvis_vel, and COMvel comparisons, respectively. SPM analysis indicated significant differences between MRDvel and COMvel and COMpelvis_vel over short time periods during the CoD, but no difference between MRDvel and CARvel. The velocity measurements obtained by a MRD during a m505 test are valid as low biases, low CV’s, and high correlations are observed for the MRDvel to CARvel comparison. As single points of measurement (i.e., laser) has been proven useful to assess other athletic tasks (i.e., sprint running), the single point CARvel comparison is an appropriate comparison for validating MRDvel measurements during the m505 test.
Introduction
Change of direction (CoD) is an important skill in multi-directional sports and identified as an essential component underpinning agility where athletes are required to make quick and precise CoD maneuvers to enable successful tactical and technical outcomes. CoD has been defined as “the skills and abilities needed to change movement direction, velocity, or modes” (DeWeese and Nimphius, 2016) where the ability to co-ordinate force application during each phase of CoD including: (1) initial acceleration, (2) deceleration, (3) turn, and (4) re-acceleration is important (Dos’Santos et al., 2017). In invasion sports, CoD ability is important for penetrating defensive lines (Wheeler et al., 2010; Fox et al., 2014; Mohamad Zahidi and Ismail, 2018), creating goal scoring opportunities (Faude et al., 2012), talent identification (Gil et al., 2007), discriminating between levels of performance (Reilly et al., 2000), and for draft selection in the National Football League (McGee and Burkett, 2003). Considering the importance of CoD in multi-directional sports it is necessary to have valid tests to quantify this quality.
Currently, a plethora of tests are used to quantify CoD based on different movement patterns (i.e., sprint and side shuffle), angle of turn, number of turns, and duration (Nimphius et al., 2017). Such differences make comparisons between tests difficult as CoD is a task-specific skill based on angle of turn and entry velocity (Nimphius et al., 2017; Dos’Santos et al., 2018). In most CoD tests, the overall time has commonly been used as the primary outcome variable to quantify CoD ability. However, a number of problems have been raised with this primary outcome measure. Firstly, longer tests might not be representative of CoD, but rather anaerobic capacity and linear sprint ability (Vescovi and McGuigan, 2008). Secondly, even in shorter tests, such as the modified 505 (m505) which consists of two 5 m sprints with a 180° turn, superior sprint capacity can still mask CoD ability (DeWeese and Nimphius, 2016; Nimphius et al., 2017). As a result, indirect measures, such as the COD deficit, have been developed in an attempt to better quantify CoD ability by isolating the CoD component (Nimphius et al., 2016).
Based on the above shortcomings of current CoD testing approaches, it has been advocated that practitioners should aim to quantify an athletes center of mass velocity (COMvel) during CoD actions (Nimphius et al., 2016). To obtain such measurements in a laboratory setting (i.e., motion capture) and calculate COM velocity is not difficult, but it is not practical and in many cases not feasible for coaches and other practitioners in the applied setting. Rather, field-based technologies, such as photocells (Buchheit et al., 2012; Hader et al., 2015; Nimphius et al., 2017) global navigation satellite systems (GNSS) and local positioning systems (LPS) technologies (Meylan et al., 2017; Luteberget and Gilgien, 2020) and laser (Hader et al., 2015) have been used to assess CoD ability. Photocells are commonly used to obtain overall time of the CoD test, but do not provide phase-specific information (Buchheit et al., 2012; Hader et al., 2015). Furthermore, most GNSS or LPS measurements have limited validity and reliability for short CoD tests (Buchheit et al., 2014; Meylan et al., 2017; Luteberget and Gilgien, 2020) due to limitations in sampling frequency and position measurement accuracy. In a recent study, Hader and co-workers designed a football-specific field test based on two synchronized laser systems. This to explore phase-specific information with different turn angles, which in turn could have practical implications if either initial acceleration to deceleration, re-acceleration, or both should be targeted in training (Hader et al., 2015). Such phase-specific information is important considering that some athletes have been shown to self-pace their run-up (initial acceleration-to-deceleration phase) based on the demand of the CoD (Nimphius et al., 2013). This is also in agreement with field-based observations of the authors and colleagues. Without continuous direct measurements of athlete movement during a CoD test such phase-specific information cannot be obtained.
Recently, development of new technologies may provide scientists, practitioners, and coaches with an opportunity to obtain more detailed information about an athletes CoD ability in both lab- and field-based environments. Motorized resistance technology can be applied to CoD testing to provide continuous velocity measurement of the athlete and thereby provide phase-specific information on CoD test performance, while at the same time prescribe horizontal load. With valid phase-specific velocity measurements obtained throughout CoD more detailed insights can be obtained to direct CoD training prescription. For example, more detailed insights into the deceleration phase as introduced by Harper and co-workers could be explored (Harper et al., 2020). Additionally, since an athletes momentum could have a significant effect on CoD performance (Fernandes et al., 2020), continuous velocity obtained with motorized resistance device (MRD) could also enable exploration of an athletes change in momentum capabilities throughout CoD as previously advocated by Nimphius et al. (2017). Motorized resistance technology has recently been applied for both linear sprint testing and training purposes (Rakovic et al., 2018, 2022; Lahti et al., 2020), but to the authors knowledge not currently to CoD testing. Accordingly, the aim of this study was to assess validity of the velocity measurements obtained with a MRD to marker-based three-dimensional motion capture data during the m505 test under different loaded conditions. Specifically, we hypothesized that velocity measured by the MRD would be in close agreement with a marker placed at the MRD attachment point on the athlete, but that there would be modest biases compared to the segmental velocity and overall COM velocity.
Materials and Methods
Subjects
Eight male (age: 22.1 ± 4.2 yrs; mass: 83.3 ± 17.1 kg; height: 181.6 ± 12.6 cm) and three female participants (age: 21.7 ± 1.5 yrs; mass: 69.7 ± 2.4 kg; height: 167.0 ± 3.6 cm) with experience in ball sports [soccer (n = 2), basketball (n = 4), and handball (n = 3), tennis (n = 1) and floorball (n = 1)] completed the study. Inclusion criteria were familiar with ball sports CoD movements and no musculoskeletal or neurological injury within the past 6 months limiting sports participation for more than 1 week. The study was approved by the local Ethical committee and the National Data Protection Agency for Research (ref number: 148213) and conducted in accordance with the Declaration of Helsinki. Prior to participation all participants, or legal guardian, provided a written informed consent after being given detailed verbal and written explanation of the purpose, procedures, and risks associated with participation.
Procedures
All participants had one familiarization session prior to the test session as recommended for the modified 505 test (m505) (Barber et al., 2016). Anthropometric measurements (height and weight) were obtained prior to a standardized warm-up (jogging, forward and backward, side shuffle, lower extremity mobility exercises, jumps, sprint, and two unloaded m505 tests on each foot) and lasted approximately 15 min. The same warm-up was used for both familiarization and test session.
Testing took place in the biomechanics laboratory at the Norwegian School of Sport Sciences where subjects performed two successful repetitions of the m505 test with turns off both the left and right foot. Procedures have been described in detail previously (Draper and Lancaster, 1985; Taylor et al., 2019) but summarized here for clarity as it was performed under externally loaded conditions provided by MRD. For all tests, the subject started with a two-point start at a 5 m mark (tape) from the center of the second force plate (tape mark on sides). The fiber cord from the MRD was attached to the subject using a carabiner onto a pulley (Cyclone 52; Purmotion, United States), which in turn was attached to a belt with two carabiners (1080 Vest; 1080 MAP AS, Oslo, Norway). When turning off the left foot, the carabiners were attached over the right hip and for right foot turns vice versa. This to ensure that the fiber cord from the MRD was not in conflict with the CoD movement. As the initial acceleration was toward the MRD this portion of the test was assisted with a greater demand placed on the deceleration and re-acceleration. A successful trial was defined as full effort with the penultimate and final foot contact hitting the floor-mounted force plates. The external load protocol was tested in the order of 3, 9, and 6 kg with two successful turns off the left before the right foot for each load condition. A 2-min rest period was given between trials.
Equipment
Three-dimensional kinematic data were measured (200 Hz) using 16 Oqus (eight 700+ series (resolution 4,096 × 3,072 pixels), eight 400 series (resolution 1,712 × 1,696 pixels), Qualisys AB, Gothenburg, Sweden) of a full-body marker set (63 markers) and one marker placed on the pulley used to attach the carabiner (CAR) at the end of the line from the MRD. The system was calibrated according to the manufacturers recommendations. Calibration accuracy (standard deviation of calibration wand length) was <3 mm for all trials. The approximate recording volume was 5 m (length and width) and 2 m (height), and the laboratory co-ordinate frame was defined so that the y-axis was aligned with the initial running direction.
A portable MRD (1080 Sprint; 1080 Motion, Lidingö, Sweden) was used to provide external resistance and measuring time and position at 333 Hz. The MRD measurements were down-sampled to the motion capture sampling frequency (200 Hz) using linear interpolation. MRD velocity (MRDvel) was calculated as the first time derivative of position data. The 1080 Sprint (MRD) has a servo motor (2000 RPM OMRON G5 Series Motor; OMRON Corp., Kyoto, Japan) that is attached to a carbon fiber spool around which a fiber cord is wrapped. The MRD was positioned on a table 2 m behind the force plates and perpendicular to m505 running directions to allow for the m505 test to be performed along the global y-axis. The fiber cord was also passed through a feeder on an adjustable stand (0.96 m behind the force plate) used to adjust line to hip height (greater trochanter) of each subject. The loads used were 3, 6, and 9 kg. The auto start function of the MRD was used (onset of measurement with speed >0.2 m/s) (Rakovic et al., 2022). See Figure 1 for a description of laboratory set up.
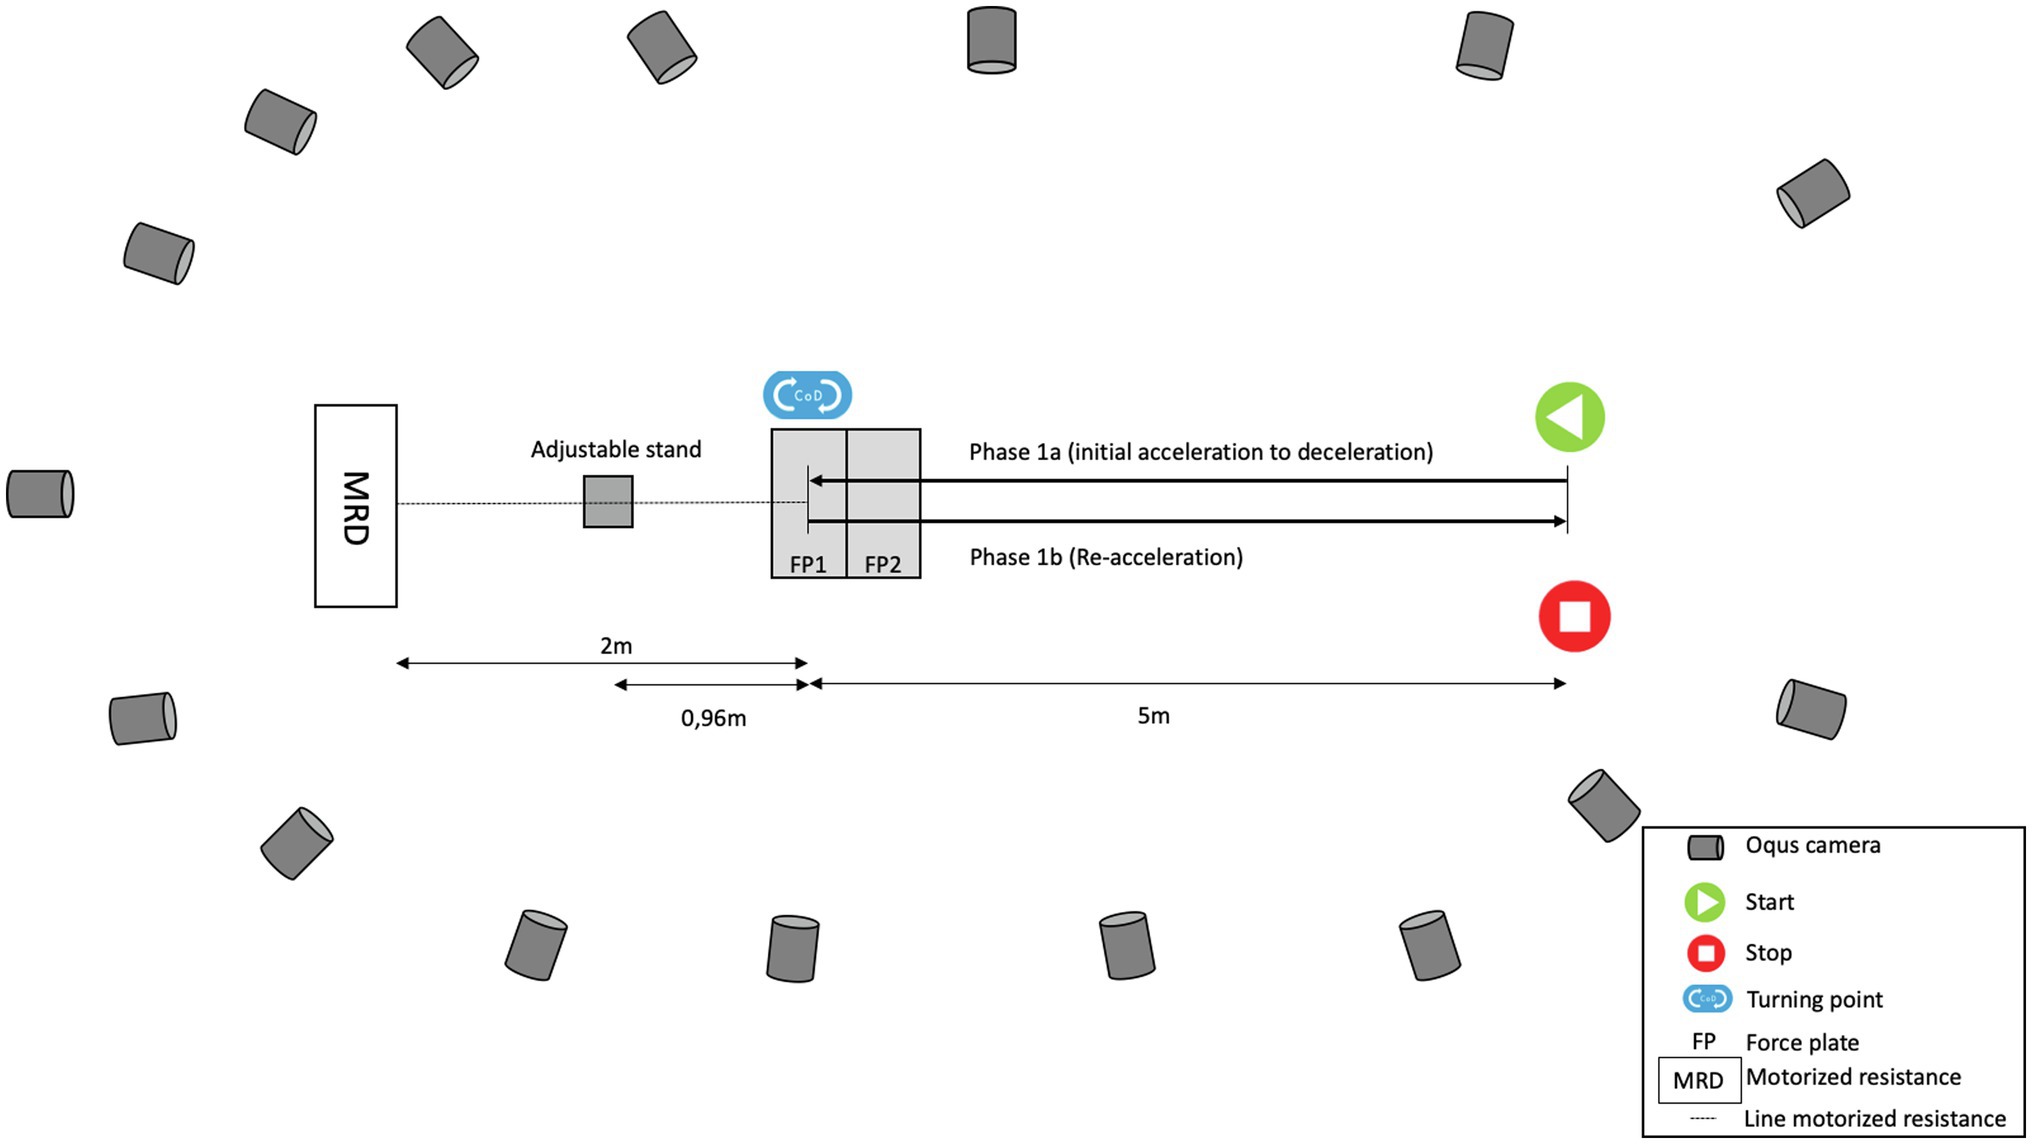
Figure 1. Laboratory set up illustrating placement of Oqus cameras, motorized resistance device, force plates and start and end positions of m505 test.
Data Analysis
Marker locations were registered in a static standing trial in order to determine the static calibration of the kinematic model. Local co-ordinate systems for the different segments were created based upon established recommendations from the International Society of Biomechanics (Wu et al., 2002, 2005). Specifically, the following segments were created: (1) foot based on the recommendation of Hamill and co-workers (Robertson et al., 2014), (2) leg (Wu et al., 2002), (3) thigh using the prediction approach to calculate the hip joint center (Bell et al., 1989; Wu et al., 2002), (4) pelvis (Wu et al., 2002; Leardini et al., 2011), (5) thorax (Wu et al., 2005; Leardini et al., 2011), and (6) upper arm, forearm, and hand (Wu et al., 2005) (Visual 3D, C-Motion Inc., Rockville, MD, United States). The marker position data were filtered with a second-order bi-directional Butterworth low pass filter with a cutoff frequency of 15 Hz. Then, overall center of mass (COM) and pelvis (COMpelvis) were calculated from segmental COM data. Velocity and acceleration for CAR, COM, and COMpelvis were then calculated as first (CARvel, COMvel, and COMpelvis_vel) and second time derivative of position data (CARacc, COMacc, and COMpelvis_acc), respectively. Only the y components of these variables were used, since the y-axis was aligned with the m505 running direction. The motion capture data were time-aligned with the MRD data by cross-correlating the acceleration measurements of both systems. This was done using Matlab R2021a (The MathWorks, Inc., Natick, United States) by finding the peak cross-correlation between CARacc and MRDacc, after low pass filtering the CAR position with a low pass filter equivalent to that built into the MRD (Tustin filter with filter coefficient 0.04 s).
As different definitions of time of CoD are used (Sayers, 2015; Clarke et al., 2020) or not defined (Hader et al., 2015), we defined time of CoD based on countermovement jump definitions (McMahon et al., 2018). Specifically, time of CoD was defined as the time when direction of MRDvel changed (MRDvel_COD). From this, phase 1a was defined from the onset of measurement to MRDvel_COD, while phase 1b was defined from to MRDvel_COD to start position. Then, velocity (MRDvel, CARvel, COMvel, and COMpelvis_vel) at 0.1 s time intervals before (−) and (+) after MRDvel_COD were defined. Also, average velocity for 0.1, 0.5, 1.0, and 1.5 s intervals before (−) and after (+) MRDvel_COD were also calculated for all outcome variables (MRDvel, CARvel, COMvel and COMpelvis_vel). In addition, the following performance outcome measurements were obtained from the MRD for the m505 test: total time (m505time), total distance (m505dist), time phase 1a (m5051a_time), distance 1a (m5051a_dist), average velocity phase 1a (m5051a_avgvel), time phase 1b (m5051b_time), distance 1b (m5051b_dist), and average velocity phase 1b (m5051b_avgvel).
Statistical Analysis
Descriptive statistics [mean and standard deviation (SD)] were calculated in Excel version 14.4.8 (Microsoft Corp., Redmond, WA, United States). All other statistical tests were done using IBM SPSS version 21.0 (IBM, Armonk, NY, United States). Normality of the data was assessed using Shapiro–Wilk’s test (α = 0.05). The criterion-related (concurrent) validity of the MRD was determined by comparing MRDvel to CARvel, COMvel, and COMpelvis_vel measurements during different time intervals using correlational analysis, including Pearson product-moment correlation (r) and Spearman rank-order correlation (ρ), for normal and non-normal distribution, respectively. Interpretation of correlation coefficients was done according to the guidelines of Hopkins (Hopkins, 2011) as follows: impractical (<0.45), very poor (0.45–0.70), poor (0.70–0.85), good (0.85–0.95), very good (0.95–0.995), and excellent (>0.995). Coefficient of variation (CV %) was calculated using a custom Excel spreadsheet (Hopkins, 2015). Bland–Altman method was employed to determine bias and limits of agreement for the different time intervals as defined previously. Furthermore, statistical parametric mapping (SPM; Pataky et al., 2015) using paired t-tests (SPM(t); α = 0.05; two-tailed) was used to determine if velocity from MRDvel was different from kinematic data (CARvel, COMpelvis_vel, and COMvel) 1 s before (−) and after (+) CoD for the different load conditions.
Results
A total of 40, 40, and 44 tests were analyzed for the 3, 6, and 9 kg loaded conditions, respectively. Performance on the m505 tests, average left and right turns, ranged from 3.26 to 3.52 s for the different load conditions. Phase-specific times ranged 1.77 to 1.83 s and 1.47 to 1.69 s for phase 1a and 1b, respectively, for the different load conditions (Table 1).
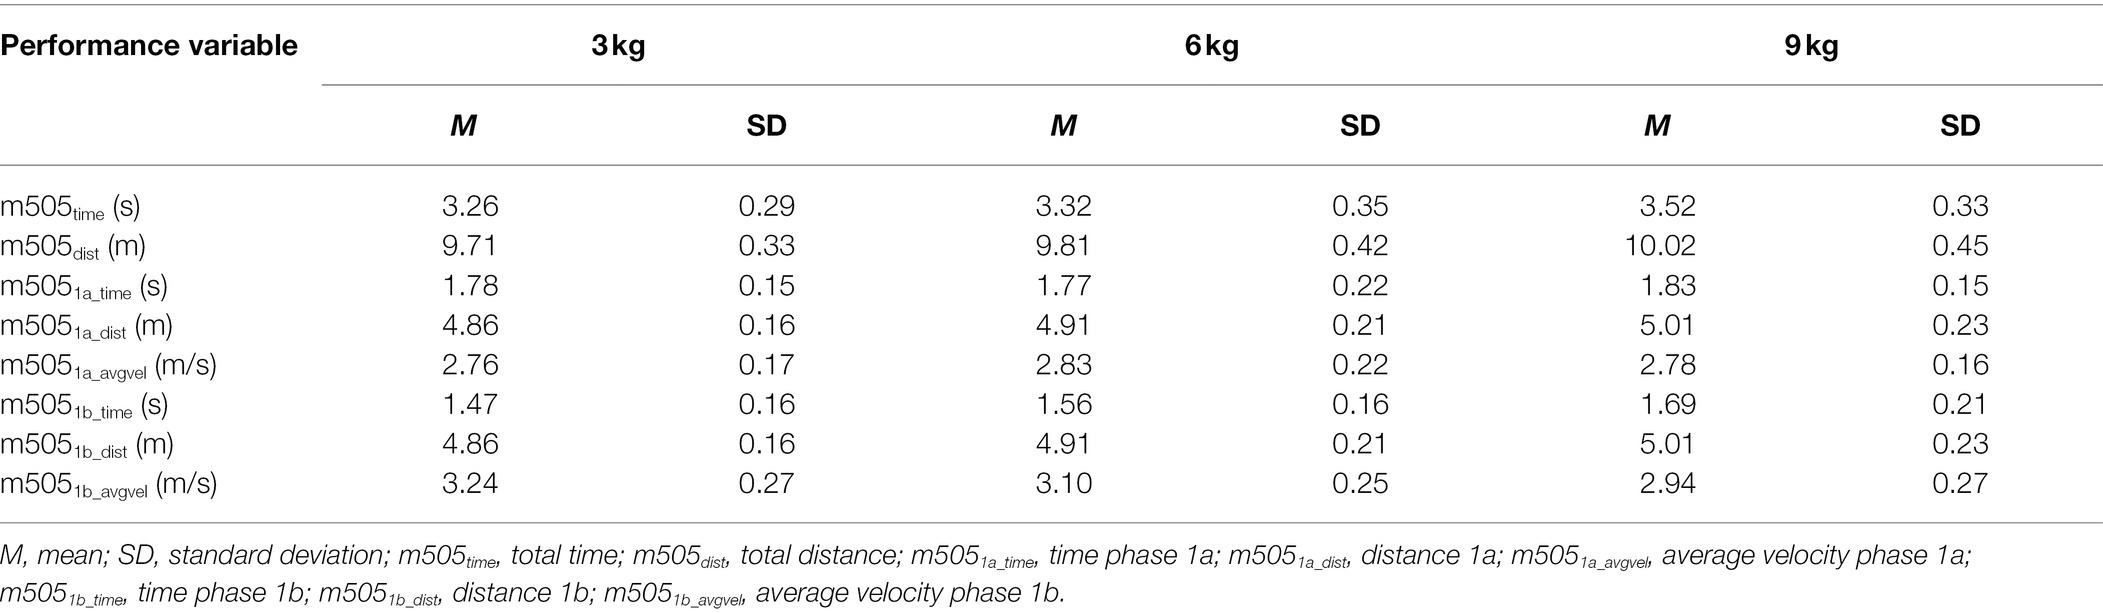
Table 1. m505 test results for the different loaded conditions.
Correlations between MRDvel and CARvel, COMpelvis_vel, and COMvel were mostly very good to excellent. Specifically, correlation coefficients between MRDvel and the other outcome variables ranged from 0.93 to 1.00, 0.53 to 1.00 and 0.93 to 1.00 for 3, 6, and 9 kg external load, respectively (Table 2). CV values ranged from 0.3 to 3.2%, 0.8 to 4.3%, and 1.5 to 7.7% for the CARvel, COMpelvis_vel, and COMvel comparisons. The observed biases for CARvel comparisons ranged from −0.027 to 0.05 m/s, −0.246 to 0.128 m/s, and −0.486 to 0.082 m/s across all loaded conditions and time intervals for the CARvel, COMpelvis_vel, and COMvel comparisons, respectively (Table 2). Bland–Altman analyses for the same time intervals (0.5 s) are presented in Figures 2–4 for the 3, 6, and 9 kg conditions, respectively.
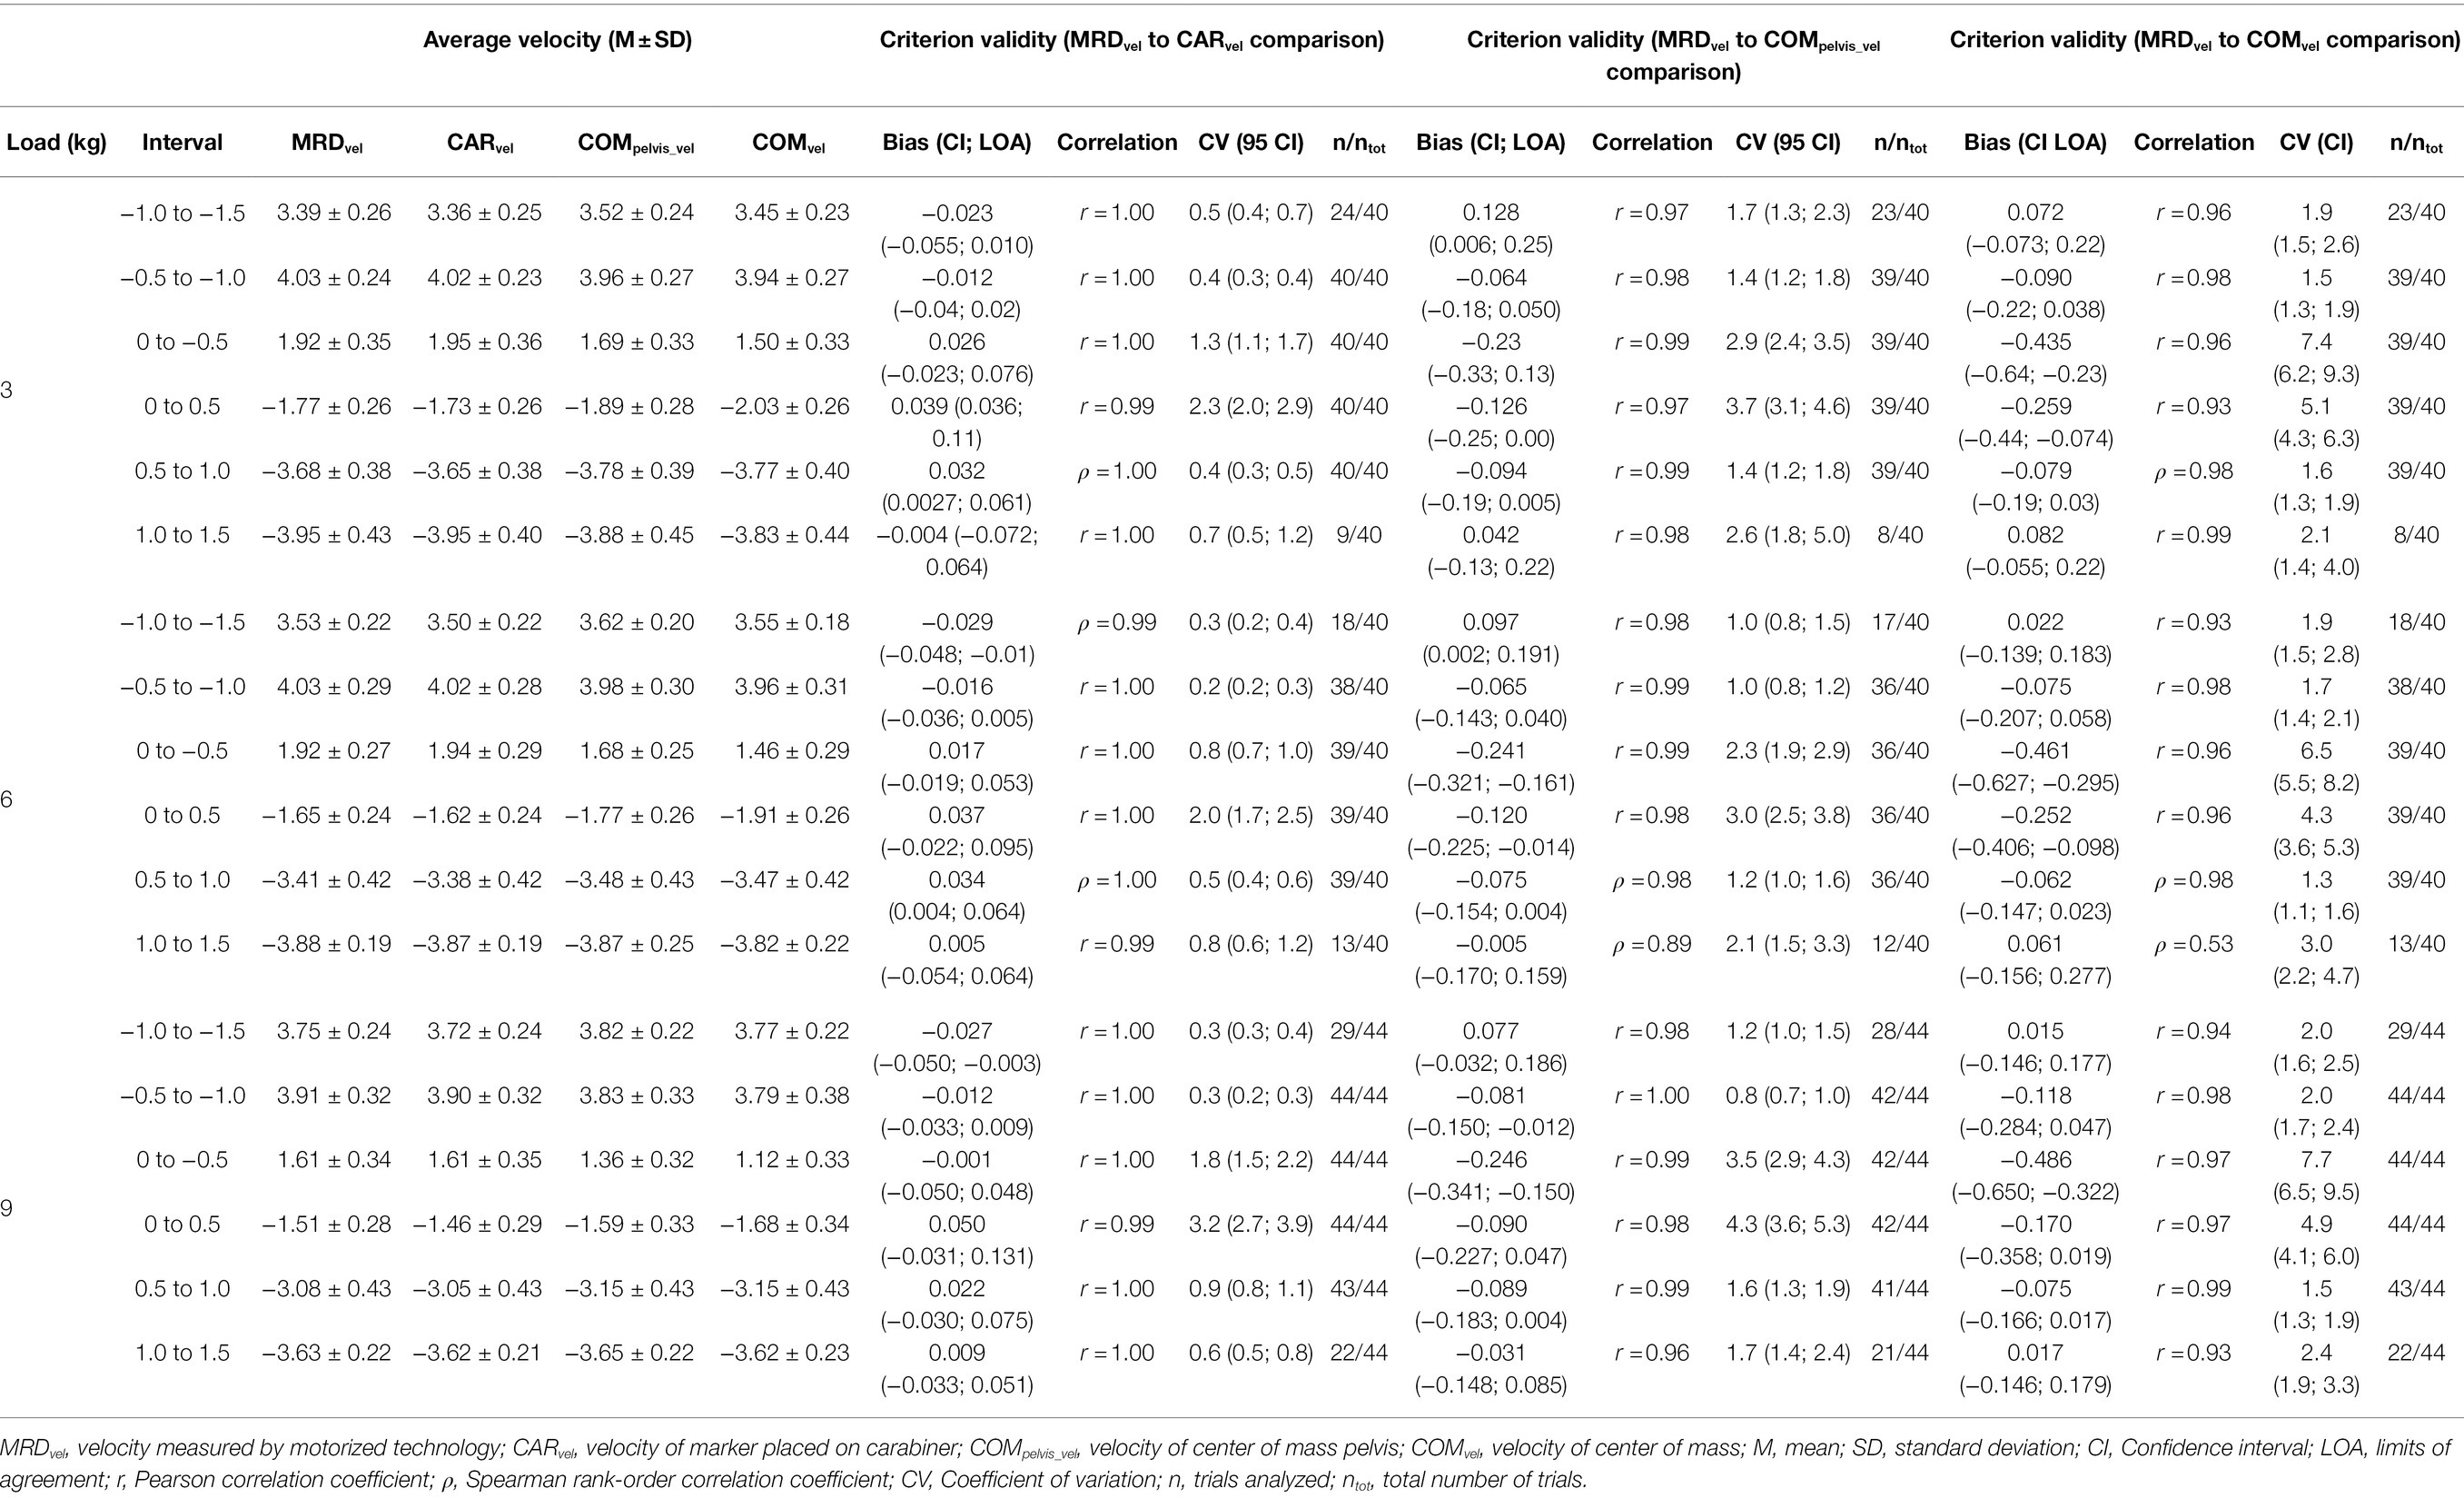
Table 2. Average velocity and criterion validity of a motorized resistance device for different time intervals before (−) and after (+) CoD.
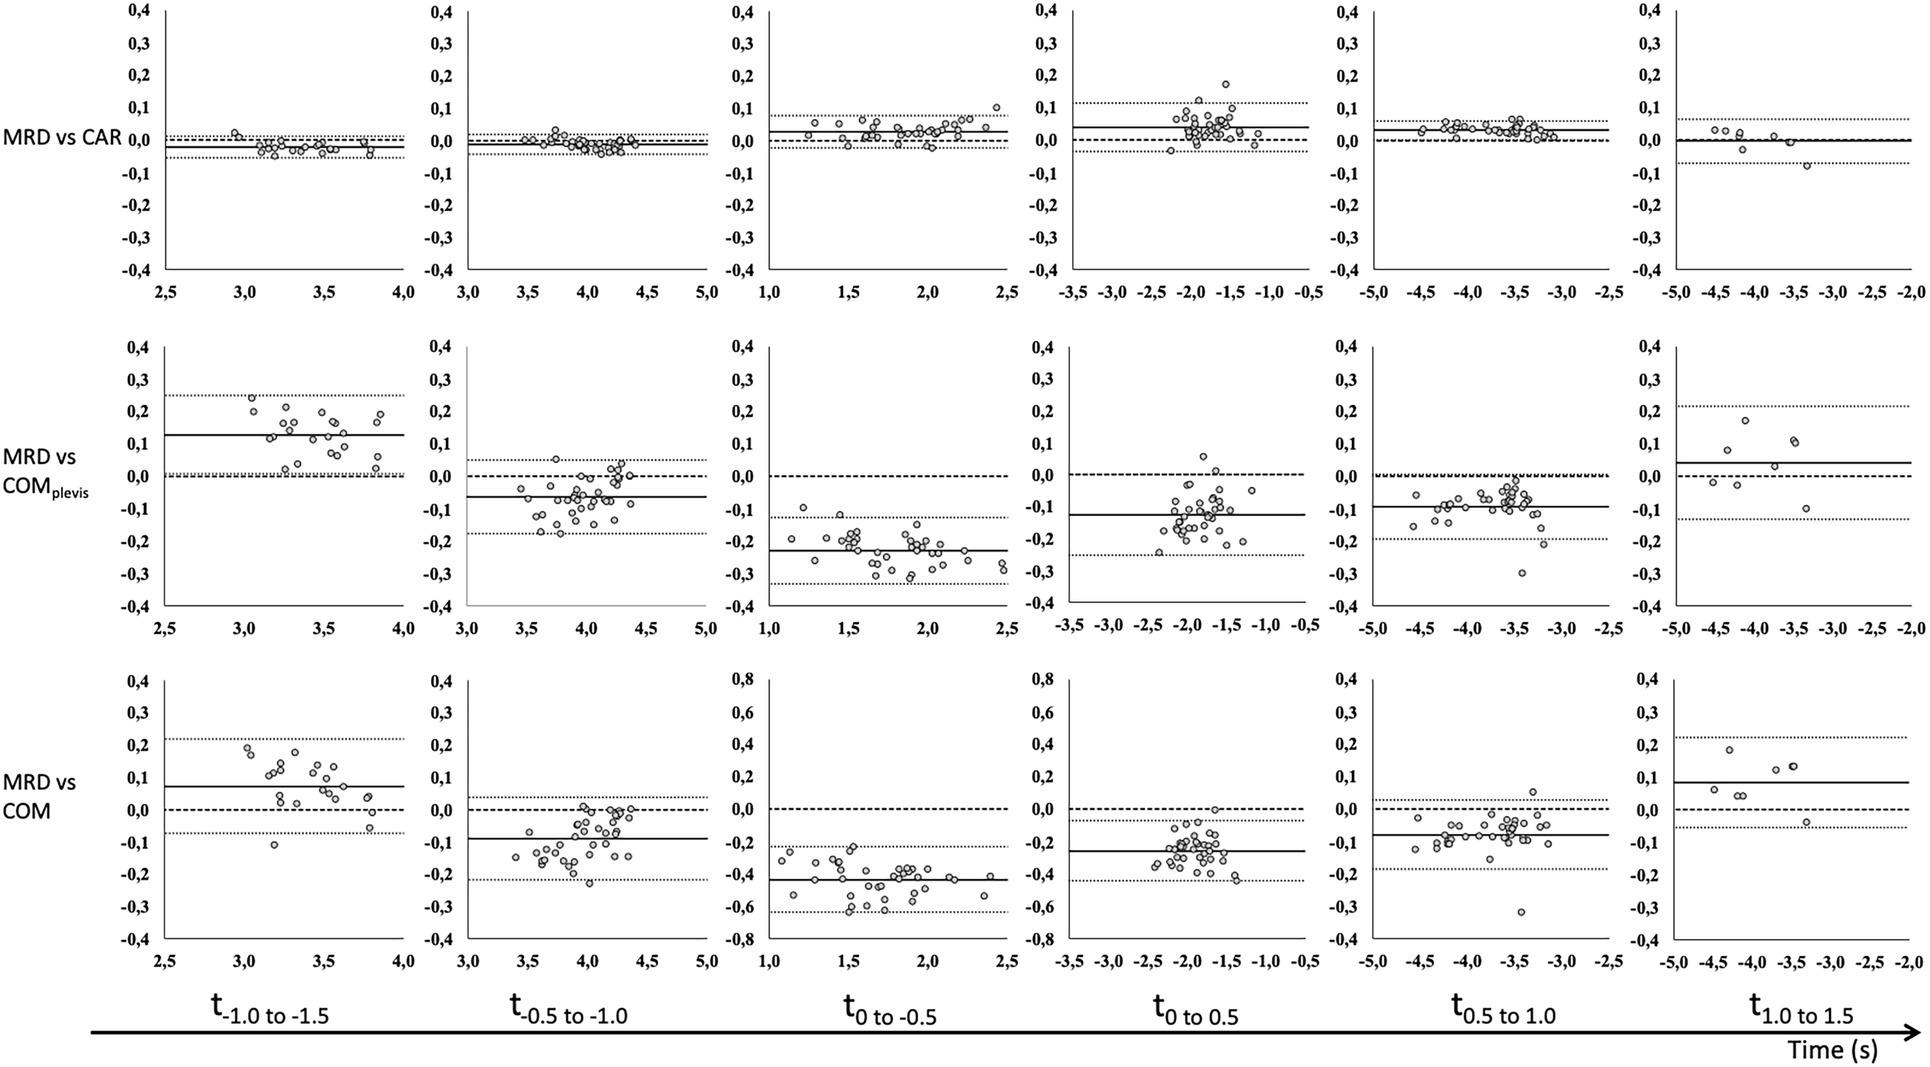
Figure 2. Bland–Altman analysis of average velocity for 0.5 s time intervals before (−) and after (+) CoD (horizontal axis) for the MRD to CAR (top row), COMpelvis (middle row), and COM (bottom row) for 3 kg external load. Bland–Altman plots [y-axis: difference in velocity (m/s) and x-axis: average velocity (m/s)] for all trials with fixed bias (full line) with 95% confidence interval (dotted line) and agreement (dashed line).
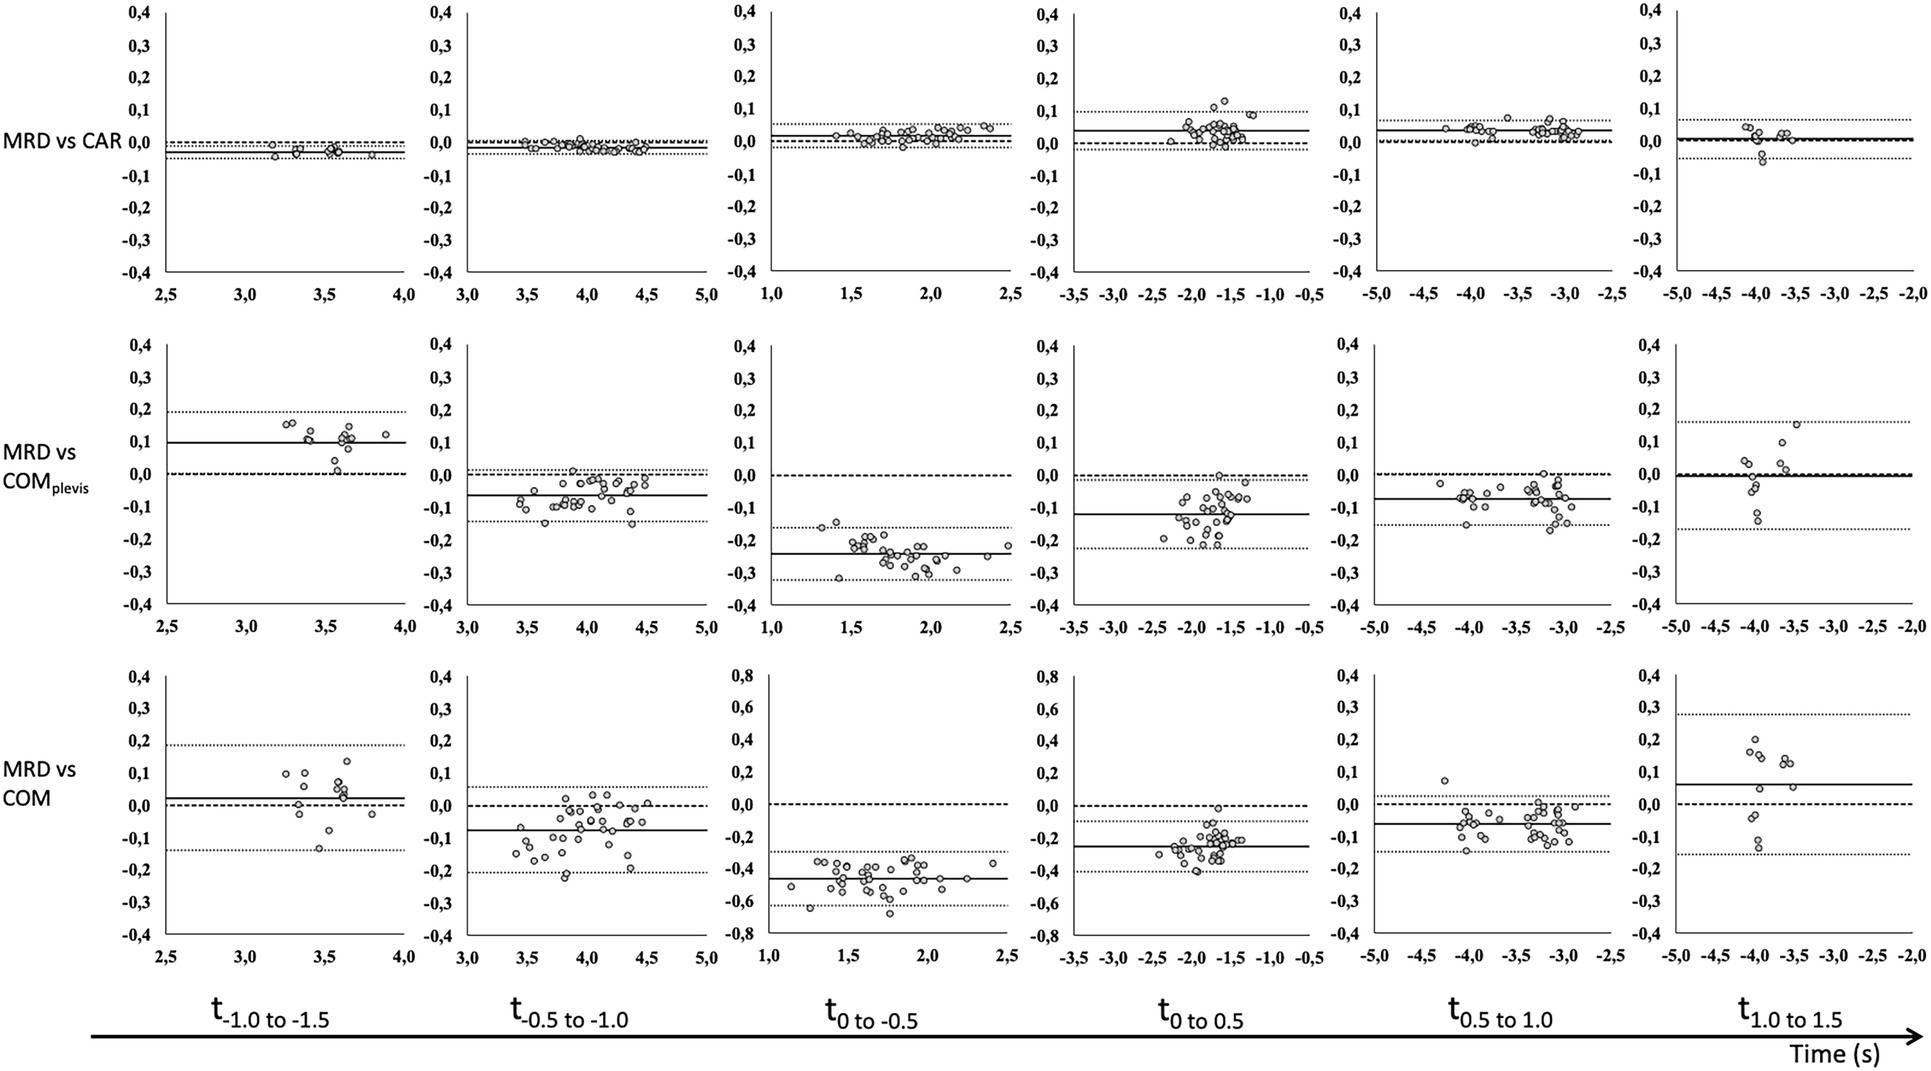
Figure 3. Bland–Altman analysis of average velocity for 0.5 s time intervals before (−) and after (+) CoD (horizontal axis) for the MRD to CAR (top row), COMpelvis (middle row) and COM (bottom row) for 6 kg external load. Bland–Altman plots [y-axis: difference in velocity (m/s) and x-axis: average velocity (m/s)] for all trials with fixed bias (full line) with 95% confidence interval (dotted line) and agreement (dashed line).
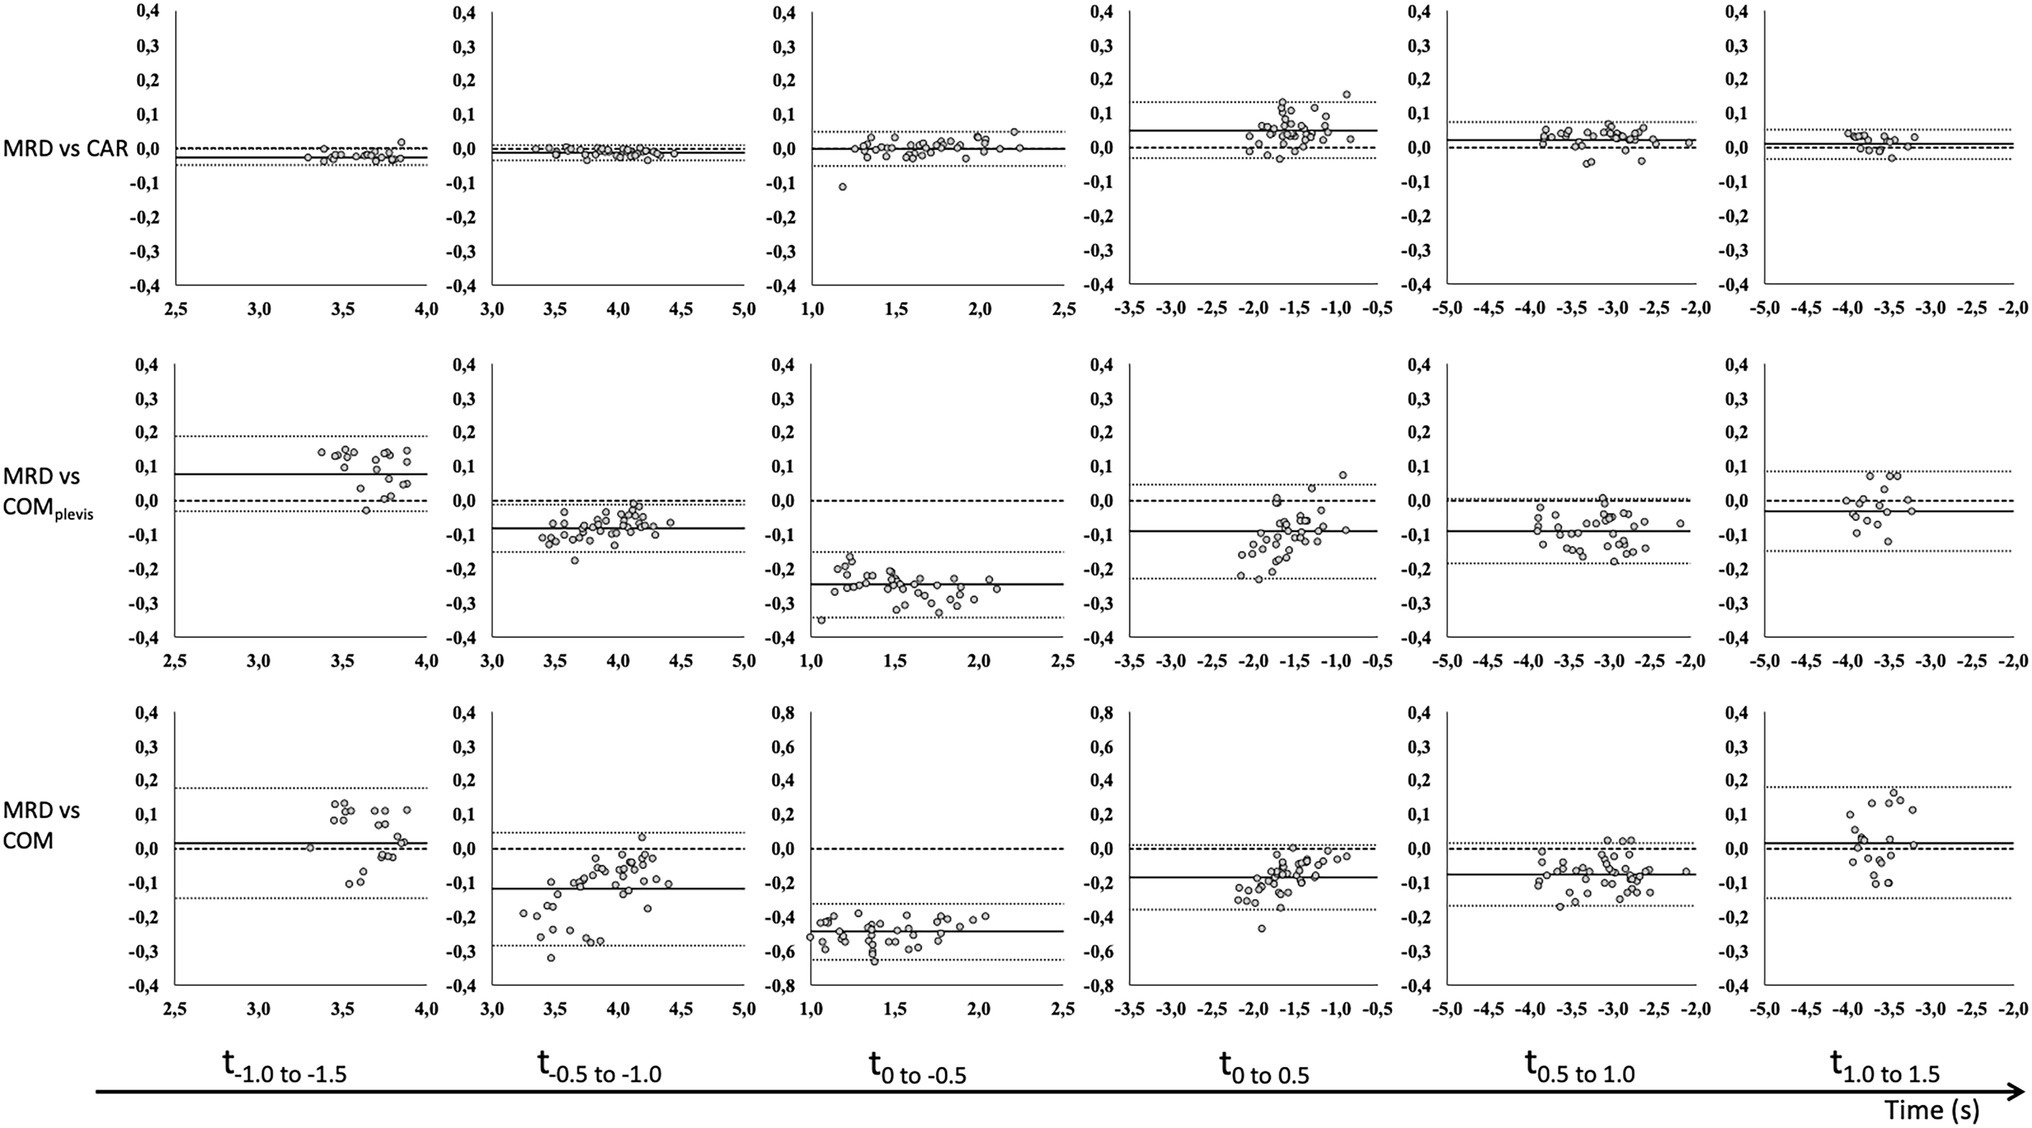
Figure 4. Bland–Altman analysis of average velocity for 0.5 s time intervals before (−) and after (+) CoD (horizontal axis) for the MRD to CAR (top row), COMpelvis (middle row) and COM (bottom row) for 9 kg external load. Bland–Altman plots [y-axis: difference in velocity (m/s) and x-axis: average velocity (m/s)] for all trials with fixed bias (full line) with 95% confidence interval (dotted line) and agreement (dashed line).
Statistical parametric mapping analysis yielded no significant difference between MRDvel and CARvel for the any of the load conditions. However, significant underestimation from 0.32 to 0.36 s for the COMpelvis_vel comparison was observed for the 3 kg load condition. For the 6 kg load condition, significant overestimation from −0.06 to 0.22 s and underestimation from 0.81 to 0.89 s for the COMvel comparison was observed, while a significant underestimation from 0.27 to 0.36 s for the COMpelvis_vel comparison. For the 9 kg load condition, significant overestimation from −0.52 to −0.41 and from −0.35 to 0.21 s for the COMvel comparison were observed, while a significant underestimation from 0.31 to 0.42 s interval for the COMpelvis_vel comparison (Figures 5–7).
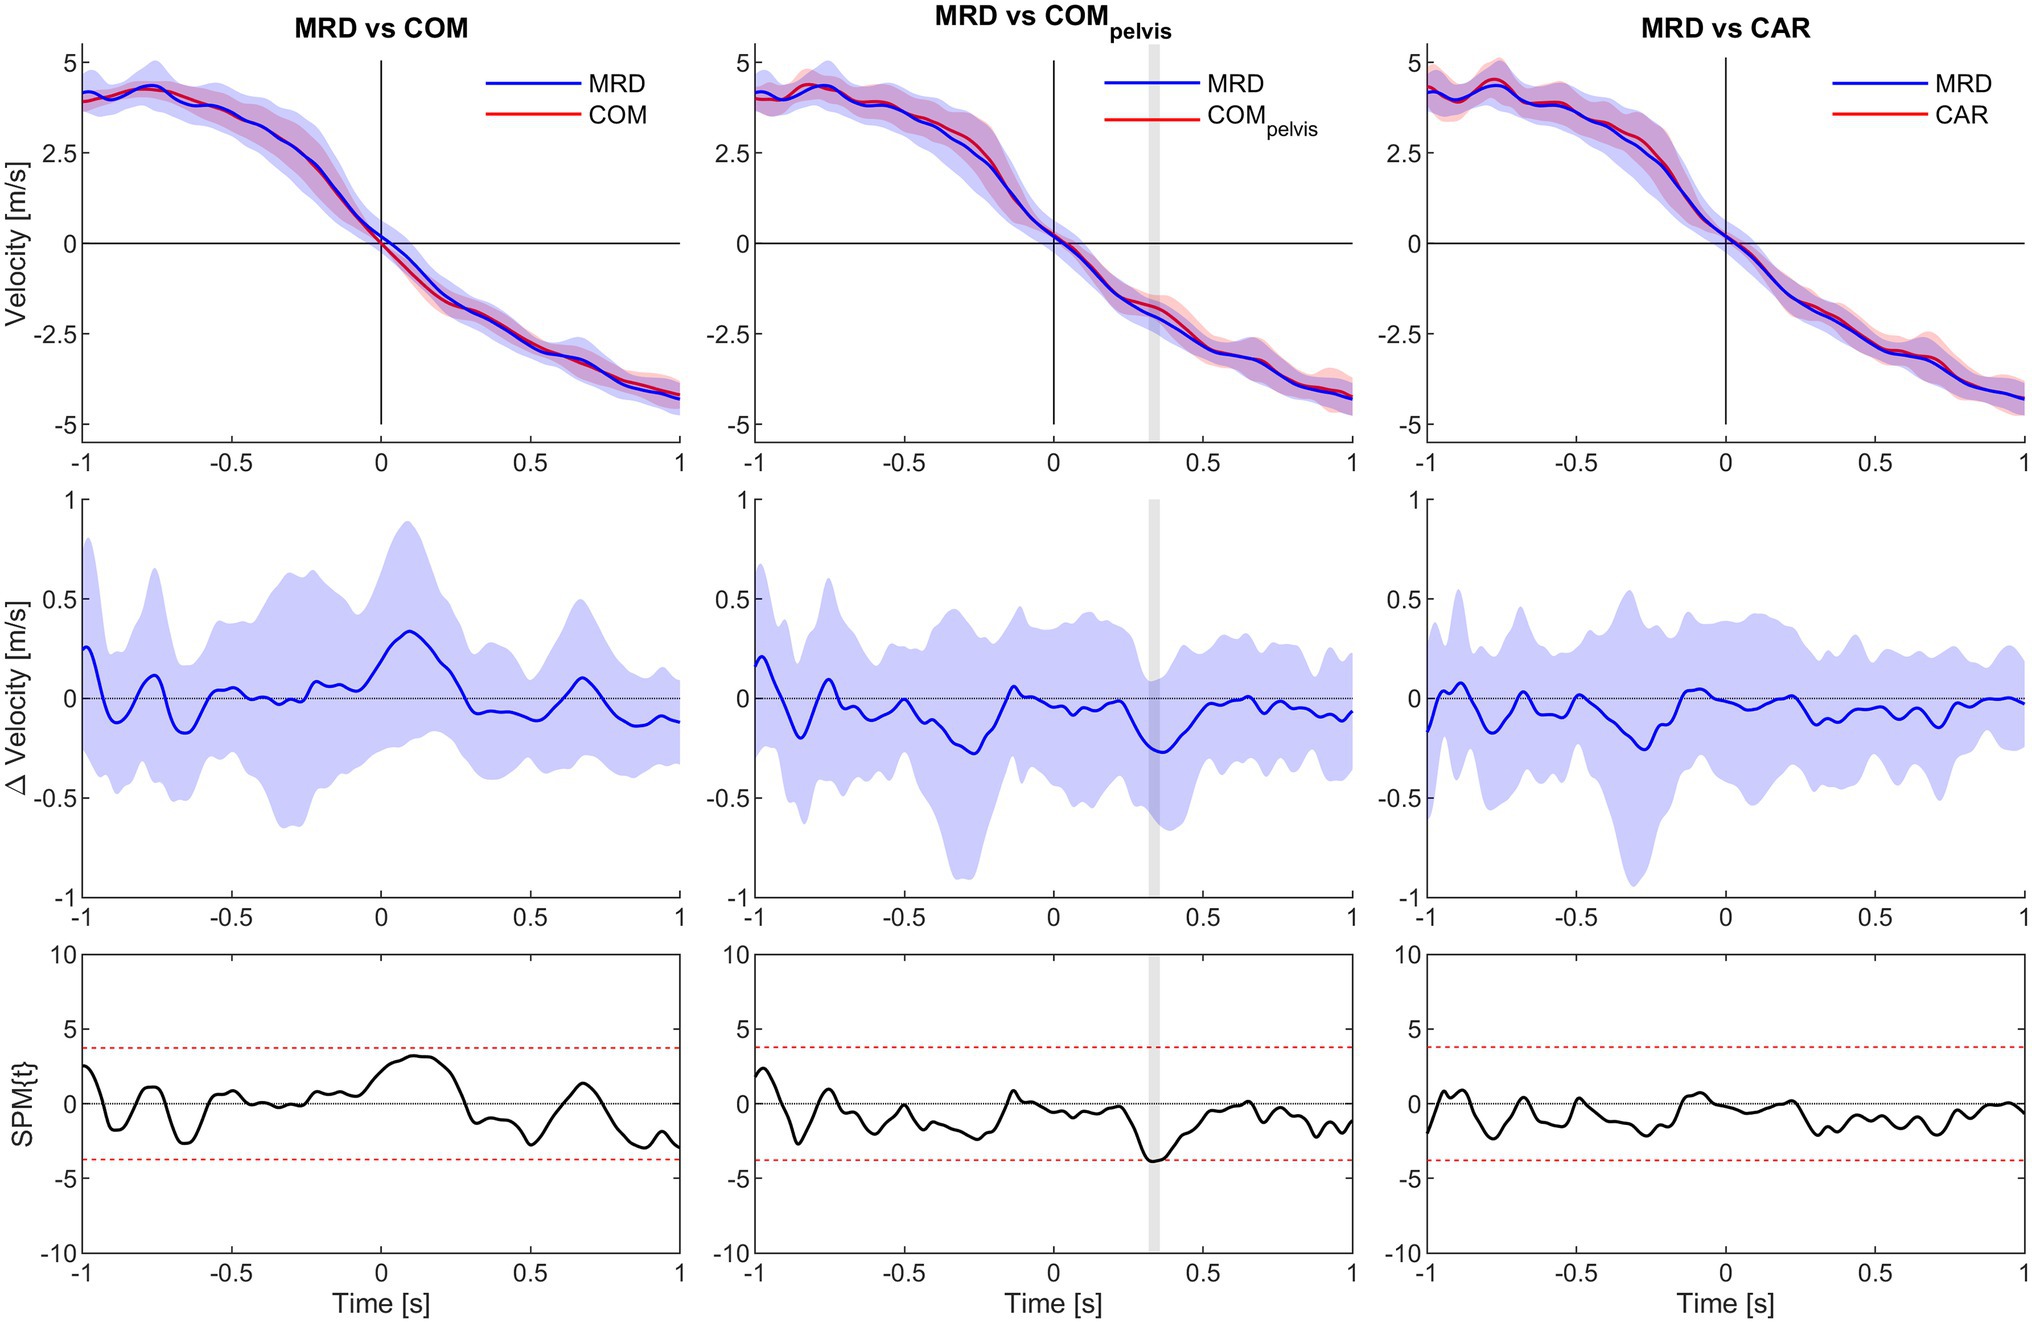
Figure 5. SPM analysis of average velocity for 1.0 s time interval before (−) and after (+) CoD (horizontal axis all graphs) for the 3 kg condition. Columns left to right show MRD to COM, MRD to COMpelvis and MRD to CAR comparisons. Top row show average velocity of all trials with 95% confidence interval for the MRD (blue) to COM, COMpelvis and CAR (red) comparisons. Middle row show difference in velocity with 95% confidence interval. Bottom row show SPM analysis with 95% confidence interval marked with red dashed lines. Grey vertical line identify time interval of significant difference (α < 0.05).
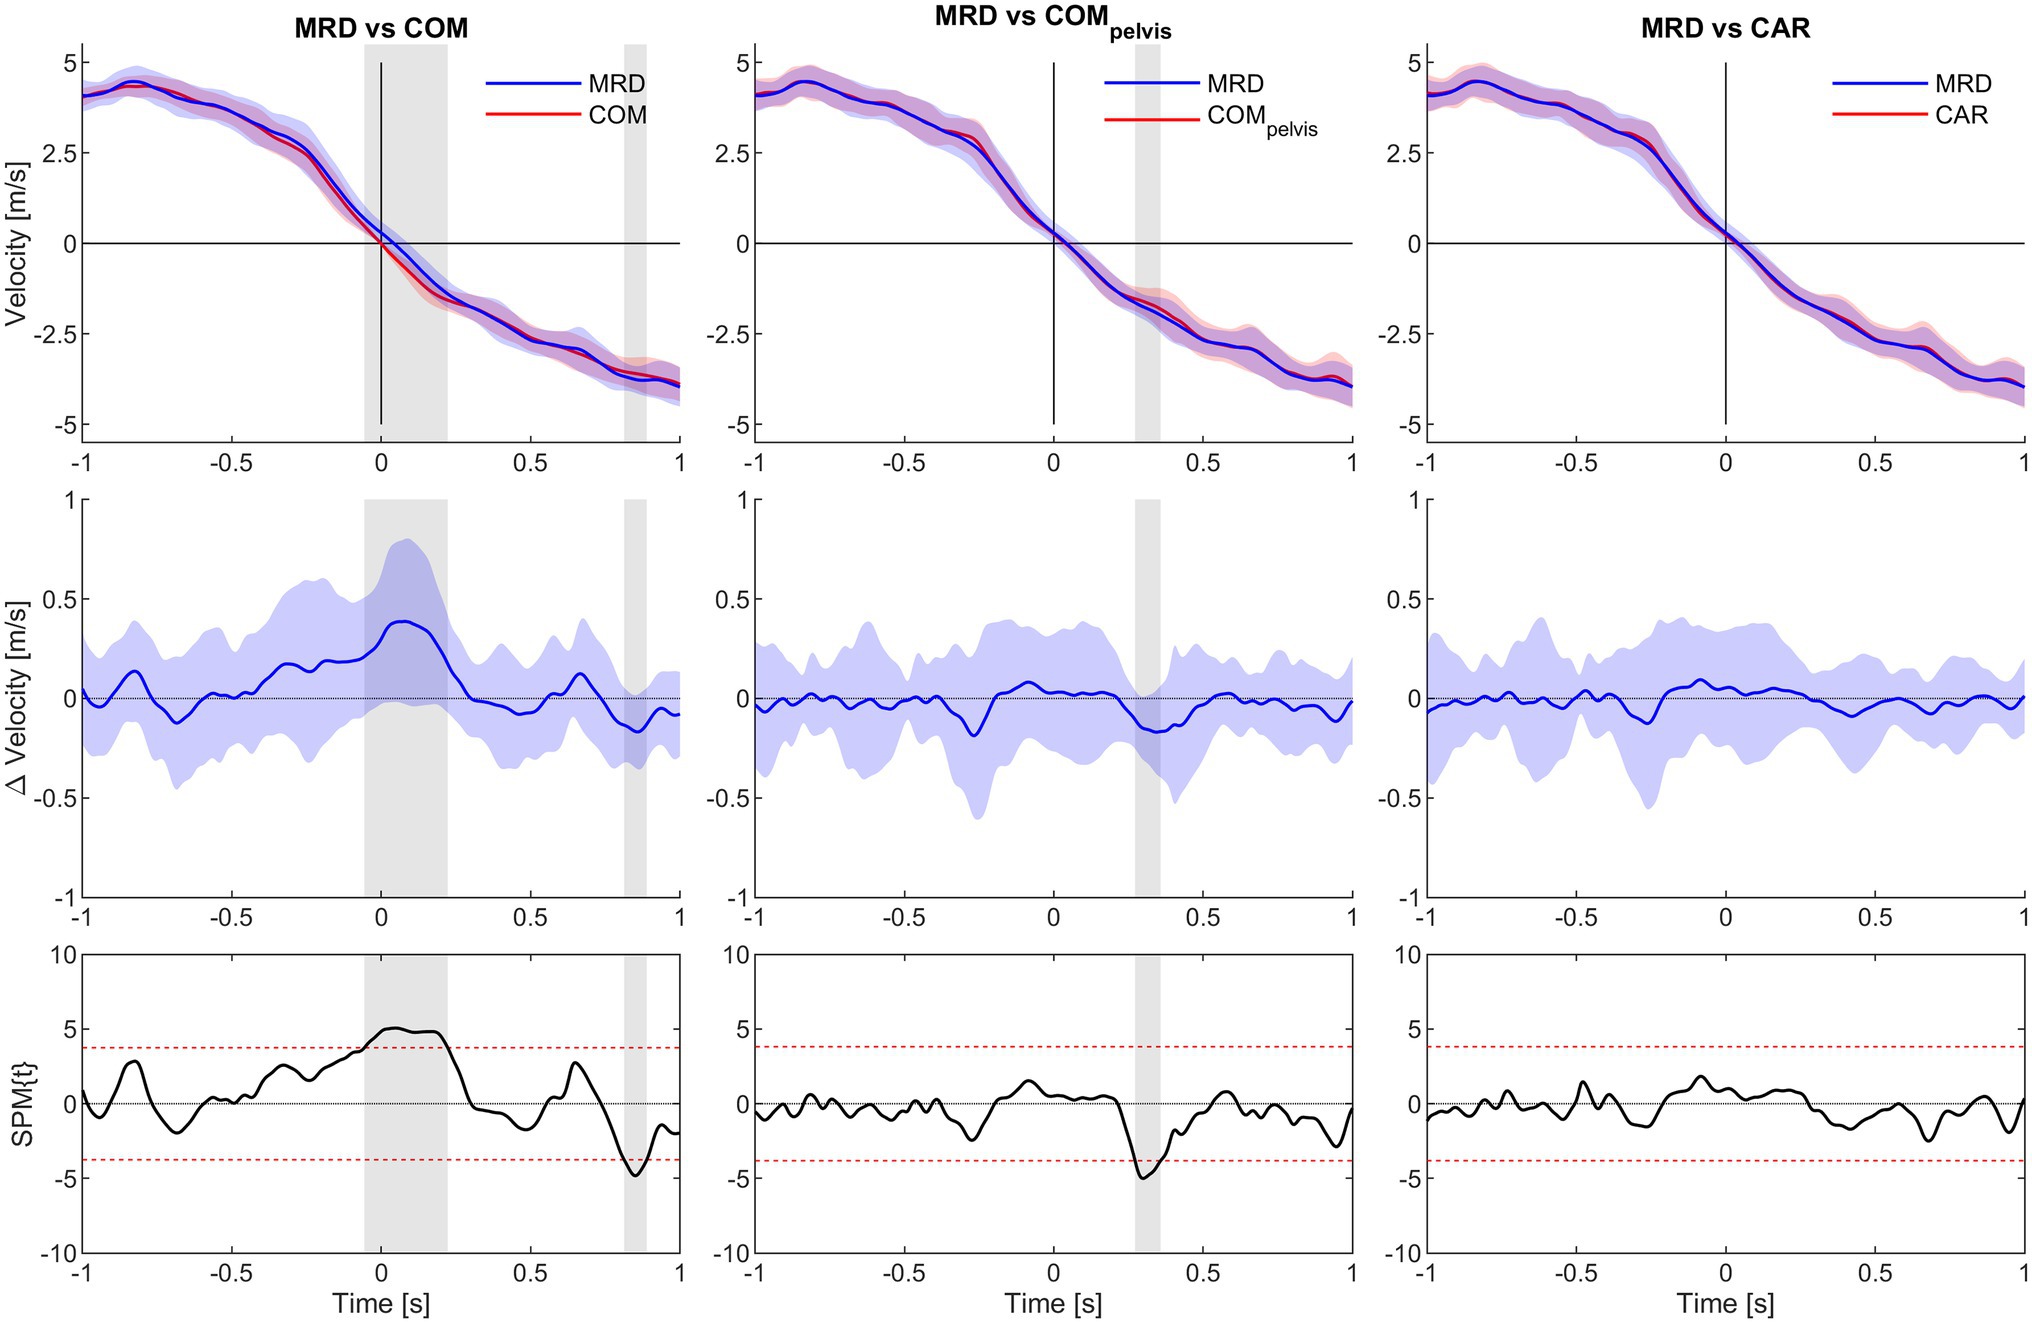
Figure 6. SPM analysis of average velocity for 1.0 s time interval before (−) and after (+) CoD (horizontal axis all graphs) for the 6 kg condition. Columns left to right show MRD to COM, MRD to COMpelvis and MRD to CAR comparisons. Top row show average velocity of all trials with 95% confidence interval for the MRD (blue) to COM, COMpelvis and CAR (red) comparisons. Middle row show difference in velocity with 95% confidence interval. Bottom row show SPM analysis with 95% confidence interval marked with red dashed lines. Grey vertical line identify time interval of significant difference (α < 0.05).
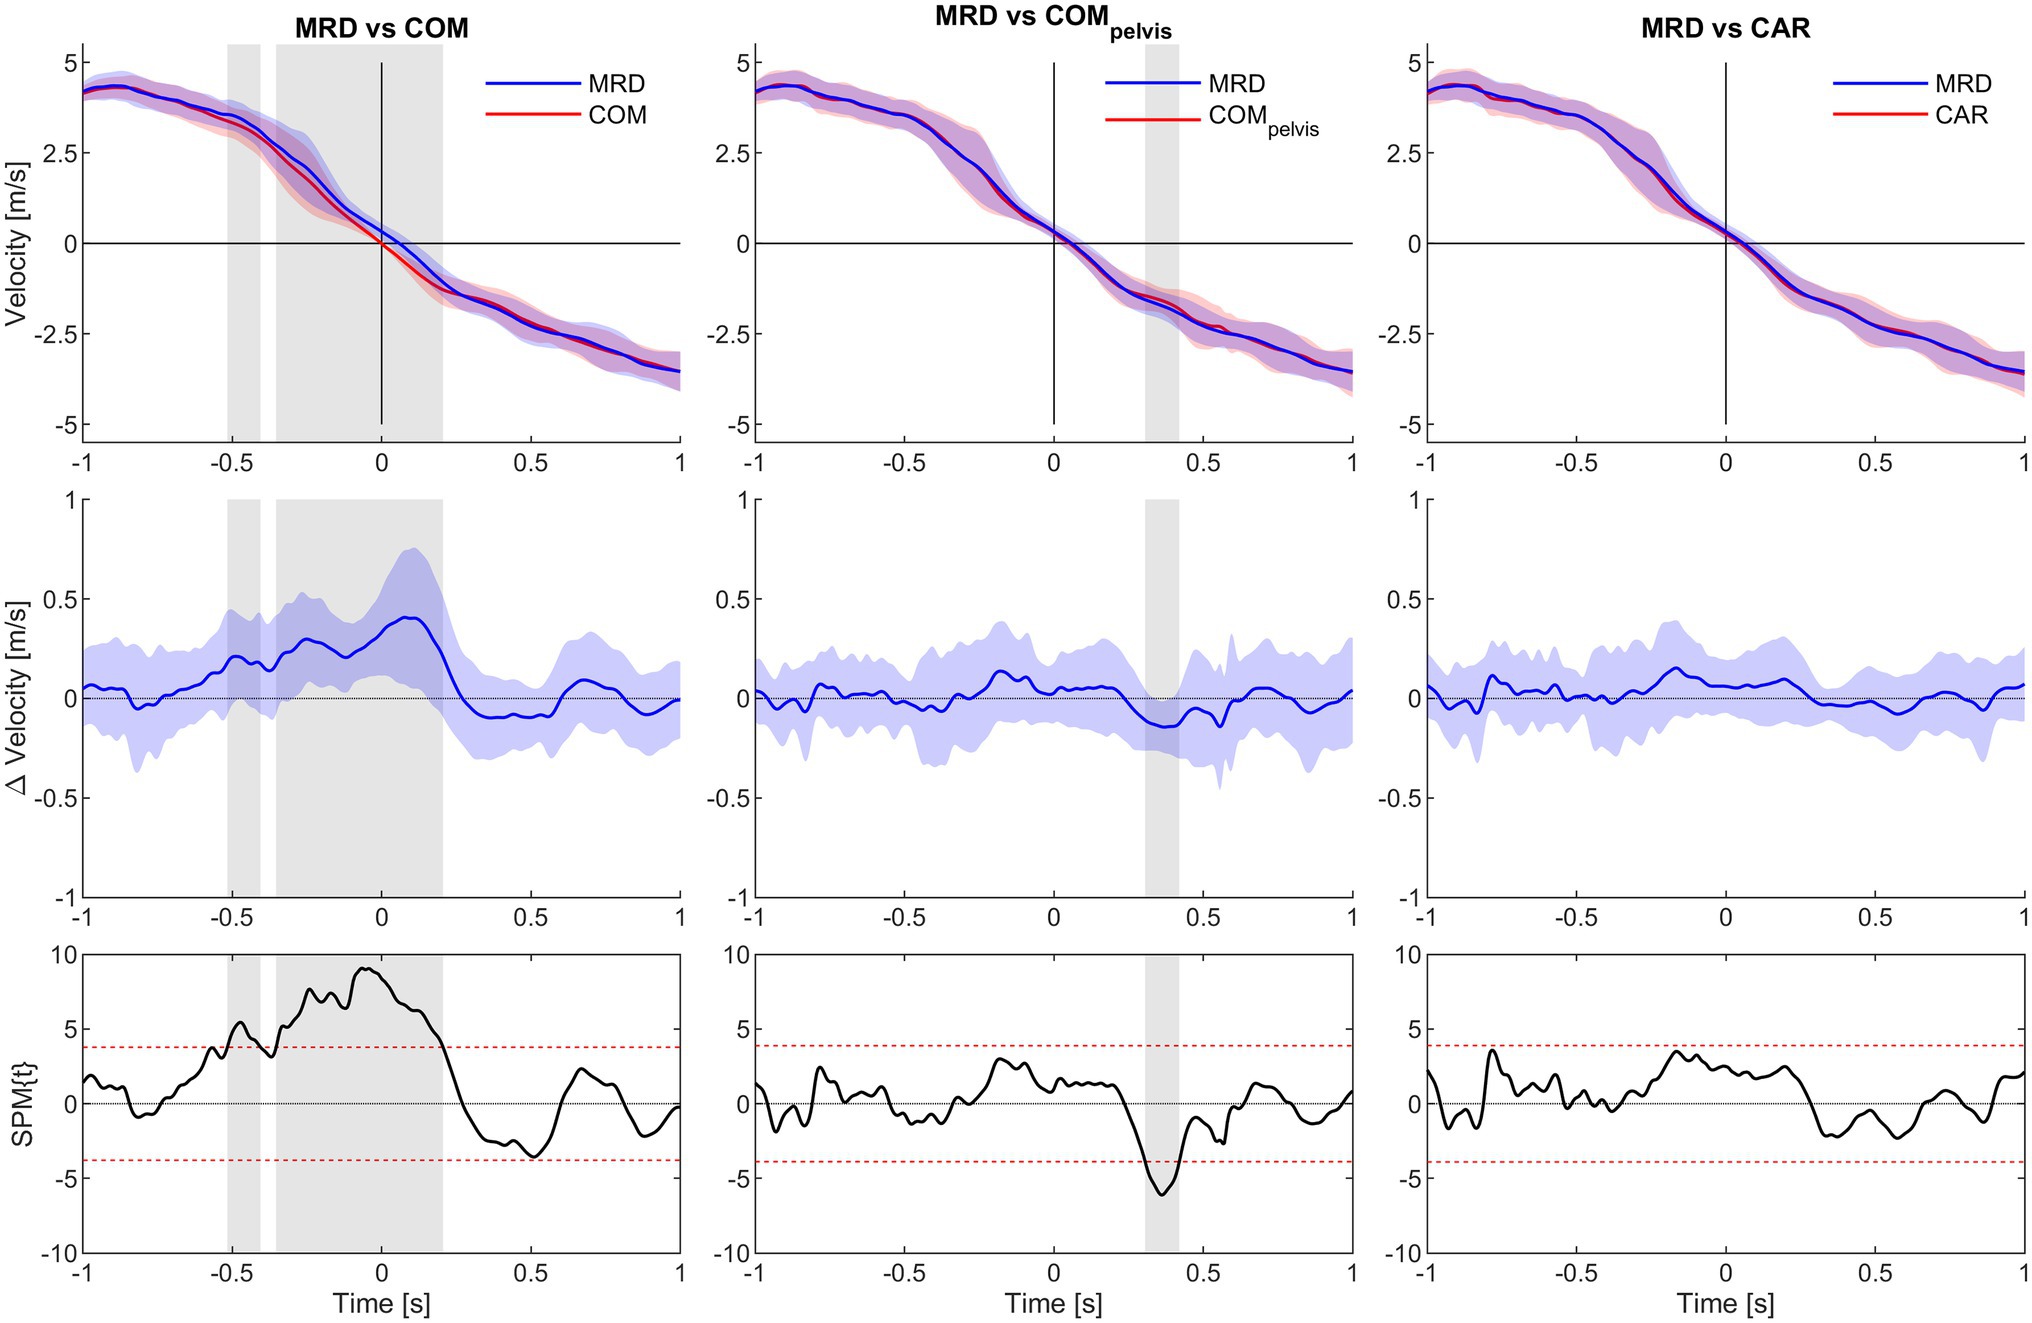
Figure 7. SPM analysis of average velocity for 1.0 s time interval before (−) and after (+) CoD (horizontal axis all graphs) for the 9 kg condition. Columns left to right show MRD to COM, MRD to COMpelvis and MRD to CAR comparisons. Top row show average velocity of all trials with 95% confidence interval for the MRD (blue) to COM, COMpelvis and CAR (red) comparisons. Middle row show difference in velocity with 95% confidence interval. Bottom row show SPM analysis with 95% confidence interval marked with red dashed lines. Grey vertical line identify time interval of significant difference (α < 0.05).
Discussion
The aim of this study was to explore validity of velocity measurements obtained from a MRD under different loaded conditions during a m505 test. The MRD provided valid velocity measurements as excellent correlation coefficients and CV values indicate a close relationship between motion capture data and MRDvel in each phase of the CoD. Furthermore, this excellent relationship is maintained for the different loaded conditions. The observed biases differ when MRDvel is compared to CARvel, COMpelvis_vel, and COMvel for the different time intervals. Specifically, the MRDvel to CARvel comparison yielded small observed biases for all time intervals, which increased for the COMpelvis_vel and COMvel comparison.
The same MRD has been compared to timing gate measurements previously in sprint running (Rakovic et al., 2022). The outcome measurements in that study were 0–30 m split time measurements with fair to excellent correlations (0.48–0.95). Overall, better correlations were observed in the current study during a m505 task as they were excellent with one exception (Table 2). The excellent correlations highlight the strong relationship between the different outcome variables for the different time intervals, but do not provide information about agreement, which was explored using Bland–Altman analysis. The smallest biases were observed between MRDvel and CARvel for all time intervals captured during the CoD. The same MRD yielded small biases and was within the limits of precision of ±0.01 s for 5–30 m linear sprint split times, with exception being the 0–5 m interval which is explained by onset of measurement (Rakovic et al., 2022). If the average 5-min split times (5–20 m) from that study is converted to velocity, the observed velocity bias range from 0.011 to 0.082 m/s (Rakovic et al., 2022). Based on these values, the observed biases in the current study for the CARvel comparisons are smaller, the COMpelvis_vel comparisons comparable, while the COMvel comparisons have greater biases. However, it is important to note that split time velocity measurements in a linear sprint are greater, which makes the relative values smaller. The greater observed biases for the COMpelvis_vel and COMvel comparisons can be explained by the fact that they are based on calculations from multiple markers on the pelvis and whole body, respectively. Especially, COMvel calculations are subject to both upper and lower extremity movements, which are not measured by the MRD, as the point of attachment to the subject is on a pelvic belt. However, the valid velocity measurements of both a single point (CARvel) and pelvis (COMpelvis_vel) are useful. In fact, in linear sprint both laser and radar are accepted measures of athlete movement and used for validation purposes (Morin et al., 2019). Laser measurements of linear sprint are based on one point, or a moving point, on the backside of the athlete performing the sprint that has proven useful in linear sprint assessments. This procedure is similar to the CARvel measurement in the current study.
Obviously external load will impact overall CoD test performance time through providing “assistance” and “resistance” during different phases of the CoD. For example, during the initial acceleration-to-deceleration phase (phase 1a) and due to the positioning of the MRD, the athlete is “assisted” as they accelerate and then decelerate prior to CoD. In contrast, during the re-acceleration phase (phase 1b) the athlete is faced with a resisted load that would essentially reduce whole body acceleration, especially with increasing external load (i.e., 3–9 kg). Indeed, in the current study overall time went from 3.26 s with 3 kg, to 3.32 s for 6 kg, to 3.52 s for the 9 kg external load. Furthermore, the observed standard deviations for overall time for the different load conditions ranged from 0.29 to 0.35 s indicating a fairly wide distribution of performances on the m505 resisted test. This ensures validity over a greater range of performances. Furthermore, the inclusion of both males and females as well as different sports (soccer, basketball, handball, tennis, and floorball) improves validity to encompass different ball sports and gender. However, phase-specific comparisons of measurements (time, distance, and average velocity) have not been done as the authors are unaware of such information being reported elsewhere.
Phase-specific information obtained during a 45 and 90° CoD test has previously been explored using two synchronized laser guns (Hader et al., 2015). However, only overall time was validated against timing gates, while reliability analysis included peak and distance-to-peak acceleration, deceleration, and speed, along with minimum speed, and speed between 8 and 12 m that represented the distance 2 m prior and 2 m after the CoD. The CV values for speed around the 8–12 m distance were ~5%, and for phase-specific information CV values ranged from 6.6 to 8.5% for peak acceleration, and from 117 to 12.6% for peak and distance-to-peak deceleration. In the current validity study, CV values for average velocity measurements for the different time intervals ranged from 0.3 to 7.7% for all comparisons. Overall, these CV values are smaller than those reported by Hader and co-author, but it is important to emphasize that our CV values represent phase-specific validity of velocity measurements, while those reported by Hader and co-workers represent phase-specific reliability of different variables computed from meter-to-meter changes in speed over time recorded at 100 Hz. In the current study, continuous velocity measurements recorded at 333 Hz were analyzed, which might be more suitable to obtain rapid acceleration and deceleration data during CoD. Furthermore, the correlations of overall time reported by Hader and co-authors, which they used for validity analysis, are similar to those observed in the current study.
Motion capture data for the full m505 test would have allowed for more comparisons to MRDvel, especially the 1.5 to 1.0 s interval before and after the CoD (Table 2). Trials included for the time intervals 1 s prior to and after the CoD included a large percentage of total tests done and ranged from 38 to 44 tests. However, for the time intervals 1.5 to 1.0 s before and after CoD the number of tests analyzed ranged from 8 to 22 tests. The reason for this lower number of tests was quality of kinematic data. The recording volume included the start and end position of the m505 test, but there were challenges getting good quality kinematic data of markers necessary for the analysis. This might be due to fewer cameras being able to observe all markers at the start and the end of the test. Furthermore, the above is also the reason why the SPM analysis was employed for 1 s before and after CoD. In addition, the reason for selecting 1.5 s pre- and post-CoD was that others have found total m505 test times to be in the range of 2–3 s (Nimphius et al., 2017). The above in combination with not removing any outliers (Hoaglin et al., 1986) might explain why moderate correlation (ρ = 0.53) was observed for the MRDvel to COMvel comparison for the t1.0–1.5 time interval with 6 kg external load.
Furthermore, MRDvel and kinematic data were synchronized by cross-correlation in post-processing, which may have impacted our results. However, from the mostly excellent correlations, small CV values and biases for the CARvel as well as for the COMvel and COMpelvis_vel comparison it appears that the continuous velocity measurements obtained by the MRD is a valid representation of subject velocity during the different phases of a m505 test. Since the m505 is performed across short distances (i.e., 5 m in and out of CoD), future research should look to examine the validity of the motorized device when entry velocity on approach to CoD and deceleration demands are higher.
The impulse–momentum relationship dictates that the ability to generate horizontal forces during both initial acceleration-to-deceleration and re-acceleration phases are key to CoD performance. During deceleration, horizontally oriented braking forces are important to performance of 505 CoD tests (Dos’Santos et al., 2020), while during acceleration the horizontal propulsive component of the ground reaction force is important to performance (Morin et al., 2011). Based on these findings and the high horizontal deceleration and acceleration demands in team sports (Harper et al., 2019), providing horizontal load prescription for training to improve CoD ability could be of considerable importance. Specifically, external load provided by motorized resistance will provide “assistance” and “resistance” during different phases of the CoD. Consequently, the application of horizontal loading with different resisted or assisted loads and how the athlete starts (moving away or toward the device) might further improve not only testing, but also training strategies to target CoD ability.
Conclusion
The velocity measurements obtained by a MRD during a m505 test are valid when compared to three-dimensional motion analysis data. Validity analyses yielded low biases and CV values with excellent correlations for the MRDvel to CARvel comparison. The increased observed biases and lower CV values for the COMvel and COMpelvis_vel comparisons are to be expected as the MRD represent movement of the point of attachment to the athlete, especially for the COMvel comparison as the kinematic method used quantifies upper and lower extremity movements during the test. As single points of measurement (i.e., laser) are useful to assess other athletic tasks (i.e., sprint running), the single point CARvel comparison is appropriate for the m505 test. Thus, velocity measurements obtained from a MRD during the m505 test provide researchers and coaches alike with new opportunities to advance assessment and understanding of their athletes CoD abilities.
Practical Applications
Our findings have the potential to influence not only field, but also lab-based testing and training of CoD. Continuous and phase-specific information (time, distance, and average velocity) can provide coaches with important information that previously only was available in a lab setting. In turn, such information can be used to target specific CoD phases in training with the use of horizontal loading. Furthermore, how velocity changes during a m505 tests may allow for calculation of change of momentum during the test and thereby increase our understanding of this important quality in a much more time efficient manner (Nimphius et al., 2017). In addition, the MRD used in the current study provides opportunity to explore athletes deceleration performance during CoD in more detail than was previously possible, similar to methods described using a radar device during a horizontal acceleration-to-deceleration test (Harper et al., 2020).
Data Availability Statement
The raw data supporting the conclusions of this article will be made available by the authors, without undue reservation.
Ethics Statement
The studies involving human participants were reviewed and approved by Norwegian School of Sport Sciences. Written informed consent to participate in this study was provided by the participants’ legal guardian/next of kin.
Author Contributions
OE, FA, DH, and ØG contributed to the data collection, interpretation, and revising the manuscript. The original study design was made by OE and ØG and discussed with FA.
Conflict of Interest
OE is a shareholder in 1080 Motion AB and 1080 MAP AS.
The remaining authors declare that the research was conducted in the absence of any commercial or financial relationships that could be construed as a potential conflict of interest.
Publisher’s Note
All claims expressed in this article are solely those of the authors and do not necessarily represent those of their affiliated organizations, or those of the publisher, the editors and the reviewers. Any product that may be evaluated in this article, or claim that may be made by its manufacturer, is not guaranteed or endorsed by the publisher.
References
Barber, O. R., Thomas, C., Jones, P. A., McMahon, J. J., and Comfort, P. (2016). Reliability of the 505 change-of-direction test in netball players. Int. J. Sports Physiol. Perform. 11, 377–380. doi: 10.1123/ijspp.2015-0215
Bell, A. L., Brand, R. A., and Pedersen, D. R. (1989). Prediction of hip joint centre location from external landmarks. Hum. Mov. Sci. 8, 3–16. doi: 10.1016/0167-9457(89)90020-1
Buchheit, M., Haydar, B., and Ahmaidi, S. (2012). Repeated sprints with directional changes: do angles matter? J. Sports Sci. 30, 555–562. doi: 10.1080/02640414.2012.658079
Buchheit, M., Samozino, P., Glynn, J. A., Michael, B. S., Al Haddad, H., Mendez-Villanueva, A., et al. (2014). Mechanical determinants of acceleration and maximal sprinting speed in highly trained young soccer players. J. Sports Sci. 32, 1906–1913. doi: 10.1080/02640414.2014.965191
Clarke, R., Read, P. J., De Ste Croix, M. B. A., and Hughes, J. D. (2020). The deceleration deficit: a novel field-based method to quantify deceleration during change of direction performance. J. Strength Cond. Res. doi: 10.1519/JSC.0000000000003856, [Epub ahead of print] (Epub ahead of print)
DeWeese, B., and Nimphius, S. (2016). “Speed and agility program design and technique,” in Essentials of Strength and Conditioning. eds. N. T. Triplett and G. G. Haff (Champaign, IL: Human Kinetics), 521–557.
Dos’Santos, T., McBurnie, A., Thomas, C., Comfort, P., and Jones, P. A. (2020). Biomechanical determinants of the modified and traditional 505 change of direction speed test. J. Strength Cond. Res. 34, 1285–1296. doi: 10.1519/Jsc.0000000000003439
Dos’Santos, T., Thomas, C., Comfort, P., and Jones, P. A. (2018). The effect of angle and velocity on change of direction biomechanics: an angle-velocity trade-off. Sports Med. 48, 2235–2253. doi: 10.1007/s40279-018-0968-3
Dos’Santos, T., Thomas, C., Jones, P. A., and Comfort, P. (2017). Mechanical determinants of faster change of direction speed performance in male athletes. J. Strength Cond. Res. 31, 696–705. doi: 10.1519/JSC.0000000000001535
Draper, J. A., and Lancaster, M. G. (1985). The 505 test: a test for agility in the horizontal plane. Aust. J. Sci. Med. 17, 15–18.
Faude, O., Koch, T., and Meyer, T. (2012). Straight sprinting is the most frequent action in goal situations in professional football. J. Sports Sci. 30, 625–631. doi: 10.1080/02640414.2012.665940
Fernandes, R., Bishop, C., Turner, A. N., Chavda, S., and Maloney, S. J. (2020). Train the engine or the brakes? Influence of momentum on the change of direction deficit. Int. J. Sports Physiol. Perform. 16, 90–96. doi: 10.1123/ijspp.2019-1007
Fox, A., Spittle, M., Otago, L., and Saunders, N. (2014). Offensive agility techniques performed during international netball competition. Int. J. Sports Sci. Coaching 9, 543–552. doi: 10.1260/1747-9541.9.3.543
Gil, S., Ruiz, F., Irazusta, A., Gil, J., and Irazusta, J. (2007). Selection of young soccer players in terms of anthropometric and physiological factors. J. Sports Med. Phys. Fitness 47, 25–32.
Hader, K., Palazzi, D., and Buchheit, M. (2015). Change of direction speed in soccer: how much braking is enough? Kinesiology 47, 67–74.
Harper, D. J., Carling, C., and Kiely, J. (2019). High-intensity acceleration and deceleration demands in elite team sports competitive match play: a systematic review and meta-analysis of observational studies. Sports Med. 49, 1923–1947. doi: 10.1007/s40279-019-01170-1
Harper, D. J., Morin, J. B., Carling, C., and Kiely, J. (2020). Measuring maximal horizontal deceleration ability using radar technology: reliability and sensitivity of kinematic and kinetic variables. Sports Biomech. 1–17. doi: 10.1080/14763141.2020.1792968 [Epub ahead of print]
Hoaglin, D. C., Iglewicz, B., and Tukey, J. W. (1986). Performance of some resistant rules for outlier labeling. J. Am. Stat. Assoc. 81, 991–999. doi: 10.2307/2289073
Hopkins, W.G. (2011). A new view of statistics [Online]. Available at: http://www.sportsci.org/resource/stats/valid.html (Accessed May 5 2021).
Lahti, J., Jimenez-Reyes, P., Cross, M. R., Samozino, P., Chassaing, P., Simond-Cote, B., et al. (2020). Individual sprint force-velocity profile adaptations to in-season assisted and resisted velocity-based training in professional rugby. Sports 8:74. doi: 10.3390/sports8050074
Leardini, A., Biagi, F., Merlo, A., Belvedere, C., and Benedetti, M. G. (2011). Multi-segment trunk kinematics during locomotion and elementary exercises. Clin. Biomech. 26, 562–571. doi: 10.1016/j.clinbiomech.2011.01.015
Luteberget, L. S., and Gilgien, M. (2020). Validation methods for global and local positioning-based athlete monitoring systems in team sports: a scoping review. BMJ Open Sport Exerc. Med. 6:e000794. doi: 10.1136/bmjsem-2020-000794
McGee, K. J., and Burkett, L. N. (2003). The National Football League combine: a reliable predictor of draft status? J. Strength Cond. Res. 17, 6–11. doi: 10.1519/1533-4287(2003)017<0006:tnflca>2.0.co;2
McMahon, J. J., Suchomel, T. J., Lake, J. P., and Comfort, P. (2018). Understanding the key phases of the countermovement jump force-time curve. Strength Cond. J. 40, 96–106. doi: 10.1519/Ssc.0000000000000375
Meylan, C., Trewin, J., and McKean, K. (2017). Quantifying explosive actions in international women’s soccer. Int. J. Sports Physiol. Perform. 12, 310–315. doi: 10.1123/ijspp.2015-0520
Mohamad Zahidi, N. N., and Ismail, S. I. (2018). Notational analysis of evasive agility skills executed by attacking ball carriers among elite rugby players of the 2015 Rugby World Cup. Mov. Health Exercise 7, 99–113. doi: 10.15282/MOHE.V7I1.171
Morin, J. B., Edouard, P., and Samozino, P. (2011). Technical ability of force application as a determinant factor of sprint performance. Med. Sci. Sports Exerc. 43, 1680–1688. doi: 10.1249/MSS.0b013e318216ea37
Morin, J. B., Samozino, P., Murata, M., Cross, M. R., and Nagahara, R. (2019). A simple method for computing sprint acceleration kinetics from running velocity data: replication study with improved design. J. Biomech. 94, 82–87. doi: 10.1016/j.jbiomech.2019.07.020
Nimphius, S., Callaghan, S. J., Bezodis, N. E., and Lockie, R. G. (2017). Change of direction and agility tests: challenging our current measures of performance. J. Strength Cond. Res. 40, 26–38. doi: 10.1519/SSC.0000000000000309
Nimphius, S., Callaghan, S. J., Spiteri, T., and Lockie, R. G. (2016). Change of direction deficit: a more isolated measure of change of direction performance than total 505 time. J. Strength Cond. Res. 30, 3024–3032. doi: 10.1519/JSC.0000000000001421
Nimphius, S., McGuigan, M. R., and Newton, R. U. (2013). Is there a pacing strategy during a 505 change of direction test in adolescents. J. Strength Cond. Res. 27, S104–S105.
Pataky, T. C., Vanrenterghem, J., and Robinson, M. A. (2015). Zero- vs. one-dimensional, parametric vs. non-parametric, and confidence interval vs. hypothesis testing procedures in one-dimensional biomechanical trajectory analysis. J. Biomech. 48, 1277–1285. doi: 10.1016/j.jbiomech.2015.02.051
Rakovic, E., Paulsen, G., Helland, C., Eriksrud, O., and Haugen, T. (2018). The effect of individualised sprint training in elite female team sport athletes: a pilot study. J. Sports Sci. 36, 2802–2808. doi: 10.1080/02640414.2018.1474536
Rakovic, E., Paulsen, G., Helland, C., Haugen, T., and Eriksrud, O. (2022). Validity and reliability of a robotic resistance device. J. Strength Cond. Res. 5. doi: 10.1519/JSC.0000000000003830
Reilly, T., Williams, A. M., Nevill, A., and Franks, A. (2000). A multidisciplinary approach to talent identification in soccer. J. Sports Sci. 18, 695–702. doi: 10.1080/02640410050120078
Robertson, D.G.E., Caldwell, G.E., Hamill, J., Kamen, G., and Whittlesey, S.N. (2014). Research Methods in Biomechanics. Champaign: Human Kinetics
Sayers, M. G. L. (2015). Influence of test distance on change of direction speed test results. J. Strength Cond. Res. 29, 2412–2416. doi: 10.1519/Jsc.0000000000001045
Taylor, J. M., Cunningham, L., Hood, P., Thorne, B., Irvin, G., and Weston, M. (2019). The reliability of a modified 505 test and change-of-direction deficit time in elite youth football players. Scie. Med. Football 3, 157–162. doi: 10.1080/24733938.2018.1526402
Vescovi, J. D., and McGuigan, M. R. (2008). Relationships between sprinting, agility, and jump ability in female athletes. J. Sports Sci. 26, 97–107. doi: 10.1080/02640410701348644
Wheeler, K. W., Askew, C. D., and Sayers, M. G. (2010). Effective attacking strategies in rugby union. Eur. J. Sport Sci. 10, 237–242. doi: 10.1080/17461391.2010.482595
Wu, G., Siegler, S., Allard, P., Kirtley, C., Leardini, A., Rosenbaum, D., et al. (2002). ISB recommendation on definitions of joint coordinate system of various joints for the reporting of human joint motion--part I: ankle, hip, and spine. International Society of Biomechanics. J. Biomech. 35, 543–548. doi: 10.1016/S0021-9290(01)00222-6
Wu, G., van der Helm, F. C., Veeger, H. E., Makhsous, M., Van Roy, P., Anglin, C., et al. (2005). ISB recommendation on definitions of joint coordinate systems of various joints for the reporting of human joint motion--part II: shoulder, elbow, wrist and hand. J. Biomech. 38, 981–992. doi: 10.1016/j.jbiomech.2004.05.042
Keywords: kinematic analysis, phase analysis, performance, motorized resistance technology, acceleration, deceleration
Citation: Eriksrud O, Ahlbeck F, Harper D and Gløersen Ø (2022) Validity of Velocity Measurements of a Motorized Resistance Device During Change of Direction. Front. Physiol. 13:824606. doi: 10.3389/fphys.2022.824606
Edited by:
Predrag R. Bozic, Serbian Institute of Sport and Sports Medicine (SISSM), SerbiaCopyright © 2022 Eriksrud, Ahlbeck, Harper and Gløersen. This is an open-access article distributed under the terms of the Creative Commons Attribution License (CC BY). The use, distribution or reproduction in other forums is permitted, provided the original author(s) and the copyright owner(s) are credited and that the original publication in this journal is cited, in accordance with accepted academic practice. No use, distribution or reproduction is permitted which does not comply with these terms.
*Correspondence: Ola Eriksrud, b2xhZUBuaWgubm8=