 Brandon Meter1
 Lukáš Kratochvíl
 Lukáš Kubička
 Zuzana Starostová
- 1Department of Zoology, Faculty of Science, Charles University in Prague, Prague, Czechia
- 2Department of Ecology, Faculty of Science, Charles University in Prague, Prague, Czechia
Squamate reptiles have been considered to be indeterminate growers for a long time. However, recent studies demonstrate that bone prolongation is stopped in many lizards by the closure of bone growth plates. This shift in the paradigm of lizard growth has important consequences for questions concerning the proximate causes of sexual size dimorphism. The traditional model of highly plastic and indeterminate growth would correspond more to a long-term action of a sex-specific growth regulator. On the other hand, determinate growth would be more consistent with a regulator acting in a sex-specific manner on the activity of bone growth plates operating during the phase when a dimorphism in size develops. We followed the growth of males and females of the male-larger Madagascar ground gecko (Paroedura picta) and monitored the activity of bone growth plates, gonad size, levels of steroids, expression of their receptors (AR, ESR1), and expression of genes from the insulin-like growth factor network (IGF1, IGF2, IGF1R, and IGF2R) in livers. Specifically, we measured gene expression before the onset of dimorphic growth, at the time when males have more active bone growth plates and sexual size dimorphism was clearly visible, and after a period of pronounced growth in both sexes. We found a significant spike in the expression of IGF1 in males around the time when dimorphism develops. This overexpression in males comes long after an increase in circulating testosterone levels and sexual maturation in males, and it might be suppressed by ovarian hormones in females. The results suggest that sexual size dimorphism in male-larger lizards can be caused by a positive effect of high levels of IGF1 on bone growth. The peak in IGF1 resembles the situation during the pubertal growth spurt in humans, but in lizards, it seems to be sex-specific and disconnected from sexual maturation.
Introduction
Animals differ in growth patterns. Some animals stop growing before sexual maturation, e.g. most insects which are not able to change their structural size as imagoes due to rigid exoskeleton, while others used to be assigned as indeterminate growers. Among vertebrates, endotherms (mammals and birds) are traditionally viewed as determinate growers, while non-avian reptiles, amphibians, and fish as indeterminate growers (Kozłowski, 1996; Charnov et al., 2001; Geiger et al., 2014; Hariharan et al., 2015). However, this dichotomy is shaking now. Many reptiles, particularly lizards, do in fact stop growing and attain a final body size. However, they typically do so long after sexual maturation (Frýdlová et al., 2019; Frýdlová et al., 2020). The reasons for this are still unclear, in a previous review we speculated that due to a much lower metabolic rate, growth in ectotherms is slow and that they attain final body size much later, which forces them to start reproduction much before reaching the final, possibly optimal body size. Endotherms with more rapid growth can postpone reproduction after they attain an optimal body size (Meter et al., 2020). Alternatively, it could be explained by the energetically demanding nature of endothermy and a trade-off between reproduction, growth, and body temperature maintenance (Werner et al., 2018). The new perspective on lizards as determinate growers has important consequences for the search for the proximate mechanisms of sexual size dimorphism (SSD), i.e., the size difference between sexes of a species, and its measurement. Under determinate growth, SSD should be best expressed as a size difference between fully grown males and females, and it should reflect the processes largely influencing the cessation of growth in a sex-specific manner.
SSD is widespread in reptiles and can differ in direction even among closely related species (Cox et al., 2007; Starostová et al., 2010). Finding a proximate mechanism of SSD development in vertebrates is a complex task. Several hypotheses on the proximate cause of SSD have been proposed in squamate reptiles. In most squamates as well as in many other vertebrates, there is little if any SSD at hatching, and the early growth is monomorphic (Badyaev, 2002). SSD develops only later in ontogeny through dissociation of male and female growth trajectories. But which sex-specific growth modifiers do in fact drive this dissociation? Sexes in some vertebrates do not differ in genomes, e.g. in sequential hermaphrodites and species with environmental sex determination (Janzen and Phillips, 2006; Johnson Pokorná and Kratochvíl, 2016; Todd et al., 2016; Katona et al., 2021), but still often substantially differ in body size. In them, sex-specific growth modifiers cannot be attributed to genetic differences between sexes. But also, in species with genotypic sex determination, an overwhelming majority of tetrapods (Kostmann et al., 2021), sex-specific modification of growth is mostly triggered by differential expression during development, not directly by sex-linked genes. It can be exemplified by how easily growth can be altered by gonad manipulations, e.g. ovariectomy leads to male-typical growth in several squamate species (Cox, 2006; Starostová et al., 2013; Cox et al., 2016; Kubička et al., 2017; Cox, 2019).
The cost of reproduction hypothesis postulates that SSD is plastic with respect to energy allocation. SSD should reflect energetic costs of reproduction and the sex allocating less to reproduction should grow larger (Cox, 2006; Cox et al., 2009; Hayward and Gillooly, 2011; Cox et al., 2016). This hypothesis was supported by manipulative experiments in male-larger species, where ovariectomized females were masculinized in growth (Cox, 2006; Cox and Calsbeek, 2010; Starostová et al., 2013; Cox et al., 2016). Nevertheless, unilateral ovariectomy, dramatically decreasing the allocation to reproduction, but at the same time preserving the cycling of ovarian hormones, did not lead to enhanced structural growth in male-larger gecko Paroedura picta. It suggests that ovariectomy does not remove only the energetic costs of reproduction, but also endocrinologically active organs producing hormones affecting growth (Kubička et al., 2017).
The ontogeny of SSD was also suggested to be controlled by circulating levels of male gonadal androgens, which should trigger enhanced growth in male-larger species and inhibit growth in female-larger species (Cox et al., 2005; Cox et al., 2009; Duncan et al., 2020). However, most of the support came from relatively short-term studies done under the view that lizards are indeterminate growers, and there was thus no control in these studies on whether the animals already stopped growth or not. The long-term growth experiments comparing growth in castrated and control males do not support the role of male gonadal androgen neither in male-larger species, namely the gecko P. picta (Starostová et al., 2013; Kubička et al., 2015) and the chameleon Chamaeleo calyptratus (Bauerová et al., 2020), nor in the female-larger gecko Aeluroscalabotes felinus (Kubička et al., 2013). It was also noted that the increase of testosterone levels in males does not coincide with the period of sexually dimorphic growth in a rattlesnake and the gecko P. picta (Taylor and DeNardo, 2005; Kubička et al., 2022).
An alternative proximate mechanism of SSD development is the control by ovarian hormones (Schmidt et al., 2000; Starostová et al., 2013). This hypothesis was supported by a coincidence in the start of female reproductive cycles with the feminization of growth (Starostová et al., 2013); by a pattern of female-typical growth (Kubička et al., 2022); and by the observation of defeminization of growth after ovariectomy and by the strong negative effect of exogenous estradiol on growth in male-larger gecko P. picta (Kubička et al., 2017).
The presented pattern of growth in squamates suggests that the sex-specific growth modifier should not be expressed at the early growth when growth is not sexually dimorphic. It should be detectable at the time of dimorphic growth before the cessation of bone prolongation. It should keep temporarily the higher activity of bone growth plate in the larger sex, and switch again to a non-dimorphic level (or at least it should lose its positive effect on growth in the larger sex) after senescence of growth plates.
To uncover the candidate sex-specific growth modifier, we monitored the growth, the activity of growth plates, size of reproductive organs, and levels of testosterone and estradiol in males and females of P. picta from hatching till the age when growth is already stopped, or at least when it is negligible (Kubička et al., 2022). Based on their ontogenetic stage, we selected individual age groups from this experiment, and we measured in them the expression of candidate genes, potential sex-specific regulators in livers, the major metabolic organ. Namely, we measured the expression of receptors of steroid hormones and members of the insulin/insulin-like growth signaling pathway: estrogen receptor alpha (ESR1), androgen receptor (AR) as well as insulin-like growth factors one and two (IGF1/IGF2) and their receptors (IGF1R/IGF2R).
The insulin and insulin-like signaling molecular networks are composed of many receptors but mainly the insulin-like growth factor network has a strong relation to growth. IGF1 and its counterpart IGF2 have roles in cell growth and proliferation as they are mediators of the growth hormone action (Schwartz and Bronikowski, 2016). The role of IGF1 and IGF2 in the growth of reptiles has been well documented (Reding et al., 2016; Beatty and Schwartz, 2020; Duncan et al., 2020; Marks et al., 2021). IGF1 has been assumed to be a postnatal growth factor and IGF2 to be a prenatal growth factor, but this assumption has been challenged in reptiles (Beatty and Schwartz, 2020). IGF1 and IGF2 compete to bind to insulin receptors and IGF1R which have a role in cell proliferation and growth (Denley et al., 2005; Schwartz and Bronikowski, 2016). IGF1 plasma levels have also been associated with reproduction (Guillette et al., 1996; Sparkman et al., 2010), and its gene expression is affected by nutrition in reptiles (Duncan et al., 2015; Marks et al., 2021). The role of IGF1 in growth in humans and mice is best transcribed in its role in postnatal bone elongation. Hepatic levels of IGF1 have a role in longitudinal bone growth as well as local IGF1 levels in growth plates while affecting chondrocyte differentiation and maturation and therefore their closing (Yakar et al., 2018; Racine and Serrat, 2020). Plasma levels of IGF1 were found to be major determinants of sexually biased skeletal dimorphism in mice and tied with puberty (Callewaert et al., 2010). Radial bone growth has also been found to be affected by IGF1 levels (Yakar et al., 2018).
Previous papers on reptiles using absolute quantification gene expression indicated that IGF2 has a role in postnatal growth in reptiles with levels being higher than in IGF1 (Reding et al., 2016; Beatty and Schwartz, 2020). This is similar to the plasma levels trends in other vertebrates (de Beer et al., 2008; Fowke et al., 2010) but not rodents (Brown et al., 1986). IGF2 binds to IGF2R which acts negatively toward IGF2 since it degrades IGF2 to maintain non-excessive levels and therefore negatively regulates the insulin/insulin-like signaling network (Ghosh et al., 2003; Denley et al., 2005). This function is still unclear in reptiles (Schwartz and Bronikowski, 2016). However, we do know that this binding is potentially significant in lizards (Sivaramakrishna et al., 2009). IGF2 has also been found to have a highly conserved sequence in squamates (Schwartz and Bronikowski, 2016) while in contrast, IGF1 is quite variable amongst reptiles (Schwartz and Bronikowski, 2016; Yamagishi et al., 2016).
The androgen pathway and namely the hormone testosterone has been linked to sexual dimorphism in the past (Zauner et al., 2003; Cox et al., 2005, 2007). Testosterone and dihydrotestosterone have been found to trigger their biological activities through binding to the AR (Heinlein and Chang, 2002). Estrogens bind to two different receptors, the ESR1, and estrogen receptor beta (ESR2) which are expressed differently in different tissues and can have differential roles (Sanger et al., 2014; Bondesson et al., 2015).
Our study assesses the gene expression of target genes by quantitative reverse transcription PCR (RT-qPCR) to determine relative gene expression between selected stages of growth to uncover genes responsible for sexually dimorphic growth in a male-larger species. We expect that a member of the crucial pathways modifying growth in a sex-specific manner should be differentially expressed during the time when sexual dimorphism emerges in the ontogeny.
Materials and methods
Model species
The gecko P. picta has become a model species for studies of reptile growth and ontogeny (reviewed in Meter et al., 2020). The species was used for this experiment specifically due to its male-larger SSD and availability of genetic information with both whole-genome and transcriptome data being available (Hara et al., 2015; Hara et al., 2018), which enabled the design of primers for candidate genes. Our working hypothesis of the male-larger SSD in our model species P. picta is the combative and territorial nature of males driving intersexual selection. Such male-typical territorial behavior was confirmed in a series of experiments (e.g., Golinski et al., 2014; Schořálková et al., 2018).
Experimental animals
For the present study, we used individuals of P. picta from the specifically selected age groups that were reared in the experiment conducted by Kubička et al. (2022). Briefly, Kubička et al. (2022) followed growth in 256 individuals of P. picta, that were the progeny of the wild-caught animals or of the first generation in captivity. The experimental individuals were incubated and held individually after hatching at the constant temperature of 30°C (±0.2) and 12:12 h light–dark cycle. Animals were kept in a standardized box with a sandy substrate, water dish, and shelter and fed ad libitum twice a week with crickets powdered with vitamins and minerals. The growth of experimental animals was followed from hatching to up to the age of c. 22 months and divided into 14 age groups with approximately 6-week intervals. Animals were regularly weighed, and their snout-vent length (SVL) was measured. Maintaining typical physiological processes such as hormonal cycles in females was ensured by allowing animals to mate and reproduce. Once a female reached 4 months of age or a body mass of 7 g, it was mated with an unrelated experimental male of the same age. At the time the animals reached the age required for a particular cohort (ranging between 0 and 620 days), they were sacrificed by rapid decapitation, and samples were collected for future analyses. To maintain similar food availability across all age cohorts animals were not starved prior to the decapitation. Based on growth data for all individuals, the onset of sexually dimorphic growth, revealed by the breakpoint analysis, occurred at c. 180 days of age (Kubička et al., 2022). For our analyses, we selected animals at the beginning of the growth curve before the onset of dimorphic growth (≈42 days), at the time when males have more active bone growth plates and SSD was clearly visible (≈255 days; with two age groups added for target gene IGF1 ≈ 211 days; ≈ 307 days) and the end of the growth curve, i.e. after the period of pronounced growth in both sexes (≈512 days) (see Figure 1). Final body mass and SVL were taken immediately before euthanasia. The sex of each individual was confirmed by gonadal inspection and the mass of testicles and ovaries was recorded (except for the ovaries of 42 days old females as they were too small). Plasma for all 256 animals was used for measurements of levels of estradiol and testosterone, as described in Kubička et al. (2022) and showed in Supplementary Figures S1, S2, which gave us information about hormonal profiles across the ontogeny. Due to the necessity of pooling some plasma samples in small individuals, we did not use hormone levels directly in our statistical analyses. All raw data used in Kubička et al. (2022) are available in the Mendeley database (doi:10.17632/fxcdd6j4sh.1).
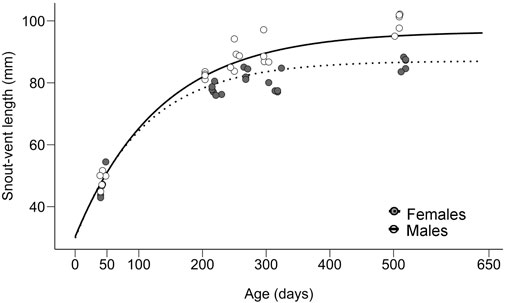
FIGURE 1. Sex-specific growth curves estimated from 256 individuals (data from Kubička et al., 2022.) and snout-vent lengths in males (solid line, white circles) and females (dotted line, grey circles) of Paroedura picta used for gene expression measurements.
Sample collection, RNA isolation and cDNA synthesis
Liver samples were collected from individuals of both sexes and different age groups. The liver was chosen as the target tissue because estrogen and testosterone metabolize in the organ while gonads were too small. Furthermore, the liver was also chosen as it had a higher expression of IGF1 and IGF2 than other tissues in several reptiles (Reding et al., 2016; Duncan et al., 2020; Marks et al., 2021), and differences in the expression of IGF1R/IGF2R in the liver were found between fast versus slow-growing sexually dimorphic snake (Reding et al., 2016). After dissection, the liver samples were quickly cut into small pieces and stored in RNAlater (Sigma-Aldrich Inc., Missouri, United States) at −20°C until used for RNA extraction. RNA was extracted according to the manufacturer’s protocol using the HighPure RNA tissue kit (Roche, Germany) and treated with DNase with a standardized amount of about 10 mg of liver tissue for each extraction. Each RNA sample had its concentration measured using the Quantus fluorometer (Promega Corporation, Madison, United States), and the Agilent 2,100 Bioanalyzer and Agilent RNA 6000 Nano Kit (Agilent Technologies, California, United States), were used to assess RNA integrity. Usually, samples with RNA integrity number (RIN) under 3 are considered heavily degraded, and samples with RIN between 3 and 5 are partially degraded (Farrell 2017). Our samples had RIN ranging from 4.6 to 9.8 and only a single sample had a RIN below 5 (4.6). The purity of RNA measured as A260/A280 ratios was determined with the NanoDrop One (Thermo Fisher Scientific Inc., Massachusetts, United States) and only samples with acceptable ratios (between 1.9 and 2.15) were kept in this experiment, as ratios around 2 are considered pure RNA (Farrell, 2017). Once extracted RNA samples were divided into aliquots and diluted to 50 ng/μl for the cDNA synthesis. All RNA samples were stored at −80°C. The RNA samples were reverse transcribed using the TATAA GrandScript cDNA synthesis kit (TATAA Biocenter, Sweden) with a standard amount of 500 ng of total RNA in each sample.
Quantitative reverse transcription PCR
Primer pairs for six target genes and three reference genes were designed (Table 1) using the BioEdit software (Hall, 1999) and published transcriptome of our target species (Hara et al., 2015; available at https://transcriptome.cdb.riken.jp/reptiliomix). In addition to the P. picta transcriptome, mRNA sequences for each gene of interest of different vertebrate species from the GenBank database were used in primer design. Reference gene 18S primers were the ones previously used in reptiles (Plot et al., 2012; Rollings et al., 2017). Products of each primer pair were sequenced and aligned with other mRNA sequences to verify their authenticity. The efficiency of each primer pair (Table 1) was assessed by creating a standard curve and using the software of the Lightcycler 480 PCR machine (Roche, Germany) for calculation. A pooled cDNA of samples from the different age and sex groups was used to create standard curves in dilution series 100,000; 20,000; 4,000; 800; and 160 copies to assess primer efficiency. The thermal cycle used for all the assays was as follows: 95°C for 30 s of activation, then 40 cycles of 5 s at 95°C followed by 58°C for 15 s and 72°C for 10 s of amplification cycles. Finally, a melting curve of 60–95°C was done after the final cycle to assess for possible secondary products.
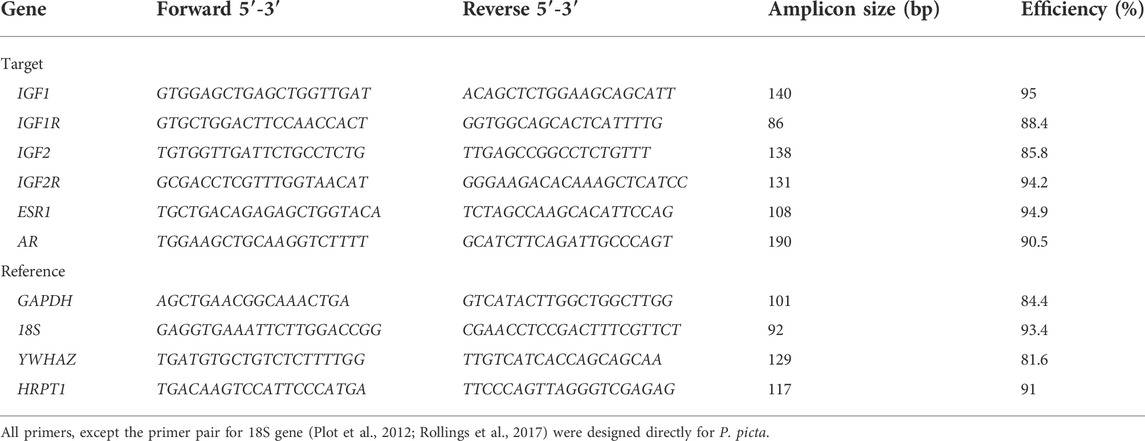
TABLE 1. Primer pairs of target and reference genes.
For the gene expression measurement, Cq values from 5 samples of each age/sex group were measured in triplicates in each assay (or primer pair). For each assay, triplicates of no-template controls (wells with nuclease-free water instead of cDNA—NTC) were used to assess for contaminations in reagents. In each well was used 5 μl of the TATAA® SYBR® green master mix (TATAA Biocenter, Sweden), 2.6 μl of nuclease-free water, 0.4 μl of forward and reverse primer (10 μM) respectively of the assay and finally 2 μl of the sample cDNA for a total of 10 μl. To ensure that comparisons could be drawn with all the reference and target assays, an interpolate calibrator (TATAA IPC kit, TATAA Biocenter, Sweden) was used on each plate in replicates on the same wells.
The relative gene expression of each individual for each target gene was calculated from the raw Cq values using the program R and the interface R studio (RStudio Team, 2019; Core Team, 2020). We first calculated mean Cq from technical replicates for each individual and target and reference gene. The R script used from our design followed a combination of the Vandesompele and Pfaffl method which considers the efficiency (Pfaffl, 2001) of all targets and the multiple reference genes (Vandesompele et al., 2002). The script also allowed for interplate calibration. This script for data analysis and the figures presented were done using R and several packages including the package “outliers” for statistical analysis, and the “ggplot2” package for a graphical representation (Komsta, 2011; Wickham, 2016). A number of packages were also used for data processing: “Tydiverse”, “dplyr”, “psych”, “stringr”, and “writexl” (Wickham, 2019; Wickham et al., 2019; Sievert, 2020; Ooms, 2021; Revelle, 2021; Wickham et al., 2021). Biological outliers of the groups for each target gene were signaled using statistical tests while triplicates were selected in accordance with their coefficient of variation. Triplicate outliers were verified from the raw Cq values while biological outliers were identified using the final relative expression.
For all reference genes and target genes, the efficiency of the primers (Table 1) was considered before normalization and calibration. Considering the efficiency of each gene allows for a more accurate calculation of the relative expression as described by Pfaffl (2001). For normalization the use of several reference genes opted for a more accurate normalization as described by Vandesompele et al. (2002), especially considering the species of interest is not commonly used for gene expression studies and finding a single adequate reference gene would be difficult. We selected four reference genes based on previous experimental work. Glyceraldehyde 3-phosphate dehydrogenase (GAPDH) has been used in mammals and reptiles (Coulson et al., 2008; Sanger et al., 2014) with limits under caloric restrictions (Gong et al., 2016; Marks et al., 2021). The 18S ribosomal RNA genes (18S) had a primer pair already validated previously in reptiles (Plot et al., 2012; Rollings et al., 2017). Gene tyrosine 3-monooxygenase/tryptophan 5-monooxygenase activation protein zeta (YWHAZ) had previously been used as a reference gene in several RT-qPCR studies in different tissue types (Coulson et al., 2008; Al-Sabah et al., 2016). Finally, the gene hypoxanthine-guanine phosphoribosyl transferase (HRPT1) was also found to be a suitable candidate in different species for different tissues (Stassen et al., 2015; Wang et al., 2018). A geometric mean of values of all four reference genes was taken as a reference for the measurement of target gene expression (Vandesompele et al., 2002).
Subsequent to the normalization step a group was chosen as a calibrator (females of age group 42 days) to calculate each sample’s relative expression to the mean of that group as described in the established methods (Livak and Schmittgen, 2001; Pfaffl, 2001). Finally, the resulting calculation was log-transformed (natural logarithm transformation) to give the final relative gene expression of each individual for each target gene as described in our Supplementary Material (Supplementary Table S1).
Statistical analysis
All statistical tests were done with the R program and the interface R studio (RStudio Team, 2019; Core Team, 2020). Biological outliers for each age and sex group were assessed using both Dixon and Grubbs’ tests using the package “outliers’ (Komsta, 2011). For triplicates coefficients of variation above 30% were deemed unacceptable and the replicates were either redone or two of the three Cq-values in a triplicate were kept if one was a clear outlier. Shapiro-Wilk test was used to check for normal distribution in the relative gene expression. Statistically significant differences between groups were assessed using ANOVA tests with sex/age groups as a factor followed by post hoc Tukey tests. The relationship between the natural logarithm (ln) transformed mean mass of testicles and ln-transformed IGF1 expression or ln-transformed body mass was analyzed using Spearman’s correlation coefficient. For all statistical tests, the significance threshold was set at p = 0.05.
Results
The growth curves of P. picta individuals show rapid, non-dimorphic growth at the beginning, then a more pronounced cessation of growth in females, followed by a period of the stagnation of body size in both sexes, with males being in the last two segments considerably larger in body size (Figure 1; Kubička et al., 2022).
Measurements of gene expression identified as biological outliers with both Grubbs’ and Dixon tests were taken out of the gene expression analysis. Altogether, there were only few such excluded measurements: the expression value was excluded for the gene IGF1 in a 211-day-old male (Grubbs’ test: p = 0.041; Dixon test: p = 0.036), for ESR1 in a 255-day-old female (Grubbs’ test: p = 0.045; Dixon test: p = 0.036) and for IGF1R in two 255-day-old females on two separate tests (Grubbs’ test: p = 0.041; Dixon test: p = 0.031/Grubbs’ test: p = 0.024; Dixon test: p = 0.025). Finally, AR had two outliers, a 42-day-old female (Grubbs’ test: p = 0.016; Dixon test: p = 0.011) and a 255-day-old male (Grubbs’ test: p < 0.0001; Dixon test: p = 0.004). In addition, triplicates for the measurements of the expression of the gene IGF1 were too variable in a 307-day-old male. In total, we excluded 7 out of 350 total measurements (2.0%). The statistics with the inclusion of the outliers would lead to the same interpretation of the results with the exception of ESR1 which has no significant trend with the presence of its outlier.
Gene expression only differed significantly in genes IGF1, ESR1, and AR between males and females of age 42, 255, and 512 days. For other genes there was no significant difference using ANOVA tests: IGF1R (F5,22 = 2.589; p = 0.055), IGF2 (F5,24 = 0.748; p = 0.596), IGF2R (F5,24 = 0.448; p = 0.811).
A significant difference was found in IGF1 gene expression in 255 days old males compared to all-female groups and the youngest male group, as pointed by the ANOVA (F5,24 = 6.106; p = 0.0008) and post hoc Tukey tests (significant adjusted p < 0.041; non-significant adjusted p > 0.106; Figure 2) and prompted us to add two age groups (211 days old and 307 days old individuals) to further verify this trend. After the addition of these four sex/age groups, the overexpression found in 255 days old males was still maintained through ANOVA (F9,38 = 5.221; p = 0.0001) and post hoc Tukey tests (significant adjusted p < 0.036; non-significant adjusted p > 0.078; Figure 3).
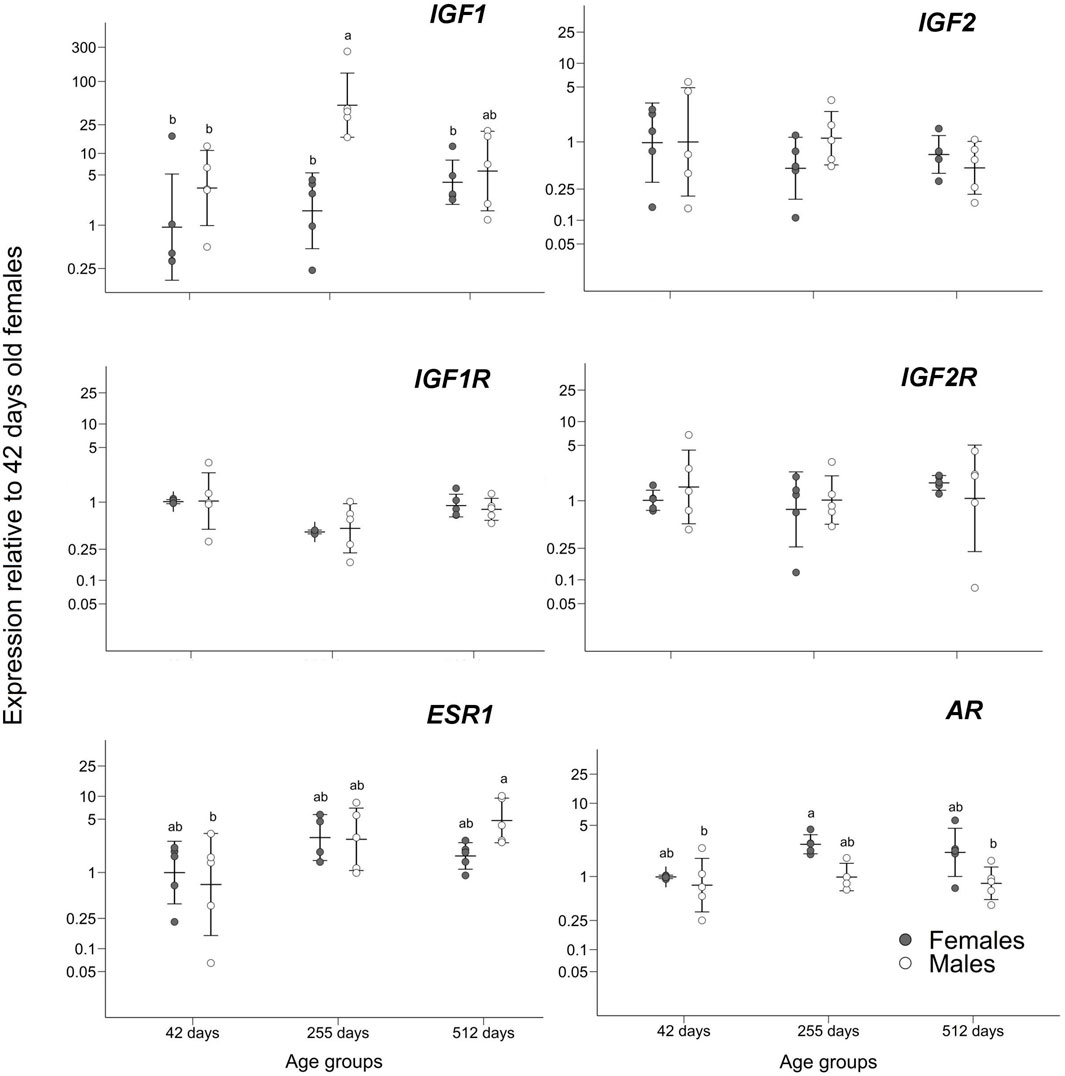
FIGURE 2. Gene expression relative to the group of 42 days old females. Means ± standard deviations are depicted. Statistically homogenous groups as identified by the post hoc Tukey test are depicted where there were significant differences among sex/age groups.
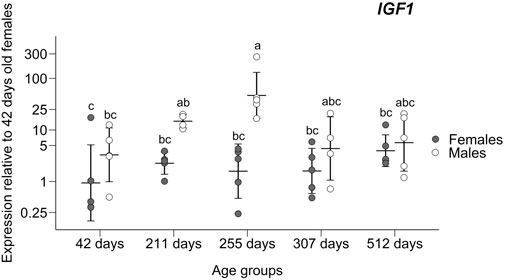
FIGURE 3. Expression of the insulin-like growth factor-1 gene in livers relative to the group of 42 days old females. Means ± standard deviations are depicted. Statistically homogenous groups identified by the post hoc Tukey test are depicted.
The significant differences in expression for genes ESR1 and AR are not as substantial as for IGF1. The ANOVA for ESR1 test showed a significant difference between age/sex groups (F5,23 = 2.882; p = 0.036) while the post hoc Tukey tests only showed a trend of slightly higher expression in the oldest males compared to the youngest males (adjusted p = 0.037; Figure 2) while its expression was comparable among other comparisons (adjusted p > 0.128; Figure 2). Also, gene AR shows according to ANOVA a significant difference between groups (F5,22 = 4.45, p = 0.005) but according to the post hoc Tukey tests it is only slightly higher expression in 255 days old females compared to the youngest and oldest males (adjusted p = 0.018; adjusted p = 0.026; Figure 2) while the other post hoc comparisons were non-significant (adjusted p > 0.083; Figure 2).
Spearman’s correlation coefficient analysis indicated no correlation between ln-transformed IGF1 gene expression and ln-transformed mean mass of testicles (r = 0.363, n = 23, p = 0.089) while the correlation between ln-transformed body mass and ln-transformed mean testicle mass was strongly significant (r = 0.887, n = 23, p <<0.001). Testosterone plasma levels were higher in males than females already well before the separation of male and female growth curves, while estradiol plasma levels were comparable in both sexes before the breakpoint but higher after that in females as described in Kubička et al. (2022) and showed in Supplementary Figures S1, S2. All raw data used in Kubička et al. (2022) are available in the Mendeley database (doi:10.17632/fxcdd6j4sh.1).
Discussion
We followed the expression of candidate genes that could contribute to sex-specific growth at the stage when SSD develops. Three (AR, ESR1, and IGF1) out of six monitored genes were found to significantly differ in the expression between the sexes and growth phases. In fact, only one of them (IGF1) gave a pattern consistent with its role in sexually dimorphic growth. The overexpression trend in males for gene IGF1, especially the noticeable spike in males around the time of departure of male and female growth trajectories, suggests that this gene has a role in SSD development (Figure 3).
As well documented in humans, IGF1 has an important role in bone elongation and growth plate closure (Yakar et al., 2018; Racine and Serrat, 2020). In P. picta, the male-specific spike of IGF1 might delay the senescence of bone growth plates in males, which is translated to male-larger SSD. But what drives the peak in IGF1 expression in gecko males and why is it missing in females?
In humans, IGF1 levels have been considered to be associated with puberty and occur in both sexes during the so-called pubertal growth spurt (Cole et al., 2015; Juul and Skakkebæk, 2019). A small spike of IGF1 circulating plasma levels was also found in brown house snakes (Lamprophis fuliginosus) which could indicate its role in sexual maturity (Sparkman et al., 2010). In P. picta the breakpoint and overexpression of IGF1 in males come a long time after sexual maturity and no correlation between IGF1 levels and gonad size could be drawn. This further highlights the findings of Kubička et al. (2022) that growth changes in P. picta are not associated with sexual maturation and that castration does not alter structural growth in males (Starostová et al., 2013; Kubička et al., 2015). In agreement, circulating levels of testosterone are already sexually dimorphic at the age of 42 days in P. picta (Supplementary Figure S2). The size of testicles correlates with male body mass and no significant changes in these parameters coincide with the peak of IGF1 in males and the onset of sexually dimorphic growth.
As castrated males and ovariectomized females of P. picta follow the growth trajectory of control intact males (Starostová et al., 2013; Kubička et al., 2015; Kubička et al., 2017), we expect that the peak of IGF1 appears without a direct activation by male gonads. IGF1 expression in livers is controlled by somatotropin (GH) produced by the pituitary gland (e.g., Schwartz and Bronikowski, 2016). GH production in humans increases during childhood and peaks during the pubertal growth spurt (Meinhardt and Ho, 2007). The situation in P. picta suggests that it is possible to disconnect the peak of GH/IGF1 from sexual maturation during evolution and this observation deserves further study. As stated previously, growth commonly continues in ectotherms after sexual maturation which is not the case for endotherms. This phenomenon is quite interesting and highlights the novelty of the spike in IGF1 expression we found. This spike of IGF1 happens after sexual maturation and gives an insight into how in ectotherms growth mechanisms are disconnected from sexual maturation and also how is the ontogeny of SSD detached from reproduction.
Previous growth experiments in P. picta, particularly the defeminization of growth by total but not by unilateral ovariectomy and the negative growth effect of exogenous estradiol (Kubička et al., 2017), suggest that the peak in IGF1 in females of this species can be inhibited by ovarian hormones. This is also consistent with the observation that an increase and a start of cycling of estradiol levels in females roughly coincides with the closure of their bone growth plates, which happens at a smaller body size than in males of P. picta (Kubička et al., 2022). We found only a significant but small difference in expression to be higher in the oldest males than in the youngest males in ESR1 and no differences with the other groups. Also, the pattern of expression found in ESR1 is not sexually dimorphic as only young and old males differ significantly. We cannot answer why old males have somewhat elevated ESR1 expression or young males have lower levels compared to each other. Both these groups do not differ in ESR1 expression from the other experimental groups (Figure 2). However, it does not exclude circulating estrogens as candidates for the modifiers of GH/IGF1 expression as the relationship between hormone and receptor levels and their action is not straightforward (Moore and Evans, 1999). Even more importantly, increased female-typical estrogen levels can influence growth via their effect on the GH production/releasing pathway in the brain, which should be tested in the future. Moreover, the estrogen and its receptors can act directly in the growing bones (although this effect would not directly explain the lack of IGF1 peak in females). In mice, skeletal differences between males and females corresponding with higher mass in males were correlated to IGF1 while both androgens and estrogens were found to have stimulatory effects in males and inhibitory in females, respectively (Callewaert et al., 2010). The role of estrogen receptors in sexual dimorphism has also previously been supported by the report of higher expression of ESR2 in the cranial skeleton in Anolis carolinensis, suggesting its inhibiting role on bone growth (Sanger et al., 2014).
The pattern of AR expression through ontogeny in livers does not correspond with the testosterone level difference found between the sexes (Kubička et al., 2022; Supplementary Figure S2). We also know from Kubička et al. (2017) that testosterone increment has no effect on growth in ovariectomized P. picta females. The revealed pattern of slightly higher expression of AR in 255 days old females compared to the youngest and the oldest males does not seem to be of any biological impact if we also consider that either of these groups shared a similar expression with the remaining groups (Figure 2). Both expression patterns in genes ESR1 and AR seem to be likely not biologically relevant or at the very least not relevant to SSD and could be explained by independent hormonal fluctuations that are not linked to SSD.
IGF2 did not show any significant differences in the expression between sexes and age cohorts in P. picta. The previously assumed divergence in the role of IGF2 as a pre-natal growth factor and IGF1 as a post-natal growth factor has been challenged in reptiles (Schwartz and Bronikowski, 2016; Beatty and Schwartz, 2020) resulting in a necessity to understand their exact role in the ontogeny of growth in vertebrates. If IGF2 has an important role in postnatal growth in P. picta, it would be constant throughout development (or at least for the tested age groups) and not associated with SSD.
Future studies should look at the proximate cause of SSD in different lizard groups and test whether the pattern started to be uncovered here for P. picta is more general. It would be fascinating to compare ontogeny of growth and IGF1 expression in monomorphic and female-larger species of the genus Paroedura (Starostová et al., 2010). We predict that monomorphic/female-larger species will lack the male-specific peak of IGF1 expression. A recent study focused on a short-term growth experiment found comparable hepatic expression of IGF1 in adult males and females in the female-larger iguana Sceloporus undulatus (Duncan et al., 2020); however, more systematic studies comparing IGF1 expression throughout the whole ontogeny from hatching till growth cessation are needed.
Conclusion
We compared the expression levels of candidate genes and circulating steroid hormones for sex-specific growth modifiers in liver samples collected at different phases of growth in a male-larger gecko species and interpreted the results in the light of previous growth experiments. We found that the ontogeny of sexual dimorphism in this species is likely not connected with male sexual maturation or with plasma circulating levels of male gonadal androgens and expression of AR, and ESR1 in livers. On the other hand, the higher activity of bone growth plates before their closure in males (Kubička et al., 2022) seems to be connected with a significant increase in the expression of IGF1 at that growth stage. The peak could be inhibited by ovarian hormones produced by active reproductive organs in females.
Genetic variation of the gene IGF1 played for example a large role in the evolution of body size among dog breeds (Sutter et al., 2007), and variation in IGF1 is an important mediator of life-history variation among vertebrates (Lodjak and Verhulst, 2020). We demonstrated that the time-specific and sex-specific expression of this gene may play an important role in the development of SSD in reptiles. We hope that future studies monitoring growth patterns and IGF1 expression across ontogeny in both male-larger and female-larger species will help clear the role of IGF1 in SSD. Further investigation should also uncover if this sex-specific growth mechanism is shared or specific to certain lineages.
Data availability statement
The original contributions presented in the study are included in the article/Supplementary Material, further inquiries can be directed to the corresponding author.
Ethics statement
The study was conducted with the approval of the Ethical Committee of the Faculty of Science, Charles University, Prague, and the Ministry of Education, Youth and Sports of the Czech Republic (permit number 35484/2015-11).
Author contributions
ZS, LKr, and LKu designed the study. BM designed RT-qPCR assays, collected and analyzed the data. BM, LKr, and ZS drafted the first version of the manuscript. All authors discussed the results, contributed to the later stages of the manuscript and approved the submitted version.
Funding
The project was supported by the Czech Science Foundation (GAČR 19-19746S). BM was also supported by the internal Charles University Grant SVV260571/2022.
Acknowledgments
We would like to thank Jan Červenka for the assistance in the lab and stimulating discussions, David Švec and Eva Rohlová for help with the RT-qPCR and Adam Tureček for animal care and growth curve data.
Conflict of interest
The authors declare that the research was conducted in the absence of any commercial or financial relationships that could be construed as a potential conflict of interest.
Publisher’s note
All claims expressed in this article are solely those of the authors and do not necessarily represent those of their affiliated organizations, or those of the publisher, the editors and the reviewers. Any product that may be evaluated in this article, or claim that may be made by its manufacturer, is not guaranteed or endorsed by the publisher.
Supplementary material
The Supplementary Material for this article can be found online at: https://www.frontiersin.org/articles/10.3389/fphys.2022.917460/full#supplementary-material
Supplemental Figure S1 | Variation in estradiol plasma levels among groups. Note that estradiol levels generally increased and started to fluctuate in females after they started reproduction (they were mated around the age of four months). Age groups with measured gene expression are marked.
Supplemental Figure S2 | Testosterone plasma levels across sex and age groups. The levels of the androgen became sexually dimorphic quite early in the ontogeny. They stayed low in females and vary a lot but are higher among males. Age groups with measured gene expression are marked.
References
Al-Sabah A., Stadnik P., Gilbert S. J., Duance V. C., Blain E. J. (2016). Importance of reference gene selection for articular cartilage mechanobiology studies. Osteoarthr. Cartil. 24, 719–730. doi:10.1016/j.joca.2015.11.007
Badyaev A. V. (2002). Growing apart: An ontogenetic perspective on the evolution of sexual size dimorphism. Trends Ecol. Evol. 17, 369–378. doi:10.1016/S0169-5347(02)02569-7
Bauerová A., Kratochvíl L., Kubička L. (2020). Little if any role of male gonadal androgens in ontogeny of sexual dimorphism in body size and cranial casque in chameleons. Sci. Rep. 10, 2673. doi:10.1038/s41598-020-59501-6
Beatty A. E., Schwartz T. S. (2020). Gene expression of the IGF hormones and IGF binding proteins across time and tissues in a model reptile. Physiol. Genomics 52, 423–434. doi:10.1152/physiolgenomics.00059.2020
Bondesson M., Ruixin H., Lin C. Y., Williams C., Gustafsson J. A. (2015). Estrogen receptor signaling during vertebrate development. Biochim. Biophys. Acta 1849, 142–151. doi:10.1016/j.bbagrm.2014.06.005
Brown A. L., Graham D. E., Nissley S. P., Hill D. J., Strain A. J., Rechler M. M., et al. (1986). Developmental regulation of insulin-like growth factor II mRNA in different rat tissues. J. Biol. Chem. 261, 13144–13150. doi:10.1016/s0021-9258(18)69282-8
Callewaert F., Venken K., Kopchick J. J., Torcasio A., van Lenthe G. H., Boonen S., et al. (2010). Sexual dimorphism in cortical bone size and strength but not density is determined by independent and time-specific actions of sex steroids and IGF1: Evidence from pubertal mouse models. J. Bone Min. Res. 25, 617–626. doi:10.1359/jbmr.090828
Charnov E. L., Turner T. F., Winemiller K. O. (2001). Reproductive constraints and the evolution of life histories with indeterminate growth. Proc. Natl. Acad. Sci. U. S. A. 98, 9460–9464. doi:10.1073/pnas.161294498
Cole T. J., Ahmed M., Preece A., Hindmarsh P., Dunger D. B. (2015). The relationship between insulin-like growth factor 1, sex steroids, and timing of the pubertal growth spurt. Clin. Endocrinol. 82, 862–869. doi:10.1111/cen.12682
Core Team R. (2020). R: A language and environment for statistical computing. Vienna, Austria: R Foundation for Statistical Computing. URL https://www.R-project.org/.
Coulson D. T. R., Brockbank S., Quinn J. G., Murphy S., Ravid R., Irvine G. B., et al. (2008). Identification of valid reference genes for the normalization of RT qPCR gene expression data in human brain tissue. BMC Mol. Biol. 9, 46. doi:10.1186/1471-2199-9-46
Cox R. M., Calsbeek R. (2010). Severe costs of reproduction persist in Anolis lizards despite the evolution of a single-egg clutch. Evolution 64, 1321–1330. doi:10.1111/j.1558-5646.2009.00906.x
Cox R. M., Butler M., John-Alder H. (2007). “The evolution of sexual size dimorphism in reptiles,” in Sex, size and gender roles: Evolutionary studies of sexual size dimorphism. Editors D. J. Fairbairn, W. U. Blanckenhorn, and T. Székely (Oxford, United Kingdom: Oxford University Press), 38–49. doi:10.1093/acprof:oso/9780199208784.003.0005
Cox R. M., Skelly S. L., John‐Alder H. B. (2005). Testosterone inhibits growth in juvenile male eastern fence lizards (Sceloporus undulatus): Implications for energy allocation and sexual size dimorphism. Physiol. Biochem. Zool. 78, 531–545. doi:10.1086/430226
Cox R. M., Stenquist D., Calsbeek R. (2009). Testosterone, growth and the evolution of sexual size dimorphism. J. Evol. Biol. 22, 1586–1598. doi:10.1111/j.1420-9101.(2009).01772.x
Cox R. M. (2006). A test of the reproductive cost hypothesis for sexual size dimorphism in Yarrow’s spiny lizard Sceloporus jarrovii. J. Anim. Ecol. 7, 1361–1369. doi:10.1111/j.1365-2656.2006.01160.x
Cox R. M. (2019). “Body size and sexual dimorphism,” in Encyclopedia of animal behavior. Editors M. Breed, and J. Moore (Oxford: Academic Press), 220–225. doi:10.1016/B978-0-08-045337-8.00117-0
Cox R. M., McGlothlin J. W., Bonier F. (2016). Evolutionary endocrinology: Hormones as mediators of evolutionary phenomena: An introduction to the symposium. Integr. Comp. Biol. 56, 121–125. doi:10.1093/icb/icw047
de Beer M., McMurtry J. P., Brocht D. M., Coon C. N. (2008). An examination of the role of feeding regimens in regulating metabolism during the broiler breeder grower Period. 2. Plasma Hormones and Metabolites. Poult. Sci. 87, 264–275. doi:10.3382/ps.2007-00196
Denley A., Cosgrove L. J., Booker G. W., Wallace J. C., Forbes B. E. (2005). Molecular interactions of the IGF system. Cytokine Growth Factor Rev. 16, 421–439. doi:10.1016/j.cytogfr.2005.04.004
Duncan C. A., Jetzt A. E., Cohick W. S., John-Alder H. B. (2015). Nutritional modulation of IGF1 in relation to growth and body condition in Sceloporus lizards. Gen. Comp. Endocrinol. 216, 116–124. doi:10.1016/j.ygcen.2015.02.009
Duncan C. A., Cohick W. S., John-Alder H. B. (2020). Testosterone reduces growth and hepatic IGF1 mRNA in a female-larger lizard, Sceloporus undulatus: Evidence of an evolutionary reversal in growth regulation. Integr. Org. Biol. 2, obaa036. doi:10.1093/iob/obaa036
Farrell R. E. (2017). “Quality control for RNA preparations,” in RNA methodologies laboratory guide for isolation and characterization. Editor R. E. Farrell. 5th Edition (Cambridge, Massachusetts, United States: Academic Press), 167–185. doi:10.1016/C2015-0-04021-7
Fowke J. H., Matthews C. E., Yu E., Cai Q., Cohen S., Buchowski M. S., et al. (2010). Racial differences in the association between body mass index and serum IGF1, IGF2, and IGFBP3. Endocr. Relat. Cancer 17, 51–60. doi:10.1677/ERC-09-0023
Frýdlová P., Mrzílková J., Šeremeta M., Křemen J., Dudák J., Žemlička J., et al. (2020). Determinate growth is predominant and likely ancestral in squamate reptiles. Proc. Royal Soc. B 287, 20202737. doi:10.1098/rspb.2020.2737
Frýdlová P., Mrzílková J., Šeremeta M., Křemen J., Dudák J., Žemlička J., et al. (2019). Universality of indeterminate growth in lizards rejected: The micro-CT reveals contrasting timing of growth cartilage persistence in iguanas, agamas, and chameleons. Sci. Rep. 9, 18913. doi:10.1038/s41598-019-54573-5
Geiger M., Forasiepi A. M., Koyabu D., Sánchez-Villagra M. R. (2014). Heterochrony and post-natal growth in mammals – An examination of growth plates in limbs. J. Evol. Biol. 27, 98–115. doi:10.1111/jeb.12279
Ghosh P., Dahms N. M., Kornfeld S. (2003). Mannose 6-phosphate receptors: New twists in the tale. Nat. Rev. Mol. Cell Biol. 4, 202–212. doi:10.1038/nrm1050
Golinski A., Kubička L., John-Alder H., Kratochvíl L. (2014). Elevated testosterone isrequired for male copulatory behavior and aggression in Madagascar ground gecko (Paroedura picta). Gen. Comp. Endocrinol. 205, 133–141. doi:10.1016/j.ygcen.2014.05.012
Gong H., Sun L., Chen B., Han Y., Pang J., Wu W., et al. (2016). Evaluation of candidate reference genes for RT-qPCR studies in three metabolism-related tissues of mice after caloric restriction. Sci. Rep. 6, 38513. doi:10.1038/srep38513
Guillette L. J., Cox M. C., Crain D. A. (1996). Plasma insulin-like growth factor-I concentration during the reproductive cycle of the American alligator (Alligator mississippiensis). Gen. Comp. Endocrinol. 104, 116–122. doi:10.1006/gcen.1996.0147
Hall T. A. (1999). BioEdit: A user-friendly biological sequence alignment editor and analysis program for windows 95/98/NT. Nucl. Acids. Symp. Ser. 41, 95–98.
Hara Y., Takeuchi M., Kageyama Y., Tatsumi K., Hibi M., Kiyonari H., et al. (2018). Madagascar ground gecko genome analysis characterizes asymmetric fates of duplicated genes. BMC Biol. 16, 40. doi:10.1186/s12915-018-0509-4
Hara Y., Tatsumi K., Yoshida M., Kajikawa E., Kiyonari H., Kuraku S., et al. (2015). Optimizing and benchmarking de novo transcriptome sequencing: From library preparation to assembly evaluation. BMC Genomics 16, 977. doi:10.1186/s12864-015-2007-1
Hariharan I. K., Wake D. B., Wake M. H. (2015). Indeterminate growth: Could it represent the ancestral condition? Cold Spring Harb. Perspect. Biol. 8, 019174. doi:10.1101/cshperspect.a019174
Hayward A., Gillooly J. F. (2011). The cost of sex: Quantifying energetic investment in gamete production by males and females. PLoS One 6, e16557. doi:10.1371/journal.pone.0016557
Heinlein C. A., Chang C. (2002). The roles of androgen receptors and androgen-binding proteins in nongenomic androgen actions. Mol. Endocrinol. 16, 2181–2187. doi:10.1210/me.(2002)-0070
Janzen F. J., Phillips P. C. (2006). Exploring the evolution of environmental sex determination, especially in reptiles. J. Evol. Biol. 19, 1775–1784. doi:10.1111/j.1420-9101.2006.01138.x
Johnson Pokorná M., Kratochvíl L. (2016). What was the ancestral sex-determining mechanism in amniote vertebrates? Biol. Rev. Camb. Philos. Soc. 91, 1–12. doi:10.1111/brv.12156
Juul A., Skakkebæk N. E. (2019). Why do normal children have acromegalic levels of IGFI during puberty. J. Clin. Endocrinol. Metab. 104, 2770–2776. doi:10.1210/jc.2018-02099
Katona G., Vági B., Végvári Z., Liker A., Freckleton R. P., Bókony V., et al. (2021). Are evolutionary transitions in sexual size dimorphism related to sex determination in reptiles? J. Evol. Biol. 34, 594–603. doi:10.1111/jeb.13774
Komsta L. (2011). outliers: Tests for outliers. R package version 0.14. https://CRAN.R-project.org/package=outliers
Kostmann A., Kratochvíl L., Rovatsos M. (2021). Poorly differentiated XX/XY sex chromosomes are widely shared across skink radiation. Proc. Royal Soc. B 288, 20202139. doi:10.1098/rspb.2020.2139
Kozłowski J. (1996). Optimal allocation of resources explains interspecific life-history patterns in animals with indeterminate growth. Proc. R. Soc. B 263, 559–566. doi:10.1098/rspb.1996.0084
Kubička L., Golinski A., John-Alder H., Kratochvíl L. (2013). Ontogeny of pronounced female-biased sexual size dimorphism in the Malaysian cat gecko (Aeluroscalabotes felinus: Squamata: Eublepharidae): A test of the role of testosterone in growth regulation. Gen. Comp. Endocrinol. 188, 183–188. doi:10.1016/j.ygcen.2013.03.016
Kubička L., Schořálková T., Červenka J., Kratochvíl L. (2017). Ovarian control of growth and sexual size dimorphism in a male-larger gecko. J. Exp. Biol. 220, 787–795. doi:10.1242/jeb.146597
Kubička L., Starostová Z., Kratochvíl L. (2015). Endogenous control of sexual size dimorphism: Gonadal androgens have neither direct nor indirect effect on male growth in a Madagascar ground gecko (Paroedura picta). Gen. Comp. Endocrinol. 224, 273–277. doi:10.1016/j.ygcen.2015.09.028
Kubička L., Tureček A., Kučera T., Kratochvíl L. (2022). Sex-specific growth arrest in a lizard. iScience 25, 104041. doi:10.1016/j.isci.2022.104041
Livak K. J., Schmittgen T. D. (2001). Analysis of relative gene expression data using real-time quantitative PCR and the 2(-Delta Delta C(T)) method. Methods 25, 402–408. doi:10.1006/meth.2001.1262
Lodjak J., Verhulst S. (2020). Insulin-like growth factor 1 of wild vertebrates in a life-history context. Mol. Cell. Endocrinol. 518, 110978. doi:10.1016/j.mce.2020.110978
Marks J. R., Beatty A. E., Schwartz T. S., Sorlin M., Lailvaux S. P. (2021). Expression of insulin-like growth factors depends on both mass and resource availability in female green anoles (Anolis carolinensis). J. Exp. Biol. 224, jeb242665. doi:10.1242/jeb.242665
Meinhardt U. J., Ho K. K. Y. (2007). Regulation of growth hormone action by gonadal steroids. Endocrinol. Metab. Clin. North Am. 36, 57–73. doi:10.1016/j.ecl.2006.11.009
Meter B., Starostová Z., Kubička L., Kratochvíl L. (2020). The limits of the energetical perspective: Life-history decisions in lizard growth. Evol. Ecol. 34, 469–481. doi:10.1007/s10682-020-10054-0
Moore F. L., Evans S. J. (1999). Steroid hormones use non-genomic mechanisms to control brain functions and behaviors: A review of evidence. Brain Behav. Evol. 54, 41–50. doi:10.1159/000006610
Ooms J. (2021). writexl: Export data frames to excel 'xlsx' format. R package version 1.4.0. https://CRAN.R-project.org/package=writexl
Pfaffl M. W. (2001). A new mathematical model for relative quantification in real-time RT-PCR. Nucleic Acids Res. 29, e45. doi:10.1093/nar/29.9.e45
Plot V., Criscuolo F., Zahn S., Georges J. Y. (2012). Telomeres, age and reproduction in a long-lived reptile. PLoS One 7, e40855. doi:10.1371/journal.pone.0040855
Racine H. L., Serrat M. A. (2020). The Actions of IGF1 in the growth plate and its role in postnatal bone elongation. Curr. Osteoporos. Rep. 18, 210–227. doi:10.1007/s11914-020-00570-x
Reding D. M., Addis E. A., Palacios M. G., Schwartz T. S., Bronikowski A. M. (2016). Insulin-like signaling (IIS) responses to temperature, genetic background, and growth variation in garter snakes with divergent life histories. Gen. Comp. Endocrinol. 233, 88–99. doi:10.1016/j.ygcen.2016.05.018
Revelle W. (2021). psych: Procedures for personality and psychological research. Illinois, USA: Northwestern University Evanston. Available at: https://CRAN.R-project.org/package=psych Version = 2.1.9.
Rollings N., Friesen C. R., Sudyka J., Whittington C., Giraudeau M., Wilson M., et al. (2017). Telomere dynamics in a lizard with morph-specific reproductive investment and self-maintenance. Ecol. Evol. 7, 5163–5169. doi:10.1002/ece3.2712
RStudio Team (2019). RStudio. Boston, MA: Integrated Development for R. RStudio, Inc. Available at: http://www.rstudio.com/.
Sanger T., Seav S., Tokita M., Langerhans B., Ross L., Losos J., et al. (2014). The oestrogen pathway underlies the evolution of exaggerated male cranial shapes in anolis lizards. Proc. Royal Soc. B 281, 20140329. doi:10.1098/rspb.(2014).0329
Schmidt I. U., Wakley G. K., Turner R. T. (2000). Effects of estrogen and progesterone on tibia histomorphometry in growing rats. Calcif. Tissue Int. 67, 47–52. doi:10.1007/s00223001096
Schořálková T., Kratochvíl L., Kubička L. (2018). To fight or mate? Hormonal control of sex recognition, male sexual behavior and aggression in the gecko lizard. Horm. Behav. 97, 18–24. doi:10.1016/j.yhbeh.2017.10.006
Schwartz T. S., Bronikowski A. M. (2016). Evolution and function of the insulin and insulin-like signaling network in ectothermic reptiles: Some answers and more questions. Integr. Comp. Biol. 56, 171–184. doi:10.1093/icb/icw046
Sievert C. (2020). Interactive web-based data visualization with r, plotly, and shiny. Chapman: Hall/CRC
Sivaramakrishna Y., Amancha P. K., Siva Kumar N. (2009). Reptilian MPR 300 is also the IGFIIR: Cloning, sequencing and functional characterization of the IGFII binding domain. Int. J. Biol. 44, 435–440. doi:10.1016/j.ijbiomac.2009.03.004
Sparkman A. M., Byars D., Ford N. B., Bronikowski A. M. (2010). The Role of insulin-like growth Factor-1 (IGF1) in growth and reproduction in female Brown house snakes (Lamprophis fuliginosus). Gen. Comp. Endocrinol. 168, 408–414. doi:10.1016/j.ygcen.2010.05.006
Starostová Z., Kubička L., Golinski A., Kratochvíl L. (2013). Neither male gonadal androgens nor female reproductive costs drive development of sexual size dimorphism in lizards. J. Exp. Biol. 216, 1872–1880. doi:10.1242/jeb.079442
Starostová Z., Kubička L., Kratochvíl L. (2010). Macroevolutionary pattern of sexual size dimorphism in geckos corresponds to intraspecific temperature-induced variation. J. Evol. Biol. 23, 670–677. doi:10.1111/j.1420-9101.(2010).01933.x
Stassen Q. E. M., Riemers F. M., Reijmerink H., Leegwater P. A. J., Penning P. C. (2015). Reference genes for reverse transcription quantitative PCR in canine brain tissue. BMC Res. Notes 8, 761. doi:10.1186/s13104-015-1628-4
Sutter N. B., Bustamante C. D., Chase K., Gray M. M., Zhao K., Zhu L., et al. (2007). A single IGF1 allele is a major determinant of small size in dogs. Science 316, 112–115. doi:10.1126/science.1137045
Taylor E. N., DeNardo D. F. (2005). Sexual size dimorphism and growth plasticity in snakes: An experiment on the Western diamond-backed rattlesnake (Crotalus atrox). J. Exp. Zool. A Comp. Exp. Biol. 303A, 598–607. doi:10.1002/jez.a.189
Todd E. V., Liu H., Muncaster S., Gemmell N. J. (2016). Bending genders: The biology of natural sex change in fish. Sex. Dev. 10, 223–241. doi:10.1159/000449297
Vandesompele J., De Preter K., Pattyn F., Poppe B., Van Roy N., De Paepe A., et al. (2002). Accurate normalization of real-time quantitative RT-PCR data by geometric averaging of multiple internal control genes. Genome Biol. 3, research0034. doi:10.1186/gb-(2002)-3-7-research0034
Wang H., Wen H., Li Y., Zhang H., Liu Y. (2018). Evaluation of potential reference genes for quantitative RT-PCR analysis in spotted sea bass (Lateolabrax maculatus) under normal and salinity stress conditions. PeerJ 6, e5631. doi:10.7717/peerj.5631
Werner J., Sfakianakis N., Rendall A. D., Griebeler E. M. (2018). Energy intake functions and energy budgets of ectotherms and endotherms derived from their ontogenetic growth in body mass and timing of sexual maturation. J. Theor. Biol. 444, 83–92. doi:10.1016/j.jtbi.2018.02.007
Wickham H., Averick M., Bryan J., Chang W., D'Agostino McGowan L., François R., et al. (2019). Welcome to the tidyverse. J. Open Source Softw. 4, 1686. doi:10.21105/joss.01686
Wickham H., François R., Lionel H., Müller K. (2021). dplyr: A grammar of data manipulation. R package version 1.0.7. https://CRAN.R-project.org/package=dplyr
Wickham H. (2019). stringr: Simple, consistent wrappers for common string operations. R package version 1.4.0. https://CRAN.R-project.org/package=stringr
Yakar S., Werner H., Rosen C. J. (2018). Insulin-like growth factors: Actions on the skeleton. J. Mol. Endocrinol. 61, T115–T137. doi:10.1530/JME-17-0298
Yamagishi G., Yoshida A., Kobayashi A., Park M. K. (2016). Molecular characterization of insulin from squamate reptiles reveals sequence diversity and possible adaptive evolution. Gen. Comp. Endocrinol. 225, 197–211. doi:10.1016/j.ygcen.2015.08.021
Keywords: body size, bone, growth, hormones, IGF1, reptiles, sexual size dimorphism, testosterone
Citation: Meter B, Kratochvíl L, Kubička L and Starostová Z (2022) Development of male-larger sexual size dimorphism in a lizard: IGF1 peak long after sexual maturity overlaps with pronounced growth in males. Front. Physiol. 13:917460. doi: 10.3389/fphys.2022.917460
Received: 11 April 2022; Accepted: 01 July 2022;
Published: 10 August 2022.
Edited by:
Turk Rhen, University of North Dakota, United StatesReviewed by:
Richard M. K. Yu, The University of Newcastle, AustraliaGabriele Andreatta, Max F. Perutz Laboratories GmbH, Austria
Copyright © 2022 Meter, Kratochvíl, Kubička and Starostová. This is an open-access article distributed under the terms of the Creative Commons Attribution License (CC BY). The use, distribution or reproduction in other forums is permitted, provided the original author(s) and the copyright owner(s) are credited and that the original publication in this journal is cited, in accordance with accepted academic practice. No use, distribution or reproduction is permitted which does not comply with these terms.
*Correspondence: Lukáš Kratochvíl, bHVrYXMua3JhdG9jaHZpbEBuYXR1ci5jdW5pLmN6