 Aranyak Chakravarty1,2
 Neelesh A. Patankar
- 1School of Nuclear Studies and Application, Jadavpur University, Kolkata, India
- 2Department of Applied Mechanics, Indian Institute of Technology Madras, Chennai, India
- 3Department of Mechanical Engineering, Northwestern University, Evanston, IL, United States
Respiratory viruses, such as SARS-CoV-2, preliminarily infect the nasopharyngeal mucosa. The mechanism of infection spread from the nasopharynx to the deep lung–which may cause a severe infection—is, however, still unclear. We propose a clinically plausible mechanism of infection spread to the deep lung through droplets, present in the nasopharynx, inhaled and transported into the lower respiratory tract. A coupled mathematical model of droplet, virus transport and virus infection kinetics is exercised to demonstrate clinically observed times to deep lung infection. The model predicts, in agreement with clinical observations, that severe infection can develop in the deep lung within 2.5–7 days of initial symptom onset. Results indicate that while fluid dynamics plays an important role in transporting the droplets, infection kinetics and immune responses determine infection growth and resolution. Immune responses, particularly antibodies and T-lymphocytes, are observed to be critically important for preventing infection severity. This reinforces the role of vaccination in preventing severe infection. Managing aerosolization of infected nasopharyngeal mucosa is additionally suggested as a strategy for minimizing infection spread and severity.
1 Introduction
Respiratory viruses, like the severe acute respiratory syndrome coronavirus 2 (SARS-CoV-2) which causes the disease COVID-19, are transmitted mainly through virus-laden droplets (Harrison et al., 2020; Wiersinga et al., 2020). The droplets originate from an infected individual, which in turn can be expelled into the environment by various mechanisms (talking, sneezing, coughing, and even normal exhalation) (Abkarian et al., 2020; Abkarian and Stone, 2020). The expelled droplets may subsequently be inhaled by other individuals; often after face-to-face exposure. Once inhaled, the droplets are subjected to advective-diffusive transport in the respiratory tract through the breathing dynamics and may eventually deposit in the respiratory mucosa in different regions of the respiratory tract (Mittal et al., 2020). SARS-CoV-2 has been observed to initially deposit and replicate in the upper respiratory tract (URT), particularly the nasopharynx (Grant et al., 2021), although there remains a possibility of the deposition taking place directly in the lower respiratory tract (LRT) depending on the inhaled droplet size and flow conditions (Madas et al., 2020; Chakravarty et al., 2022). It is, however, unlikely that the initial infection will be seeded in the LRT. The fraction of droplets that get deposited in the LRT is much less
Once the infection is seeded in the nasopharynx, the virus releases its ribonucleic acid (RNA) and utilizes the host cell machinery to create and release hundreds of new virions resulting in rapid progression of infection. Severity of infection and associated health complications (e.g., pneumonia, acute respiratory distress syndrome (ARDS)), however, depend on whether the virus can gain access to the distal regions of the thorax and the lung, particularly the alveoli. Autopsy studies on patients with COVID-19 who had developed respiratory failure has confirmed the existence of SARS-CoV-2 in the alveolar epithelial cells as well as in alveolar macrophages (Hou et al., 2020; Grant et al., 2021). The mechanism by which virions are transported from the URT to the alveolar region is, however, still an open question. Further multiplication in the LRT and gastrointestinal mucosa also results in mild viremia suggesting a systemic nature of the disease (Chen et al., 2020).
One hypothesis for the migration of the infection from the nasopharynx to the deep lungs (alveolar region) could be through virus diffusion in respiratory mucus if mucociliary clearance is impaired (Karamaoun et al., 2018). However, the time required for the viruses to diffuse (while replicating) across the entire length of a lung is too long to be probable (Chen et al., 2022). The total length of a typical healthy human lung is
In order to explore the plausibility of this mechanism, one needs a mathematical model which includes droplet (in airways) and virus (in mucus) transport within the LRT, along with virus infection kinetics. Extensive independent studies have been carried out over the years on all these aspects (Baccam et al., 2006; Smith et al., 2008; Hofmann, 2011; Mauroy et al., 2011; Handel et al., 2018; Karamaoun et al., 2018; Jensen et al., 2019). A few studies have investigated the coupled nature of droplet and mucus transport (Chakravarty et al., 2022) as well as virus transport and infection kinetics (Quirouette et al., 2020). However, the nature of the phenomena requires simultaneous consideration of all the processes necessitating a fully coupled mathematical model taking into account the individual processes. Such a model is being reported for the first time. This model is used within the framework of a Weibel-type model of the complete human LRT, with appropriate modifications (Weibel, 1963; Chakravarty et al., 2022). Aerosolisation of nasopharyngeal mucosa is not explicitly considered in the present study. Instead, it is implicitly assumed that aerosolization of nasopharyngeal mucosa leads to formation of infected droplets which, along with the residual inhaled droplets, remain present in the pharyngeal region to be inhaled into the LRT.
The primary goal is to use this mathematical model to understand the onset of SARS-CoV-2 infection in different regions of the LRT, particularly the deep lung, through inhalation of carrier droplets present in the pharynx, and the subsequent infection progression in the presence of mucociliary clearance and virus diffusion. Different situations are analysed through pertinent dimensionless parameters with respect to their impacts on infection severity and infection resolution. The role of immune responses and vaccination is particularly highlighted. In addition, the time required post symptoms onset for development of pneumonia from a severe infection is also estimated from the results obtained.
2 Methods
The mathematical model is developed considering a one-dimensional trumpet model, with appropriate modifications, to approximate the dichotomous structure of the LRT in a human being (see Supplementary Figure S1 for more details). The following sections discuss the dimensionless equations governing droplet and virus transport as well as virus kinetics.
2.1 Droplet transport model
The one-dimensional transport equation for droplets in the modelled LRT can be represented in a dimensionless manner as (Chakravarty et al., 2022)
where τ, ϕd, Ped and Sta represent dimensionless time, dimensionless droplet concentration in the airways, droplet Peclet number and airway Strouhal number, respectively. N is the generation number representing spatial position within the LRT, while α and β are length-change and area-change factors assumed while simplifying the geometry (see Supplementary Material for more details). The term on the left hand side of Eq. 1 takes into account temporal change in droplet concentration. The first and second terms on the right hand side of Eq. 1 takes into account droplet diffusion and advective transport, respectively, while the last term takes into account droplet deposition. Detailed derivation of Eq. 1 is provided in the Supplementary Material.
While formulating this model, it is assumed that the droplets are monodispersed, do not coagulate, and do not affect airflow in the airways. The only source of droplets is assumed to be in the pharynx which opens into the trachea (N = 0). These droplets may be a combination of the droplets inhaled during respiration (which have not deposited in the URT) or droplets that are formed through ANM. No additional aerosolization of the mucosa or droplet source are considered. The inhaled droplets are either deposited or washed out of the LRT. Major droplet deposition mechanisms viz. diffusion, sedimentation and impaction have been taken into account while calculating droplet deposition in the LRT (see S1 Text of Chakravarty et al. (2022) for details). The quantity
The following scaling parameters are used to obtain Eq. 1
where Tb and Ta represents the breathing time period and the airflow timescale, respectively. cd is the dimensional droplet concentration with cd,0 representing the initial cd at N = 0. Dd represents droplet diffusivity in air
2.2 Virus transport model
The only source of viruses in the LRT is the carrier droplets that deposit in the mucosa of the LRT. The deposited viruses diffuse in the mucosa and are also subjected to mucociliary advective transport. The corresponding transport equation of the deposited viruses in the mucosa is formulated considering these transport mechanisms in addition to kinetics of the virus infection (see Supplementary Material for more details). The one-dimensional virus transport equation, thus formulated, is represented in its dimensionless form as
where ϕv, Pev and Stm denotes the dimensionless virus concentration in mucus, virus Peclet number and mucus Strouhal number, respectively. The quantity
The fraction of uninfected target cells, infected cells in the eclipse phase and infectious cells are represented as T, E and I, respectively. Ir represents the dimensionless infection rate, while τE and τI are the dimensionless time-period of the eclipse phase and infectious phase, respectively. p0 is the dimensionless replication rate of virus from the infectious cells and cl is the dimensionless virus clearance rate due to various non-specific clearance mechanisms (Baccam et al., 2006; Quirouette et al., 2020). The following scaling parameters are used to obtain Eqs. 3–6 (see Supplementary Material for detailed derivation)
where cv is the dimensional virus concentration and cv,0 is the initial cv at N = 0 due to droplet deposition. Vm,0 is the mucociliary advective velocity at N = 0. Tm and Dv are the time-scale for mucociliary advection and virus diffusivity, respectively. p, cl and β represents the dimensional virus replication rate, virus clearance rate and infection rate, respectively. TE and TI are the time-scales for the eclipse phase and the infectious phase, respectively. cv,0, Tm and Dv are determined as
2.3 Immune response model
The impact of a human body’s immune response to viral infections in the LRT is taken into account through a simplified immune response model, following Quirouette et al. Quirouette et al. (2020), which considers innate immune response due to interferons, humoral immune response through antibodies and cellular immune response due to cytotoxic T-lymphocytes. The mathematical models used for these immune responses are discussed in the following sections.
2.3.1 Interferon response
Interferons are assumed to attenuate virus replication from the infectious cells. The virus replication rate
where p0 is the virus replication rate in absence of interferons (see Eq. 3) and f is the fraction of interferons required to halve the virus replication rate. F is the fractional amount of interferons present in the body (relative to the maximum amount intereferons that may be present) and it varies with time as
where λg,i and λd,i are the dimensionless growth rate and decay rate of interferons, respectively. τp,i is the dimensionless time at which amount of interferon reaches its maximum.
2.3.2 Antibody response
The presence of antibodies increases the probability of neutralising the viruses present in the body. The clearance rate of viruses (cl in Eq. 3), thus, gets enhanced in the presence of antibodies as
where
where λg,a is the dimensionless growth rate of antibodies and Ab0 is the initial fraction of antibodies present.
2.3.3 T − lymphocyte response
The T − lymphocytes are cytotoxic in nature and act by directly attacking the infected cells in their eclipse and infectious phases. Eqs 5, 6 are, thus, modified in presence of T − lymphocytes as
where
where λg,t and λd,t are the dimensionless growth rate and decay rate of T − lymphocytes, respectively. τp,t is the dimensionless time at which amount of T − lymphocytes reaches its maximum.
2.4 Initial and boundary conditions
The LRT is assumed to be initially devoid of droplets and viruses, i.e., ϕd|τ=0 = ϕv|τ=0 = 0. Fractions of target cell and infected cells are also assumed to be initially zero (T|τ=0 = E|τ=0 = I|τ=0 = 0). The trachea (N = 0) is assumed to be exposed to virus-laden droplets, presumably a combination of inhaled droplets (which have not deposited in the URT) or those formed due to ANM, for a specific inhalation period (τinh). The droplets are transported deeper into the LRT, along with the airflow, during inhalation (Eq. 16) and washed out during exhalation (Eq. 17). In contrast, the viruses are always assumed to be washed out of the trachea (N = 0) along with mucus, irrespective of inhalation/exhalation (Eq. 18), due to the nature of mucociliary transport. At the distal end of the lungs (N = 23), the total advection-diffusion flux of both droplets and viruses is assumed to be zero (Eq. 19). Mathematically, these conditions are expressed as follows
where Fd and Fv are the total advection-diffusion flux in the droplet transport (Eq. 1) and virus transport equation (Eq. 3), respectively.
2.5 Model validation and parameter estimation
The implemented mathematical model is validated with respect to droplet deposition and virus transport within the lungs as well as viral infection characteristics. Droplet deposition computed using the present model is compared with the experimental data of Heyder et al. (1986) for whole lung deposition as well as alveolar deposition (see Supplementary Figure S2).
The predictions of the coupled virus transport and infection kinetics model are compared with the computational results of (Quirouette et al., 2020) for Influenza A infection (see Figures 1A, B. While only diffusive transport is considered in the comparison shown in Figure 1A, both diffusive and advective transport is taken into account for the comparison shown in Figure 1B. The immunity model is not considered in the above comparison. The corresponding model parameters are listed in Supplementary Table S3.
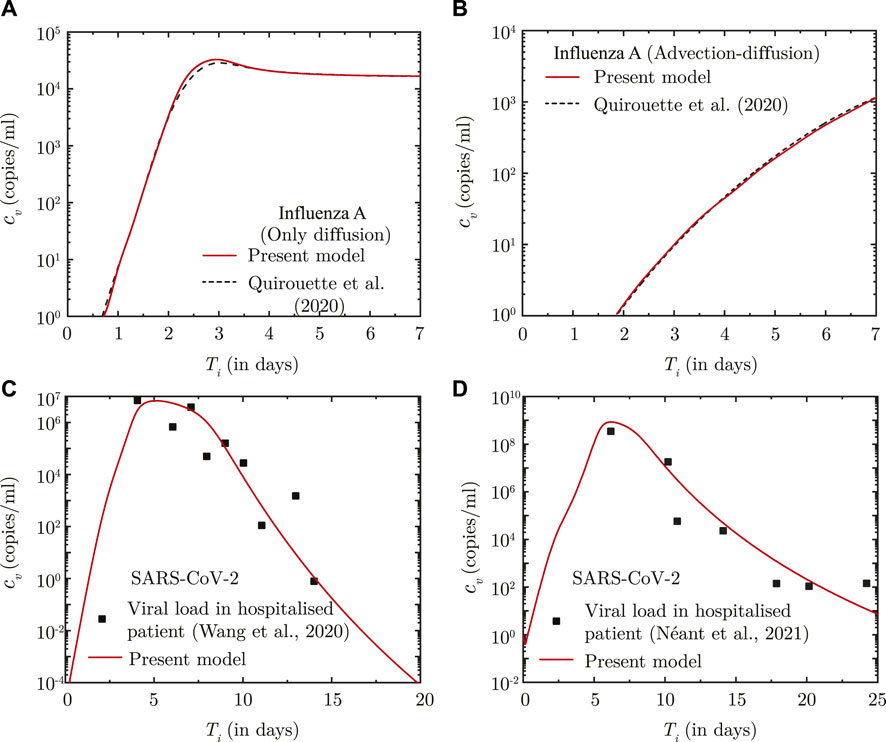
FIGURE 1. (A, B) Comparison between the results obtained using the present model and Quirouette et al. (2020) for Influenza A infection with respect to temporal change in spatially-averaged viral load in presence of (A) virus diffusion only and (B) considering combined virus diffusion and mucociliary advection. (C, D) Comparison of temporal change in the dimensional viral load (cv) predicted using the present infection kinetics-immune response model for patients hospitalised with SARS-CoV-2 infection with clinically determined viral load from (A) lower respiratory tract (Wang et al., 2020) and (B) nasopharyngeal region (Néant et al., 2021). Ti denotes time (in days) post onset of infection.
The infection kinetics-immunity model is additionally fitted against viral load data for SARS-CoV-2 infections. The best fits of the model are shown in Figures 1C, D for two different sets of clinically-obtained data from hospitalised patients (Wang et al., 2020; Néant et al., 2021). The best-fit parameters are listed in Supplementary Table S3. These parameters are used in this study for predicting SARS-CoV-2 viral progression. A comparison, similar to that carried out for Influenza-A, could not be carried out for SARS-CoV-2 infection due to lack of sufficient data on SARS-CoV-2 virus transport within the lungs.
It can, thus, be observed from these comparisons that the present model can appreciably determine droplet transport and deposition within the lungs, and simultaneously predict virus transport within the lungs considering the effects of infection kinetics.
3 Results
The only source of virus within the LRT are the droplets inhaled into the trachea from the pharynx. These may be the droplets inhaled from the environment (which have not deposited in the URT) or those formed due to ANM. In either case, these droplets are transported with airflow deeper into the LRT during which they may also get deposited in the respiratory mucosa. The viruses, thus deposited, diffuse in the mucosa and are also transported upstream by advective mucociliary clearance. At the same time, the deposited viruses undergo replication forming virus colonies and are also simultaneously removed by various mechanisms (Wiersinga et al., 2020).
In order to identify the dynamics of virus transport and infection progression in the LRT, simulations were carried out using the validated mathematical model assuming that virus-laden droplets are inhaled into the trachea for five breaths (τexp = 5). Extrapolation to longer exposure times and its impact on infection will be discussed separately. It is observed that the virus concentration in the mucus (ϕv), at the end of the inhalation, qualitatively follows droplet deposition characteristics (see Supplementary Figure S2) due to the significantly longer time-scale of virus infection and washout, as compared to droplet deposition.
Once droplet inhalation ceases, viruses deposited in the upper airways of the LRT (N < 18) are transported upstream towards the trachea (N = 0) by mucociliary advection and are eventually washed out. This is evident from the spatial change in ϕv with time (see Figure 2A). The larger ϕv in the upper airways (lower N) is due to smaller mucus volume in those regions. The viruses continue to be washed out of the lungs as long as washout dominates over virus replication. After a certain time period (τ ∼ 5,000), virus replication starts to dominate over washout causing ϕv to again increase with time, as can be observed in Figure 2A. This is also corroborated by the temporal change in ϕv (see Figure 2B).
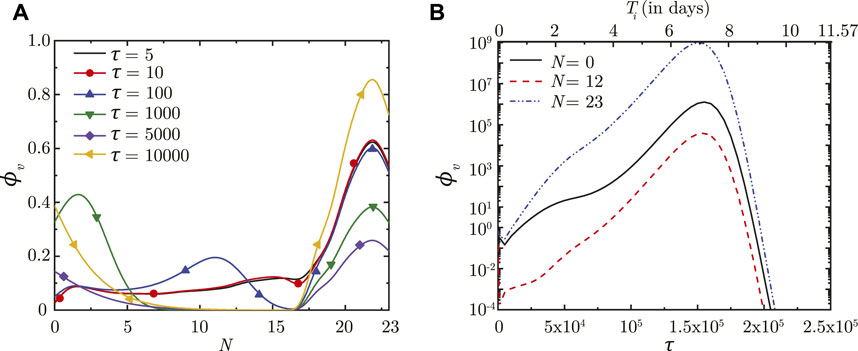
FIGURE 2. (A) Dimensionless virus concentration in mucus (ϕv) within the LRT at different dimensionless time instances (τ) post onset of infection and (B) Temporal change in ϕv at different spatial locations within the LRT (N = 0, 12, 23; N represents the lung generation number). The results in (B) are shown with respect to a dimensionless time (τ) as well as a dimensional time (Ti) post infection onset. The breathing time period (Tb = 4s) is considered for obtaining the dimensional time (see Eq. 7). All results are shown considering the baseline parameter values (see Table 1).
In contrast, viruses deposited in the deep lung (N ≥ 18) are transported only through diffusion due to absence of mucociliary advection. This leads to longer persistence of viruses deposited in the deep lung. The dynamics of ϕv in the deep lung is, thus, determined by the weak diffusive transport and virus kinetics only. It can be observed that ϕv reduces considerably in the initial period post-deposition due to larger virus clearance as compared to virus replication. Once virus replication starts to dominate, ϕv starts to increase as time progresses (see Figure 2A). The increase of ϕv at various lung generations continues as long as the impact of virus replication remains stronger than virus clearance (see Figure 2B). However, it is observed that beyond a certain ϕv, virus clearance becomes stronger than replication leading to a reduction in ϕv with time. The critical virus concentration (ϕv, max), thus obtained, corresponds to the peak infectious state. The corresponding time is denoted as τinf,p.
Longer residence time of viruses in the deep lung allows greater replication leading to substantially higher peak ϕv (see Figure 2B). This increases the probability of severe infection including pneumonia and acute respiratory distress syndrome (ARDS). Additionally, the thin surfactant layer in the deep lungs increases the possibility of the deposited viruses entering the blood stream in the alveolated bronchioles causing viremia. Thus, it is important to understand the various conditions that cause deposition of viruses in the deep lung as well as to study the impact of these conditions on infection progression in the deep lung. This is discussed in the following sections. Physiologically relevant ranges are chosen for all parameters in this study (see Supplementary Table S3 for more details). The corresponding dimensionless parameters are summarized in Table 1 with the baseline magnitudes and the range over which they are studied.
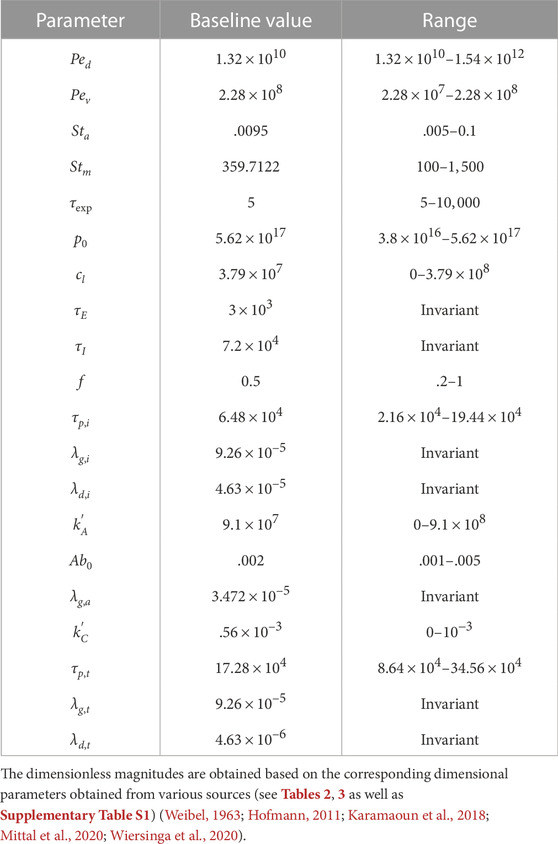
TABLE 1. Baseline values of various dimensionless parameters and their ranges.
3.1 Effect of inhaled droplet size, airflow rate and exposure duration
The effects of inhaled droplet size and airflow rate are studied by varying the droplet Peclet number (Ped). Ped is defined as the ratio of advective airflow in the lung to diffusive transport of the droplets in air (see Eq. 2). As such, a stronger advective airflow or a larger inhaled droplet size results in a larger Ped and vice versa. Although it is expected that a larger Ped would make the inhaled droplets reach deeper regions of the lung, analyses have established that droplet deposition in the deep lung is non-monotonic (Hofmann, 2011; Chakravarty et al., 2022). The initial ϕv (and subsequently, ϕv, max) in the deep lung follows the droplet deposition characteristics (see Figures 3A, B). However, the infection progression remains qualitatively similar for all Ped with no significant difference in τinf,p. The time taken for infection resolution also remains unaffected since Ped does not influence virus clearance from the lung. This suggests the inevitability of an infection (which often becomes severe) even if a small fraction of the inhaled droplets reach the deep lung. Transport of viruses to the deep lung, thus, needs to be minimised.
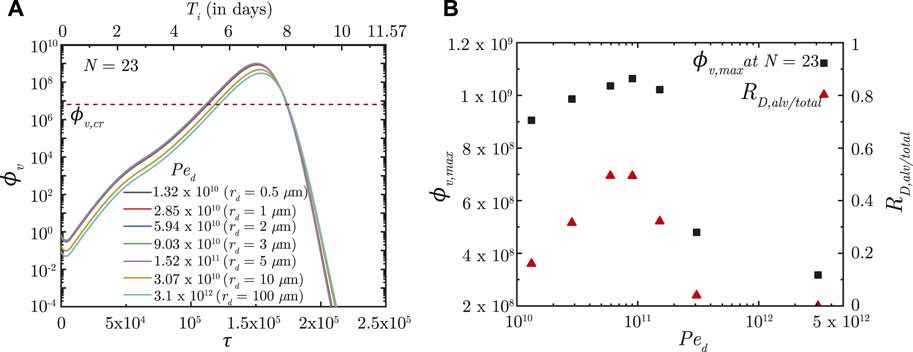
FIGURE 3. (A) Temporal change in dimensionless virus concentration (ϕv) at N = 23 (deep lung) for different Ped with respect to dimensionless time (τ) as well as a dimensional time (Ti) post infection onset. The breathing time period (Tb = 4s) is considered for obtaining the dimensional time (see Eq. 7). Dimensional droplet radii (rd) is additionally mentioned for each Ped considering a tidal volume of 1,000 mL. (B) Change in peak dimensionless virus concentration (ϕv, max) in the deep lung with varying Ped (1010 − 5 × 10¹²; rd = .4 − 160 μm). Results indicate that ϕv, max in the deep lung follows a similar trend as the ratio of deep lung (alveolar) deposition to total droplet deposition in the lungs (RD,alv/total). The dotted line indicates the critical viral load (ϕv,cr) in the deep lung required for pneumonia onset (Fajnzylber et al., 2020; Wölfel et al., 2020).
In contrast, τexp is observed to significantly influence infection progression in the lungs although it does not influence the deposition location. A longer τexp results in the droplets being inhaled into the LRT for a longer duration resulting in larger droplet deposition in the mucus (Chakravarty et al., 2022) and in a higher initial ϕv. This leads to faster infection progression (shorter τinf,p) and a substantially larger ϕv, max (see Figure 4). Thus, minimizing the inhalation duration can help control the severity of the infection.
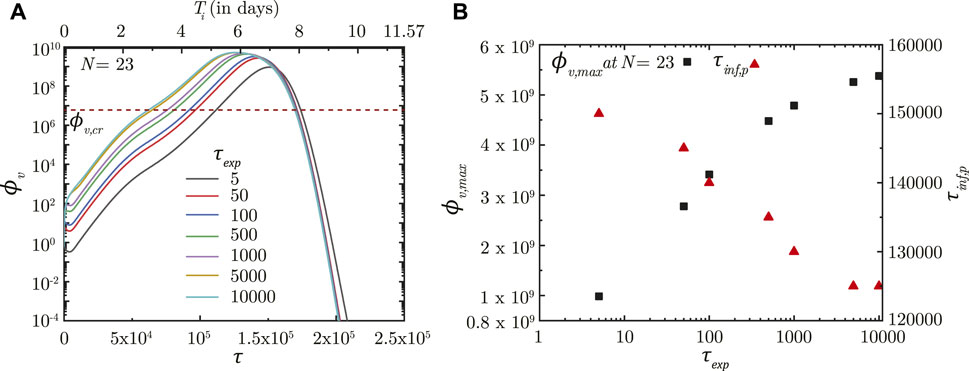
FIGURE 4. (A) Temporal change in dimensionless virus concentration (ϕv) at N = 23 (deep lung) for different exposure durations (τexp) with respect to dimensionless time (τ) as well as a dimensional time (Ti) post infection onset. The breathing time period (Tb = 4s) is considered for obtaining the dimensional time (see Eq. 7). (B) Change in peak dimensionless virus concentration (ϕv,max) and time required for reaching peak infection (τinf,p) in the deep lung with varying τexp. The dotted line indicates the critical viral load (ϕv,cr) in the deep lung required for pneumonia onset (Fajnzylber et al., 2020; Wölfel et al., 2020).
3.2 Effect of virus size, mucus advection and viscosity
The impact of virus size, mucociliary advection and mucus viscosity is studied by varying the virus Peclet number (Pev). Pev is defined as the ratio of advective mucociliary transport and diffusive transport of the deposited viruses in the mucus layer (see Eq. 7). A larger Pev, as such, indicates stronger mucociliary advection (or weaker diffusive transport) and vice versa. Weaker diffusive transport can be the result of a larger virus or more viscous mucus.
A larger Pev (stronger mucociliary advection) leads to relatively faster washout of viruses from the upper airways of the lung where mucociliary clearance is substantial (see Figure 5, N = 12). Faster washout reduces the residence time of the viruses in the upper airways. This inhibits virus replication and reduces ϕv, max in the upper airways. Similar effects are observed in the upper airways for the entire range of Ped considered in this analysis. In contrast, only a minor impact is observed in the deep lung (N = 23) for the range of Pev considered. This can be primarily attributed to the negligible mucociliary clearance from the deep lung. A change in Pev in the deep lung, thus, implies modification of virus diffusivity. However, the time-scale of virus diffusion is too long for it to have any substantial impact on the infection time-course in the deep lung.
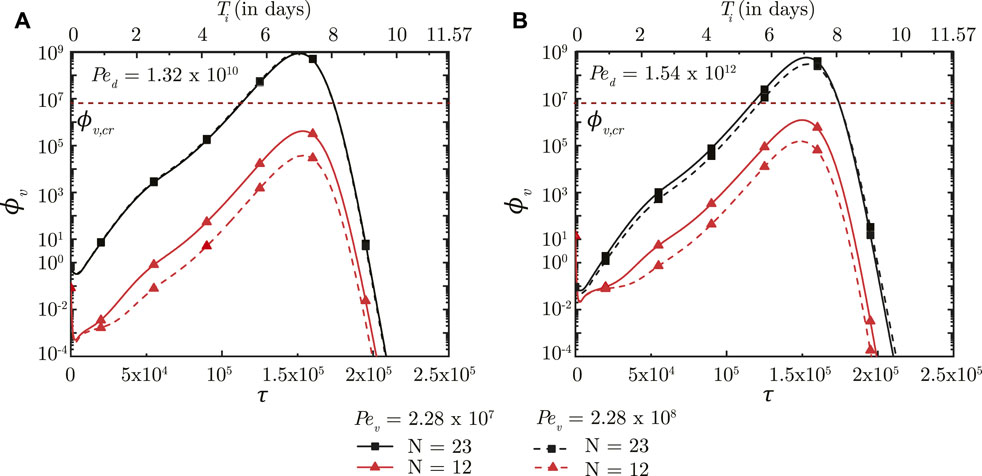
FIGURE 5. Temporal change in dimensionless virus concentration (ϕv) in the upper airways (N = 12) and the deep lung (N = 23) for different Pev with respect to dimensionless time (τ) as well as a dimensional time (Ti) post infection onset. The breathing time period (Tb = 4s) is considered for obtaining the dimensional time (see Eq. 7). The results are shown for two different Ped in (A,B). The dotted line indicates the critical viral load (ϕv,cr) in the deep lung required for pneumonia onset (Fajnzylber et al., 2020; Wölfel et al., 2020).
While the size of inhaled viruses cannot be controlled, the rate of mucociliary clearance and mucus viscosity can be therapeutically modified. This provides a viable approach for controlling infection progression in the upper airways of the lung. A similar viable approach for deep lung infection is, however, not feasible.
3.3 Effect of breathing rate
The impact of breathing time period is studied by varying two parameters—the airway Strouhal number (Sta) and the mucus Strouhal number (Stm). Sta is defined as the ratio of time scale of advective airflow in the LRT to the breathing time period (see Eq. 2). Stm is defined as the ratio between time scale of mucociliary advection and the breathing time period (see Eq. 7). While Sta affects the initial deposition of the inhaled virus-laden droplets, Stm influences the washout of the deposited viruses and hence, the infection time-course.
Figure 6A shows the impact of Sta on ϕv in the deep lung. A longer breathing time period (smaller Sta) leads to a larger volume of droplets inhaled into the lung, keeping all other parameters constant. This allows a greater portion of the inhaled droplets to reach the deep lung (Chakravarty et al., 2022) which, in turn, results in increased deposition of viruses. A larger ϕv at the end of τinh causes faster infection progression in the lung (shorter τinf,p) and a corresponding higher ϕv, max (see Figure 6A). However, the time required for infection resolution remains similar. It is to be noted that there is no substantial difference between the results obtained in the deep lung for Sta ≥ .05 since droplet deposition in the deep lung remains almost invariant beyond this limit (Chakravarty et al., 2022).
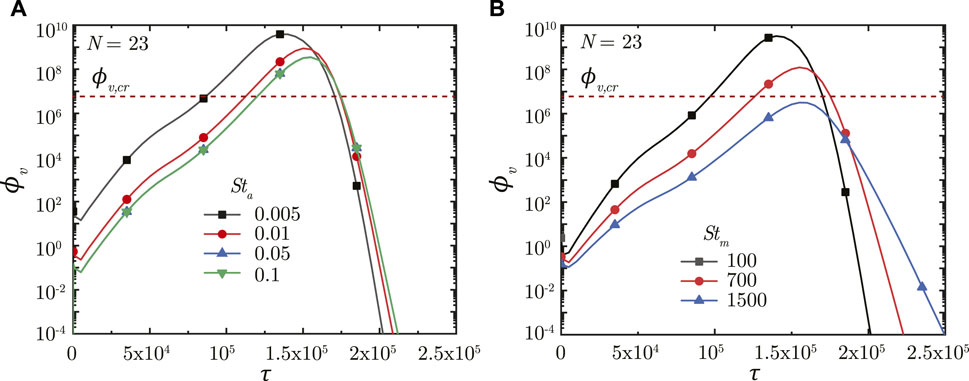
FIGURE 6. Temporal change in dimensionless virus concentration (ϕv) at N = 23 (deep lung) for various (A) Sta and (B) Stm. The dotted line indicates the critical viral load (ϕv,cr) in the deep lung required for pneumonia onset (Fajnzylber et al., 2020; Wölfel et al., 2020).
A longer breathing period also reduces Stm suggesting greater mucociliary clearance from the upper airways in a breathing cycle, keeping all other parameters constant. In other words, less number of breathing cycles are required to achieve equivalent mucus clearance (and hence, virus washout) from the upper airways of the lung at lower Stm. This can be observed from Figure 6B. The actual time taken for virus washout is, however, much longer since Stm is inversely dependent on Tb. Thus, faster virus washout takes place from the upper airways at larger Stm and vice versa. This leads to a steeper concentration gradient between the deep lung and the upper airways resulting in faster diffusive transport in the deep lung. Thus, infections get resolved relatively faster in the deep lung at larger Stm. In addition, a larger Tb (for lower Stm) also allows the deposited viruses to replicate more leading to relatively higher ϕv, max at lower Stm (see Figure 6B).
In summary, longer breaths result in a larger ϕv, max, and slower infection resolution, both of which are bad from a clinical perspective. ϕv, max beyond a certain limit in the deep lung (see Figure 6B) can cause pneumonia, which may become life threatening. Thus, shorter breaths, which lowers the viral load in the lung and relatively shortens the infection time-course, are more beneficial.
3.4 Effect of virus growth and clearance rates
The impact of virus growth and clearance is studied by varying p0 and cl, respectively, other parameters remaining fixed. It is observed that a higher p0 (higher virus replication) leads to larger ϕv in the deep lung throughout the time-course of infection (see Figure 7A). ϕv, max in the deep lung, as such, increases as p0 becomes larger and vice versa. However, no significant change is observed in τinf,p.
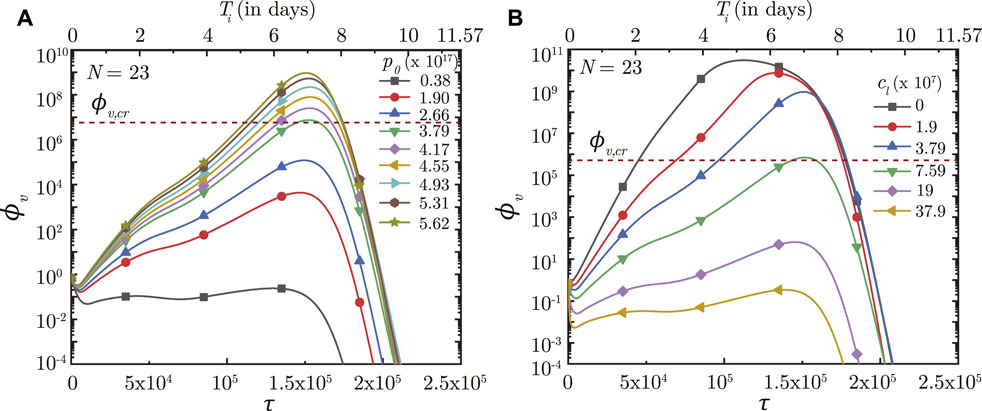
FIGURE 7. Temporal change in dimensionless virus concentration (ϕv) at N = 23 (deep lung) for different (A) virus replication rates (p0) and (B) virus clearance rates (cL). The results are shown with respect to dimensionless time (τ) as well as a dimensional time (Ti) post infection onset with the breathing time period (Tb = 4s) considered for obtaining the dimensional time (see Eq. 7). The dotted line indicates the critical viral load (ϕv,cr) in the deep lung required for pneumonia onset (Fajnzylber et al., 2020).
In contrast, the virus clearance rate (cL) is observed to affect ϕv as well as τinf,p (see Figure 7B). Greater cl results in larger virus clearance from the lung which reduces ϕv (and hence, ϕv, max) and also delays attainment of the peak infectious state. The reverse happens when cl is reduced.
3.5 Effect of immunity
The simplified immune response considered in the present study is a combined model of humoral response (antibodies), innate response (interferons) and cellular response (cytotoxic T-lymphocytes). As such, it becomes necessary to distinguish between these responses in order to identify the key effects of the individual responses on virus concentration in the lung and infection time-course. This is achieved by varying the parameters of a specific response model, while keeping the other response models constant.
3.5.1 Antibody (humoral) response
The humoral immune response mechanism acts by producing antibodies in response to an infection (or vaccination). These antibodies bind with the pathogens (viruses) and neutralize them, thereby enhancing the virus clearance rate. The efficacy of this response is, thus, dependent on the rate at which the antibodies neutralize the pathogens
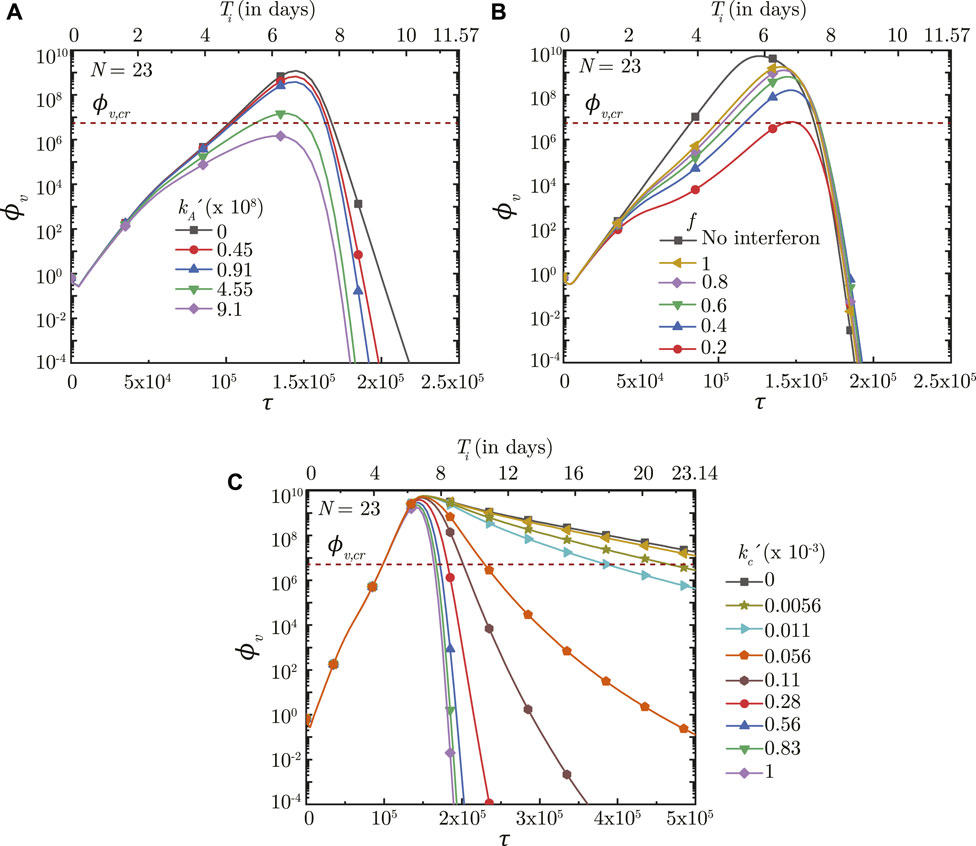
FIGURE 8. Temporal change in dimensionless virus concentration (ϕv) at N = 23 (deep lung) with change in (A) binding affinity of antibodies
FIGURE 9. Temporal change in dimensionless virus concentration (ϕv) at N = 23 (deep lung) with change in the time required for (A) interferon (τp,i) and (B) cytotoxic T-lymphocytes (τp,c) to reach their peak levels, and (C) with change in the initial antibody level (Ab0) in the infected individual. The results are shown with respect to dimensionless time (τ) as well as a dimensional time (Ti) post infection onset with the breathing time period (Tb = 4s) considered for obtaining the dimensional time (see Eq. 7). The dotted line indicates the critical viral load (ϕv,cr) in the deep lung required for pneumonia onset (Fajnzylber et al., 2020).
3.5.2 Interferon (innate) response
The innate immune response mechanism works by production of interferons which inhibits virus replication through various secondary mechanisms. The effects of such secondary mechanisms are not considered in detail in the present model and the sole effect of interferons is modeled to be reduction in virus growth rate (p0). Figure 8B shows the impact of interferons (through the parameter f) on the infection time-course in the deep lung. f is defined such that, for f = .5, the virus growth rate is halved when interferon concentration is at 50% of its peak concentration. A larger f, therefore, has a smaller impact on the virus concentration in the lung and vice versa. ϕv, max is also observed to reduce significantly and τinf,p becomes relatively longer with decreasing f.
The time taken for interferon concentration to reach its peak (τp,i) is also observed to influence the infection time-course (see Figure 9A). Early peaking of interferons (lower τp,i) reduces ϕv during the initial stages of infection, but does not have any significant influence during the later stages. As τp,i becomes longer, the impact on virus production during the initial stages of infection becomes delayed resulting in relatively larger ϕv. Beyond a certain τp,i, however, no substantial change is observed on the virus concentration.
3.5.3 T-lymphocyte (cellular) response
The cellular response mechanism is dependent on the action of cytotoxic T − lymphocytes on the infected cells. The T − lymphocytes act by recognising and neutralising the infected cells. The impact of the cellular response mechanism is, thus, dependent on the rate at which the T − lymphocytes neutralise the infected cells
Results indicate that the impact of T − lymphocytes on ϕv remains negligible during the initial period of infection mainly due to low Tl in the body (see Figures 8C, 9B). Tl builds up as time progresses causing larger neutralisation of the infected cells (see Eq. 15). This, in turn, reduces ϕv especially during the later stages of infection. The rate at which ϕv reduces during this period is observed to vary substantially with
Figure 9B shows the effect of Tl in the body (in terms of τp,t) on ϕv in the deep lung. τp,t is defined as the time taken by Tl to reach its peak. A shorter τp,t results in faster buildup of Tl and vice versa (see Eq. 15). Faster buildup of Tl allows the cellular response mechanism to start acting early which, in turn, restricts ϕv, max to small magnitudes and also causes early infection resolution. The reverse happens when τp,t becomes longer thereby highlighting the need of having T − lymphocytes present in the body prior to infection.
4 Discussion
4.1 Variant to variant difference
One of the key aspects of the SARS-CoV-2 pandemic has been the consistent mutation of the virus leading to emergence of newer variants as the pandemic progressed. Some of these variants (for e.g., Omicron) caused faster infection spread with milder symptoms in the infected individuals. Other variants (for e.g., Delta) often caused more severe health effects (Puhach et al., 2022; Silva et al., 2022). The time-course of infection also varied from one variant of the virus to the other. Symptoms lasted typically for
Our results indicate that the reason for such difference in symptom severity and infection time-course can be correlated to the relative replication and neutralization of the virus in the host cells (see Figure 7). For a given rate of virus neutralization, the viral load reduced and the infection time-course shortened as the replication rate attenuated. Greater virus neutralization rate, for a given virus replication rate, has a similar impact. A lower viral load suggests occurrence of milder symptoms in the infected individual. Thus, it can be stated that the virus replication rate in the lung becomes attenuated (or virus neutralization is enhanced) in case of the variants causing milder symptoms and shorter infection time-courses (for e.g., Omicron) as compared to the variants causing severe symptoms and longer infection time-courses (for e.g., Delta). A recent study by Silva et al. (2022) corroborates this inference.
4.2 Vaccination and acquired immunity
Vaccination against SARS-CoV-2 has played a major role in suppressing the severity of the pandemic. Vaccines work by inducing the production of B − lymphocytes and T − lymphocytes (or memory cells) within the body (Scourfield et al., 2021; Zollner et al., 2021). The B − lymphocytes are responsible for the production of antibodies which fight the viruses. T − lymphocytes are cytotoxic in nature and attack the cells infected by the virus. The end outcome is that the body is left with heightened defenses against the virus. Similar effects are true for prior infections as well, although magnitudes of such effects may vary.
Our results confirm that prior presence of T − lymphocytes within the body readily suppresses an infection (see Figure 9B). Prior presence of T − lymphocytes (which reduces the time required for T − lymphocyte concentration to peak) suppress virus replication from the onset of infection itself leading to lower ϕv, max and hence, reduces the probability of disease severity. Similarly, a larger initial antibody presence in the body allows targeting (and subsequent neutralisation) of a larger number of viruses. This slows down virus replication and enables other immune effects to act effectively, thereby decreasing disease severity (see Figure 9C).
Effectiveness of the antibodies and T − lymphocytes also play an important role in infection progression. An effective antibody against SARS-CoV-2 neutralizes the viruses at a much faster rate, thereby, restricting its replication and reducing probability of the infection progressing to a severe disease (see Figure 8A). Effectiveness of the T − lymphocytes, however, does not influence infection progression until their concentration becomes large enough, after which an effective T − lymphocyte readily suppress the infection (see Figure 8C).
4.3 Deep lung infection in SARS-CoV-2
Results indicate that a certain portion of virus-laden droplets present at the entrance to the trachea inevitably reach the deep lung where they deposit releasing the viruses causing infection in the deep lung. These droplets are a combination of the inhaled droplets (which have not deposited in the nasopharynx) and those formed due to aerosolisation of the mucus layer during respiratory motions (coughs etc.). More the availability of droplets, longer is the duration for which these may be inhaled into the LRT and greater is the probability of these droplets reaching the deep lung causing infection (see Figure 4). Clinical conditions such as bronchitis, asthma, etc. accentuate the probability of formation of aerosolised droplets due to mucus hypersecretion or airway constriction (Fahy and Dickey, 2010). Thus, the probability of contracting deep lung infection remains higher when clinically associated with other upper airway diseases (Lee et al., 2020) which promote aerosolization of nasopharyngeal mucus.
The severity of a deep lung infection is determined by the binding affinity of the virus with cells in the deep lung as well as the replication/neutralization characteristics of the virus. Binding affinity is lower and replication becomes attenuated for the Omicron variant of SARS-CoV-2 in the deep lung cells (Silva et al., 2022) resulting in much lower probability of a severe deep lung infection. This is in contrast to the Delta variant for which the probability of a severe deep lung infection is much more due to its higher binding affinity and larger replication rate in the cells of deep lung (Silva et al., 2022). Greater the severity of deep lung infection, larger is the probability of development of pneumonia and associated respiratory complications.
4.4 Time-scale of pneumonia onset in a SARS-CoV-2 infection
Onset of pneumonia is a common yardstick used to gauge the severity of any infection since it can progress rapidly to respiratory failure. Clinical studies have found that the time taken for the development of respiratory failure from pneumonia in a human body from a SARS-CoV-2 infection is typically 6–14 days after the initial onset of symptoms (Feng et al., 2020; Grant et al., 2021), primarily after oropharyngeal infection (Wiersinga et al., 2020). There is autopsy-based evidence of the migration of deposited viruses from the pharyngeal region to the lower respiratory tract and the distal alveolar region (Hou et al., 2020; Grant et al., 2021), although the mechanism still remains unclear. Aspiration is a possible mechanism Basu et al. (2022). Another plausible mechanism is through inhalation of infected droplets as considered in the present study. Residual inhaled droplets or those formed by aerosolisation of the infected mucosa (due to interaction of the infected mucosa with airflow) are subsequently transported from the nasopharynx deeper into the lung where they can release the viruses causing further infection (Darquenne et al., 2022).
The results presented above are used to estimate the time taken for the SARS-CoV-2 concentration in the deep lung to reach the critical magnitude (cv,cr) required for onset of pneumonia. Virus concentration in the pharyngeal region (N = 0) is assumed to be the clinically observed viral load in mild infections in pharyngeal samples, where SARS-CoV-2 is initially registered (cv,0 = 102 copies/mL) (Fajnzylber et al., 2020). The critical concentration in the deep lungs (cv,cr) is assumed to be the clinically observed median viral load in sputum samples (7 × 10⁶ copies/mL) of symptomatic individuals exhibiting pneumonia (Fajnzylber et al., 2020; Wölfel et al., 2020) (see Supplementary Tables S3, S4 for time-estimates with other cv,cr). It is further assumed that the pharyngeal viral load remains constant throughout the inhalation duration. It is calculated that the time required for onset of pneumonia in a SARS-CoV-2 infection can vary from
TABLE 2. Variation in estimated time required for onset of SARS-CoV-2 pneumonia with change in various dimensional fluid dynamic and physiological parameters.
TABLE 3. Variation in estimated time required for onset of SARS-CoV-2 pneumonia with change in various dimensional infection parameters.
These estimates suggest no significant change
5 Summary
Respiratory viruses, such as SARS-CoV-2, are primarily transmitted through the airborne route through respiratory droplets. When a subject inhales these droplets, they are deposited in respiratory mucus of the upper respiratory tract, where the virus infects and replicates in the nasopharyngeal epithelial cells. Some patients may develop severe pneumonia and acute respiratory distress syndrome if the infection spreads to the deep lung (alveolar region). This work discusses whether a nasopharyngeal infection can spread to the deep lung through inhalation of droplets, present in the nasopharynx, into the lower respiratory tract and the degree of severity of such an infection. A coupled mathematical model of droplet and virus transport is solved computationally considering virus infection kinetics and the effect of key dimensionless parameters is investigated. Different conditions are analysed through these dimensionless parameters based on which necessary remedies and public health recommendations can be suggested.
Results indicate that fluid dynamics play an important role only in transporting the droplets from the nasopharynx to various regions of the lower respiratory tract (including the deep lung), where the droplets deposit and release the viruses causing further infection. Progress of this infection is independent of the viral load deposited. However, infection severity depends on the deposited viral load - a smaller viral load causing a milder infection and vice versa. Thus, adequate measures need to be adopted to prevent conditions which promote larger viral load deposition in the lower respiratory tract, particularly the deep lung. One such measure is prevention of self-aerosolization of nasopharyngeal mucus layer which provides an additional source of virus-laden droplets in the nasopharynx for further inhalation into the lower respiratory tract. Another measure is avoiding longer breaths which reduces the volume of droplets inhaled.
Once an infection initiates, growth and resolution of the infection is determined by the infection kinetics and immune responses. A larger virus replication rate (or smaller clearance rate) increases the chance of a severe infection leading to pneumonia onset, and vice versa. Specifically, the model predicts, in agreement with clinical observations, that a severe infection (pneumonia) can develop in the deep lung within 2.5–7 days of initial symptom onset, when nasopharyngeal droplets are inhaled into the lower respiratory tract. The immune responses, particularly antibodies and T − lymphocytes, are observed to be critically important for preventing infection severity and achieving quicker infection resolution. Stronger immune responses—which may be due to a prior infection or induced by vaccination—significantly lowers the chance of a severe infection. This reinforces the need of vaccination in preventing severe infections from SARS-CoV-2.
Data availability statement
The original contributions presented in the study are included in the article/Supplementary Material, further inquiries can be directed to the corresponding author.
Author contributions
Conceptualization: AC, MP, and NP; Analysis: AC, MP, and NP; Software: AC; Writing (original draft): AC and NP; Writing (review and editing): AC, MP, and NP.
Conflict of interest
The authors declare that the research was conducted in the absence of any commercial or financial relationships that could be construed as a potential conflict of interest.
Publisher’s note
All claims expressed in this article are solely those of the authors and do not necessarily represent those of their affiliated organizations, or those of the publisher, the editors and the reviewers. Any product that may be evaluated in this article, or claim that may be made by its manufacturer, is not guaranteed or endorsed by the publisher.
Supplementary material
The Supplementary Material for this article can be found online at: https://www.frontiersin.org/articles/10.3389/fphys.2023.1073165/full#supplementary-material
References
Abkarian M., Stone H. (2020). Stretching and break-up of saliva filaments during speech: A route for pathogen aerosolization and its potential mitigation. Phys. Rev. Fluids 5, 102301. doi:10.1103/physrevfluids.5.102301
Abkarian M., Mendez S., Xue N., Yang F., Stone H. A. (2020). Speech can produce jet-like transport relevant to asymptomatic spreading of virus. Proc. Natl. Acad. Sci. 117, 25237–25245. doi:10.1073/pnas.2012156117
Baccam P., Beauchemin C., Macken C. A., Hayden F. G., Perelson A. S. (2006). Kinetics of influenza a virus infection in humans. J. Virol. 80, 7590–7599. doi:10.1128/JVI.01623-05
Basu S., Akash M. M. H., Hochberg N. S., Senior B. A., Joseph-McCarthy D., Chakravarty A. (2022). From sars-cov-2 infection to Covid-19 morbidity: an in silico projection of virion flow rates to the lower airway via nasopharyngeal fluid boluses. Rhinol. Online 5, 10–18. doi:10.4193/rhinol/21.053
Basu S. (2021). Computational characterization of inhaled droplet transport to the nasopharynx. Sci. Rep. 11, 6652. doi:10.1038/s41598-021-85765-7
Chakravarty A., Patankar N. A., Panchagnula M. V. (2019). Aerosol transport in a breathing alveolus. Phys. Fluids 31, 121901. doi:10.1063/1.5127787
Chakravarty A., Panchagnula M. V., Mohan A., Patankar N. A. (2022). Pulmonary drug delivery and retention: A computational study to identify plausible parameters based on a coupled airway-mucus flow model. PLOS Comput. Biol. 18, e1010143. doi:10.1371/journal.pcbi.1010143
Chen W., Lan Y., Yuan X., Deng X., Li Y., Cai X., et al. (2020). Detectable 2019-nCoV viral RNA in blood is a strong indicator for the further clinical severity. Emerg. Microbes Infect. 9, 469–473. doi:10.1080/22221751.2020.1732837
Chen A., Wessler T., Daftari K., Hinton K., Boucher R. C., Pickles R., et al. (2022). Modeling insights into sars-cov-2 respiratory tract infections prior to immune protection. Biophys. J. 121, 1619–1631. doi:10.1016/j.bpj.2022.04.003
Darquenne C., Borojeni A. A., Colebank M. J., Forest M. G., Madas B. G., Tawhai M., et al. (2022). Aerosol transport modeling: the key link between lung infections of individuals and populations. Front. Physiol. 13, 923945. doi:10.3389/fphys.2022.923945
Edwards D. A., Ausiello D., Salzman J., Devlin T., Langer R., Beddingfield B. J., et al. (2021). Exhaled aerosol increases with COVID-19 infection, age, and obesity. Proc. Natl. Acad. Sci. 118, e2021830118. doi:10.1073/pnas.2021830118
Fahy J. V., Dickey B. F. (2010). Airway mucus function and dysfunction. N. Engl. J. Med. 363, 2233–2247. doi:10.1056/NEJMra0910061
Fajnzylber J., Regan J., Coxen K., Corry H., Wong C., Rosenthal A., et al. (2020). SARS-CoV-2 viral load is associated with increased disease severity and mortality. Nat. Commun. 11, 5493–5499. doi:10.1038/s41467-020-19057-5
Feng Z., Yu Q., Yao S., Luo L., Zhou W., Mao X., et al. (2020). Early prediction of disease progression in Covid-19 pneumonia patients with chest ct and clinical characteristics. Nat. Commun. 11, 4968–4969. doi:10.1038/s41467-020-18786-x
Fröhlich E., Mercuri A., Wu S., Salar-Behzadi S. (2016). Measurements of deposition, lung surface area and lung fluid for simulation of inhaled compounds. Front. Pharmacol. 7, 181. doi:10.3389/fphar.2016.00181
Grant R. A., Morales-Nebreda L., Markov N. S., Swaminathan S., Querrey M., Guzman E. R., et al. (2021). Circuits between infected macrophages and T cells in SARS-CoV-2 pneumonia. Nature 590, 635–641. doi:10.1038/s41586-020-03148-w
Hagman K., Hedenstierna M., Gille-Johnson P., Hammas B., Grabbe M., Dillner J., et al. (2020). SARS-CoV-2 RNA in serum as predictor of severe outcome in COVID-19: a retrospective cohort study. Clin. Infect. Dis. 73 (9), 635–641. 1 November 2021. doi:10.1093/cid/ciaa1285
Handel A., Liao L. E., Beauchemin C. A. (2018). Progress and trends in mathematical modelling of influenza A virus infections. Curr. Opin. Syst. Biol. 12, e2995–e3001. doi:10.1016/j.coisb.2018.08.009
Harrison A. G., Lin T., Wang P. (2020). Mechanisms of SARS-CoV-2 transmission and pathogenesis. Trends Immunol. 41, 1100–1115. doi:10.1016/j.it.2020.10.004
Heyder J., Gebhart J., Rudolf G., Schiller C. F., Stahlhofen W. (1986). Deposition of particles in the human respiratory tract in the size range 0.005-15 μm. J. Aerosol Sci. 17, 811–825. doi:10.1016/0021-8502(86)90035-2
Hofmann W. (2011). Modelling inhaled particle deposition in the human lung–a review. J. Aerosol Sci. 42, 693–724. doi:10.1016/j.jaerosci.2011.05.007
Hou Y. J., Okuda K., Edwards C. E., Martinez D. R., Asakura T., Dinnon K. H., et al. (2020). SARS-CoV-2 reverse genetics reveals a variable infection gradient in the respiratory tract. Cell 182, 429–446. doi:10.1016/j.cell.2020.05.042
Jackson C. B., Farzan M., Chen B., Choe H. (2022). Mechanisms of sars-cov-2 entry into cells. Nat. Rev. Mol. Cell Biol. 23, 3–20. doi:10.1038/s41580-021-00418-x
Jensen M. A., Wang Y.-Y., Lai S. K., Forest M. G., McKinley S. A. (2019). Antibody-mediated immobilization of virions in mucus. Bull. Math. Biol. 81, 4069–4099. doi:10.1007/s11538-019-00653-6
Karamaoun C., Sobac B., Mauroy B., Van Muylem A., Haut B. (2018). New insights into the mechanisms controlling the bronchial mucus balance. PloS One 13, e0199319. doi:10.1371/journal.pone.0199319
Lee S. C., Son K. J., Han C. H., Jung J. Y., Park S. C. (2020). Impact of comorbid asthma on severity of coronavirus disease (Covid-19). Sci. Rep. 10, 21805–21809. doi:10.1038/s41598-020-77791-8
Madas B. G., Füri P., Farkas Á., Nagy A., Czitrovszky A., Balásházy I., et al. (2020). Deposition distribution of the new coronavirus (sars-cov-2) in the human airways upon exposure to cough-generated droplets and aerosol particles. Sci. Rep. 10, 22430–22438. doi:10.1038/s41598-020-79985-6
Mauroy B., Fausser C., Pelca D., Merckx J., Flaud P. (2011). Toward the modeling of mucus draining from the human lung: role of the geometry of the airway tree. Phys. Biol. 8, 056006. doi:10.1088/1478-3975/8/5/056006
Menache M., Hanna L., Gross E., Lou S.-R., Zinreich S. J., Leopold D., et al. (1997). Upper respiratory tract surface areas and volumes of laboratory animals and humans: considerations for dosimetry models. J. Toxicol. Environ. Health 50, 475–506. doi:10.1080/00984109708984003
Menni C., Valdes A. M., Polidori L., Antonelli M., Penamakuri S., Nogal A., et al. (2022). Symptom prevalence, duration, and risk of hospital admission in individuals infected with sars-cov-2 during periods of omicron and delta variant dominance: a prospective observational study from the zoe Covid study. Lancet 399, 1618–1624. doi:10.1016/S0140-6736(22)00327-0
Mittal R., Ni R., Seo J.-H. (2020). The flow physics of COVID-19. J. Fluid Mech. 894, F2. doi:10.1017/jfm.2020.330
Moriarty J. A., Grotberg J. B. (1999). Flow-induced instabilities of a mucus–serous bilayer. J. Fluid Mech. 397, 1–22. doi:10.1017/s0022112099005704
Néant N., Lingas G., Le Hingrat Q., Ghosn J., Engelmann I., Lepiller Q., et al. (2021). Modeling sars-cov-2 viral kinetics and association with mortality in hospitalized patients from the french Covid cohort. Proc. Natl. Acad. Sci. 118, e2017962118. doi:10.1073/pnas.2017962118
Puhach O., Adea K., Hulo N., Sattonnet P., Genecand C., Iten A., et al. (2022). Infectious viral load in unvaccinated and vaccinated individuals infected with ancestral, delta or omicron sars-cov-2. Nat. Med. 28, 1491–1500. doi:10.1038/s41591-022-01816-0
Quirouette C., Younis N. P., Reddy M. B., Beauchemin C. A. (2020). A mathematical model describing the localization and spread of influenza a virus infection within the human respiratory tract. PLoS Comput. Biol. 16, e1007705. doi:10.1371/journal.pcbi.1007705
Scourfield D. O., Reed S. G., Quastel M., Alderson J., Bart V. M., Teijeira Crespo A., et al. (2021). The role and uses of antibodies in Covid-19 infections: A living review. Oxf. Open Immunol. 2, iqab003. doi:10.1093/oxfimm/iqab003
Silva S. J. R. d., Kohl A., Pena L., Pardee K. (2022). Recent insights into sars-cov-2 omicron variant. Rev. Med. Virol., e2373. doi:10.1002/rmv.2373
Smith D., Gaffney E., Blake J. (2008). Modelling mucociliary clearance. Respir. Physiology Neurobiol. 163, 178–188. doi:10.1016/j.resp.2008.03.006
Sznitman J. (2013). Respiratory microflows in the pulmonary acinus. J. Biomech. 46, 284–298. doi:10.1016/j.jbiomech.2012.10.028
Tan C., Li S., Liang Y., Chen M., Liu J. (2020). SARS-CoV-2 viremia may predict rapid deterioration of COVID-19 patients. Braz. J. Infect. Dis. 24, 565–569. doi:10.1016/j.bjid.2020.08.010
Wang S., Pan Y., Wang Q., Miao H., Brown A. N., Rong L. (2020). Modeling the viral dynamics of sars-cov-2 infection. Math. Biosci. 328, 108438. doi:10.1016/j.mbs.2020.108438
Wiersinga W. J., Rhodes A., Cheng A. C., Peacock S. J., Prescott H. C. (2020). Pathophysiology, transmission, diagnosis, and treatment of coronavirus disease 2019 (COVID-19): a review. JAMA 324, 782–793. doi:10.1001/jama.2020.12839
Wölfel R., Corman V. M., Guggemos W., Seilmaier M., Zange S., Müller M. A., et al. (2020). Virological assessment of hospitalized patients with Covid-2019. Nature 581, 465–469. doi:10.1038/s41586-020-2196-x
Keywords: SARS-CoV-2, influenza, mucociliary clearance, weibel model, infection kinetics, pneumonia onset time, vaccination efficacy, aerosolization
Citation: Chakravarty A, Panchagnula MV and Patankar NA (2023) Inhalation of virus-loaded droplets as a clinically plausible pathway to deep lung infection. Front. Physiol. 14:1073165. doi: 10.3389/fphys.2023.1073165
Received: 18 October 2022; Accepted: 04 January 2023;
Published: 19 January 2023.
Edited by:
Brent A. Craven, United States Food and Drug Administration, United StatesReviewed by:
Ross Walenga, United States Food and Drug Administration, United StatesDoug Fontes, Westmont College, United States
Jeffry Schroeter, Applied Research Associates, United States
Copyright © 2023 Chakravarty, Panchagnula and Patankar. This is an open-access article distributed under the terms of the Creative Commons Attribution License (CC BY). The use, distribution or reproduction in other forums is permitted, provided the original author(s) and the copyright owner(s) are credited and that the original publication in this journal is cited, in accordance with accepted academic practice. No use, distribution or reproduction is permitted which does not comply with these terms.
*Correspondence: Neelesh A. Patankar, bi1wYXRhbmthckBub3J0aHdlc3Rlcm4uZWR1