- 1School of Mechanical and Precision Instrument Engineering, Xi’an University of Technology, Xi’an, China
- 2Department of Mechanical Engineering, Graduate School of Science and Engineering, Chiba University, Chiba, Japan
- 3Department of Electrical Engineering and Informatics, Vocational College, Universitas Gadjah Mada, Yogyakarta, Indonesia
- 4MTG Co., Ltd., Nagoya, Japan
Objective: The physiological-induced conductive response has been visualised for evaluation in specific muscle compartments under hybrid (hybridEMS) of electrical muscle stimulation (EMS) and voluntary resistance training (VRT) by electrical impedance tomography (EIT).
Methods: In the experiments, tendency of conductivity distribution images σ over time was clearly detected for three specific muscle compartments, which are called AM1 compartment composed of biceps brachii muscle, AM2 compartment composed of triceps brachii muscle, and AM3 compartment composed of brachialis muscle, under three training modalities.
Results: From the experimental results, the tendency of physiological-induced conductive response are increased in all three training modalities with increasing training time. Correspondingly, the spatial-mean conductivity <σ>AM1,AM2,AM3 increased with the conductance value G and extracellular water ratio β of right arm by bio-impedance analysis (BIA) method. In addition, hybridEMS has the greatest effect on physiological-induced conductive response in AM1, AM2, and AM3. Under hybridEMS, the spatial-mean conductivity increased from <σpre > AM1 = 0.154 to <σ23mins > AM1 = 0.810 in AM1 muscle compartment (n = 8, p < 0.001); <σpre > AM2 = 0.040 to <σ23mins > AM2 = 0.254 in AM2 muscle compartment (n = 8, p < 0.05); <σpre > AM3 = 0.078 to <σ23mins > AM3 = 0.497 in AM3 muscle compartment (n = 8, p < 0.05).
Conclusion: The paired-samples t-test results of <σ>AM1,AM2,AM3 under all three training modalities suggest hybridEMS has the most efficient elicitation on physiological induced conductive response compared to VRT and EMS. The effect of EMS on deep muscle compartment (AM3) is slower compared to VRT and hybridEMS, with a significant difference after 15 min of training.
1 Introduction
Voluntary muscle strength is improved by expanding muscle mass in specific muscle compartments (Herbert et al., 1998). For instance, even lifting weights for as little as three seconds a day results in a positive impact on muscle strength (Sato et al., 2022). Regular muscle training for both young and elders enables the prevention of skeletal muscle disorders (Pennings et al., 2011), such as muscular dystrophy (Ansved, 2001), neuromuscular conditions (Pareja-Blanco et al., 2014), sarcopenia (Cheng et al., 2022). Resistance training is not a challenging task for people who have a training habit regularly, but not for the common people who never practice in their daily life. Furthermore, the recovery period is also difficult for people who suffer from prolonged immobility caused by bed rest. Hence, another type of training known as electrical muscle stimulation (EMS) has become a straightforward solution as a form of exercise and mobilization that does not require active participation with the capability to be applied to immobilized people (Karatzanos et al., 2012). Unfortunately, EMS training is often considered to yield a biased result (Fleckenstein et al., 1988). Effective resistance training requires professional instruction and subjects need to perform standard movements in order to achieve the desired training results (Fisher et al., 2022). In this regard, to improve the voluntary muscle strength effectively with a lower effort, hybrid of electrical muscle stimulation and voluntary resistance training called hybridEMS was proposed (Deley et al., 2011). hybridEMS offers optimum training with beneficial effects on muscle strength (Deley et al., 2011). However, the lack of a direct observation tool for physiological response before and after hybridEMS training has created a great need for real-time muscle compartments evaluation.
Conventionally, two methods are usually considered to evaluate muscle mass. On one hand, conventional tomographic methods such as magnetic resonance imaging (MRI) (Dahlqvist et al., 2020) and dual-energy X-ray absorptiometry (DXA) (Andreoli et al., 2009) are currently recommended for evaluating muscle mass. MRI is based on the principle of nuclear magnetic resonance, which is dependent on the different attenuation of the energy released in different structural environments within matter. The location and type of atomic nuclei that make up the object are detected by applying a gradient magnetic field to the emitted electromagnetic waves, allowing an image of the structure inside the organism to be built (Mercuri et al., 2005). DXA is a measurement method using spectral imaging, which is based on the different attenuation coefficients of biological soft tissue and bone to X-rays. The internal tissue structure of the organism is thus imaged by appropriate weighting (Erlandson et al., 2016). However, above-mentioned techniques are expensive, complicated to operate, and unable to provide long-term continuous monitoring at bedside or home (Rubbieri et al., 2014). On another hand, physical muscle testing methods, such as hand grip strength (HGS) (Lauretani et al., 2003) and the 6-min walk test (6MWT) (Bennell et al., 2011) are commonly used to evaluate muscle function. However, to ensure the accuracy of the test, the observer needs to have a high professional level of competence (Cawthon, 2015). In addition, above-mentioned conventional methods require long preparation time which is unable to monitor the physiological response before and after hybridEMS training in real-time.
In order to overcome the above-mentioned difficulties by conventional muscle evaluation methods, the electrical signal of human muscles should be detected since the electrical signal is directly reflected by the physiological response of muscle activity (Coggshall and Bekey, 1970). An electrical measurement is a promising approach to achieving real-time measurement to evaluate the physiological-induced conductive response of human muscle in pre-and post-hybridEMS training. Previously, several fundamental electrical phenomena were investigated by electrical impedance measurement to characterize the oxidative stress in single skeletal muscle cells (Ferguson et al., 2021), by electromyography to access the hamstrings of healthy young men (de Caldas Honorato et al., 2021), and by the bio-impedance analysis (BIA) to measure overall muscle mass in the trunk and limbs (Di Vincenzo et al., 2021). However, conventional electrical impedance measurements are not able to provide adequate visualization of physiological-induced conductive response in specific muscle compartments in pre-and post-hybridEMS training.
Electrical impedance tomography (EIT) first appeared in the 1980s as a safe, non-invasive, low-cost and real-time detection method that has matured into industrial applications and medical detections. Recently, the EIT is upgraded to frequency-difference EIT (fdEIT), which is performed to detect the physiological response areas of human calf muscles under single-segment EMS in pre-training, post-training, and relaxation (Sun et al., 2021a). fdEIT was performed to explore the differential tendency of physiological-induced conductive response in calf muscle compartments during voltage intensity change of EMS (vic-EMS) (Sun et al., 2021b). Since the hybridEMS training are paid attention recently to enhancing the high-intensity exercise metabolic response in specific muscle compartments, we consider that tendency of physiological-induced conductive response changes over time after perform hybridEMS, which indicates the effectiveness of hybridEMS duration in specific muscle compartments.
Therefore, this study provides three objectives which are 1) to propose electrical impedance tomography (EIT) as a novel method to visualize the specific muscle compartments for hybridEMS training, 2) to clarify the tendency of physiological-induced conductive response in the specific muscle compartments of human upper arm over time under three training modalities, and 3) to quantitatively evaluate the physiological-induced conductive response by three training modalities with conductance value G and extracellular water ratio β by bio-impedance analysis method.
2 Experiments and evaluation
2.1 Summary of hybridEMS training
Figure 1A shows the conducted measurements and training procedures. In the training procedure, three training modalities were performed in this study, namely voluntary resistance training (VRT), electrical muscle stimulation (EMS), and hybrid of VRT and EMS (hybridEMS). In the VRT procedure, subjects were required to perform bicep curls using 6 kg dumbbell for 3 sets of 12 reps over 5 min under professional guidance. There is a 1-min break between each set. In the EMS procedure, subjects were required to perform continuous EMS stimulation of the biceps on right upper arm for 5 min. The commercial EMS equipment (SIXPAD Arm belt, Nagoya MTG Ltd., Japan) was employed in this study, which used a constant-controlled current (8 mA) but uses a different voltage value to adapt the training intensity. The stimulation cycle rule was 4 s stimulation with 4 s pause and a stimulation frequency of 20 Hz. After testing the EMS tolerance limit of each experimental subject, level 8 of EMS training intensity was selected from twenty training levels of EMS. Level 8 means that the EMS output has an average voltage of 22.99 V. In the hybridEMS procedure, subjects were required to perform continuous EMS stimulation of the biceps on right upper arm with a training intensity of level 8 continuous stimulation for 5 min. Simultaneously, three sets of VRT procedure were performed on the subjects under professional guidance within 5 min, with a training intensity of 12 reps per set by using a 6 kg dumbbell.
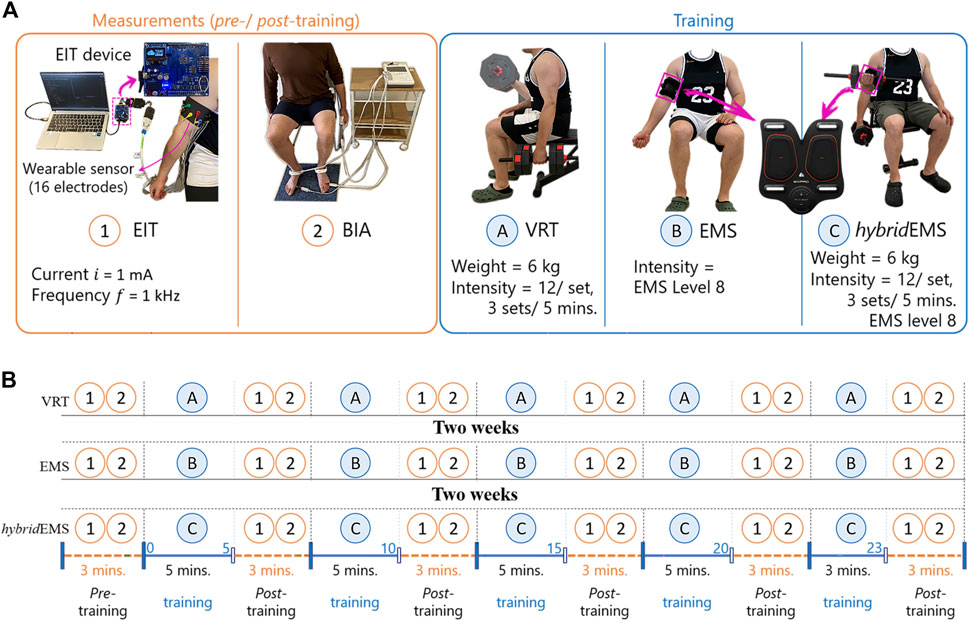
FIGURE 1. The experimental procedures. (A) the conducted measurements and training procedures and (B) experimental protocol.
2.2 Experimental method
In this study, eight healthy young men (age: 30 ± 7 years, height: 173 ± 10 cm, skeletal muscle mass: 34.8 ± 9.6 kg) volunteered for this study. All voluntary subjects gave informed consent. None of the subjects had any history of any musculoskeletal or neurological disorders. Figure 1B shows the experimental protocol consisting of three parts: pre-training, training, and post-training. In all experimental protocols, subjects were required a sitting position.
In the pre-training and post-training parts, firstly, EIT is conducted to reconstruct the conductivity distribution images σpre in the right upper arm. Figure 1A shows the EIT muscle imaging system, which consists of four units: a portable EIT device (size: 85 mm × 70 mm; weight: 156 g), a wearable sensor consisting of 16 copper yarn electrodes, and a personal computer containing software for image reconstruction algorithms. In order to control the impedance measurement in each electrode, our portable EIT device has a sixteen-channel robust multiplexer (Sejati et al., 2022). The EIT electrodes were connected to the EIT device by a coaxial wire with a snap connector. Figure 2A shows the electrode location for electrical impedance tomography (EIT). In order to maintain the stability of the measurement results, ten consecutive measurements are taken in each measurement. The average boundary voltage V of the ten measurements were obtained which is used to reconstruct the conductivity distribution images σ. Secondly, BIA (InbodyS10, InBodyCo., Ltd., Korea) is able to measure the impedance value Z, the reactance value Xc, and the phase angle value φ, therefore, the conductance value G is obtained by:
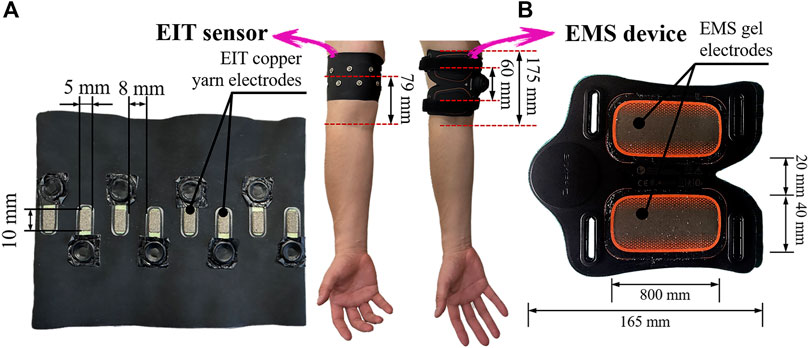
FIGURE 2. Electrode locations for (A) electrical impedance tomography (EIT) and (B) electrical muscle stimulation (EMS).
Also, the BIA method is conducted to measure the extracellular water ratio β = ECW/TBW, where ECW is extracellular water, TBW is total body water. Therefore, conductance value G and extracellular water ratio β are compared with the conductivity distribution changes measured from EIT method.
In the training part, in order to explore the tendency of physiological-induced conductive response changes by three training modalities. The same subjects were requested to visit the laboratory four times, 2 weeks between each visit. The first visit was to test and decide on the training load to be used for the experiment. The experiment decided to use a 6 kg dumbbell as the training load for resistance training and an output voltage of 22.99 V as the training load for EMS training, after testing the training tolerance limits of each subject. From the second visit, subjects were requested to perform three different training modalities, VRT, EMS, and hybridEMS, as shown in Figure 2A. Since the EMS equipment system used in this experiment is set for a complete training session of 23 min, the training part of this study had a total training duration of 23 min, the training part in this study was divided into 5 periods which were 5, 10, 15, 20, and 23 min respectively.
2.3 Analysis and evaluation method of responsive muscle compartments
The image reconstruction algorithm to reconstruct σ from boundary voltage V use Gaussian-Newton method (Darma and Takei, 2021) expressed by
where J is the Jacobian matrix, JT is the transpose of Jacobian matrix. μ is the hyperparameter, the best μ was chosen which error lied in the elbow of L-Curve (Braun et al., 2017).
where, two frequencies are heuristically selected as f1 = 500 Hz and f2 = 1 kHz to obtain the best σ (Sun et al., 2021b).
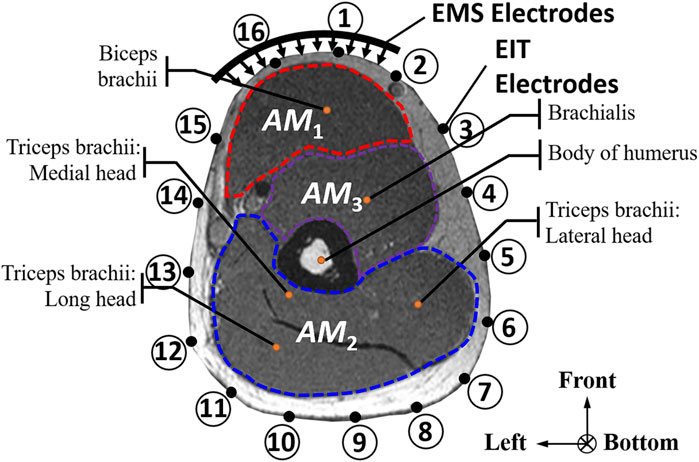
The conductivity distribution images σ show the upper arm muscle compartments of physiological-induced conductive response by three training modalities in post-training part, which are denoted as AM1, AM2 and AM3 compartments. Figure 3 shows the structure of responsive compartments. AM1 compartment composed of biceps brachii muscle, AM2 compartment composed of triceps brachii muscle, and AM3 compartment composed of brachialis muscle. According to our previous studies, conductivity images are sensitive to changes in muscle extracellular water (Sun et al., 2021a). In order to evaluate the effectiveness of three training modalities on muscle, the extracellular water ratio β was used to compare with the spatial-mean conductivity of specific muscle compartments.
2.4 Statistics
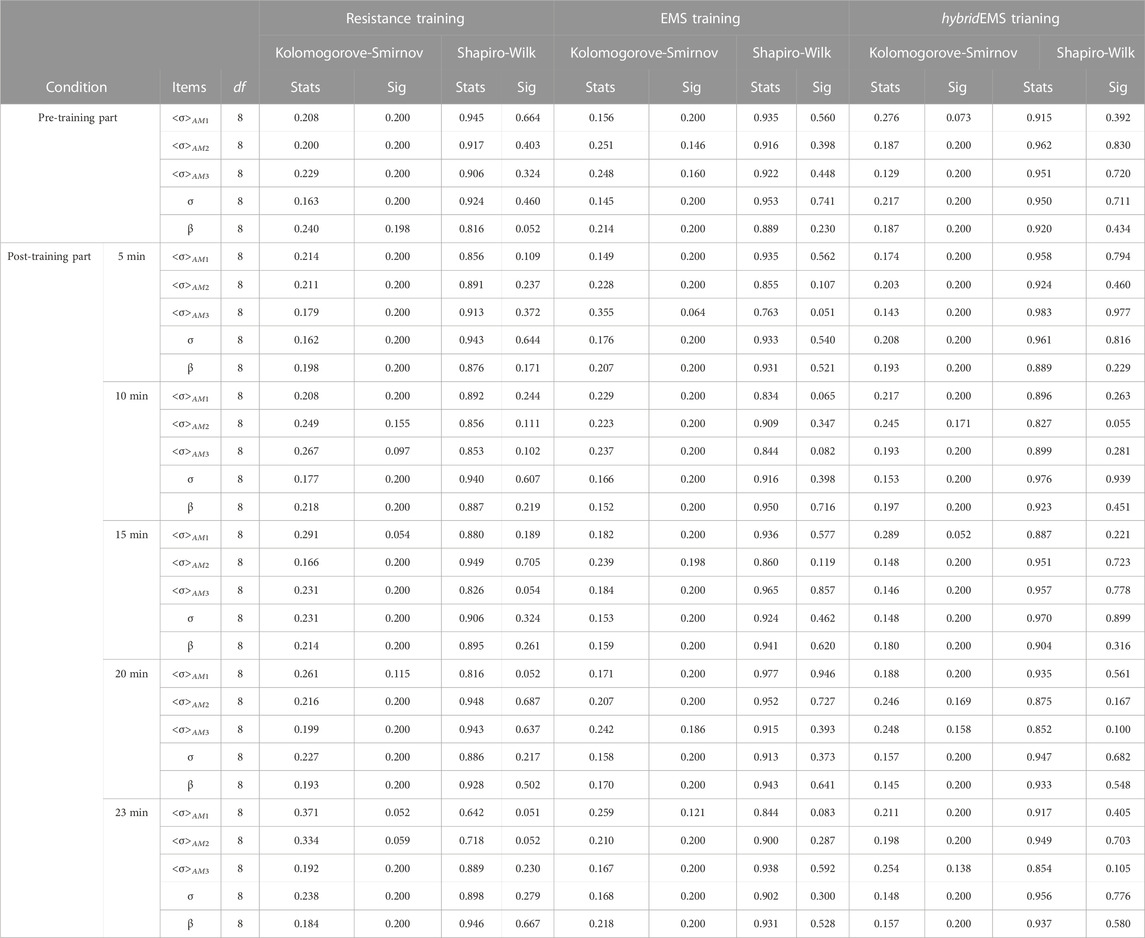
In order to clarify the tendency of physiological-induced conductive response in the specific muscle compartments of upper arm over time under three training modalities, a paired-samples t-test is performed in AM1, AM2 and AM3 compartments for the special-mean conductivity <σ>AM1, <σ>AM2 and <σ>AM3. A normality test is necessary prior to the analysis using paired-samples t-test. In this study, SPSS software (version 25.0) descriptive statistics function is used to examine the normal distribution of experimental data from EIT and BIA measurements. Table 1 shows the results of normality test. The null hypothesis is not rejected at the test level of α = 0.05, p > 0.05. Therefore, the experimental data from EIT and BIA measurements are considered to obey a normal distribution. The level of significance for paired-samples t-test was set at 0.05.
3 Experimental results
3.1 Reconstructed images
Table 2 shows the conductivity distribution images σ of eight subjects’ right upper arm in AM1, AM2, and AM3 under three training modalities obtained by Eq. 3. From the images σ, the conductivity distribution between pre-training and post-training under three training modalities, namely voluntary resistance training (VRT), electrical muscle stimulation (EMS), and hybrid of VRT and EMS (hybridEMS), are clearly detected, which shows the tendency of physiological-induced conductive response are increased in all three training modalities with increasing training time. According to σ, the physiological-induced conductive response of AM1 compartment is significantly affected by all three training modalities. In contrast, the physiological-induced conductive response of AM3 compartment is moderately affected. And the physiological-induced conductive response of AM2 compartment is minimally affected by training.

TABLE 2. Conductivity distribution images σ in pre-training and post-training parts reconstructed by EIT under three training modalities.
From the images σ5mins, the conductivity distribution of the AM1 compartment is significantly changed between pre- and post-hybridEMS training compared to VRT and EMS, which indicates a faster effect of hybridEMS on the upper arm muscles compared to the other two training modalities. Furthermore, the images σ23mins show that hybridEMS is more effective in stimulating deeper muscle compartment (AM3) than VRT and EMS. The hybridEMS has the greatest effect on physiological-induced conductive response for the same training time.
3.2 Paried-samples t-test results
In order to quantitatively evaluate the physiological-induced conductive response of specific muscle compartments in right upper arm under three training modalities, the spatial-mean conductivity <σ>AM1,AM2,AM3 were obtained by a dedicated Python script which analysed the conductivity distribution images σ. Figure 4 shows the paired-samples t-test results of spatial-mean conductivity <σ>AM1,AM2,AM3 between pre-training and post-training parts under VRT, EMS, and hybridEMS.
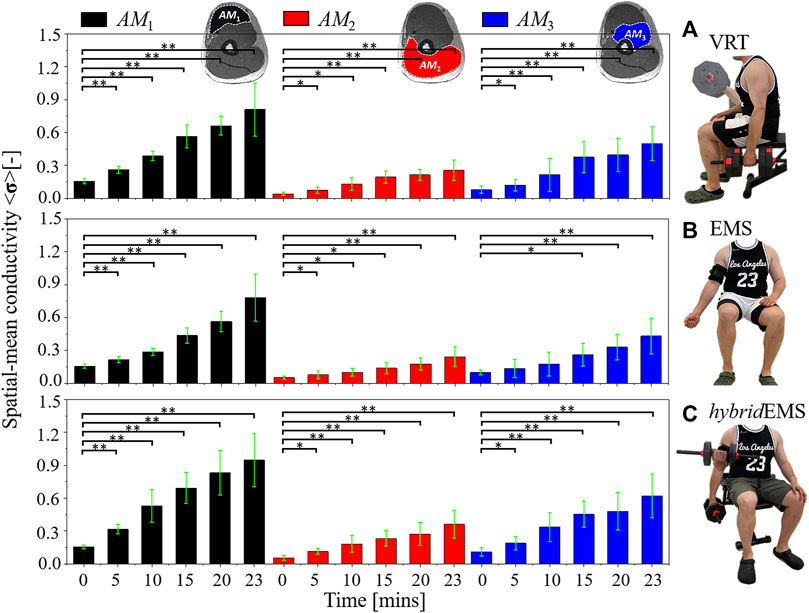
FIGURE 4. The paired-samples t-test results of spatial-mean conductivity <σ>AM1,AM2,AM3 between pre-training and post-training parts under (A) voluntary resistance training (VRT), (B) electrical muscle stimulation (EMS), and (C) hybrid of resistance training and EMS (hybridEMS). *p < 0.05, **p < 0.01.
Under VRT, the spatial-mean conductivity increased from <σpre > AM1 = 0.154 to <σ5mins > AM1 = 0.262, <σ10mins > AM1 = 0.386, <σ15mins > AM1 = 0.565, <σ20mins > AM1 = 0.662, <σ23mins > AM1 = 0.810 in AM1 muscle compartment (n = 8, p < 0.001); the spatial-mean conductivity increased from <σpre > AM2 = 0.040 to <σ5mins > AM2 = 0.072, <σ10mins > AM2 = 0.128, <σ15mins > AM2 = 0.193, <σ20mins > AM2 = 0.213, <σ23mins > AM2 = 0.254 in AM2 muscle compartment (n = 8, p < 0.05); the spatial-mean conductivity increased from <σpre > AM3 = 0.078 to <σ5mins > AM3 = 0.119, <σ10mins > AM3 = 0.213, <σ15mins > AM3 = 0.374, <σ20mins > AM3 = 0.394, <σ23mins > AM3 = 0.497 in AM3 muscle compartment (n = 8, p < 0.05).
Under EMS, the spatial-mean conductivity increased from <σpre > AM1 = 0.155 to <σ5mins > AM1 = 0.214, <σ10mins > AM1 = 0.285, <σ15mins > AM1 = 0.436, <σ20mins > AM1 = 0.563, <σ23mins > AM1 = 0.782 in AM1 muscle compartment (n = 8, p < 0.001); the spatial-mean conductivity increased from <σpre > AM2 = 0.052 to <σ5mins > AM2 = 0.076, <σ10mins > AM2 = 0.100, <σ15mins > AM2 = 0.137, <σ20mins > AM2 = 0.177, <σ23mins > AM2 = 0.242 in AM2 muscle compartment (n = 8, p < 0.05); the spatial-mean conductivity increased from <σpre > AM3 = 0.096 to <σ5mins > AM3 = 0.133 (n = 8, p > 0.05), <σ10mins > AM3 = 0.176 (n = 8, p > 0.05), <σ15mins > AM3 = 0.261 (n = 8, p < 0.05), <σ20mins > AM3 = 0.329 (n = 8, p < 0.001), <σ23mins > AM3 = 0.431 (n = 8, p < 0.001) in AM3 muscle compartment.
Under hybridEMS, the spatial-mean conductivity increased from <σpre > AM1 = 0.153 to <σ5mins > AM1 = 0.316, <σ10mins > AM1 = 0.529, <σ15mins > AM1 = 0.691, <σ20mins > AM1 = 0.830, <σ23mins > AM1 = 0.947 in AM1 muscle compartment (n = 8, p < 0.001); the spatial-mean conductivity increased from <σpre > AM2 = 0.053 to <σ5mins > AM2 = 0.112, <σ10mins > AM2 = 0.181, <σ15mins > AM2 = 0.231, <σ20mins > AM2 = 0.273, <σ23mins > AM2 = 0.359 in AM2 muscle compartment (n = 8, p < 0.05); the spatial-mean conductivity increased from <σpre > AM3 = 0.109 to <σ5mins > AM3 = 0.188, <σ10mins > AM3 = 0.335, <σ15mins > AM3 = 0.452, <σ20mins > AM3 = 0.478, <σ23mins > AM3 = 0.621 in AM3 muscle compartment (n = 8, p < 0.05). Therefore, the quantitative results also highlight that hybridEMS has the greatest effect on physiological-induced conductive response for the same training time. In addition, EMS has a slower effect on deep muscle compartment (AM3) compared to VRT and hybridEMS, with a significant difference between <σpre > AM3 and <σ15mins > AM3 after 15 min of training.
Figure 5A shows the paired-samples t-test results of conductance value G between pre-training and post-training parts under VRT, EMS, and hybridEMS. Under VRT, the conductance value increased from Gpre = 3.09 mS to G5mins = 3.19 mS, G10mins = 3.27 mS, G15mins = 3.33 mS, G20mins = 3.39 mS, G23mins = 3.41 mS (n = 8, p < 0.05). Under EMS, the conductance value increased from Gpre = 3.04 mS to G5mins = 3.06 mS, G10mins = 3.09 mS, G15mins = 3.10 mS, G20mins = 3.11 mS, G23mins = 3.12 mS (n = 8, p < 0.05). Under hybridEMS, the conductance value increased from Gpre = 3.11 mS to G5mins = 3.23 mS, G10mins = 3.32 mS, G15mins = 3.39 mS, G20mins = 3.42 mS, G23mins = 3.45 mS (n = 8, p < 0.001).
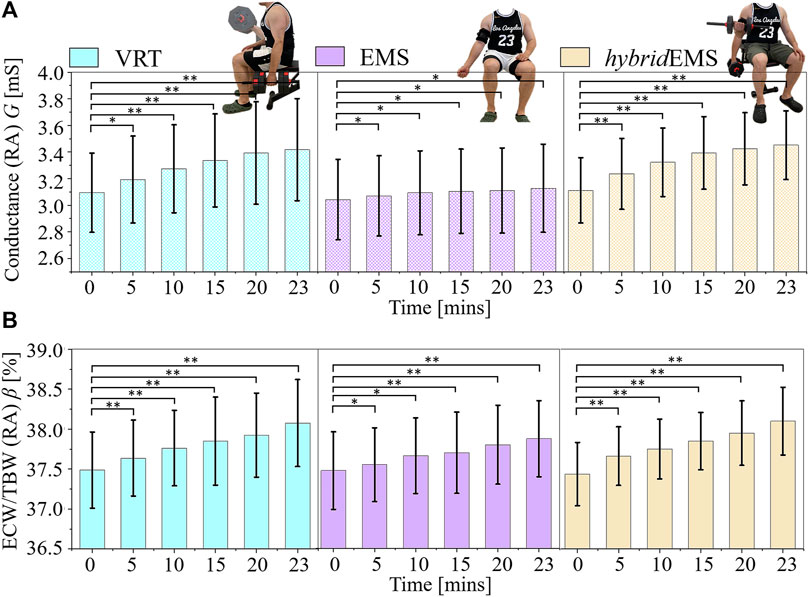
FIGURE 5. The paired-samples t-test results of (A) conductance value G and (B) extracellular water ratio β between pre-training and post-training parts under voluntary resistance training (VRT), electrical muscle stimulation (EMS), and hybrid of VRT and EMS (hybridEMS). *p < 0.05, **p < 0.01.
Figure 5B shows the paired-samples t-test results of extracellular water ratio β between pre-training and post-training parts under VRT, EMS, and hybridEMS. Under VRT, the conductance value increased from βpre = 37.48% to β5mins = 37.63%, β10mins = 37.76%, β15mins = 37.85%, β20mins = 37.92%, β23mins = 38.07% (n = 8, p < 0.001). Under EMS, the conductance value increased from βpre = 37.47% to β5mins = 37.55%, β10mins = 37.66%, β15mins = 37.70%, β20mins = 37.80%, β23mins = 37.87% (n = 8, p < 0.05). Under hybridEMS, the conductance value increased from βpre = 37.43% to β5mins = 37.66%, β10mins = 37.75%, β15mins = 37.85%, β20mins = 37.95%, β23mins = 38.10% (n = 8, p < 0.001). Therefore, the tendency of <σ>AM1,AM2,AM3 is the same as the tendency of G and β under VRT, EMS and hybridEMS.
4 Discussion
4.1 Physiological-induced conductive response in specific muscle compartments
Physiological-induced conductive response in specific muscle compartments of right upper arm under three training modalities are discussed from the viewpoint of sports anatomy. Firstly, two muscle compartments are located below the electrodes of electrical muscle stimulation (EMS), which are called AM1 compartment composed of biceps brachii muscle and AM3 compartment composed of brachialis muscle. From a previous study, the biceps brachii muscle and brachialis muscle are recognized to be mainly involved in the type II (fast-twitch) muscle fibres (Klein et al., 2003), which are recruited more quickly under voluntary resistance training (VRT), electrical muscle stimulation (EMS), and hybrid of VRT and EMS (hybridEMS). However, the brachialis muscle located behind the biceps brachii muscle (farther from the EMS electrodes) is not able to elicit a physiological-inducted conductive response by EMS in a short time. According to a recent study, EMS provides undifferentiated stimulation of only the most superficial muscle fibres under the electrodes (Gregory and Bickel, 2005). Therefore, the spatial-mean conductivity has a significant difference between <σpre > AM3 and <σ15mins > AM3 after 15 min of training under EMS, as shown in Figure 4B.
Secondly, the biceps curl movement consists of two processes, namely the centripetal contraction and the centrifugal contraction (Kenney et al., 2021). Figure 6A shows the centripetal contraction of the biceps is defined as the movement of the elbow joint from extension to flexion, in which the target muscle outputs a force larger than the loading weight. Figure 6B shows the centrifugal contraction of the biceps is defined as the movement of the elbow joint from flexion to extension, in which the target muscle outputs a force less than the loading weight. Moreover, since the biceps and triceps are mutually antagonistic muscles (Gilhodes et al., 1986), the centrifugal process of the biceps is the centripetal process of the triceps. However, due to the fact that the triceps are not trained against the weight during the biceps curl. AM2 compartment, which is recognized as the position of the triceps brachii muscle, has a less physiological-induced conductive response compared to AM1 and AM3 compartments under VRT. Similarly, EMS is applied above the biceps, the EMS stimulation current does not induce contraction of the triceps. The physiological-induced conductive response of AM3 compartment after 15 min resulted from the triceps working in concert with the biceps to complete the arm bending movement without loading weight, therefore, the spatial-mean conductivity <σ>AM3 under EMS is less than VRT at the same training time.
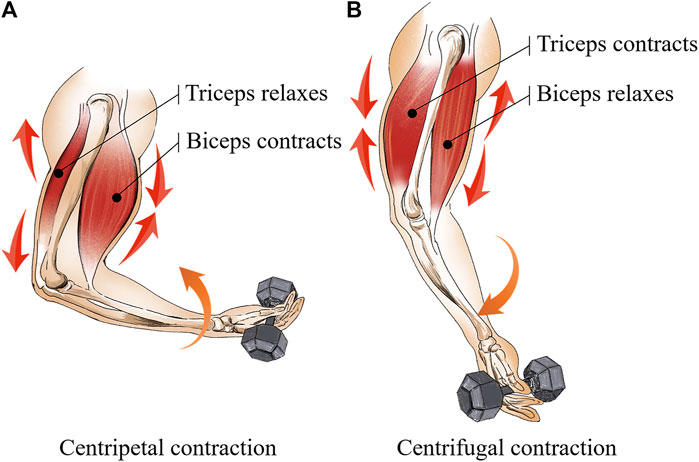
FIGURE 6. Two processes are included in biceps curl movement (A) the centripetal contraction and (B) the centrifugal contraction.
Thirdly, synthesizing the above-mentioned reasons from a sports anatomy viewpoint, the physiological-induced conductive response of hybridEMS compared to VRT and EMS for specific muscle compartments is discussed. Due to the ability of EMS to activate muscle fibres that would not normally be used in the daily activities (Gregory and Bickel, 2005). Thus, the spatial-mean conductivity <σ>AM1,AM3 are significantly larger under hybridEMS compared to VRT and EMS at the same training time. In addition, under hybridEMS, the biceps muscle is loaded by EMS during centrifugal contraction, which requires the triceps muscle to work against the additional load generated by EMS. Therefore, the spatial-mean conductivity <σ>AM2 is significantly larger under hybridEMS compared to VRT and EMS.
4.2 Individual differences on physiological-induced conductive response
Figures 7, 8 show the relationship between spatial-mean conductivity <σ>AM1,AM2,AM3 and training time in AM1, AM2, and AM3 compartments under VRT, EMS, and hybridEMS of eight subjects’ right upper arm. Individual differences on physiological-induced conductive response of the upper arm muscles are significant between the three training modalities. Across all subjects, the tendency of spatial-mean conductivity <σ>AM1 in AM1 compartment shows a maximum increasing slope under hybridEMS over the time, which implies an efficient elicitation of physiological-induced response by hybridEMS compared to VRT and EMS for all subjects. Subjects are categorised into two groups, namely people who are able to perform standard VRT (stdVRT) group and people who are not able to perform standard VRT (unVRT) group. In stdVRT group, the spatial-mean conductivity <σ23mins > AM1,AM2,AM3 under three training modalities showed a minor difference in values, as shown in Figure 7. In contrast, the spatial-mean conductivity <σ23mins > AM1,AM2,AM3 under three training modalities showed a significant difference in values, as shown in Figure 8. Therefore, in order to achieve the same physiological-induced conductive response, hybridEMS takes much shorter time compared to VRT and EMS. hybridEMS is recommended for people who are unable to perform standard voluntary resistance training, because hybridEMS has a better training effectiveness over the same training time.
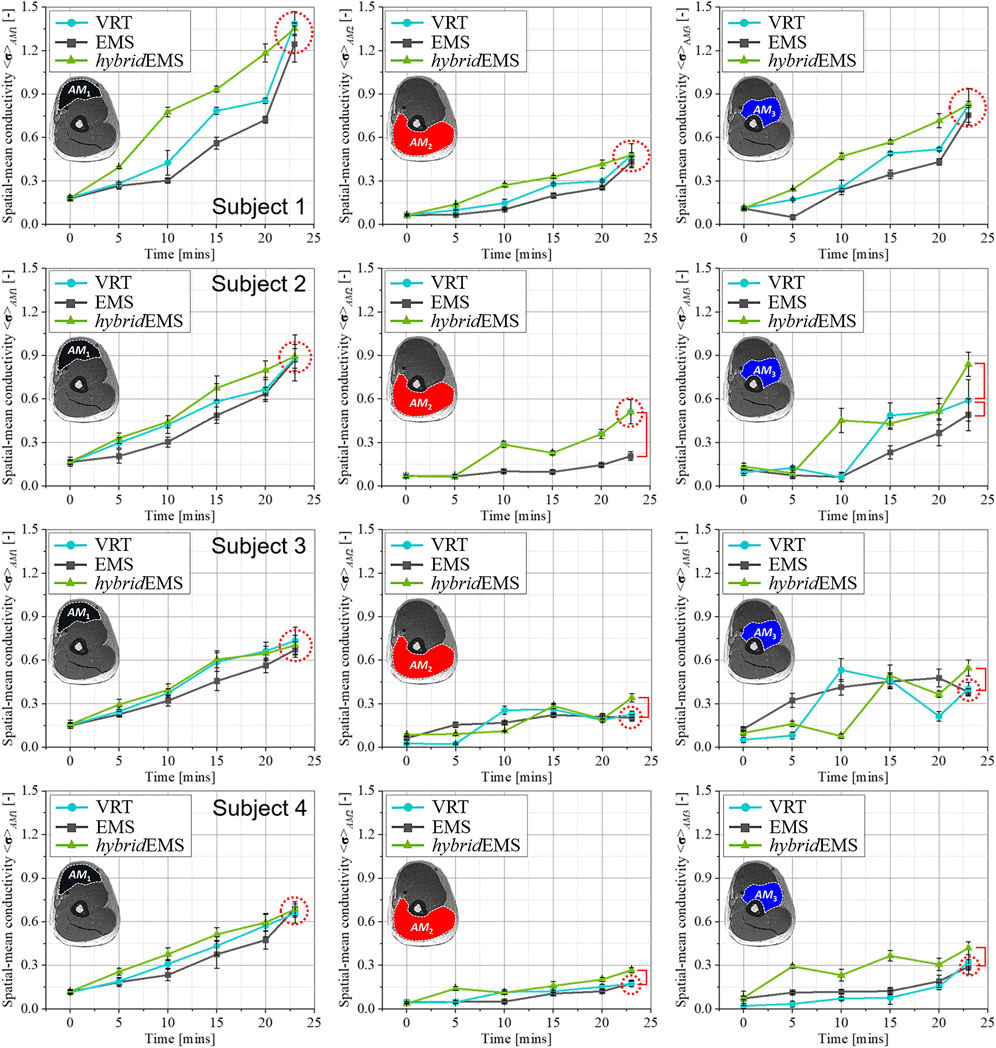
FIGURE 7. The relationship between spatial-mean conductivity <σ>AM1,AM2,AM3 and training time in AM1, AM2, and AM3 compartments under VRT, EMS, and hybrid EMS of upper arm in stdVRT group.
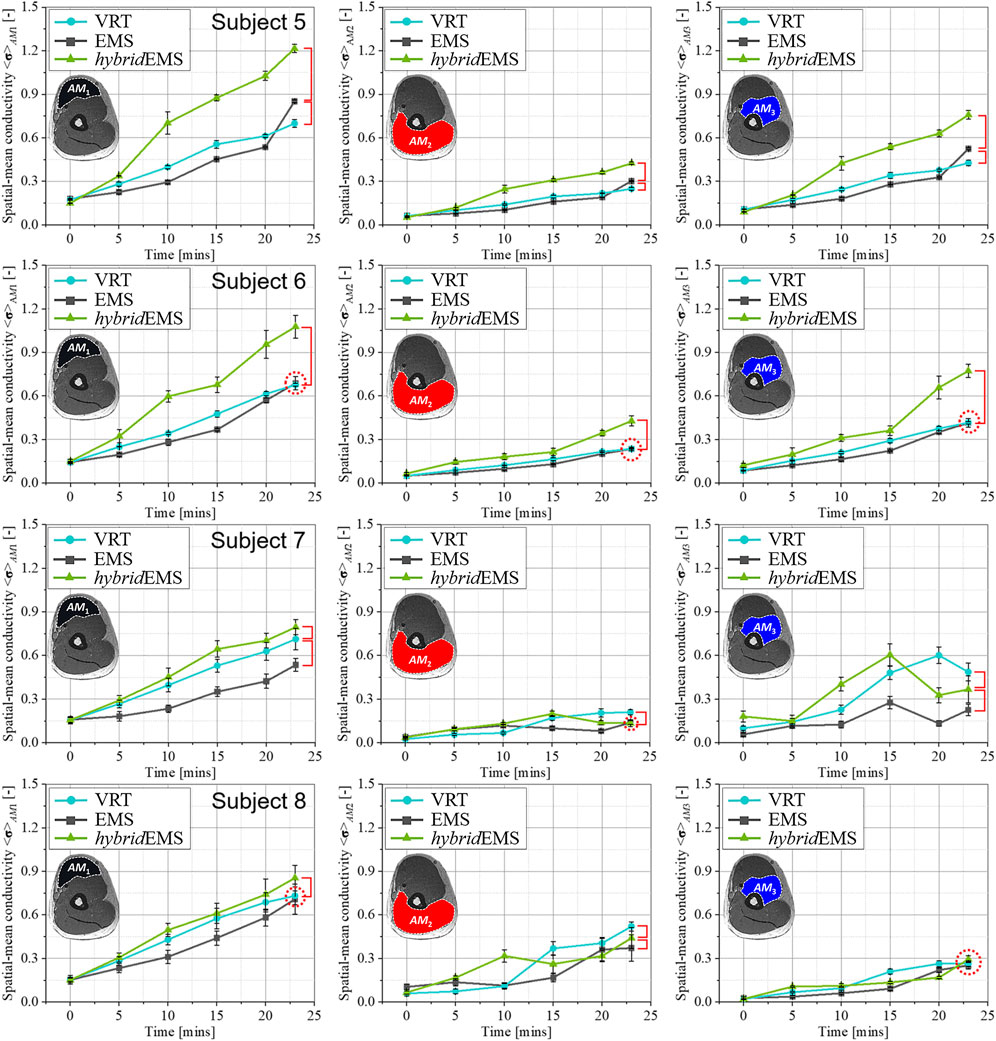
FIGURE 8. The relationship between spatial-mean conductivity <σ>AM1,AM2,AM3 and training time in AM1, AM2, and AM3 compartments under VRT, EMS, and hybrid EMS of upper arm in unVRT group.
5 Conclusion
The present study reveals that the physiological-induced conductive response of specific muscle compartments in human upper arm under three training modalities have been detected by electrical impedance tomography (EIT). The key findings of this study are as follows.
1) Based on the reconstructed images, the conductivity distribution between pre-training and post-trarining parts under three training modalities are clearly detected by EIT, which shows the tendency of physiological-induced conductive response are increased in all three training modalities with increasing training time.
2) In the post-training part, the spatial-mean conductivity <σ>AM1,AM2,AM3 increases as the conductance value G and extracellular water ratio β of right arm by bio-impedance analysis (BIA) method increase.
3) The paired samples t-test results of this investigation demonstrate that hybridEMS has the greatest effect on physiological induced conductive response for the same training time. EMS has a slower effect on deep muscle compartment, AM3 is recognized as brachialis muscle, compared to VRT and hybridEMS, with a significant difference between <σpre > AM3 and <σ15mins > AM3 after 15 min of training.
Data availability statement
The raw data supporting the conclusion of this article will be made available by the authors, without undue reservation.
Ethics statement
The studies involving human participants were reviewed and approved by The Committee for Human Experimentation of Chiba University. The number of ethical approvals for our experiments by the committee of human experimentation of Chiba University is 29-13. The patients/participants provided their written informed consent to participate in this study. Written informed consent was obtained from the individual(s) for the publication of any potentially identifiable images or data included in this article.
Author contributions
BS and PS conceived and planned the study as well as the various experiments. BS carried out the experimental studies with contributions from PD. TS and KN were responsible for project management. All authors performed the analysis, interpretation, discussion of the experimental results, and approved the final submitted paper. BS wrote the manuscript with contributions from MT. All authors contributed to the article and approved the submitted version.
Acknowledgments
The authors would like to thank Mr. Yunlong Cui of Chiba University for assistance with the experiments.
Conflict of interest
Authors TS and KN were employed by MTG Co., Ltd.
The remaining authors declare that the research was conducted in the absence of any commercial or financial relationships that could be construed as a potential conflict of interest.
Publisher’s note
All claims expressed in this article are solely those of the authors and do not necessarily represent those of their affiliated organizations, or those of the publisher, the editors and the reviewers. Any product that may be evaluated in this article, or claim that may be made by its manufacturer, is not guaranteed or endorsed by the publisher.
References
Andreoli, A., Scalzo, G., Masala, S., Tarantino, U., and Guglielmi, G. (2009). Body composition assessment by dual-energy X-ray absorptiometry (DXA). Radiol. Med. 114, 286–300. doi:10.1007/s11547-009-0369-7
Ansved, T. (2001). Muscle training in muscular dystrophies. Acta Physiol. Scand. 171, 359–366. doi:10.1046/j.1365-201x.2001.00839.x
Baidillah, M. R., Iman, A.-A. S., Sun, Y., and Takei, M. (2017). Electrical impedance spectro-tomography based on dielectric relaxation model. IEEE Sens. J. 17, 8251–8262. doi:10.1109/jsen.2017.2710146
Bennell, K., Dobson, F., and Hinman, R. (2011). Measures of physical performance assessments: Self-Paced walk test (SPWT), stair climb test (SCT), Six-Minute walk test (6MWT), chair stand test (CST), timed up and go (TUG), sock test, lift and carry test (LCT), and car task. Arthritis Care Res. Hob. 63, S350–S370. doi:10.1002/acr.20538
Braun, F., Proenca, M., Sola, J., Thiran, J. P., and Adler, A. (2017). A versatile noise performance metric for electrical impedance tomography algorithms. IEEE Trans. Biomed. Eng. 64, 2321–2330. doi:10.1109/TBME.2017.2659540
Cawthon, P. M. (2015). Assessment of lean mass and physical performance in sarcopenia. J. Clin. Densitom. 18, 467–471. doi:10.1016/j.jocd.2015.05.063
Cheng, R., Maloney, A., Moran, J., Newman, T. H., and Gardner, E. C. (2022). Resistance training as treatment for sarcopenia: Examining sex-related differences in Physiology and response. Clin. Ther. 44, 33–40. doi:10.1016/j.clinthera.2021.11.012
Coggshall, J. C., and Bekey, G. A. (1970). EMG-force dynamics in human skeletal muscle. Med. Biol. Eng. 8, 265–270. doi:10.1007/BF02477243
Dahlqvist, J. R., Widholm, P., Leinhard, O. D., and Vissing, J. (2020). MRI in neuromuscular diseases: An emerging diagnostic tool and biomarker for prognosis and efficacy. Ann. Neurol. 88, 669–681. doi:10.1002/ana.25804
Darma, P. N., and Takei, M. (2021). High-speed and accurate meat composition imaging by mechanically-flexible electrical impedance tomography with k-nearest neighbor and fuzzy k-means machine learning approaches. IEEE Access 9, 38792–38801. doi:10.1109/ACCESS.2021.3064315
de Caldas Honorato, R., Ferraz, A. S. M., Kassiano, W., Carvalho, D. P., and Ceccatto, V. M. (2021). Test-retest reliability of electrical impedance myography in hamstrings of healthy young men. J. Electromyogr. Kinesiol. 56, 102511. doi:10.1016/j.jelekin.2020.102511
Deley, G., Cometti, C., Fatnassi, A., Paizis, C., and Babault, N. (2011). Effects of combined electromyostimulation and gymnastics training in prepubertal girls. J. Strength Cond. Res. 25, 520–526. doi:10.1519/JSC.0b013e3181bac451
Di Vincenzo, O., Marra, M., Di Gregorio, A., Pasanisi, F., and Scalfi, L. (2021). Bioelectrical impedance analysis (BIA) -derived phase angle in sarcopenia: A systematic review. Clin. Nutr. 40, 3052–3061. doi:10.1016/j.clnu.2020.10.048
Erlandson, M. C., Lorbergs, A. L., Mathur, S., and Cheung, A. M. (2016). Muscle analysis using pQCT, DXA and MRI. Eur. J. Radiol. 85, 1505–1511. doi:10.1016/j.ejrad.2016.03.001
Ferguson, C., Pini, N., Du, X., Farina, M., Hwang, J. M. C., Pietrangelo, T., et al. (2021). Broadband electrical impedance as a novel characterization of oxidative stress in single L6 skeletal muscle cells. Anal. Chim. Acta 1173, 338678. doi:10.1016/j.aca.2021.338678
Fisher, J., Steele, J., Wolf, M., Korakakis, P. A., Smith, D., and Giessing, J. (2022). The role of supervision in resistance training; an exploratory systematic review and meta-analysis. Int. J. Strength Cond. 2, 101. doi:10.47206/ijsc.v2i1.101
Fleckenstein, J. L., Canby, R. C., Parkey, R. W., and Peshock, R. M. (1988). Acute effects of exercise on MR imaging of skeletal muscle in normal volunteers. Am. J. Roentgenol. 151, 231–237. doi:10.2214/ajr.151.2.231
Gilhodes, J. C., Roll, J. P., and Tardy-Gervet, M. F. (1986). Perceptual and motor effects of agonist-antagonist muscle vibration in man. Exp. brain Res. 61, 395–402. doi:10.1007/BF00239528
Gregory, C. M., and Bickel, C. S. (2005). Recruitment patterns in human skeletal muscle during electrical stimulation. Phys. Ther. 85, 358–364. doi:10.1093/ptj/85.4.358
Herbert, R. D., Dean, C., and Gandevia, S. C. (1998). Effects of real and imagined training on voluntary muscle activation during maximal isometric contractions. Acta Physiol. Scand. 163, 361–368. doi:10.1046/j.1365-201X.1998.t01-1-00358.x
Karatzanos, E., Gerovasili, V., Zervakis, D., Tripodaki, E.-S., Apostolou, K., Vasileiadis, I., et al. (2012). Electrical muscle stimulation: An effective form of exercise and early mobilization to preserve muscle strength in critically ill patients. Crit. Care Res. Pract. 2012, 432752. doi:10.1155/2012/432752
Kenney, W. L., Wilmore, J. H., and Costill, D. L. (2021). Physiology of sport and exercise. United States: Human kinetics.
Klein, C. S., Marsh, G. D., Petrella, R. J., and Rice, C. L. (2003). Muscle fiber number in the biceps brachii muscle of young and old men. Muscle Nerve Off. J. Am. Assoc. Electrodiagn. Med. 28, 62–68. doi:10.1002/mus.10386
Lauretani, F., Russo, C. R., Bandinelli, S., Bartali, B., Cavazzini, C., Di Iorio, A., et al. (2003). Age-associated changes in skeletal muscles and their effect on mobility: An operational diagnosis of sarcopenia. J. Appl. Physiol. 95, 1851–1860. doi:10.1152/japplphysiol.00246.2003
Mercuri, E., Jungbluth, H., and Muntoni, F. (2005). Muscle imaging in clinical practice: Diagnostic value of muscle magnetic resonance imaging in inherited neuromuscular disorders. Curr. Opin. Neurol. 18, 526–537. doi:10.1097/01.wco.0000183947.01362.fe
Pareja-Blanco, F., Rodríguez-Rosell, D., Sánchez-Medina, L., Gorostiaga, E. M., and González-Badillo, J. J. (2014). Effect of movement velocity during resistance training on neuromuscular performance. Int. J. Sports Med. 35, 916–924. doi:10.1055/s-0033-1363985
Pennings, B., Koopman, R., Beelen, M., Senden, J. M. G., Saris, W. H. M., and Van Loon, L. J. C. (2011). Exercising before protein intake allows for greater use of dietary protein–derived amino acids for de novo muscle protein synthesis in both young and elderly men. Am. J. Clin. Nutr. 93, 322–331. doi:10.3945/ajcn.2010.29649
Rubbieri, G., Mossello, E., and Di Bari, M. (2014). Techniques for the diagnosis of sarcopenia. Clin. Cases Min. Bone Metab. 11, 181–184. doi:10.11138/CCMBM/2014.11.3.181
Sato, S., Yoshida, R., Murakoshi, F., Sasaki, Y., Yahata, K., Nosaka, K., et al. (2022). Effect of daily 3-s maximum voluntary isometric, concentric, or eccentric contraction on elbow flexor strength. Scand. J. Med. Sci. Sports 32, 833–843. doi:10.1111/sms.14138
Sejati, P. A., Baidillah, M. R., Prayitno, Y. A. K., Ibrahim, K. A., Kawashima, D., and Takei, M. (2022). Copper particle detection method by in-situ resistance background implemented in conductance-path recognition algorithm (iRB-CPR) among dominant aluminum particles. Meas. J. Int. Meas. Confed. 193, 110983. doi:10.1016/j.measurement.2022.110983
Sun, B., Baidillah, M. R., Darma, P. N., Shirai, T., Narita, K., and Takei, M. (2021a). Evaluation of the effectiveness of electrical muscle stimulation on human calf muscles via frequency difference electrical impedance tomography. Physiol. Meas. 42, 035008. doi:10.1088/1361-6579/abe9ff
Sun, B., Darma, P. N., Shirai, T., Narita, K., and Takei, M. (2021b). Electrical-tomographic imaging of physiological-induced conductive response in calf muscle compartments during voltage intensity change of electrical muscle stimulation (vic-EMS). Physiol. Meas. 42, 095007. doi:10.1088/1361-6579/ac2265
Keywords: electrical impedance tomography (EIT), electrical muscle stimulation (EMS), voluntary resistance training, hybridEMS, physiological-induced conductive response
Citation: Sun B, Darma PN, Sejati PA, Shirai T, Narita K and Takei M (2023) Physiological-induced conductive response evaluation in specific muscle compartments under hybrid of electrical muscle stimulation and voluntary resistance training by electrical impedance tomography. Front. Physiol. 14:1185958. doi: 10.3389/fphys.2023.1185958
Received: 15 March 2023; Accepted: 10 July 2023;
Published: 18 July 2023.
Edited by:
Brian R. MacIntosh, University of Calgary, CanadaReviewed by:
Tomasz Rymarczyk, University of Economics and Innovation, PolandArinobu Niijima, Nippon Telegraph and Telephone, Japan
Copyright © 2023 Sun, Darma, Sejati, Shirai, Narita and Takei. This is an open-access article distributed under the terms of the Creative Commons Attribution License (CC BY). The use, distribution or reproduction in other forums is permitted, provided the original author(s) and the copyright owner(s) are credited and that the original publication in this journal is cited, in accordance with accepted academic practice. No use, distribution or reproduction is permitted which does not comply with these terms.
*Correspondence: Prima Asmara Sejati, cHJpbWEuc2FtYXJhLnNAdWdtLmFjLmlk
 Bo Sun
 Panji Nursetia Darma1