Abstract
Background:
Information about reproductive physiology like the ovulatory cycle helps women to understand their pregnancy risk and appropriately plan their pregnancies, which can reduce unintended pregnancy and the true risk of conception. Thus, this study aimed to explore the spatial variation of correct knowledge of the ovulatory cycle (KOC) across regions of Ethiopia and identify associated factors.
Methods:
A cross-sectional study design was employed based on the 2016 Ethiopian demographic and health survey. A total of 15,683 weighted samples were included. Geographically weighted regression and ordinary least square analysis were conducted. Models were compared using AICc & adjusted R2. A P-value of less than 0.05 was used to declare statistically significant spatial predictors.
Results:
In our study, only 23.58% [95% CI; 22.92–24.25%] of reproductive-age women had correct KOC. Significant hot spots were identified in Addis Ababa, Dire Dawa, and Hareri. Different factors showed a spatially significant effect on correct KOC. Media exposure showed positive effects ranging from 0.34 to 0.57 in the Somali, Amhara, Oromia, Addis Ababa, and SNNPR regions. Rich wealth status showed a positive spatial effect ranging from 0.13 to 0.54 in Benishangul Gumuz, most of Gambela, western Oromia, western Amhara, and Northwestern SNNPR. Proximity to health facilities had a positive effect ranging from 0.15 to 0.227 in Dire Dawa, Harari, eastern Oromia, and eastern and southeastern Somali. In most of the Amhara, Afar, Gambela, western and central Oromia, Benishangul, and Somali regions, education had a significant positive effect range of 0.23–0.36. In Dire Dawa, Harari, Somali, the majority of Oromia, and SNNPR regions, high community-level FP messages had a positive effect with a range of 0.28–0.39.
Conclusion:
In this study, the correct KOC among reproductive-aged women was found to be low. Significant spatial variation of the correct KOC among reproductive-age women was observed. Given the importance of formal education, rich household wealth status, media exposure, high community-level FP media exposure, and proximity to a health institution, area-based interventions that can take into account these important factors are needed to promote appropriate KOC.
Introduction
Ovulation is a normal physiological process and phase of a woman's menstrual cycle among reproductive-aged women that occurs when an egg is developed and ready to be fertilized (1–3). The ovulation phase takes place on day 14 of the menstrual cycle due to the effect of estrogen on the production of luteinizing hormone (LH) by the pituitary gland, and having knowledge regarding the ovulation cycle is important to avoid unintended pregnancy or if they want to get pregnant (3, 4). Thus, accurate information about ovulation and other reproductive physiology, like the anatomy of the female body and the menstrual cycle, can reduce unintended pregnancy rates and the true risk of conception, which helps women understand their pregnancy risk and appropriately plan their pregnancies (1, 5).
Studies on women's reproductive health haven't focused much on knowledge of the ovulatory cycle (KOC) (2). Rather than focusing on the fertility window, many health educators instead emphasize the menstrual cycle and determining the menstrual phase (4). However, studies showed that knowledge regarding ovulation, fertility, and conception is limited among reproductive-age women. In the United States of America, 67.2% and 47.2% of reproductive-aged women did not know the ovulation timing or what ovulation is, respectively (1). Another study also declared that about 40% of reproductive-age women were unfamiliar with the ovulatory cycle (6). Likewise, a study from sub-Saharan Africa showed only 8.3% of reproductive-age women had correct KOC (4). Similarly, studies from Haiti (2) and Australia (7) declared that only 24.1% and 12.7% of women correctly identified their ovulation window.
Several previous studies revealed that age (4, 8–11), residence (2, 4, 9, 12), educational status (2, 4, 8–13), wealth index (2, 4, 8, 10, 12), occupation (2, 13), religion (10, 12, 13), marital status (9, 13), contraceptive use (2, 8, 9), knowledge of contraceptive methods (8), media exposure (13), having menstruation within the last 6 months (8, 9), pregnancy status (9), exposure to mass media family planning messages (2, 10, 12), fieldworker visit (2), community media exposure (8, 11), community family planning message exposure (10) were associated with correct KOC.
Different studies have been conducted in Ethiopia (8–10), but to the best of our knowledge, there are no previous studies in the literature addressing the geographical disparity of the correct KOC and spatial covariates that contributed to the geographical difference across regions of Ethiopia. Exploring the geographical disparity of the correct KOC and associated spatial covariates in the regions of Ethiopia is crucial to designing context- and area-based (local) interventions. For investigating spatial heterogeneity (when the spatial process being modeled has a different structure throughout the study area), Geographically Weighted Regression (GWR) analysis is an effective method (14). In order to model the remaining geographical autocorrelation and over-dispersion in the disease data that cannot be explained by the covariates, GWR is a useful method (15). Thus, the current study aimed to explain the spatial variation of correct KOC (areas with low and high prevalence of correct KOC) across regions of Ethiopia and identify associated factors using geographical weighted regression analysis.
Method and materials
Data sources, setting, and sampling design
The 2016 Ethiopian Demographic and Health Survey (EDHS) dataset was used for this cross-sectional study. The data was accessed from (http://www.dhsprogram.com) up on online request.
The survey was carried out in Ethiopia's nine regional states and two city administrations. It typically draws samples using a stratified, two-stage cluster sampling technique. The sampling frame includes 84,915 enumeration areas (EAs) from the 2007 Ethiopian Population and Housing Census (PHC). Each EA covers an average of 181 households. Following stratification of each region into urban and rural areas, a total of 645 EAs (202 in urban areas and 443 in rural areas) were selected with a probability proportional to EA size based on the 2007 PHC. A fixed number of 28 households from each cluster were chosen with equal probability through systematic selection. More details on data collection, samples, and survey questionnaires can be found in the 2016 EDHS report (16).
Population
The source population consisted of all Ethiopian women between the ages of 15 and 49. The study population consisted of all women of reproductive age who spent the night before the survey and lived in the selected enumeration areas (EAs) and households. Our study was based on datasets from women (individual record files). The study included a weighted sample of 15,683 reproductive-age women. However, reproductive-aged women from clusters without coordinate data (“0” coordinate data) were excluded from spatial analysis.
Variables of the study
Outcome variable
The outcome variable was correct knowledge of the ovulation cycle (KOC) among reproductive women (“yes” or “no”). Women were asked, “When is the ovulation time?” Response options were designated as “during her period,” “after her period ended,” “middle of the cycle,” “before the period begins,” “at any time,” and “don't know”. The outcome variable was recoded, and respondents who indicated “middle of the cycle” were considered to have the correct KOC and coded as “1,” and otherwise respondents were considered to have the incorrect KOC and coded as “0” (9, 17).
Independent variables
A variety of literature reviews were conducted in order to select independent variables. The following individual-level characteristics were included: age, wealth index, education level, use of contraceptives, awareness of contraceptive techniques, having a period during the previous 6 months, exposure to family planning messages, and fieldworker visits. Additionally, community-level characteristics including community-level media exposure to local media and FP messages were incorporated.
Measurement and operational definitions
Household media exposure was created by combining whether women read a newspaper or magazine, listened to the radio, or watched television and coded as “yes” (if a woman has been exposed to at least one of these media) or “no” (if she has not).
Exposure to mass media family planning messages was created by combining four variables: “have heard about family planning messages on radio in the last few months”, “have heard about family planning messages on television in the last few months”, “have heard about family planning in a newspaper or magazine in the last few months”, “have heard about family planning by text messages on a mobile phone in the last few months”, and “has the fieldworker visited in the last 12 months and talked about family planning”. These five variables were combined and recoded as “yes” if a woman heard family planning messages through at least one of these mass media, and “no” if she did not hear family planning messages through any of the mass media (2).
Community-level media exposure: an aggregated variable from household media exposure measured as the proportion of women who had been exposed to at least one media (newspaper or magazine, radio, or television) and categorized based on the median value as low (communities with <50% of women exposed) and high (communities with ≥50% of women exposed).
Community-level FP message exposure: aggregated variable from exposure to mass media FP messages and measured as the proportion of women who had been exposed to FP messages at least through one mechanism: newspaper or magazine, radio, television, text messages on mobile phones, and fieldworker messages, and categorized based on the median value as low (communities with <50% of women exposed) and high otherwise.
Data management and analysis
Data extraction, re-coding, visualization, and other statistical analyses were carried out using Excel, Stata version 16, and Arc-GIS version 10.8 after getting the data from the MEASURE DHS website. Descriptive statistics were used and were reported in the form of frequency, percentage, text, figures, and tables. Sampling weight (v005/1,000,000) was an adjustment factor used in tabulations to account for differences in the likelihood of selection and interview between cases in a sample owing to design or chance.
Descriptive spatial analysis
Detecting geographical clustering in data sets is critical in spatial data analysis (18). Global Moran's I is a widely used global index that assesses the similarity of values in nearby locations to an overall mean value and reflects a spatially weighted version of Pearson's correlation coefficient (19). The value ranges between −1 and 1, with values around −1 suggesting that the event was scattered, but values near +1 indicate that the event was clustered and distributed randomly if Moran's I value is zero. The presence of spatial autocorrelation is confirmed by a statistically significant Moran's I (P < 0.05) (20). Spatial autocorrelation analysis was performed to determine whether the spatial pattern of correct KOC among reproductive-age women in Ethiopia was clustered, dispersed, or random.
Hot-spot analysis and empirical Bayesian kriging interpolation mapping
Local indicators of spatial autocorrelation, like the Gettis-Ord Gi* statistic, can provide more information by estimating the distribution of events at the local level (21). The Gettis-Ord Gi* statistic calculates a Z-score and P-value for each grid cell and identifies statistically significant hot spots. Finally, the interpolation mapping technique with empirical Bayesian Kriging kernel density estimation was applied for smoothing the hotspot analysis. Hence, the use of Bayesian approaches for the identification of hotspots is increasing due to their capacity to reduce false positives and false negatives by 50% compared to classical methods (22).
Spatial scan statistics
A Bernoulli-based model spatial scan analysis using Kuldorff's SaTScan version 9.6 software was conducted to identify significant primary and secondary clusters of correct knowledge of the ovulatory cycle. A circular scanning window that goes across the region of Ethiopia means that women who correctly respond to the period of the ovulatory cycle were considered cases, while those who didn't respond correctly were considered controls. A maximum spatial cluster size of <50% of the population was used as an upper limit. The most likely clusters were identified using likelihood ratio tests and their corresponding significance levels based on the default 999 Monte Carlo replications.
Spatial regression analysis
Spatial regression models are critical for determining the relationship between the density of particular events and other environmental, demographic, and socioeconomic factors in the population (23). As a result, we sought to comprehend the relationship between the prevalence of correct KOC determined at each cluster and the other nine (9) explanatory variables from previous studies and preliminary multilevel analysis chosen based on expert opinion, as well as their importance during the multilevel analysis. We began our spatial regression modeling with OLS regression, which requires residuals to be normally distributed independently and identically. Furthermore, the residuals are presumed to be homoscedastic. The OLS regression model has numerous model diagnostics, including R2, adjusted R2, VIF, the Jarque–Bera statistic, the joint F statistic, the joint Wald statistic, and the Koenker (BP) statistic.
The GWR model was conducted with similar dependent and explanatory variables as the global model. The GWR has a geographical weighting system for the features included in the local regression equations. Near features and features that are farther away from the regression point have more weight and less weight in the regression equation, respectively. These weights are determined by a distance decay function called the kernel (24). In ArcGIS, there are two types of kernels: fixed and adaptive. The spatial configuration of the feature is the main reason to choose the kernel type. For reasonably or regularly positioned observations, a fixed kernel is appropriate. However, if observations are clustered, an adaptive kernel is appropriate (14).
Another important parameter to be considered in GWR is bandwidth (neighborhood). It is the distance band or number of neighbors used for each local regression equation that controls the degree of smoothing in the model (24). In ArcGIS, there are three choices for the corrected Akaike information criteria (AICc), cross-validation (CV), and bandwidth parameter. The AICc method automatically finds a bandwidth with the minimum AICc, while the CV method finds a bandwidth that minimizes the CV score. In practice, there isn't much to choose between the two methods, although the AICc is our preferred method. The AICc method can reduce model complexity due to the number of variables included in the study and the bandwidth (14).
In our study, observations showed significant spatial clustering, and the explanatory variables included in the model were nine. Thus, in order to reduce model complexity, we were interested in using the adaptive kernel type determined by AICc. Comparison between OLS and the GWR model was made using adjusted R2 and AICc values. A model with a high value of adjusted R2 and a low AICc value was the preferred model (i.e., GWR). If we get a less than 4 AICc difference between two models, we cannot choose one of them, but if this difference is greater than 10, there is evidence to choose a model with a small AICc value (25). Finally, a spatial autocorrelation test was conducted among the residuals of the GWR model to determine whether the residuals are randomly distributed after we controlled the spatial dependencies present in the residuals of the OLS model.
Missing values
Any missing data in the dataset was managed according to DHS guidelines. Thus, the final model was based on complete observation.
Ethical considerations
The study was a secondary data analysis based on the publicly available DHS datasets; thus, ethical approval and participant consent were not necessary. However, we requested the data from the MEASURE DHS Program, and permission was granted to download and use the data.
Results
A total of 15,683 weighted samples were included. About 21.56% of the respondents were in the age bracket of 15–19 years. Nearly half of the participants (47.81%) had not attended formal education. The majority (66.72%, 65.19%, 68.66%, and 74.66%) of the participants were unemployed during data collection, in a union, not exposed to FP messages, and not using contraceptives, respectively. Almost all (98.32 and 92.76) are knowledgeable about contraceptive methods and not currently pregnant. About 36.35%, 75.20%, 55.57%, 77.84%, and 57.46% were from the Oromia region, had not been visited by fieldworkers in the last 12 months, experienced menstruation in the last 6 weeks, were residing in rural areas, and were from clusters with low community FP message exposure, respectively (Table 1).
Table 1
| Variables | Categories | Weighted frequency (15,683) | Percentage (%) |
|---|---|---|---|
| Maternal age | 15–19 | 3,381 | 21.56 |
| 20–24 | 2,762 | 17.61 | |
| 25–29 | 2,957 | 18.85 | |
| 30–34 | 2,345 | 14.95 | |
| 35–39 | 1,932 | 12.32 | |
| 40–44 | 1,290 | 8.22 | |
| 45–49 | 1,017 | 6.48 | |
| Education level | No education | 7,498 | 47.81 |
| Primary | 5,490 | 35.01 | |
| Secondary | 1,818 | 11.59 | |
| Higher | 877 | 5.59 | |
| Religion | Orthodox | 6,786 | 43.27 |
| Protestant | 3,674 | 23.43 | |
| Muslim | 4,893 | 31.20 | |
| Other | 330 | 2.10 | |
| Household media exposure | No | 8,793 | 56.07 |
| Yes | 6,890 | 43.93 | |
| Wealth index | Poorest | 2,633 | 16.79 |
| Poorer | 2,809 | 17.91 | |
| Middle | 2,978 | 18.99 | |
| Richer | 3,100 | 19.76 | |
| Richest | 4,163 | 26.55 | |
| Currently employed | No | 10,463 | 66.72 |
| Yes | 5,220 | 33.28 | |
| Marital status | Never in union | 4,036 | 25.74 |
| Currently in union | 10,223 | 65.19 | |
| Formerly in union | 1,423 | 9.08 | |
| Exposure to FP messages (medias) | No | 10,768 | 68.66 |
| Yes | 4,915 | 31.34 | |
| Current contraceptive use | No | 11,709 | 74.66 |
| Yes | 3,974 | 25.34 | |
| Knowledge of contraceptive methods | No | 264 | 1.68 |
| Yes | 15,420 | 98.32 | |
| Currently pregnant | No | 14,548 | 92.76 |
| Yes | 1,135 | 7.24 | |
| Visited by fieldworker in last 12 months | No | 11,794 | 75.20 |
| Yes | 3,890 | 24.80 | |
| Menstruated in last 6 weeks | No | 6,969 | 44.43 |
| Yes | 8,714 | 55.57 | |
| Residence | Urban | 3,476 | 22.16 |
| Rural | 12,207 | 77.84 | |
| Region | Tigray | 1,129 | 7.20 |
| Afar | 128 | 0.82 | |
| Amhara | 3,714 | 23.68 | |
| Oromia | 5,701 | 36.35 | |
| Somali | 459 | 2.93 | |
| Benishangul | 160 | 1.02 | |
| SNNPR | 3,288 | 20.97 | |
| Gambela | 44 | 0.28 | |
| Harari | 39 | 0.25 | |
| Addis Ababa | 930 | 5.93 | |
| Dire Dawa | 90 | 0.58 | |
| Distance to health facility | Big problem | 7,890 | 50.31 |
| Not big problem | 7,793 | 49.69 | |
| Community level media exposure | Low | 8,136 | 51.88 |
| High | 7,547 | 48.12 | |
| Community level poverty | Low | 8,373 | 53.39 |
| High | 7,310 | 46.61 | |
| community FP message exposure | Low | 9,012 | 57.46 |
| High | 6,671 | 42.54 |
Characteristics of the respondents, EDHS 2016.
Magnitude of correct KOC
The overall prevalence of correct KOC among reproductive-age women was found to be 23.58% [95% CI: 22.92–24.25%], with the highest prevalence in Addis Ababa (44.6%) and lowest in the Benishangul region (9.6%) (Figure 1).
Figure 1
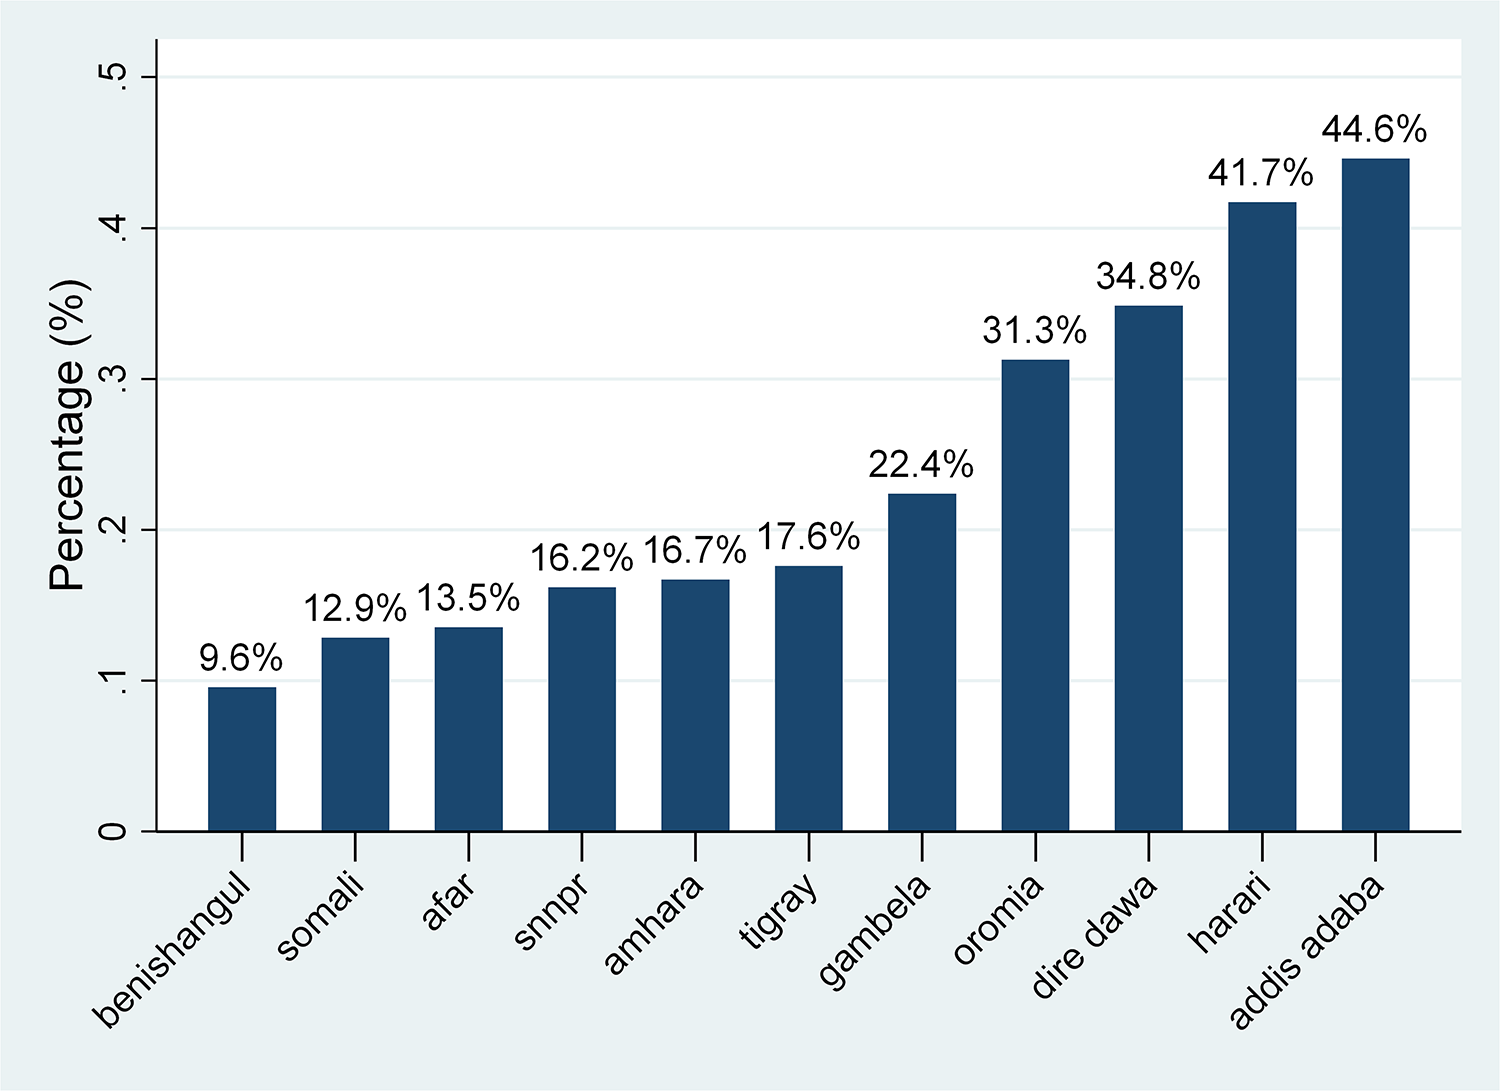
Prevalence of correct KOC among reproductive-aged women across regions of Ethiopia, 2016.
Spatial distribution and hot spot analysis of correct KOC
The spatial autocorrelation analysis indicated the presence of significant spatial clustering of the correct KOC across the country with a significant global Moran's index (I) of 0.441 (P-value = 0.000) and Z-score of 26.83 (Figure 2). During hot spot analysis, the Getis-Ord Gi* showed significant hot spot areas in Addis Ababa, Dire Dawa, and Hareri (Figure 3). This indicates that there was a clustering of high prevalence of correct KOC among reproductive-age women in the mentioned areas.
Figure 2
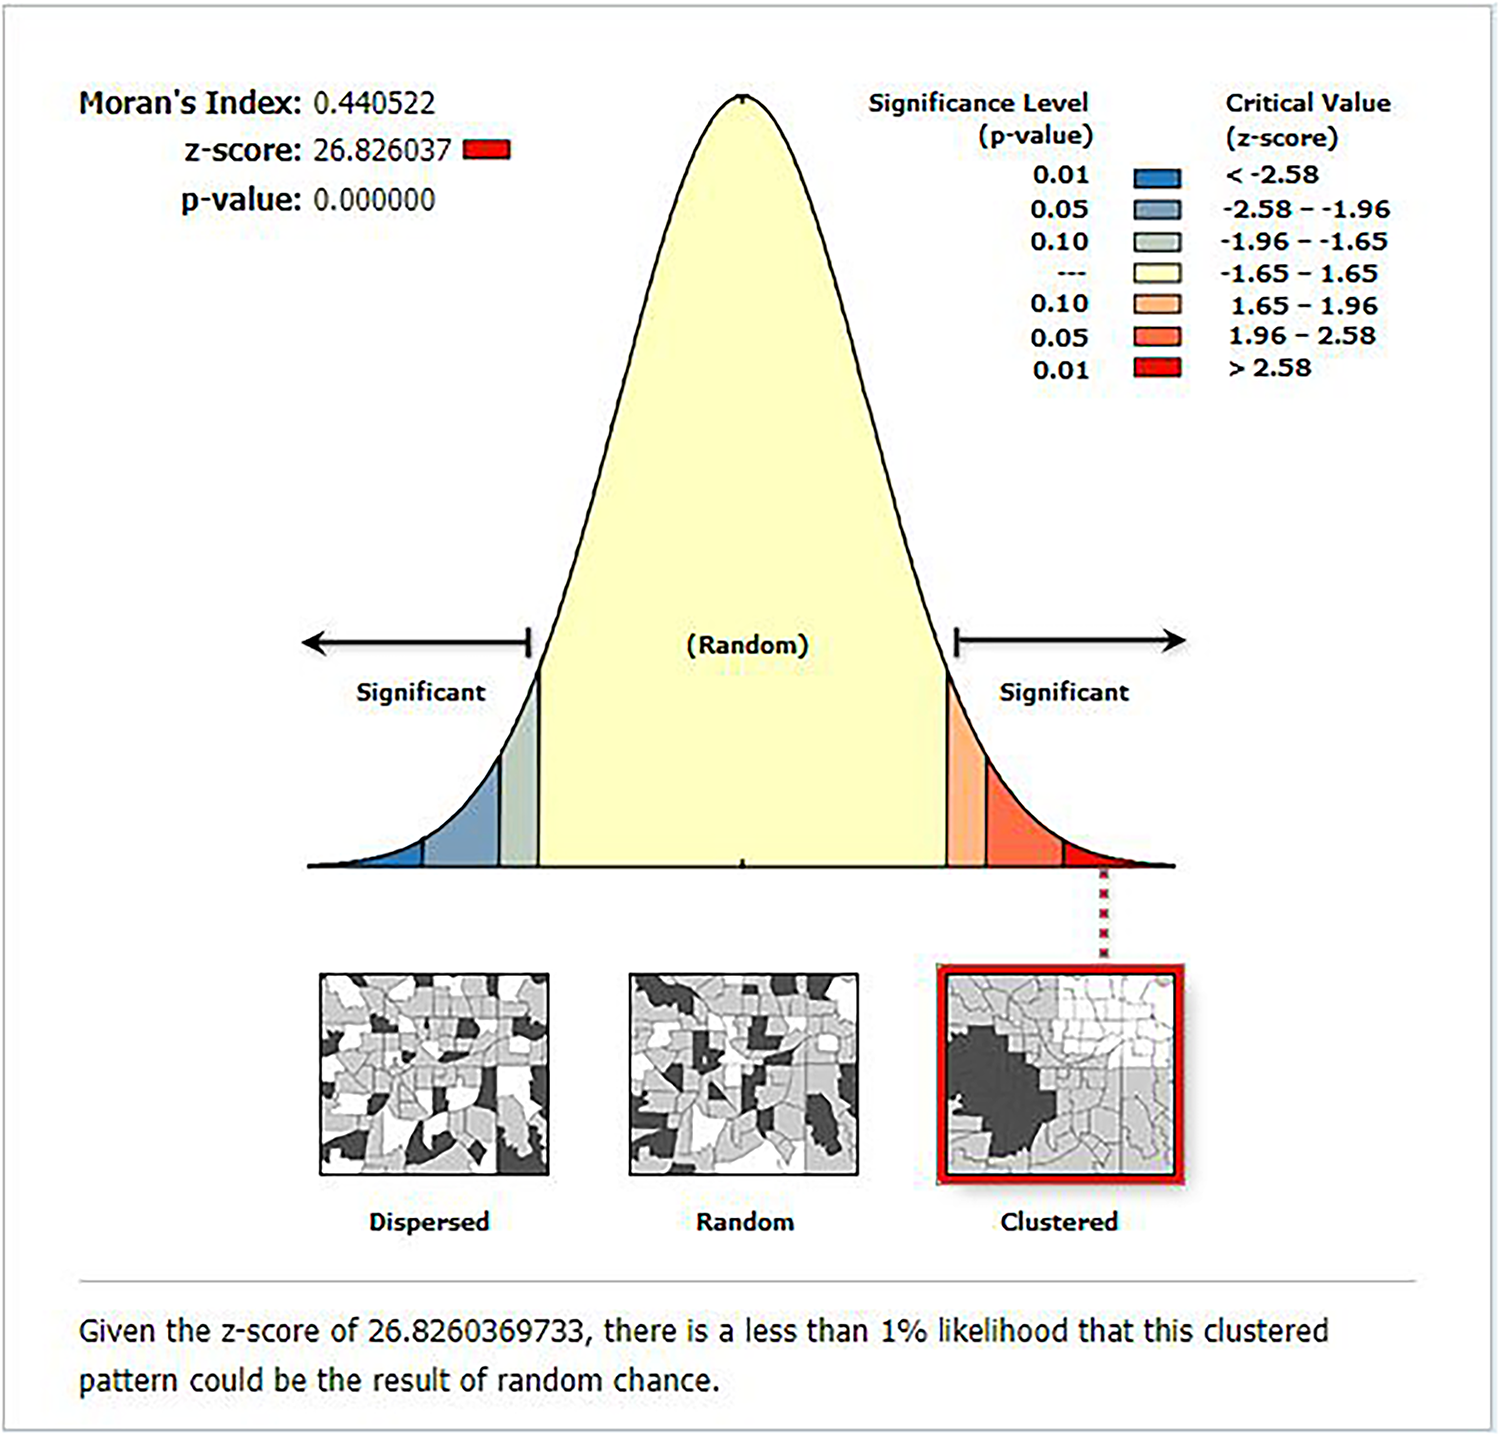
Global spatial autocorrelation analysis of correct KOC among reproductive age women in Ethiopia, 2016.
Figure 3
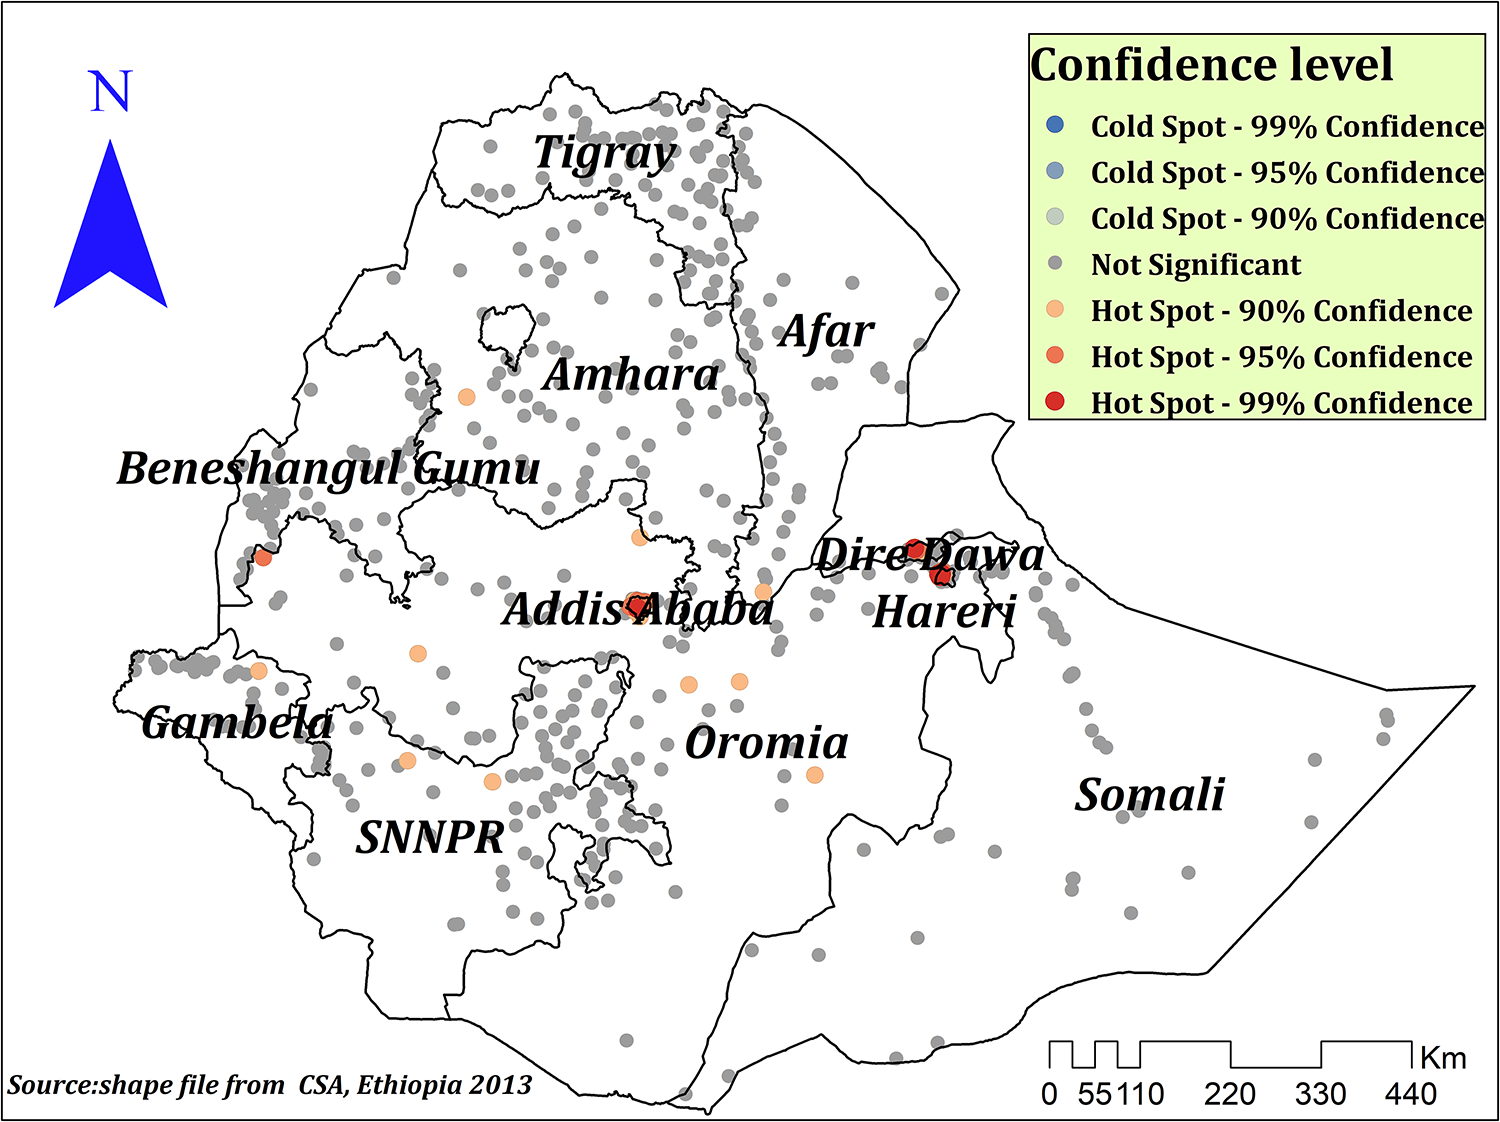
Hot spot analysis of correct KOC among reproductive age women in Ethiopia, 2016.
Spatial prediction of correct KOC among reproductive age women in Ethiopia
The empirical Bayesian Kriging interpolation predicted low and high prevalence areas of correct KOC among reproductive-age women. Accordingly, the majority of Benishangul, Somali, Afar, Amhara, parts of SNNPR, some parts of Tigray, and Gambela regions were predicted to have a low prevalence of correct KOC, while Addis Ababa, some parts of Oromia, Dire Dawa, and Hareri were predicted to have a high predicted prevalence of correct KOC (Figure 4).
Figure 4
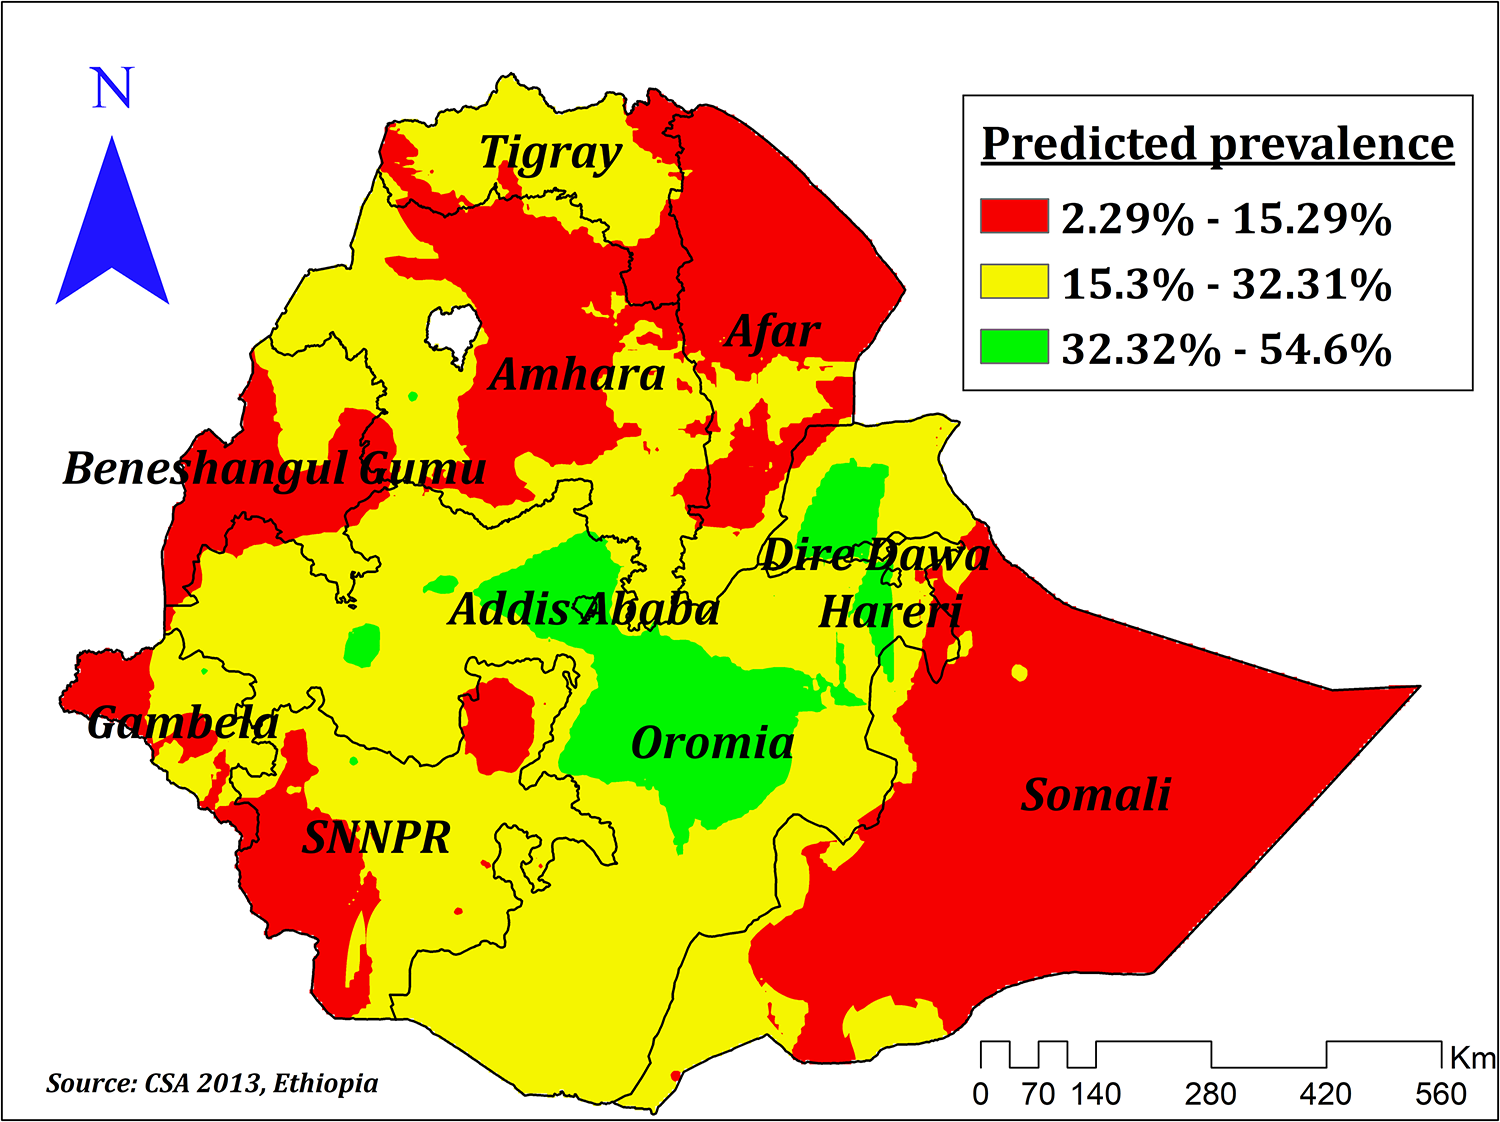
Empirical Bayesian kriging interpolation of prevalence of correct KOC among reproductive age women in Ethiopia.
Spatial scan analysis
Spatial scan statistics identified a total of 199 significant clusters. Of those, 184 were most likely (primary), and the rest, 15, were secondary clusters. The primary clusters were located at 8.591911 N, 40.352665 E/213.80 km radius in southern Amhara and Afar, Addis Ababa, Dire Dawa, Harari, central, and eastern Oromia, and women residing in these clusters were 2.4 times more likely to have the correct KOC compared to those women residing outside the window (Figure 5). The second significant clusters were located at 8.553292 N, 35.448128 E/101.17 km in western Oromia and eastern Gambela and those women residing in these clusters were 45% more likely to have correct KOC than women outside the window (Table 2).
Figure 5
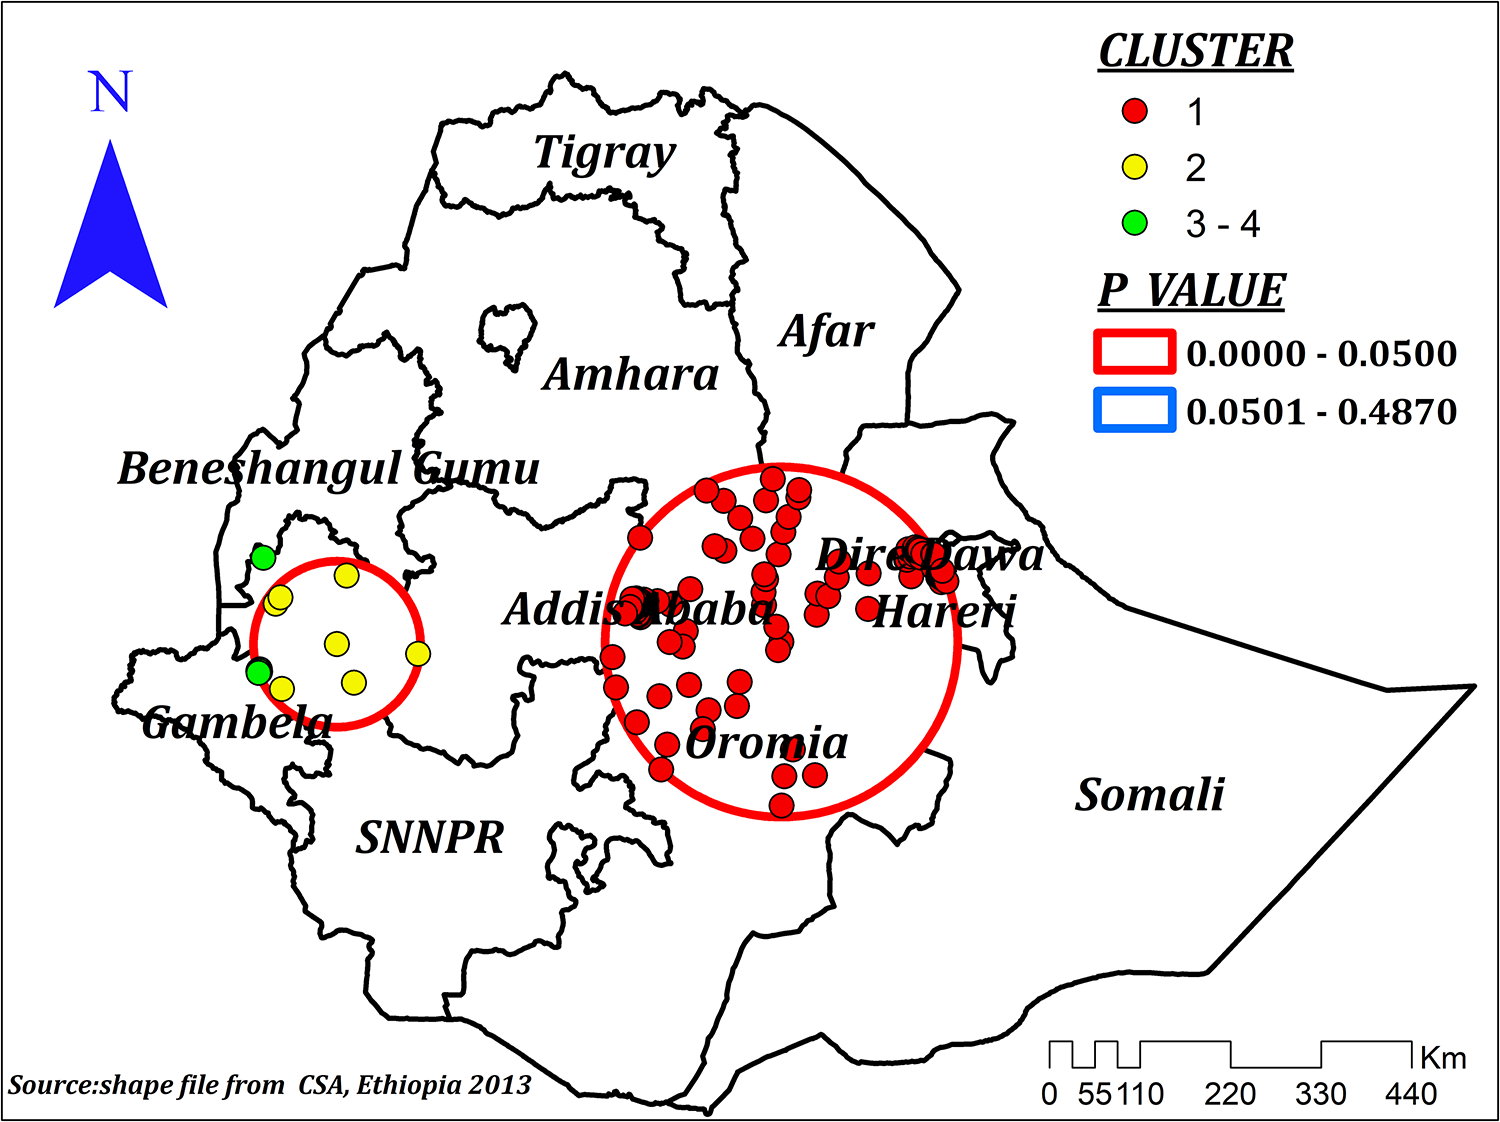
Spatial scan analysis showing most likely (primary) and secondary cluster for correct KOC among reproductive age women, Ethiopia.
Table 2
| Cluster type | ||
|---|---|---|
| Primary cluster | Secondary cluster | |
| Significant clusters detected | 245, 529, 122, 71, 476, 49, 319, 506, 51, 412, 230, 123, 333, 564, 372, 125, 149, 491, 213, 524, 121, 484, 624, 452, 39, 93, 290, 40, 201, 562, 336, 303, 295, 438, 472, 286, 90, 402, 353, 102, 83, 211, 287, 330, 560, 236, 509, 428, 453, 155, 252, 135, 19, 539, 451, 264, 639, 247, 61, 293, 15, 464, 475, 302, 261, 153, 225, 582, 441, 414, 159, 170, 110, 557, 305, 635, 144, 112, 195, 108, 59, 532, 369, 626, 91, 463, 31, 637, 100, 107, 314, 645, 37, 11, 339, 487, 619, 608, 594, 274, 145, 25, 147, 30, 43, 380, 644, 282, 546, 74, 166, 111, 151, 273, 190, 631, 535, 519, 283, 101, 467, 471, 363, 140, 613, 5, 289, 606, 390, 185, 444, 522, 385, 202, 224, 27, 514, 493, 352, 311, 473, 217, 310, 607, 115, 513, 173, 54, 443, 614, 179, 133, 393, 28, 29, 228, 580, 500, 60, 56, 397, 383, 418, 58, 257, 240, 157, 610, 44, 534, 387, 238, 396, 587, 329, 483, 194, 321, 523, 26, 454, 423, 242, 495 | 558, 555, 304, 448, 248, 175, 63, 114, 411, 47, 469, 291, 549, 221, 231 |
| Coordinates/Radius | 8.591911 N, 40.352665 E/213.80 km | 8.553292 N, 35.448128 E/101.17 km |
| Population | 4,829 | 384 |
| Number of cases | 1,915 | 131 |
| Relative risk | 2.40 | 1.45 |
| Percent cases in area | 39.7 | 34.1 |
| Log likelihood ratio | 462.15 | 10.52 |
| P-value | <0.00000000000000001 | 0.018 |
Spatial scan analysis of correct KOC in Ethiopia using 2016 EDHS data.
The ordinary least square regression analysis results
The OLS model showed a significant joint F and Wald statistic, indicating that the overall model is significant. The Jarque–Bera statistic was significant (P = 0.001), indicating the predicted values of the model were biased and residuals were not randomly distributed across areas. The Koenker statistic reported as the Breusch–Pagan heteroscedasticity coefficient was significant (P = 0.000). Which indicates the presence of an inconsistent relationship between the prevalence of correct KOC and other explanatory variables due to non-stationarity or heteroscedasticity (Table 3).
Table 3
| Variable | Coefficient | Robust Std. error | Robust probability | VIF |
|---|---|---|---|---|
| Intercept | 0.037 | 0.034 | 0.282 | - |
| Proportion of women with age greater than or equal to 30 years | 0.004 | 0.0048 | 0.930 | 1.11 |
| Proportion of women with primary and above education | 0.060 | 0.034 | 0.081 | 3.27 |
| Proportion of women from household with richer and above wealth quintile | 0.104 | 0.027 | 0.000 | 4.62 |
| Proportion of women from household with media exposure | 0.198 | 0.031 | 0.000 | 4.53 |
| Proportion of women without a big problem of distance to health facility | −0.043 | 0.022 | 0.052 | 1.79 |
| Proportion of women who were using contraceptive | −0.085 | 0.04 | 0.034 | 1.39 |
| Proportion of women with no knowledge of any type of contraceptive | −0.048 | 0.037 | 0.195 | 1.40 |
| Proportion of women who had menstruated in the last 6 weeks | 0.088 | 0.045 | 0.049 | 1.77 |
| Proportion of women from cluster of high community FP messages. | 0.020 | 0.015 | 0.181 | 2.00 |
| OLS diagnostics | ||||
| Diagnostic parameters | Value | P-value | ||
| Number of observations | 622 | - | ||
| Joint F statistic | 57.25 | 0.000 | ||
| Joint Wald statistic | 519.58 | 0.000 | ||
| Koenker (BP) statistic | 53.68 | 0.000 | ||
| Jarque Bera statistic | 14.35 | 0.001 | ||
| Model comparison | ||||
| Model parameter | OLS (global) model | GWR | ||
| R 2 (%) | 45.71 | 59.85 | ||
| Adjusted R2 (%) | 44.91 | 54.92 | ||
| AICc | −703.62 | −794.48 | ||
OLS regression analysis results, EDHS 2016.
Bold indicates P-values <0.05.
Our OLS output indicated to us to ensure whether there is spatial autocorrelation in the residuals. Accordingly, residuals from the OLS model were spatially and significantly autocorrelated, which violates one of the assumptions of OLS regression analysis and indicates the modeling process is spatially heterogeneous or non-stationary. Thus, the results of the OLS regression are unreliable, and it is necessary to make reliable predictions. In order to account for the heterogeneous relationship of the process and improve the reliability of the predictions of the effect size of explanatory variables, we need to have GWR to account for the spatial autocorrelation and varying relationships across space.
The Variance Inflation Factor (VIF) measures collinearity or redundancy among explanatory variables considered in the model. A rule of thumb regarding the cutoff value for VIF is 7.5. Thus, an explanatory variable with a VIF value greater than 7.5 should be removed (26). However, in our OLS model, all explanatory variables had a VIF value of less than 7.5; thus, multicollinearity was not a serious problem in further analysis.
Geographical weighted regression
Explanatory variables included in the global model were used for the GWR analysis. Compared to the global model, the GWR model was better. The adjusted R2 in the GWR increased from 44.9 in the OLS to 54.9. This means that the GWR model explained an additional 10% of the variation in the prevalence of correct KOC across regions. Moreover, the AICc value for the OLS model was −703.62, and it decreased to a value of −794.48 in the GWR (difference = 90.86). Thus, we can conclude that the later model well explained the spatial heterogeneity. We checked the spatial autocorrelation of the residuals before interpreting the GWR result. The autocorrelation of the residuals was randomly distributed; hence, Moran's I for the residuals was 0.022 (P = 0.156). As Figure 6 shows little evidence of autocorrelation, which indicates that the explanatory variables considered in our model well explained the spatial dependencies that have been present in the residuals for the global model. Therefore, our model was well specified.
Figure 6
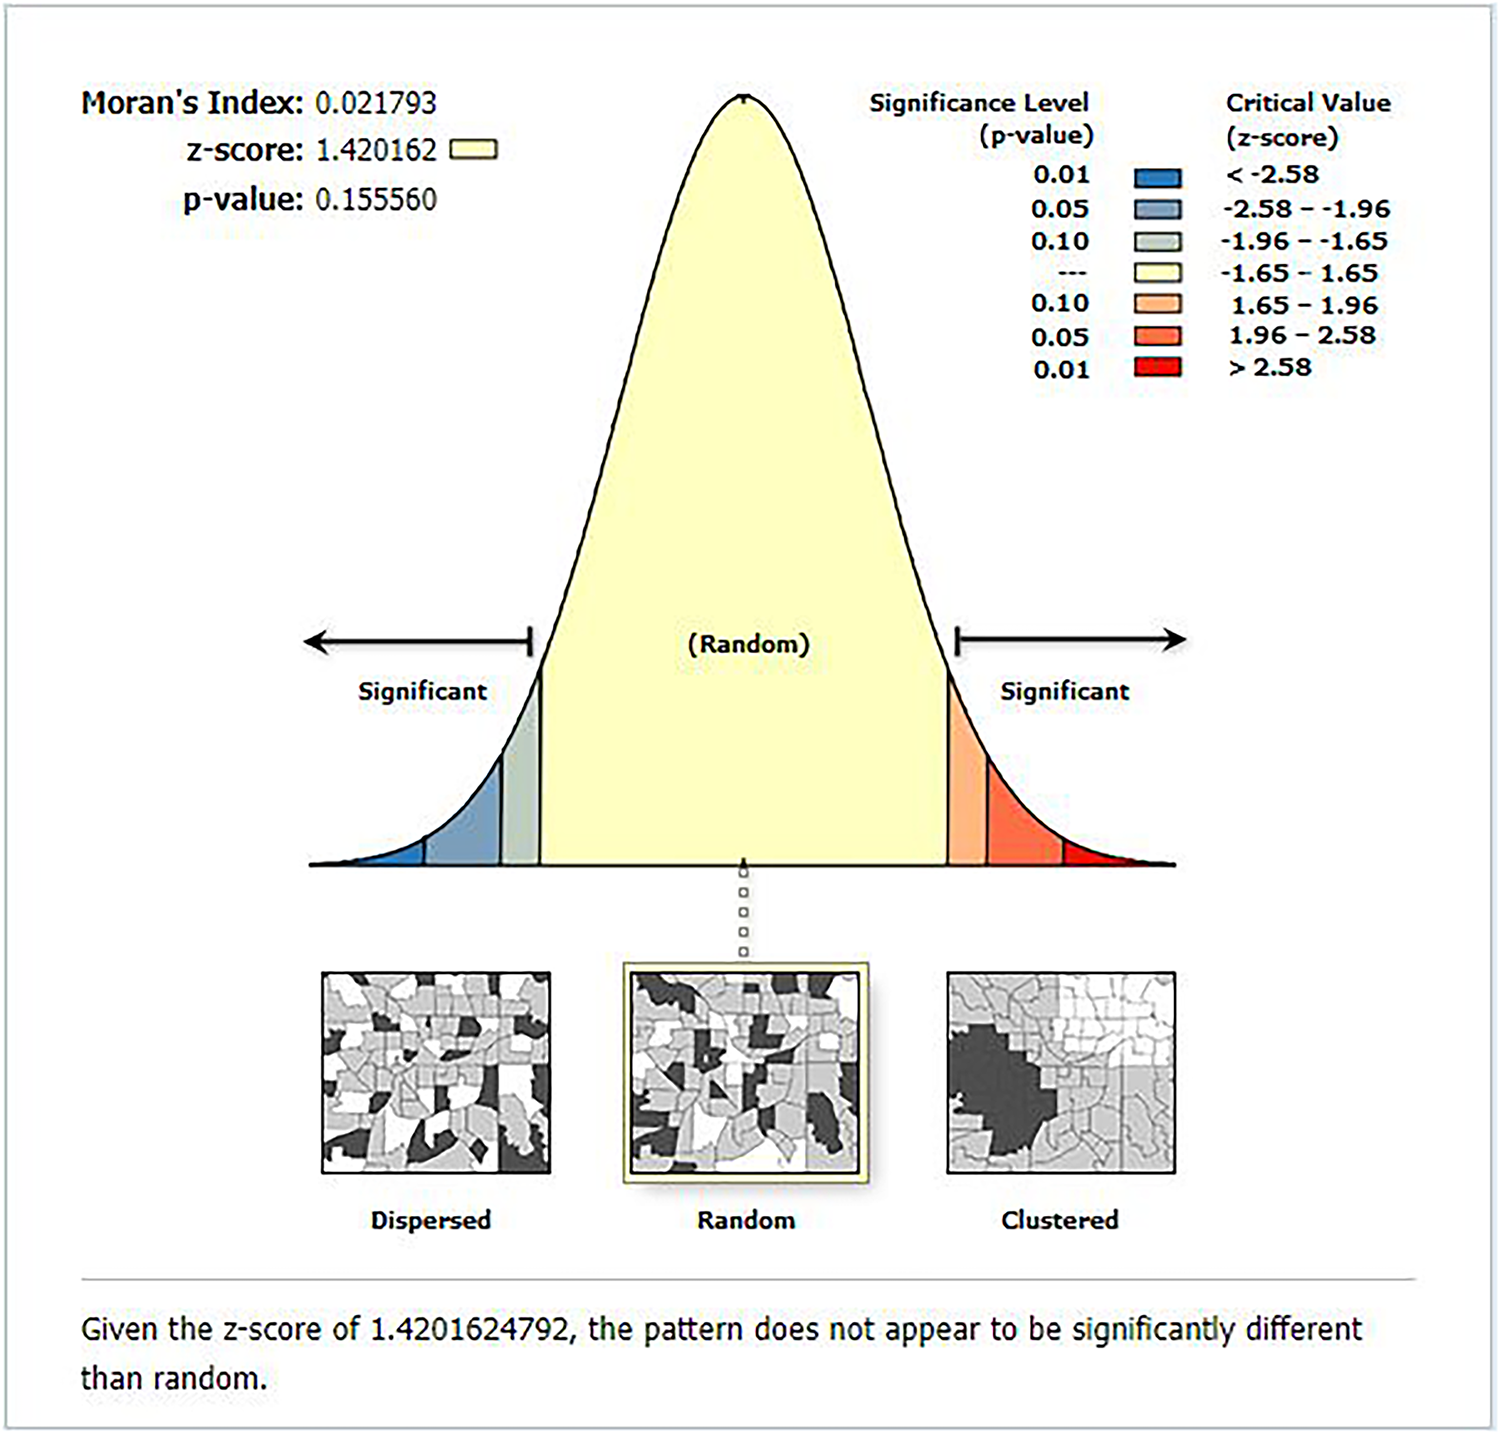
The global spatial autocorrelation analysis of residuals after geographical weighted regression analysis.
Household media exposure had a positive effect (ranges between 0.047 and 0.57) on the prevalence of correct KOC among reproductive-age women in Ethiopia. However, its statistical significance varies across different regions of Ethiopia. In the significant areas of Amhara, Oromia, Addis Ababa, SNNPR, and Somali regions, a 1% increase in the proportion of women with media exposure increases the prevalence of correct KOC by a range of 34%–57%. However, household media exposure had no significant effect in Dire Dawa, Hareri, almost the entire Tigray and Afar, as well as the majority of the regions of Benishangul, Gambela, and Somali (Figure 7).
Figure 7
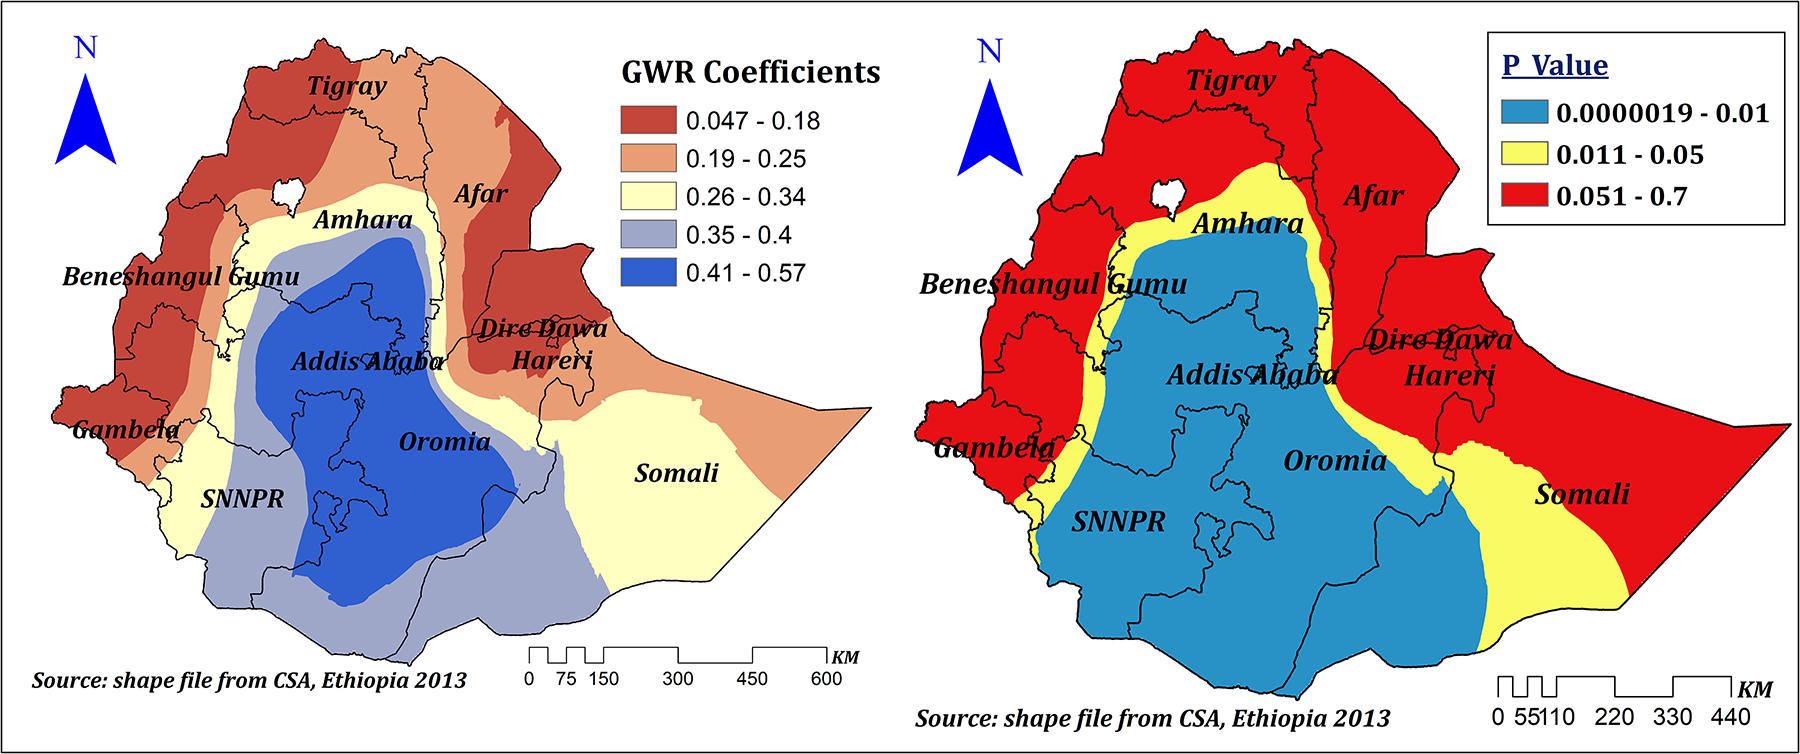
The GWR coefficients of household media exposure predicting correct KOC among reproductive age women in Ethiopia, 2016.
Being from a household with a rich wealth status indicated a positive and negative spatial effect on correct KOC among reproductive-age women in Ethiopia, which ranges from −0.12 to 0.54. However, its significant effect was observed in the entire Benishangul Gumuz, the majority of Gambela and western Oromia, and some parts of western Amhara and the Northwest SNNPR. In significant areas, a 1% increase in the proportion of women from households with a rich wealth quintile increases the prevalence of correct KOC among reproductive-age women by a range of 13%–54% (Figure 8).
Figure 8
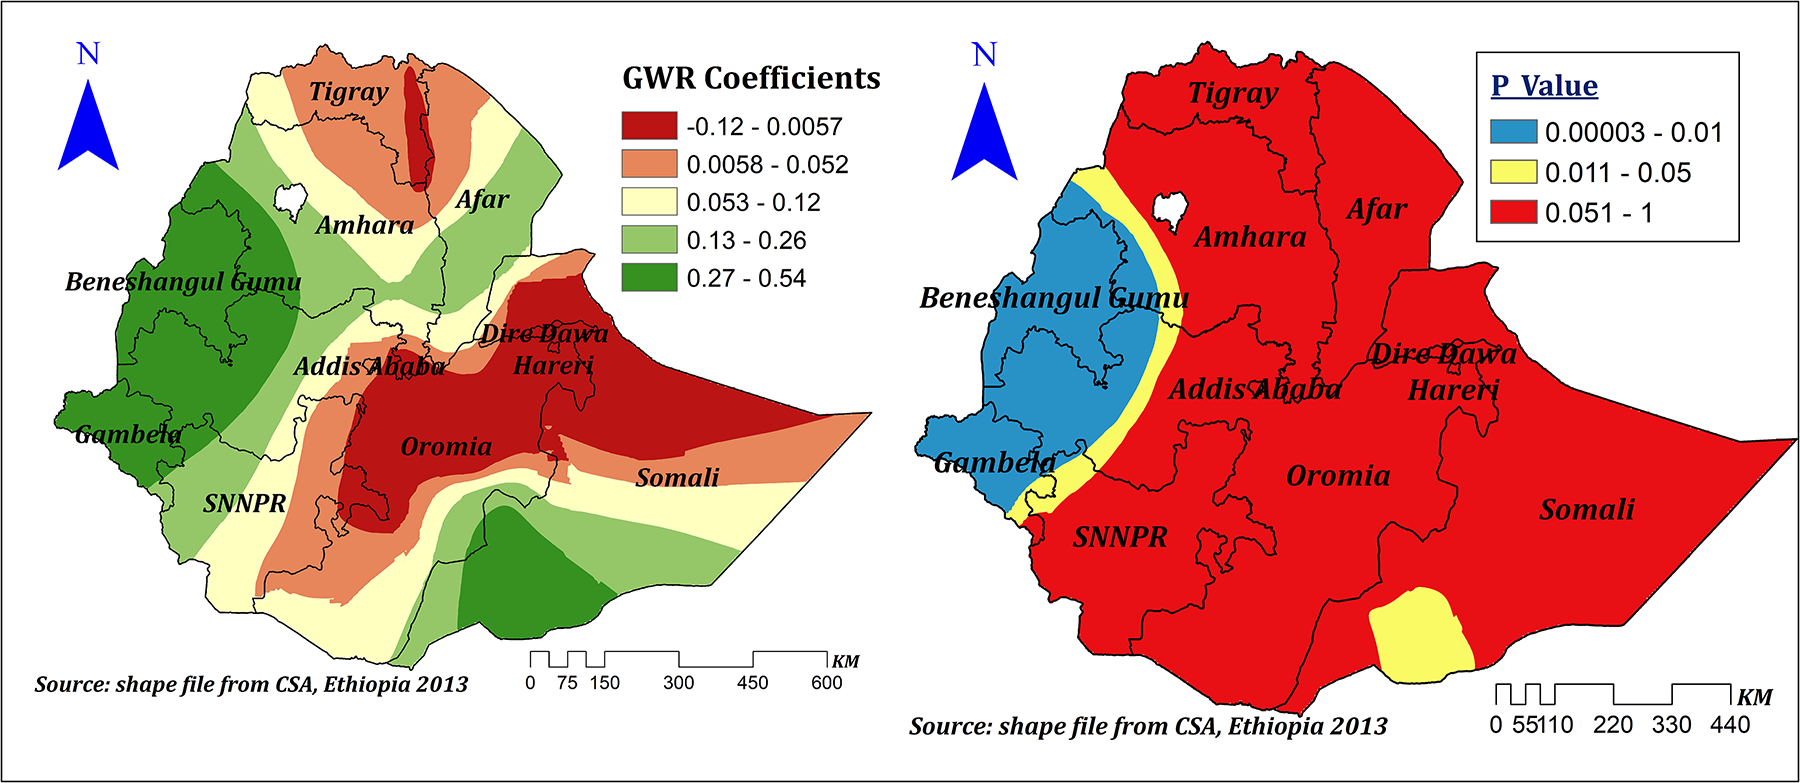
The GWR coefficients of rich household wealth quintile predicting correct KOC among reproductive age women in Ethiopia, 2016.
Distance to health facilities showed a positive and negative spatial effect on correct KOC among reproductive-age women in Ethiopia, which ranges between −0.402 and 0.227 with different corresponding significance levels. It showed a significant negative effect in Addis Ababa, the majority of SNNPR, Oromia, some parts of Gambela, Benishangul Gumuz, Amhara, and Southwest Somali, and ranges between −0.243 and −0.402, which indicates a 1% increase in the proportion of women residing near to health facilities corresponded to a 24.3%–40.2% decrease in the prevalence of correct KOC. On the other hand, in some other significant areas, such as Dire Dawa, Harari, eastern Oromia, and eastern and southeastern Somali, it showed a significant positive effect that ranged between 0.15 and 0.227. Thus, a 1% increase in the proportion of women residing near health facilities corresponded to a 15%–22.7% increase in the prevalence of correct KOC in these areas; other variables in the model remain constant (Figure 9).
Figure 9
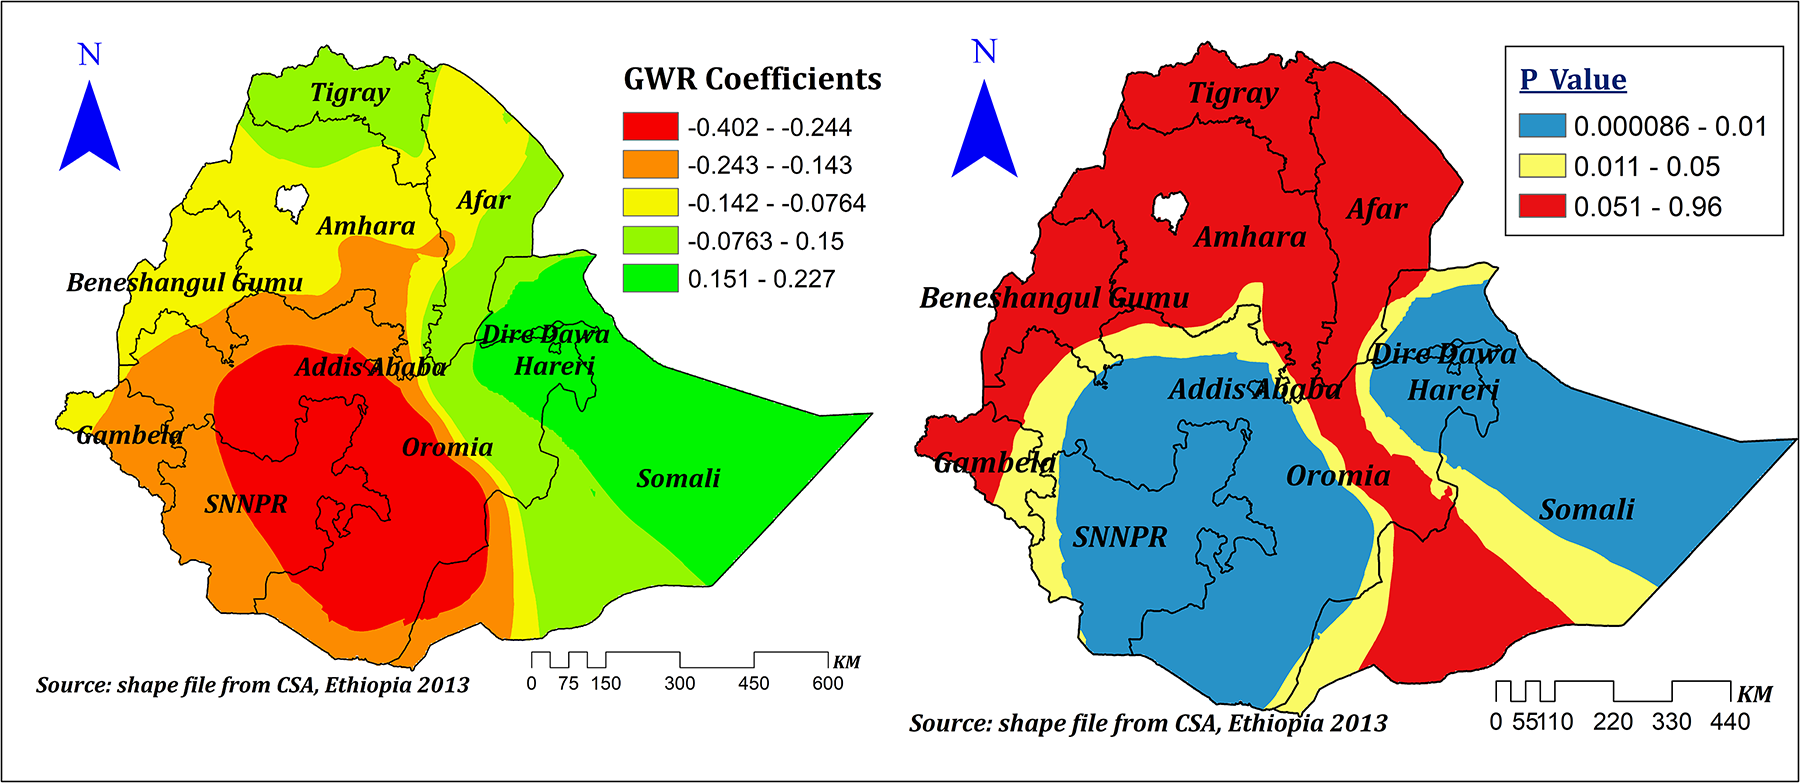
The GWR coefficients and spatially varying values of significance level of no problem of distance to health facility predicting correct KOC in the final model.
The effect size of education was statistically significant, varied across regions of Ethiopia, and ranged between −0.14 and 0.36, indicating that education had a negative and positive spatial effect on the prevalence of correct KOC. However, the significant effect was only seen in the majority of the Amhara, Afar, and Gambela regions and in some parts of western and central Oromia, Benishangul, and Somali regions. In these significant regions, a 1% increase in the proportion of women with primary and above education increases the prevalence of correct KOC by a range of 23%–36%, keeping other variables constant (Figure 10).
Figure 10
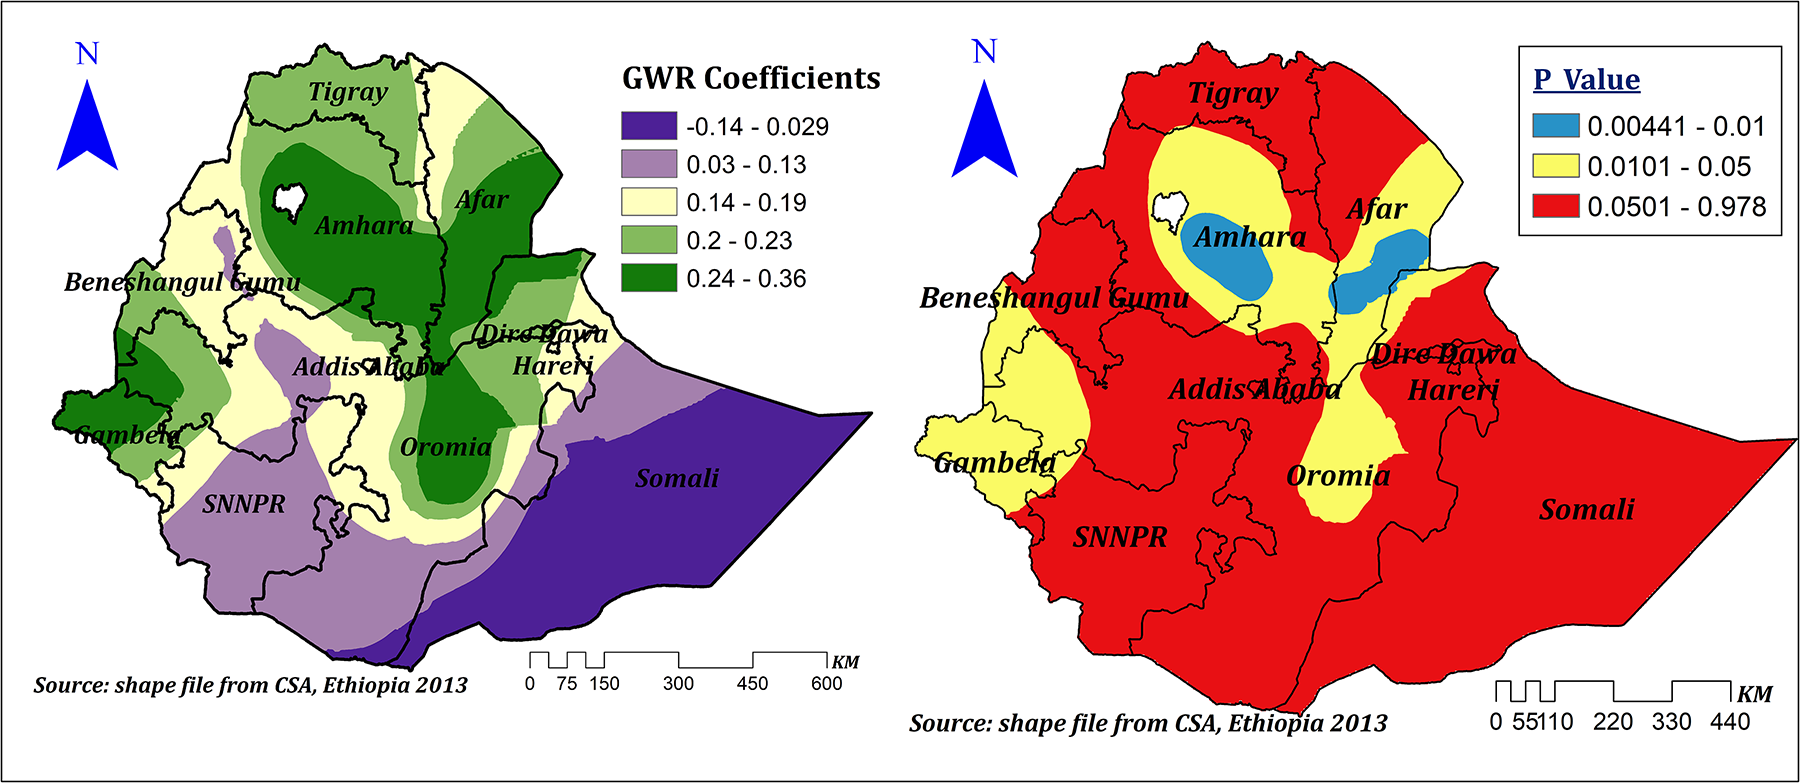
The GWR coefficients and spatially varying significance level of education for predicting correct KOC among reproductive age women in Ethiopia.
High community-level FP messages had a spatially positive and negative effect on correct KOC ranges between −0.16 and 0.39. However, in the significant areas (Dire Dawa, Harari, Somali, majority of Oromia, and SNNPR), the effect size ranges between 0.28 and 0.39. This means a 1% increase in the proportion of women in clusters of high community FP messages in these areas can increase the correct KOC by a range of 28%–39%. Surprisingly, in parts of Benishangul and western Oromia, when the proportion of women from clusters of high community FP messages increases by 1%, correct knowledge of KOC decreases by a range of 2.2%–16% (Figure 11).
Figure 11
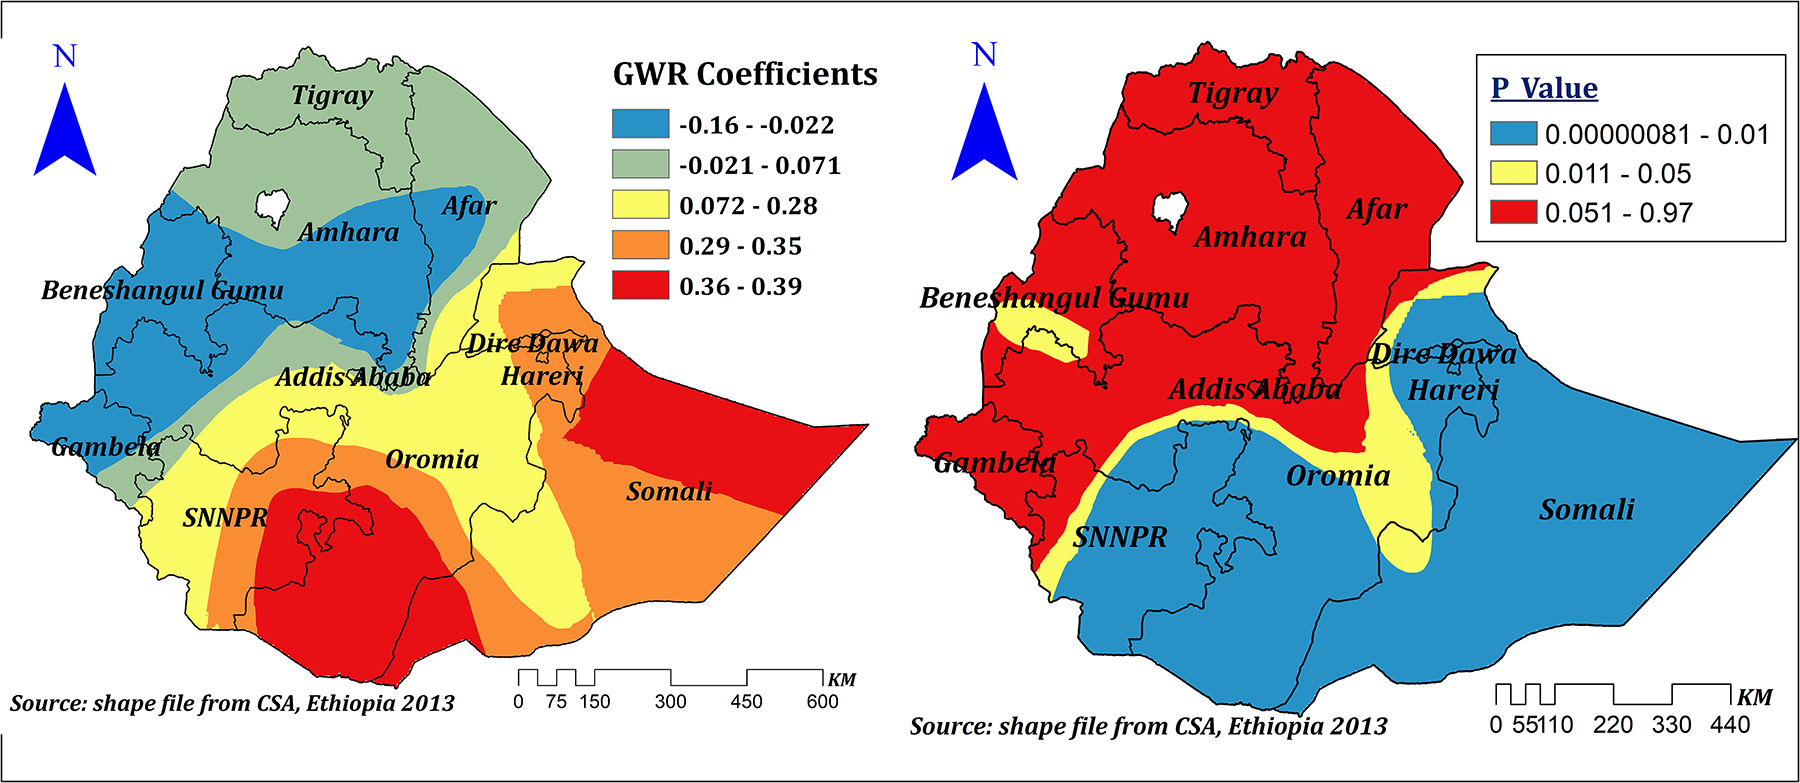
The GWR coefficients and spatially varying significance level of high community level FP messages predicting correct KOC among reproductive age women in Ethiopia.
Discussion
This study examined the geographical variation of correct KOC and its associated factors among reproductive-aged women in Ethiopia to understand the regional variation and distribution as well as factors contributing to the observed regional variation. In spatial regression analysis, having formal education, rich household wealth status, household media exposure, high community-level family planning (FP) media exposure, and proximity to a health facility were significant explanatory variables for the spatial variation of the correct KOC.
In our study, only 23.58% [95% CI: 22.92–24.25%] of reproductive-age women had the correct KOC. Similar findings were reported from Haiti (2) and Africa (5). However, our finding is higher than previous findings from Africa (11), sub-Saharan Africa (4), and Australia (7, 27). This might be due to a difference in the sociocultural context (4). Our findings are also lower than those of a study conducted in the United States (1, 6). This might be due to poor communication and information-seeking behavior about sexual matters in the family, school, and community among women in Africa (4, 28, 29).
Our study also showed that the spatial distribution of the correct KOC was non-random and clustered spatially at the cluster level. High clustering was observed at Addis Ababa, some parts of central, eastern, and western Oromia, Harari, Dire Dawa, and some parts of the northwest Somali region. Similarly, a high proportion of clustering was observed among the 199 clusters during the spatial scan analysis, with significant clustering in southern Amhara and Afar, Addis Ababa, Dire Dawa, Harari, central as well as western Oromia, and some parts of the Northwest Somali region. However, during interpolation, the majority of the Somali, Afar, SNNPR, Benishangul, and Amhara regions, as well as some parts of the Gambela and Tigray regions, were predicted to have the lowest prevalence of correct KOC. Previous studies conducted in Africa also declared the geographical variation of KOC (4, 30). This might be due to socioeconomic, demographic, cultural, behavioral, and lifestyle differences among participants across regions (31–33). Disparities in the implementation of different health-related programs across regions may also contribute to variations in women's knowledge of their ovulation period and health care-seeking behavior as a whole (34). Inequities between and within regions of Ethiopia in the use of maternal health services may also contribute to the observed variation (35). In Ethiopia, there are strong cultural beliefs that deter open discussion on sexual and reproductive health, leading to misconceptions. Specifically, youths, are disadvantaged because of societal pressure, limited access to accurate sexual and reproductive health information, and services (36). The economic disparities also have a considerable impact on sexual and reproductive health knowledge and maternal health services utilization. Moreover, other factors such as education, residence, employment status, and media access are also indirectly related to economic status (37).
Our study indicated that education was a spatially statistically significant predictor of the spatial variation of the correct KOC. In areas where education was a significant factor, a 1% increase in the proportion of formally educated women corresponded to a 23%–36% increase in correct KOC. This finding is supported by a systematic review (38) and by studies conducted in Africa (4, 11), Ghana (13), Nigeria (30), Haiti (2), and the United States (6). This might be due to the impact of education on knowledge of human physiology and biology since the human reproductive system has been included as part of the human biology subject curriculum in Ethiopia. However, regional inequalities in educational achievement, educational opportunities (31), and educational quality differences (39) may be responsible for the regional variation of education across regions of Ethiopia.
Household media exposure was another spatially significant explanatory variable. It had a spatially and statistically significant positive effect on the prevalence of correct KOC among reproductive-age women. However, its statistical significance varies across different regions of Ethiopia. In significant areas, a 1% increase in the proportion of women with media exposure increases the prevalence of correct KOC by a range of 34%–57%. This finding is supported by a study conducted among African women (11) and Nigeria (30). It could be related to the significant influence of mass media exposure on maternal health awareness through the generation, acquisition, or dissemination of knowledge (40).
Our result also revealed that rich wealth status had a positive spatial effect on correct KOC among reproductive age women in significant parts of Ethiopia, in which, in these significant areas, a 1% increase in the proportion of women from households with a rich wealth quintile increased the prevalence of correct KOC among reproductive age women by a range of 13%–54%. This finding is supported by evidence from Africa (11). This might be due to the relation between economic status and educational opportunity and achievements (41–43), where better economic status may enhance educational opportunity and achievement positively; and media exposure (44, 45), which is a way of disseminating health-related information, including FP methods (43, 46, 47).
Another important and significant spatial explanatory variable was distance to health facilities. The proportion of women residing near health facilities showed both positive and negative spatial effects on the correct KOC, which ranges from −0.402 to 0.227. The negative effect was seen in Addis Ababa, SNNPR, Oromia, some parts of Gambela, Benishangul Gumuz, and Amhara, where a 1% increase in the proportion of women residing near health facilities decreased the prevalence of correct KOC by a range of 24.3%–40.2%. This is a surprising finding. However, another study conducted in Africa also indicated that residing near health facilities had no significant effect (11). On the other hand, in Dire Dawa, Harari, eastern Oromia, and eastern and southeastern Somali, it showed a significant positive effect as the proportion of women residing near health facilities increased by 1% and the prevalence of correct KOC increased by 15%–22.7%. This variation might be contributed to health extension program quality and implementations across the regions (34). Moreover, the negative effect seen might be due to the effect of customers’ large volume on the quality of primary health care, including counseling regarding the reproduction cycle (48).
Our study revealed that high community family planning message exposure is another spatial predictor for correct KOC. A spatially positive effect was seen in significant areas, in which a 1% increase in the proportion of women from clusters of high community FP messages in these areas can increase correct KOC by a range of 28%–39%. Which is supported by previous evidence from Cameroon (49) and Haiti (2). Surprisingly, in some parts of Benishangul and western Oromia, when the proportion of women from clusters of high community FP messages increases by 1%, correct knowledge of KOC decreases by a range of 2.2%–16%. This might be due to differences in health-related message dissemination and the quality of health program implementation.
Our study implied that considering spatial analyses to examine the regional disparity of KOC and the spatial factors influencing the geographical variation may be helpful. This approach can help in pinpointing areas with low rates of KOC and developing context- and area-based interventions.
Strength and limitations of the study
This study is based on nationally representative data collected with a validated instrument. We employed a spatial analysis to identify hotspot and cold spot areas of correct KOC and identify spatial explanatory variables for this significant spatial variation in a specific geographic area. However, the GPS position used in our study is randomly displaced in order to maintain respondent confidentiality. As a result, urban clusters contain 0–2 km, rural clusters contain 0–5 km, and 1% of the rural clusters contain 0–10 km of positional errors. This may affect the local estimates and make it challenging to pinpoint the actual location of the cases.
Conclusion
In this study, correct KOC among reproductive-aged women was found to be low. Our findings indicate an important need for strategies to improve KOC among reproductive-age women. Therefore, increasing KOC among women of reproductive age should become a priority to reduce an increasing fertility rate and prevent unintended pregnancy and abortion in the country. Significant spatial variation of correct KOC among reproductive-age women across regions of Ethiopia was indicated. Both individual and community-level factors showed a significant relationship with the correct KOC. Therefore, area-based interventional strategies are required in cold-spot areas to enhance adequate KOC. In addition, considering spatial explanatory variables in the implementation of these strategies rather than random provision of service would make regional health care delivery services more cost-effective. Lastly, our finding should encourage public health authorities to develop targeted reproductive education, which can be delivered effectively at schools, because it will help them understand their reproductive physiology.
Statements
Data availability statement
Publicly available datasets were analyzed in this study. This data can be found here: http://www.dhsprogram.com.
Ethics statement
Ethical approval was not required for the studies involving humans because the study was a secondary data analysis based on the publicly available DHS datasets. The studies were conducted in accordance with the local legislation and institutional requirements. Written informed consent for participation was not required from the participants or the participants' legal guardians/next of kin in accordance with the national legislation and institutional requirements because ethical approval and participant consent were not necessary. However, we requested the data from the MEASURE DHS Program, and permission was granted to download and use the data.
Author contributions
WT: Conceptualization, Data curation, Formal analysis, Funding acquisition, Investigation, Methodology, Project administration, Resources, Software, Supervision, Validation, Visualization, Writing – original draft, Writing – review & editing. LY: Investigation, Methodology, Project administration, Resources, Supervision, Validation, Visualization, Writing – review & editing. FA: Investigation, Methodology, Project administration, Resources, Supervision, Validation, Visualization, Writing – review & editing. ZA: Investigation, Methodology, Project administration, Resources, Supervision, Validation, Visualization, Writing – review & editing. TT: Investigation, Methodology, Project administration, Resources, Supervision, Validation, Visualization, Writing – review & editing.
Funding
The author(s) declare that no financial support was received for the research and/or publication of this article.
Acknowledgments
We are grateful to MEASURE DHS program for granting access to the DHS datasets.
Conflict of interest
The authors declare that the research was conducted in the absence of any commercial or financial relationships that could be construed as a potential conflict of interest.
Generative AI statement
The author(s) declare that no Generative AI was used in the creation of this manuscript.
Publisher’s note
All claims expressed in this article are solely those of the authors and do not necessarily represent those of their affiliated organizations, or those of the publisher, the editors and the reviewers. Any product that may be evaluated in this article, or claim that may be made by its manufacturer, is not guaranteed or endorsed by the publisher.
Abbreviations
AICc, corrected akaike information criteria; DHS, demographic and health survey; FP, family planning; GWR, geographically weighted regression; KOC, knowledge of ovulatory cycle; LL, log-likelihood ratio; OLS, ordinary least square; VIF, variance inflation factor.
References
1.
Ayoola AB Zandee GL Adams YJ . Women’s knowledge of ovulation, the menstrual cycle, and its associated reproductive changes. Birth. (2016) 43(3):255–62. 10.1111/birt.12237
2.
Jean Simon D Jamali Y Olorunsaiye CZ Théodat J-M . Knowledge of the ovulatory cycle and its determinants among women of childbearing age in Haiti: a population-based study using the 2016/2017 Haitian demographic health survey. BMC Womens Health. (2023) 23(1):2. 10.1186/s12905-022-02136-8
3.
Daniel S . Kushner (MD). Understanding ovulation (2023). Available online at:https://www.drdanielkushner.com/blog/understanding-ovulation(Accessed May 06, 2023).
4.
Iyanda A . Cross-national variation in knowledge of ovulation timing in sub-Saharan Africa (2020).
5.
Iyanda AE Dinkins BJ Osayomi T Adeusi TJ Lu Y Oppong JR . Fertility knowledge, contraceptive use and unintentional pregnancy in 29 African countries: a cross-sectional study. Int J Public Health. (2020) 65:445–55. 10.1007/s00038-020-01356-9
6.
Lundsberg LS Pal L Gariepy AM Xu X Chu MC Illuzzi JL . Knowledge, attitudes, and practices regarding conception and fertility: a population-based survey among reproductive-age United States women. Fertil Steril. (2014) 101(3):767–74.e2. 10.1016/j.fertnstert.2013.12.006
7.
Hampton KD Mazza D Newton JM . Fertility-awareness knowledge, attitudes, and practices of women seeking fertility assistance. J Adv Nurs. (2013) 69(5):1076–84. 10.1111/j.1365-2648.2012.06095.x
8.
Dagnew B Teshale AB Dagne H Diress M Tesema GA Dewau R et al Individual and community-level determinants of knowledge of ovulatory cycle among women of childbearing age in Ethiopia: a multilevel analysis based on 2016 Ethiopian demographic and health survey. PLoS One. (2021) 16(9):e0254094. 10.1371/journal.pone.0254094
9.
Getahun MB Nigatu AG . Knowledge of the ovulatory period and associated factors among reproductive women in Ethiopia: a population-based study using the 2016 Ethiopian demographic health survey. Int J Womens Health. (2020) 12:701–7. 10.2147/IJWH.S267675
10.
Wolde M Kassie A Shitu K Azene ZN . Knowledge of fertile period and its determinants among women of childbearing age in Ethiopia: a multilevel analysis based on 2016 Ethiopian demographic and health survey. Front Public Health. (2022) 10:828967. 10.3389/fpubh.2022.828967
11.
Zegeye B Adjei NK Idriss-Wheeler D Yaya S . Individual and community-level determinants of knowledge of ovulatory cycle among women of reproductive age in 29 African countries: a multilevel analysis. BMC Womens Health. (2022) 22(1):394. 10.1186/s12905-022-01984-8
12.
Babbar K Dev P . Modelling the impact of ovulatory cycle knowledge on the number of children and age of women at first birth (2021).
13.
Gyekye EK . Correlates of knowledge of ovulation cycle among women in urban poor communities in Accra (2014).
14.
Martin C Stewart F . Geographically weighted regression: a tutorial on using GWR in ArcGIS 9.3. Maynooth, County Kildare, Ireland: National Centre for Geocomputation, National University of Ireland Maynooth (2009). p. 1–27.
15.
Lawson AB Banerjee S Haining RP Ugarte MD . Handbook of Spatial Epidemiology. Boca Raton, FL: CRC Press (2016).
16.
ICF, Central Statistical Agency. Demographic and health survey, 2016 (Ethiopia). (2017). Available online at:https://dhsprogram.com/pubs/pdf/FR328/FR328.pdf(Accessed May 06, 2023).
17.
Croft TN Marshall AM Allen CK Arnold F Assaf S Balian S . Guide to DHS Statistics. Rockville: ICF (2018). p. 645.
18.
Jackson MC Waller LA . Exploring goodness-of-fit and spatial correlation using components of Tango’s index of spatial clustering. Geogr Anal. (2005) 37(4):371–82. 10.1111/j.0016-7363.2005.03704004.x
19.
Oden N . Adjusting Moran’s I for population density. Stat Med. (1995) 14(1):17–26. 10.1002/sim.4780140104
20.
Pandey M Singh V Vaishya R . Geomatics approach for assessment of respiratory disease mapping. Int Arch Photogramm Remote Sens Spat Inf Sci. (2014) 40(8):205. 10.5194/isprsarchives-XL-8-205-2014
21.
Anselin L . Local indicators of spatial association—LISA. Geogr Anal. (1995) 27(2):93–115. 10.1111/j.1538-4632.1995.tb00338.x
22.
Cheng W Washington SP . Experimental evaluation of hotspot identification methods. Accid Anal Prev. (2005) 37(5):870–81. 10.1016/j.aap.2005.04.015
23.
Srinivasan S . Spatial regression models. In: ShekharSXiongH, editors. Encyclopedia of GIS. Boston, MA: Springer US (2008). p. 1102–5.
24.
ESRI press. ArcGIS pro tool reference [how geographically weighted regression (GWR) works]. Available online at:https://pro.arcgis.com/en/pro-app/latest/tool-reference/spatial-statistics/how-geographicallyweightedregression-works.htm (Accessed May 06, 2023).
25.
Burnham KP . Model selection and multimodel inference. A practical information-theoretic approach (1998).
26.
ESRI press. How OLS regression works. Available online at:https://pro.arcgis.com/en/pro-app/latest/tool-reference/spatial-statistics/how-ols-regression-works.htm(Accessed March 10, 2023).
27.
Hampton K Mazza D . Fertility–awareness knowledge, attitudes, and practices of women attending general practice. Aust Nurs Midwifery J. (2016) 24(1):42.
28.
Manhart MD Duane M Lind A Sinai I Golden-Tevald J . Fertility awareness-based methods of family planning: a review of effectiveness for avoiding pregnancy using SORT. Osteopath Fam Physician. (2013) 5(1):2–8. 10.1016/j.osfp.2012.09.002
29.
Mbugua N . Factors inhibiting educated mothers in Kenya from giving meaningful sex-education to their daughters. Soc Sci Med. (2007) 64(5):1079–89. 10.1016/j.socscimed.2006.10.008
30.
Bamigbala OA Ojetunde AO Okorie CE . Knowledge of ovulatory cycle and associated factors among reproductive age women in Nigeria. Med Sci Ukraine. (2022) 18(3):94–102. 10.32345/2664-4738.3.2022.14
31.
Tesema MT Braeken J . Regional inequalities and gender differences in academic achievement as a function of educational opportunities: evidence from Ethiopia. Int J Educ Dev. (2018) 60:51–9. 10.1016/j.ijedudev.2017.10.023
32.
Argaw BA . Regional inequality of economic outcomes and opportunities in Ethiopia: a tale of two periods. WIDER Working Paper (2017).
33.
Kuznar LA . Ethiopia inequality report (2019).
34.
Haregu TN Alemayehu YK Alemu YA Medhin G Woldegiorgis MA Fentaye FW et al Disparities in the implementation of the health extension program in Ethiopia: doing more and better towards universal health coverage. Dialogues Health. (2021) 1:100047. 10.1016/j.dialog.2022.100047
35.
Bobo FT Yesuf EA Woldie M . Inequities in utilization of reproductive and maternal health services in Ethiopia. Int J Equity Health. (2017) 16(1):105. 10.1186/s12939-017-0602-2
36.
Sidamo NB Kerbo AA Gidebo KD Wado YD . Exploring barriers to accessing adolescents sexual and reproductive health services in south Ethiopia regional state: a phenomenological study using Levesque’s framework. Adolesc Health Med Ther. (2024) 15:45–61. 10.2147/AHMT.S455517
37.
Gebre E Worku A Bukola F . Inequities in maternal health services utilization in Ethiopia 2000–2016: magnitude, trends, and determinants. Reprod Health. (2018) 15(1):119. 10.1186/s12978-018-0556-x
38.
Pedro J Brandão T Schmidt L Costa ME Martins MV . What do people know about fertility? A systematic review on fertility awareness and its associated factors. Ups J Med Sci. (2018) 123(2):71–81. 10.1080/03009734.2018.1480186
39.
Lasonen J Kemppainen R Raheem K . Education and training in Ethiopia: an evaluation of approaching EFA goals (2005). Available online at:http://lst-iiep.iiep-unesco.org/cgi-bin/wwwi32.exe/[in=epidoc1.in)/?t2000=022756/(100)
40.
Igbinoba AO Soola EO Omojola O Odukoya J Adekeye O Salau OP . Women’s mass media exposure and maternal health awareness in Ota, Nigeria. Cogent Soc Sci. (2020) 6(1):1766260. 10.1080/23311886.2020.1766260
41.
Vadivel B Alam S Nikpoo I Ajanil B . The impact of low socioeconomic background on a Child’s educational achievements. Educ Res Int. (2023) 2023:6565088. 10.1155/2023/6565088
42.
Gobena GA . Family socio-economic status effect on students’ academic achievement at college of education and behavioral sciences, Haramaya University, eastern Ethiopia. J Teach Educ Educators. (2018) 7(3):207–22.
43.
Wuneh AD Bezabih AM Okwaraji YB Persson LÅ Medhanyie AA . Wealth and education inequities in maternal and child health services utilization in rural Ethiopia. Int J Environ Res Public Health. (2022) 19(9):5421. 10.3390/ijerph19095421
44.
Gashu KD Yismaw AE Gessesse DN Yismaw YE . Factors associated with women’s exposure to mass media for health care information in Ethiopia. A case-control study. Clin Epidemiol Glob Health. (2021) 12:100833. 10.1016/j.cegh.2021.100833
45.
Konkor I Sano Y Antabe R Kansanga M Luginaah I . Exposure to mass media family planning messages among post-delivery women in Nigeria: testing the structural influence model of health communication. Eur J Contracept Reprod Health Care. (2019) 24(1):18–23. 10.1080/13625187.2018.1563679
46.
Mutumba M . Mass media influences on family planning knowledge, attitudes and method choice among sexually active men in sub-Saharan Africa. PLoS One. (2022) 17(1):e0261068. 10.1371/journal.pone.0261068
47.
Ahmed M Seid A . Association between exposure to mass media family planning messages and utilization of modern contraceptive among urban and rural youth women in Ethiopia. Int J Womens Health. (2020) 12:719–29. 10.2147/IJWH.S266755
48.
Arsenault C Yakob B Tilahun T Nigatu TG Dinsa G Woldie M et al Patient volume and quality of primary care in Ethiopia: findings from the routine health information system and the 2014 service provision assessment survey. BMC Health Serv Res. (2021) 21(1):485. 10.1186/s12913-021-06524-y
49.
Akoku DA Achombwom Vukugah T Abena Tihnje M Bigweh Nzubepie I . Childbearing intentions, fertility awareness knowledge and contraceptive use among female university students in Cameroon. PLoS One. (2022) 17(10):e0276270. 10.1371/journal.pone.0276270
Summary
Keywords
knowledge, ovulatory cycle, women, spatial analysis, Ethiopia
Citation
Tilahun WM, Yohannes Abay L, Aragaw FM, Abebe Gebreegziabher Z and Tesfie TK (2025) Spatial variation of correct knowledge of the ovulatory cycle and its associated factors among reproductive age women in Ethiopia: geographically weighted regression analysis. Front. Reprod. Health 7:1505749. doi: 10.3389/frph.2025.1505749
Received
03 October 2024
Accepted
21 July 2025
Published
06 August 2025
Volume
7 - 2025
Edited by
Asok K. Dasmahapatra, University of Mississippi, United States
Reviewed by
Peter Ouma Okuma, Government of Kenya, Kenya
David Jean Simon, Université Panthéon Sorbonne, France
Subhadra Priyadarshini, Kalinga Institute of Medical Sciences (KIMS), India
Updates
Copyright
© 2025 Tilahun, Yohannes Abay, Aragaw, Abebe Gebreegziabher and Tesfie.
This is an open-access article distributed under the terms of the Creative Commons Attribution License (CC BY). The use, distribution or reproduction in other forums is permitted, provided the original author(s) and the copyright owner(s) are credited and that the original publication in this journal is cited, in accordance with accepted academic practice. No use, distribution or reproduction is permitted which does not comply with these terms.
* Correspondence: Werkneh Melkie Tilahun werkneh7wmt@gmail.com
Disclaimer
All claims expressed in this article are solely those of the authors and do not necessarily represent those of their affiliated organizations, or those of the publisher, the editors and the reviewers. Any product that may be evaluated in this article or claim that may be made by its manufacturer is not guaranteed or endorsed by the publisher.