 Natalie Midzak
 John Yorks
 Jianglong Zhang1
 Michael Garay
 Olga Kalashnikova
- 1Department of Atmospheric Sciences, University of North Dakota, Grand Forks, ND, United States
- 2NASA Goddard Space Flight Center, Greenbelt, MD, United States
- 3Climate and Radiation Laboratory, NASA Goddard Space Flight Center, Greenbelt, MD, United States
- 4Science Systems and Applications, Inc., Lanham, MD, United States
- 5Department of Meteorology and Atmospheric Science, Pennsylvania State University, State College, PA, United States
- 6Jet Propulsion Laboratory, California Institute of Technology, Pasadena, CA, United States
Smoke aerosols arise from a variety of regional sources and fuel types dependent on the properties of the fire, leading to spatial variability in smoke composition and optical properties. After emission, these aerosols age and mix in the atmosphere with other aerosol species, such as sulfates, altering the optical, and microphysical properties of the smoke aerosols over time. Thus, lidar ratio (extinction to backscatter ratio) derived from lidar sensors exhibit spatiotemporal variability for smoke. Traditional backscatter lidar processing algorithms employ a signal loss method that utilizes the reduction of signals below and above cloud layers, enabling simultaneous retrievals of both layer-averaged lidar ratio and particulate extinction, which avoids the need for assigning lidar ratios based on layer type as is typically used for backscatter lidar algorithms. In this study, the signal loss method, which is traditionally designed for cloud property retrievals, is attempted for elevated smoke plume property retrievals using NASA’s Cloud Physics Lidar (CPL) observations from the 2019 Fire Influence on Regional to Global Environments and Air Quality (FIREX-AQ) field campaign. Good agreement (linear correlation coefficient of 0.67) is found between aerosol optical depth (AOD) derived from the signal loss method and the constrained method, utilizing collocated GOES MAGARA AOD values as constraints for lidar ratio retrievals, for the Williams Flats smoke event. Differences in derived lidar ratios from the signal loss method and the constrained method (13.6 and 7.4%) are found to be smaller than the expected signal loss lidar ratio error estimate of ∼17–23%. A good agreement is also found in lidar ratios derived from this study and from using Differential Absorption Lidar-High Spectral Resolution Lidar (DIAL-HSRL) measurements for the Williams Flats Fire. The lidar ratio statistics of smoke plumes presented in this analysis (51
1 Introduction
Atmospheric aerosols play a critical role in earth’s radiation budget and can negatively affect local air quality and visibility. Thus, passive and active space-based and airborne sensors have been routinely implemented to monitor the distribution and evolution of atmospheric aerosols. While passive sensors provide column-integrated optical properties such as aerosol optical depth (AOD), accurate knowledge of the vertical distribution of aerosol optical properties, such as aerosol extinction, are equally important for a variety of aerosol related applications including the study of aerosol and cloud interactions (Markowicz et al., 2008). Additionally, aerosol induced atmospheric heating is strongly dependent on aerosol vertical distribution (Ban-Weiss et al., 2012).
Backscatter lidar, such as NASA’s Cloud Physics Lidar (CPL), detects backscattered signal that can be further used to retrieve the vertical distribution of aerosol properties, including aerosol extinction. In this approach, aerosol extinction for a given layer is related to range-resolved backscattered averaged signal (Spinhirne et al., 1980) using the extinction-to-backscatter ratio, or the lidar ratio, through an iterative process (Klett, 1981; Fernald, 1984). The lidar ratio is assumed to be constant for a specified layer type; thus, accurate detection of atmospheric aerosol layers is required to obtain the most appropriate extinction coefficient values. Note, while this requirement can pose a problem for space-based lidars such as the Cloud-Aerosol Lidar with Orthogonal Polarization (CALIOP) due to signal attenuation (e.g., Koffi et al., 2012), the higher signal-to-noise ratio of CPL flying on the NASA ER-2 high-altitude aircraft allows for more detections, including tenuous layers, which improves the accuracy of extinction retrievals.
For a given aerosol species, the lidar ratio could vary as a function of aerosol physical properties and environmental conditions (Ferrare et al., 2001). For aerosol layers where an estimate of layer optical depth is not available, a lidar ratio is assigned from a look-up table based on a global or regional climatology (McGill et al., 2003; Hlavka et al., 2012). A significant source of uncertainty in standard backscatter lidar derived aerosol extinction is the layer-average lidar ratio (Fernald 1984; Sasano et al., 1985; Young et al., 2013). Thus, methods must be developed for more accurate retrievals of aerosol extinction and lidar ratio using measurements from standard backscatter lidars such as CALIOP and CPL.
The signal loss method was developed in the past to simultaneously estimate the layer-average lidar ratio and vertical profile of extinction coefficient of clouds by determining the reduction of signal through a layer in favorable conditions (Yorks et al., 2011a). This is the preferred method to assigning a lidar ratio based on aerosol type since the lidar ratio is calculated directly from the lidar data by comparing the loss of signal above and below the layer. The signal loss technique requires an optically thin layer that is the highest layer in the atmosphere (no overlying attenuation), elevated, and directly above clear air. These criteria have traditionally restricted the signal loss method to optically thin clouds. However, McGill et al. (2003) attempted this technique, on a small dataset consisting of an elevated smoke and dust mixture off the coast of Namibia during the Southern African Regional Science Initiative (SAFARI)-2000 field campaign. Additionally, Yorks et al. (2011a) applied this technique on an extensive CPL dataset of cloud layers and found the derived lidar ratios to agree well with previous studies.
The goal of this study is to investigate the feasibility of applying the signal loss method to elevated smoke plumes for accurate retrievals of layer-average lidar ratio and aerosol extinction coefficient vertical profiles using the standard backscatter lidar measurements, as well as for monitoring variations in lidar ratio during smoke transport. Using combined observations from CPL and Geostationary Operational Environmental Satellite (GOES) that were collected in summer 2019 during the Fire Influence on Regional to Global Environments and Air Quality (FIREX-AQ) field campaign, we applied and evaluated, for the first time, the signal loss technique for elevated smoke layers from North American wildfires. In addition, for regions where independent retrievals of column AOD are available, a constrained lidar ratio method is applied for simultaneous retrieval of lidar ratio and aerosol extinction. This approach has commonly been used in the past by combining the active lidar retrieval with a passive sensor such as MODIS to calculate the constrained lidar ratio (e.g., McGill et al., 2003; Burton et al., 2010). In this study, to intercompare with the signal loss-based method, constrained lidar ratio retrievals are derived from CPL using collocated GOES Multi-Angle Aerosol Retrieval Algorithm (MAGARA) retrieved AOD.
This paper is organized as follows: data used in this study and methodology for the lidar ratio calculations are discussed in Data and Methodology; results and discussion follow in Results and Conclusion. Finally, Section 5 includes conclusions of the study.
2 Data and Methodology
2.1 The 2019 Fire Influence on Regional to Global Environments and Air Quality Field Campaign
The FIREX-AQ field campaign was a joint NOAA/NASA study of North American fires that took place during summer 2019. FIREX-AQ aimed to improve the understanding of fire impacts on air quality, weather and climate through a combination of sensor platforms including aircraft, satellite, and ground-based networks (Roberts et al., 2020). During this study, CPL was mounted on board NASA’s ER-2 high-altitude research aircraft, which completed eleven flights over the western United States sampling fires of various sizes and burning fuels in California, Washington, Montana, Arizona and Utah (Table 1). The Airborne Multiangle SpectroPolarimetric Imager (AirMSPI), Enhanced MODIS Airborne Simulator (eMAS), and Airborne Visible/Infrared Imaging Spectrometer (AVIRIS) were also mounted on board the ER-2; however, calibration issues and the difficult nature of AOD retrievals over optically thick smoke plumes for passive sensors limited the feasibility of using coincident retrievals with these sensors and CPL. During FIREX-AQ, NASA’s DC-8 aircraft served as an additional airborne in-situ chemistry laboratory, providing gas and aerosol phase measurements as well as remote sensing retrievals from the MODIS/ASTER Airborne Simulator (MASTER) and the Differential Absorption Lidar-High Spectral Resolution Lidar (DIAL-HSRL). Despite planned coordination during the field campaign, constraints on operations limited the amount of coincident data collection between the two aircraft.
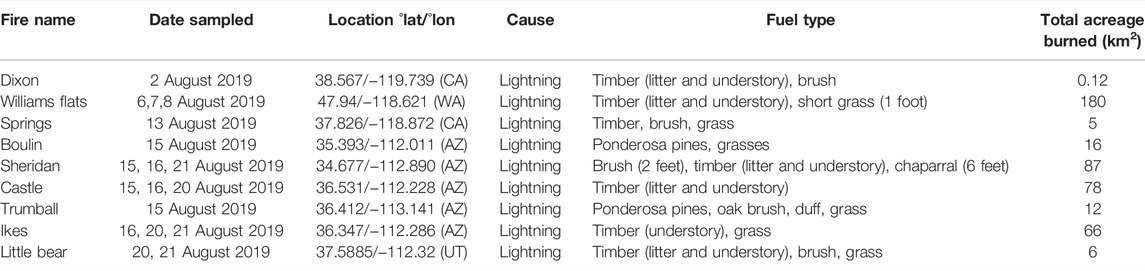
TABLE 1. Summary of fires sampled during the FIREX-AQ field campaign.
For each science flight conducted during the campaign, CPL performed well after an approximate 30-min period of thermal stabilization of the laser while in transit to the observation target. Operationally, CPL is calibrated by normalizing the signal between 15–17 km relative to a modeled profile of molecular attenuated backscatter from Modern-Era Retrospective analysis for Research and Applications, Version 2 (MERRA-2) reanalysis data, and was well calibrated for the duration of the campaign (Pauly et al., 2019). Throughout this campaign, CPL flew over several elevated smoke plumes which were candidates for the signal loss lidar ratio technique. The details of this technique are described below and closely follow the detailed discussion found in McGill et al. (2003) and Yorks et al. (2011a). To invoke this method, the aerosol layer must be optically thin enough to sense a layer below it and must be immediately above a layer of clear air so that reduction of signal through the layer can be quantified.
2.2 Cloud Physics Lidar Data and Lidar Ratio Retrievals
2.2.1 The Standard CPL Aerosol Retrieval Method
The Cloud Physics Lidar (CPL) is an elastic backscatter lidar operating at 355, 532, and 1,064 nm to provide multi-wavelength backscatter measurements of clouds and aerosols with fine horizontal (1 s; 200 m; size of the beam at the surface) and vertical (30 m) resolutions (McGill et al., 2002). While the 1,064 nm channel is utilized for depolarization ratio measurements, backscattered signals from all three wavelengths are available for optical property retrievals. Attenuated total backscatter and depolarization ratio are available as Level 1 data products, while aerosol extinction, layer-integrated lidar ratio and optical depth are archived as Level 2 data products.
The lidar ratio is assumed to be constant throughout the vertical extent of the layer for a given specified layer type; therefore, accurate classification of atmospheric layers by the CPL processing algorithm is required. Atmospheric layers (i.e., clouds and aerosols) are detected using a threshold profile technique (Vaughan et al., 2009; Yorks et al., 2011b). Once a layer is identified, the CPL classification algorithm categorizes each layer as cloud or aerosol using a multidimensional probability density function (PDF) technique, similar to the method utilized for the Cloud-Aerosol Transport System (CATS) lidar that operated on the International Space Station (Yorks et al., 2021). Specific aerosol types are assigned based on layer heights, attenuated backscatter intensity of the 1,064 nm channel, depolarization ratio and attenuated backscatter color ratio (the ratio of 1,064 nm attenuated backscatter to 532 nm attenuated backscatter) thresholds. Ancillary data such as geographic location and surface type are also used.
For identified atmospheric layers, the default lidar ratio is assigned from a look-up table containing values similar to those traditionally used in Geoscience Laser Altimeter System (GLAS), Cloud-Aerosol Lidar and Infrared Pathfinder Satellite Observation (CALIPSO) and CATS algorithms (Palm et al., 2002; Omar et al., 2009; Yorks et al., 2015). These values are based on numerous studies using spaceborne, airborne and ground-based lidar instruments in various regions. The CPL default lidar ratio of a smoke layer is 70.0 sr for a retrieval at 532 nm.
2.2.2 The Signal Loss Method and the Constrained Lidar Ratio Retrieval Method
When considering the total backscattered signal, both the particulate, and molecular contributions must be investigated. To solve for the molecular contribution, Rayleigh theory is invoked to calculate the molecular transmission
The effective particulate two-way transmission at layer bottom, or
Here
Upon deriving the effective particulate two-way transmissions at both the layer top and bottom based on Eq. 1, the optical depth of the layer can be simply computed using Eq. 2:
By defining X as
By rearranging Eq. 3 as Eq. 4, the effective lidar ratio can thus be derived.
Then, to solve for
In this approach, multiple scattering effects are considered negligible for CPL retrievals of optically thin aerosol layers (McGill et al., 2002; McGill et al., 2003; Yorks et al., 2011b). Multiple scattering is primarily a function of particle properties such as number density, size distribution and shape, and the lidar field of view and distance from target (Eloranta, 1998). Typically, these effects are parameterized by a multiple scattering correction factor,
In our investigation, the signal loss technique is applied to CPL 532 nm attenuated backscatter measurements since this wavelength provides both high signal to noise and sufficient molecular return that are necessary to accurately calculate signal loss lidar ratios (McGill et al., 2003). Note that the signal loss technique discussed above summarizes the approach used to solve for the layer-integrated lidar ratio values relying solely on CPL and is applicable only to layers that satisfy the criteria discussed previously.
To inter-compare with the signal loss method, for smoke layers where collocated GOES MAGARA retrieved AOD values (
2.3 Uncertainties in the Lidar Ratio
Two classes of uncertainty contribute to the overall uncertainty in the CPL lidar ratio calculations presented in this study. The first of these is the systematic uncertainty comprised of uncertainty in the CPL calibration, uncertainties in the molecular backscatter computed from MERRA-2 data and uncertainties in the modeled two-way molecular transmittance. As discussed previously, a CPL calibration constant is assigned based on normalizing the signal between 15–17 km relative to a modeled profile of molecular attenuated backscatter from MERRA-2 reanalysis data. Based on the findings of Vaughan et al. (2010), a particulate scattering ratio of 1.27 is applied over the calibration region to account for aerosol loading in a standard Northern Hemisphere atmospheric profile (Pauly et al., 2019). The uncertainty of the calibration
Random error, primarily caused by noise in the CPL lidar signal, must also be accounted for in the overall uncertainty of the signal loss lidar ratio calculations. Eq. 7 adapted from Welton and Campbell (2002) accounts for the variability in the lidar signal within a clear air segment and is given by:
Two separate CPL flights from the FIREX-AQ campaign were analyzed to quantify the random error in this study. The first of these flights was from 12 August in which 250 profiles of clear air were averaged between an altitude of 3.5–4.5 km. This region was selected given that smoke plumes throughout the study were centered at an altitude of approximately 4 km (Table 2). Applying Eq. 7 where N accounts for the 250 profiles used in the averaging interval, the resultant random error in the lidar ratio is approximately 17%. Eq. 7 was applied to an additional CPL flight on 16 August in which 250 profiles were averaged between 3.5–4.5 km to again determine the variability of the lidar signal. In this case, the resultant random error was approximately 23%.
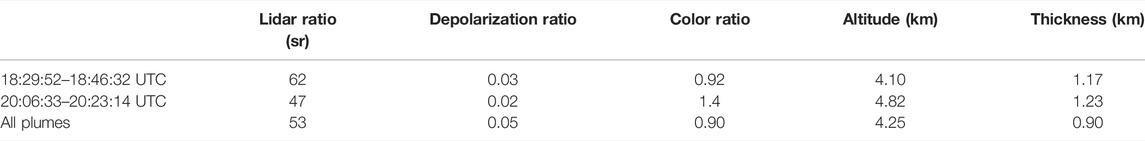
TABLE 2. Summary of smoke plume characteristics from the Williams Flats Fire flown on 8 August 2019. Median values of Williams Flats Fire plume characteristics.
Finally, the total error can be determined through Eq. 8.
resulting in a total error estimate for the CPL signal loss lidar ratio calculation of 17–23% for the FIREX-AQ field campaign.
2.4 GOES MAGARA AOD Retrievals
The multiangle geostationary aerosol retrieval algorithm (MAGARA; Limbacher and Kahn, 2019; Limbacher et al., 2022 (in preparation) represents a novel aerosol retrieval algorithm capable of retrieving AOD at 550 nm and fine-mode fraction (FMF) at the native cadence of observation from the satellite (currently 10 min) and pixel-size (for the blue-band; 1 km at the nadir sub-spacecraft point) of the Advanced Baseline Imager (ABI) found onboard both GOES-East [GOES-16 (R)] and GOES-West [GOES-17 (S)]. The algorithm ingests five channels of shortwave reflectances from either (or both) GOES ABI sensors, interpolating these reflectances to a common grid, and then tiling those data over a period of time ranging from a week to a month.
For each pixel in the aerosol retrieval, the algorithm then retrieves the following daily-averaged fine-and-coarse mode aerosol particle properties (at 550 nm): fine-mode effective radius (in microns), fine-mode single-scattering albedo, fine-mode single-scattering albedo spectral slope (brown vs. black smoke), and coarse-mode sphericity (dust vs. spherical). The retrieved particle properties are exactly as found in Junghenn Noyes et al. (2020).
This retrieval of daily-averaged aerosol particle properties is done in an iterative manner with the retrieval of surface reflectance, with dynamic weighting used to prevent (likely) clouds from impacting the retrieval. Rather than trying to retrieve a temporally evolving surface reflectance, the algorithm ingests the changes in surface reflectance (over the tiling period) from the MODIS Multi-Angle Implementation of Atmospheric Correction (MAIAC; MCD19A3; Lyapustin et al., 2018), and then retrieves the average surface reflectance for a given time-of-day and channel, under the assumption that the changes from day-to-day are well characterized by MAIAC. Aside from the assumption that the surface reflectance changes linearly with day, MAGARA does not rely on a surface reflectance model, which means that if we report results every 10 min for the brightest 12 h of the day, the algorithm will retrieve about 70 sets of independent surface reflectances (5 or 10 channels per set). To adequately characterize the surface reflectance for any given time-of-day, the algorithm requires at least 2 cloud-free (and low aerosol loading) views for that given time of day, with enough cloud-free times (during a low AOD day) to accurately characterize the average AOD.
Once the surface reflectance and daily aerosol properties have been retrieved, the algorithm then retrieves AOD and FMF at 550 nm by identifying the optimal FMF for every point on our input AOD grid via non-negative least-squares (NNLS; Lawson and Hanson, 1995), and then using Newton’s method to identify the best fitting AOD (Limbacher and Kahn, 2019; Limbacher et al., 2022; in preparation).
In this study we validated GOES MAGARA AOD data against ground-based spectrally interpolated (using a 2nd-order polynomial fit in log-log space) AERONET AOD for the study region during the study period as shown in Figure 1. Figure 1 shows GOES-West true color imagery (left) and 550 nm MAGARA AOD (right) with AERONET locations overlaid (circles) and the corresponding AOD retrievals at ∼9:10 AM on 7 August 2019, for the region affected by smoke from the Williams Flats Fire. Additionally, a comparison of GOES MAGARA and AERONET AOD retrievals within this Williams Flats (same domain as in the imagery) domain is shown in Figure 1 (bottom) for 4,795 data points. A complete list of AERONET locations and the number of collocations with high quality MAGARA retrievals is listed in Appendix A. The resultant linear correlation coefficient of this dataset is 0.737 with a mean absolute error of 0.014 and root mean squared error of 0.033. Collocated data points are those within a 10- by 10-pixel box surrounding the AERONET site with cloud screening applied and a minimum cost function (χ2 value) less than 1.0. Additionally, the selection criteria for AERONET is the mean 550 nm AOD within
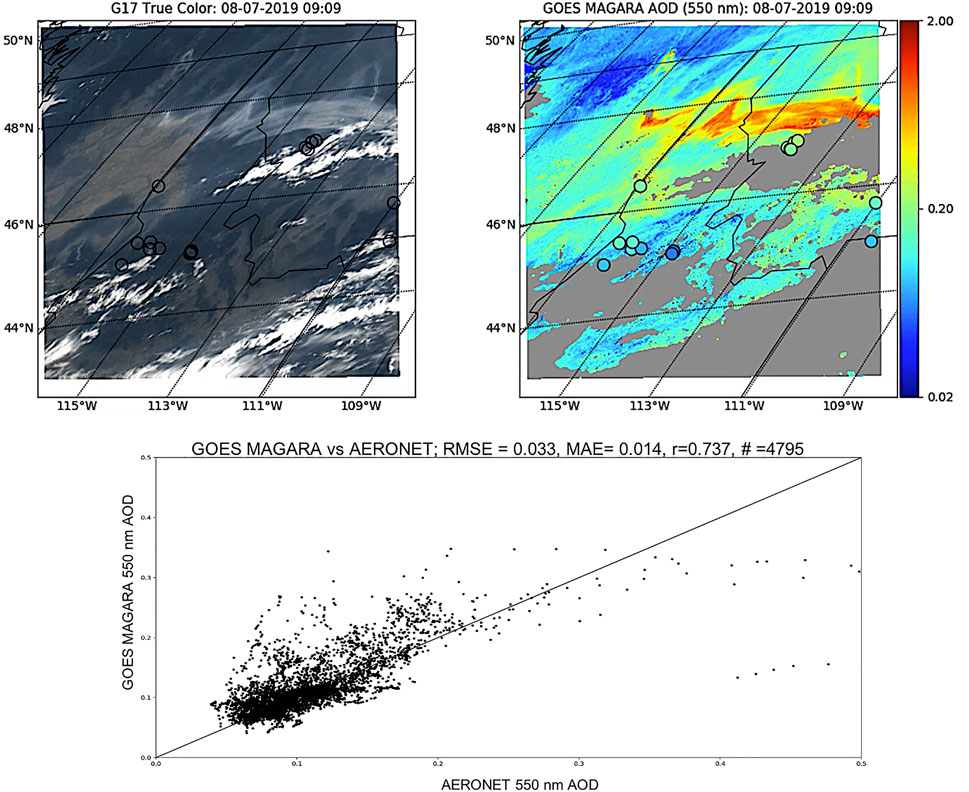
FIGURE 1. GOES-West [GOES-17 (S)] true color imagery of smoke from 7 August 2019 (left) and the GOES MAGARA 550 nm AOD for the same scene (right) with AERONET locations denoted by circles which are filled with the corresponding AOD values. A scatter plot is also presented (bottom) comparing GOES MAGARA AOD to AERONET AOD for 4,795 collocated data points and the calculated statistics.
3 Results
3.1 Case Studies
The first case study presented in this analysis is of the Williams Flats Fire, which was located approximately 80 km (50 miles) northwest of Spokane, Washington and was ignited on 2 August 2019 from a lightning strike. This fire burned close to 45,000 acres (182 km2) and was categorized by the United States Forest Service as a creeping fire with fuels including timber, grass and decadent bitterbrush with some heavily logged areas. Figure 2A shows CPL 532 nm total attenuated backscatter of a Williams Flats smoke plume overpass completed by the ER-2 on 8 August 2019. For layers within the plume where the solution to the iterative lidar ratio calculation did not converge to a set tolerance (0.08 sr) or where the number of iterations to reach convergence was too large (100 iterations), the lidar ratio was not calculated resulting in vertical gaps in the image in Figure 2B. For the smoke layers where lidar ratios were successfully calculated, the general shape of the plume is evident and follows that of the total attenuated backscatter images. The lidar ratio values, along with other CPL derived parameters including depolarization ratio, color ratio, plume altitude, and thickness, are summarized in Table 2 for individual plumes and for all plumes sampled from this fire. The overpass of the plume sampled from 18:29:52–18:46:32 UTC (Figure 2A) was located approximately 240 km from the flaming source. The associated lidar ratios for this plume calculated using the signal loss lidar ratio technique are shown in Figure 2B. The median lidar ratio value of this plume was 62 sr with a median plume height centered at 4.10 km and a plume thickness of 1.17 km. A NOAA Hybrid Single-Particle Lagrangian Integrated Trajectory (HYSPLIT; Stein et al., 2015) back trajectory ensemble analysis for this plume is pictured in Figure 3A on 08 August 2019 beginning at 18:00 UTC. The trajectory tracks the path of the plume from the CPL location at the median smoke plume altitude (4.1 km) backward in time. The location of the Williams Flats Fire is marked within the source region confirming the plume’s origin is from Williams Flats.
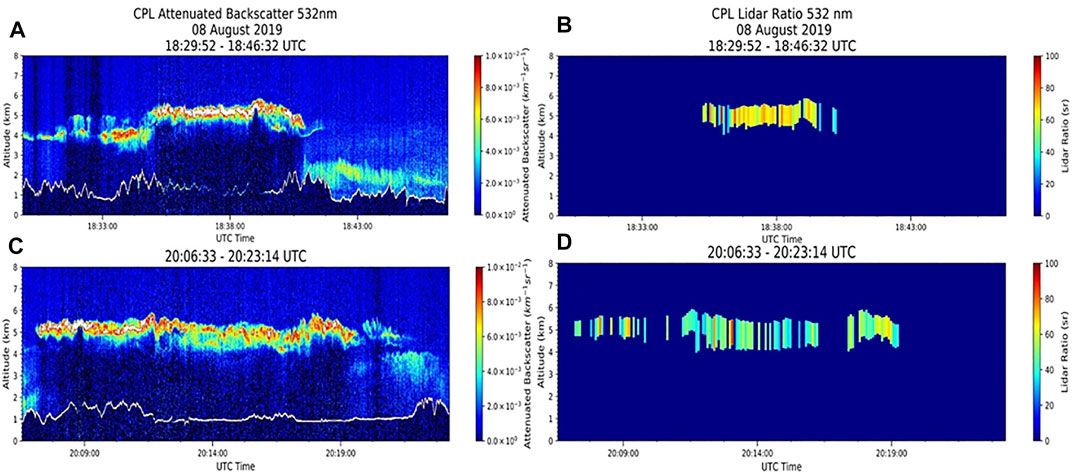
FIGURE 2. CPL 532 nm attenuated backscatter curtain plots (A,C) for the 18:29:52–18:46:32 UTC (top) and 20:06:33–20:23:14 UTC (bottom) smoke plumes sampled during an overpass of the Williams Flats Fire on 8 August 2019 and the corresponding signal loss calculated lidar ratio values curtain plots (B,D).
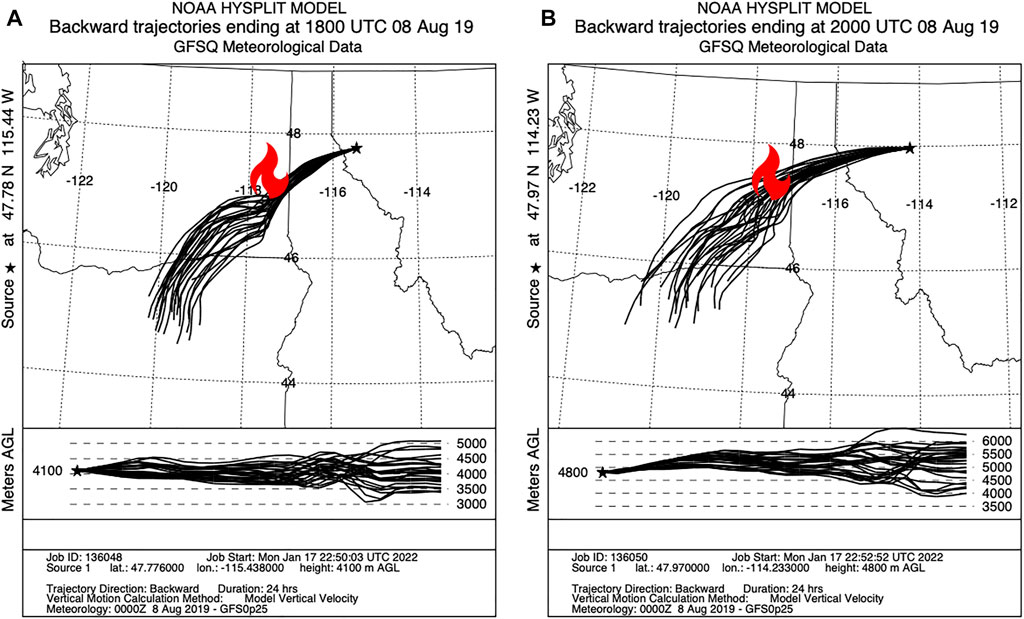
FIGURE 3. NOAA HYSPLIT ensemble back trajectories from the median smoke plume thickness beginning at 18:00 UTC [(A); left] and 20:00 UTC [(B); right] on 8 August 2019. The location of the Williams Flats Fire is indicated (red flame) in the source region of the smoke plumes sensed by CPL.
The second plume showcased (Figures 2C, D) was sampled from 20:06:33–20:23:14 UTC at a location approximately 330 km from the fire source. This plume again shows the general characteristics (shape, thickness, altitude) evident in the total attenuated backscatter image, but has a smaller retrieved median lidar ratio value than the previous case (47 vs. 62 sr) and was slightly higher in altitude (median altitude centered at 4.82 vs. 4.10 km) and a plume thickness of 1.24 km, compared to 1.17 km. The overall median lidar ratio value of all plumes for the Williams Flats Fire was 53 sr with a median smoke layer altitude of 4.25 km. A NOAA HYSPLIT back trajectory for this plume is shown in Figure 3B on 8 August 2019 beginning at 20:00 UTC. The air parcels at an altitude corresponding to the median smoke plume altitude (4.8 km) were traced backward in time and again confirm the source of this plume is the Williams Flats Fire.
The lidar ratio has been found to depend on the size and absorption properties of particles (Müller et al., 2007), but can also vary based on the chemical composition of the particles, which is inherently dependent on the smoke source region, available moisture and type of fire from which the smoke plumes are produced (Nicolae et al., 2013). Even from similar source regions, variations in chemical, physical and optical properties of biomass burning aerosols have been found such as in Junghenn Noyes et al. (2020) in which differences in particle size and absorption properties were observed in different regions of the Williams Flats Fire plume on 6 August. With the combined use of in-situ and remote sensing data, small yet highly absorbing particles were found near the smoke source region, while particles larger in size with an increasing amount of weakly-absorbing aerosols were found from downwind observations (Junghenn Noyes et al., 2020). Given these findings, it is likely that variations in the lidar ratio values are due to more weakly-absorbing particles than their fresh smoke counterparts.
In addition, Figure 4 highlights the change in lidar ratio with distance from the fire for the Williams Flats for all the smoke plumes analyzed here. As the distance from the fire source increases, the 532 nm layer-mean lidar ratio decreases from a median value of 62 sr to a value of 47 sr over a distance of approximately 120 km. As discussed previously, studies have reported that lidar ratio can vary depending on the size and absorption properties of particles (Müller et al., 2007). As plumes are transported, the particles can uptake water and swell (Kar et al., 2018) leading to larger particles which exhibit a reduction of their light absorption capabilities (Müller et al., 2007), thus impacting the lidar ratio. These findings, corroborated with the results of Junghenn Noyes et al. (2020), suggest that in the case of the Williams Flats smoke plumes, particles grew as they were transported from the fire leading to lower lidar ratio values as their extinction characteristics changed.
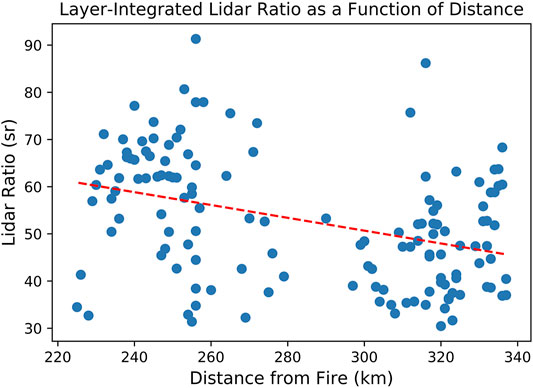
FIGURE 4. Evolution of the 532 nm layer-integrated lidar ratio calculated using the signal loss technique for the Williams Flats Fire as a function of distance from the fire.
The second event this study focused on was the Sheridan Fire, which was centered approximately 37 km (23 miles) northwest of Prescott, Arizona. This fire was ignited from lightning and grew to encompass approximately 22,000 acres (89 km2), while burning materials such as brush and timber with isolated patches of Ponderosa pines. This was a smoldering fire located in a mountainous environment and plumes from the Sheridan fire were very localized in contrast to the Williams Flats Fire, as is evident in the CPL 532 nm total attenuated backscatter imagery of the Sheridan Fire overpass on 15 August 2019 (Figure 5, left). While the plumes of the previous case extended 78 km horizontally, plumes from the Sheridan Fire had a horizontal extent of only approximately 17 km. The calculated signal loss lidar ratio values from CPL for the plume near the fire source are highlighted in Figure 5 (right). In contrast to the first case analysis, the CPL overpasses of the Sheridan Fire were directly over the source. Signal loss lidar ratio convergence is not evident throughout the entire extent of the plume, but general plume characteristics that are present in the total attenuated backscatter images are also seen in the lidar ratio curtain plots. Since multiple overpasses of the Sheridan fire were completed in approximately the same location and thus no transport or aging of the smoke plume was sampled, only summary statistics of the fire are presented (Table 3). The overall lidar ratio values from the Sheridan fire are lower than of the previous case study, with a median value of 48 sr (vs. 53 sr), while the median altitude (4.16 km) and thickness (1.19 km) of the smoke plumes remain similar between the case studies.
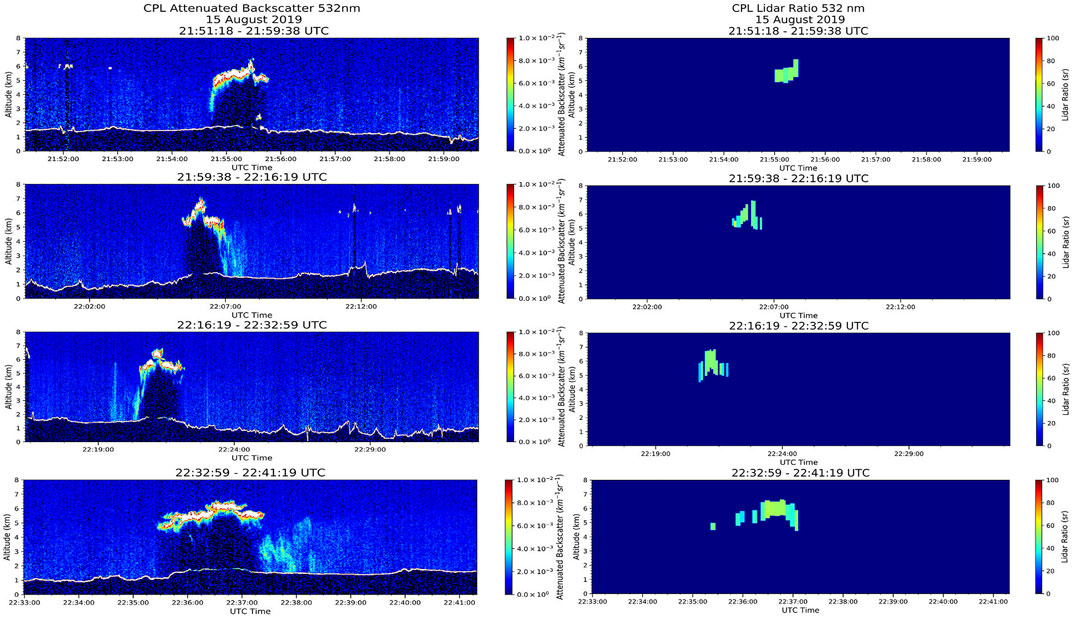
FIGURE 5. CPL 532 nm attenuated backscatter curtain plots (left) for smoke plumes sampled during multiple overpasses of the Sheridan Fire on 15 August 2019 and the corresponding signal loss calculated lidar ratio values curtain plots (right).

TABLE 3. Summary of smoke plume characteristics from the Sheridan Fire flown on 15 August 2019. Median vales of Sheridan Fire plume characteristics.
3.2 Smoke Optical Properties Statistics for FIREX-AQ
The particulate optical depth was estimated for smoke plumes where lidar ratio was calculated using the signal loss technique. Data from eleven FIREX-AQ flights are included in Figure 6 showing the distribution of CPL 532 nm smoke AOD. From this figure it is evident that two peaks of smoke AODs exist, the first at 0.5 and the second at 2.7. The peak at smaller AOD values is heavily influenced by the Sheridan Fire observations, while the peak at higher AODs is comprised mostly of data from the 8 and 21 August flights sampling Williams Flats, Little Bear and Ikes fires, which exhibit higher lidar ratio values. These results are consistent with McGill et al. (2003) in which high AOD environments were found to have the highest mean lidar ratio values. This distribution highlights the applicability of the signal loss technique in both light and heavy aerosol loading environments.
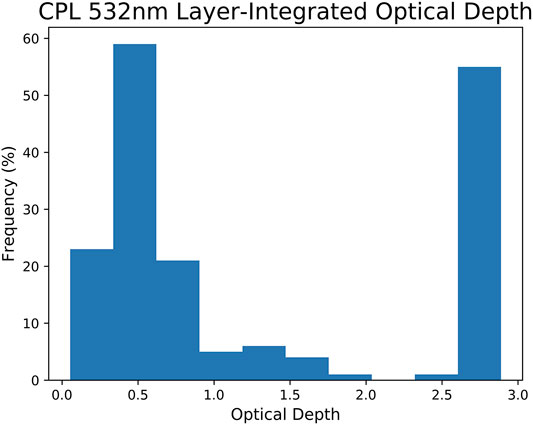
FIGURE 6. Distribution of the 532 nm layer-integrated optical depth values calculated for all smoke plumes sampled by CPL during the FIREX-AQ campaign.
The 20:06:33–20:23:14 UTC plume from Williams Flats on 8 August 2019 sampled by CPL (Figure 2) was collocated with GOES AODs retrieved using the MAGARA algorithm. The distributions of AOD values from GOES (blue) and CPL signal loss method (orange) are shown in Figure 7 for the pixels within the smoke plume collocated with the CPL data. A maximum time difference of 15 min was allowed between CPL and GOES MAGARA retrievals to be considered collocated temporally. Spatial collocation was completed by matching the CPL pixel to the nearest located GOES pixel within 1 km. Depending on satellite viewing angle, the GOES MAGARA AOD resolutions were approximately 2–3 km and the closest CPL AOD values were averaged for each collocated point. Both sensors derive AOD values that are in good agreement, with CPL AOD values centered at 0.59

FIGURE 7. Distributions of collocated retrievals of AOD values for the Williams Flats Fire from GOES (blue) and CPL signal loss technique (orange) and CPL modified default technique (green).
3.3 Intercomparison of Lidar Ratio and AOD Retrievals From the Signal Loss and the Constrained Lidar Ratio Methods
For smoke layers within the 20:06:33–20:23:14 UTC overpass, we implemented and compared aerosol retrievals from both the signal loss and the constrained lidar ratio methods. Note that here we applied a given method to smoke layers wherever applicable, and while the GOES AOD constrained method was applied over the entire overpass of the plume, only 46% of the flight track was eligible for the signal loss method. Thus, it is important to note that this analysis is not an “apples to apples” comparison of the smoke plume observations, but a demonstration of two techniques for the calculation of smoke lidar ratio values within layers of the Williams Flats Fire smoke plume. A point-to-point comparison is also implemented and is discussed in a later paragraph. Here, for the constrained lidar ratio method, collocated MAGARA GOES AOD values are used as an independent constraint for the lidar ratio calculations.
These results are shown in Figure 8 for lidar ratios calculated using the independent AOD constraint (right) and for the signal loss technique (left) for layers within the plume. Overall, the portions of the plume where the signal loss technique was applied resulted in a mean lidar ratio of 49
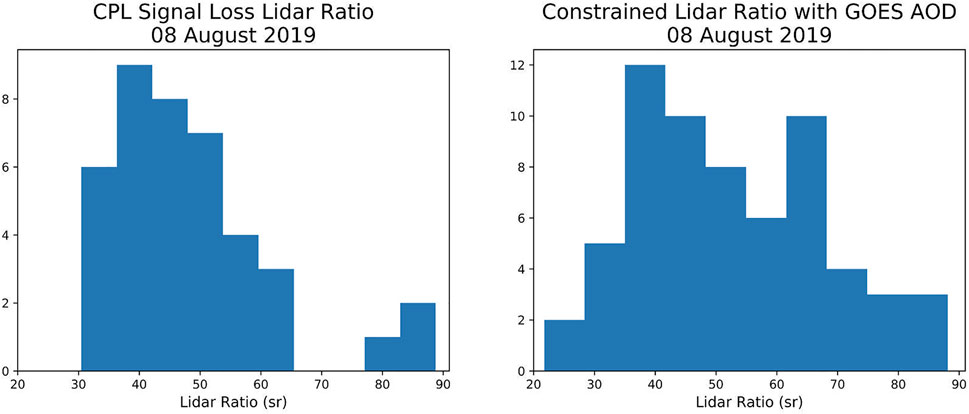
FIGURE 8. Distributions of lidar ratio values for the Williams Flats Fire utilizing GOES MAGARA AOD as a constraint (right) and calculated using the CPL signal loss method (left).
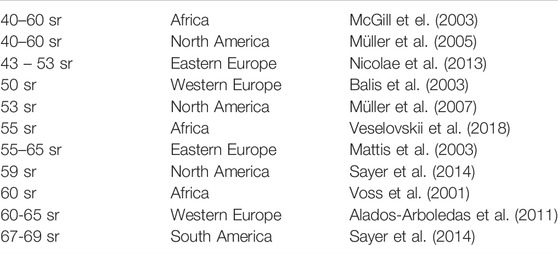
TABLE 4. Previously published smoke lidar ratio values from various locations.
A point-to-point comparison of collocated GOES MAGARA and CPL signal loss derived AOD values (i.e., using the exact same bins for both techniques) for both the Williams Flats and Sheridan fires are shown in Figure 9 (left panel). The calculated lidar ratio values using the GOES MAGARA AOD constraint along with the collocated CPL signal loss lidar ratio values for both fires are also presented in Figure 9 (right panel). Colored points (blue) are those with either CPL signal loss derived or GOES MAGARA AOD values greater than 1.5 and an AOD value which is two times greater than the collocated counterpart. Colored points (green) are those in which the signal loss method has a high AOD bias due to the presence of an overlying tenuous layer approximately 0.5 km above the primary smoke plume that was not detected as a layer in CPL data processing. Since the signal loss method assumes molecular scattering above the layer with no attenuation from particulates, the particulate layer above the primary smoke plume negates this assumption, leading to erroneous high values in both the particulate backscatter and extinction coefficient at the bottom bin of the smoke plume layer. Since these biases are found in both variables, the lidar ratio value is still reasonable as these biases cancel out, but should be taken with a grain of salt.
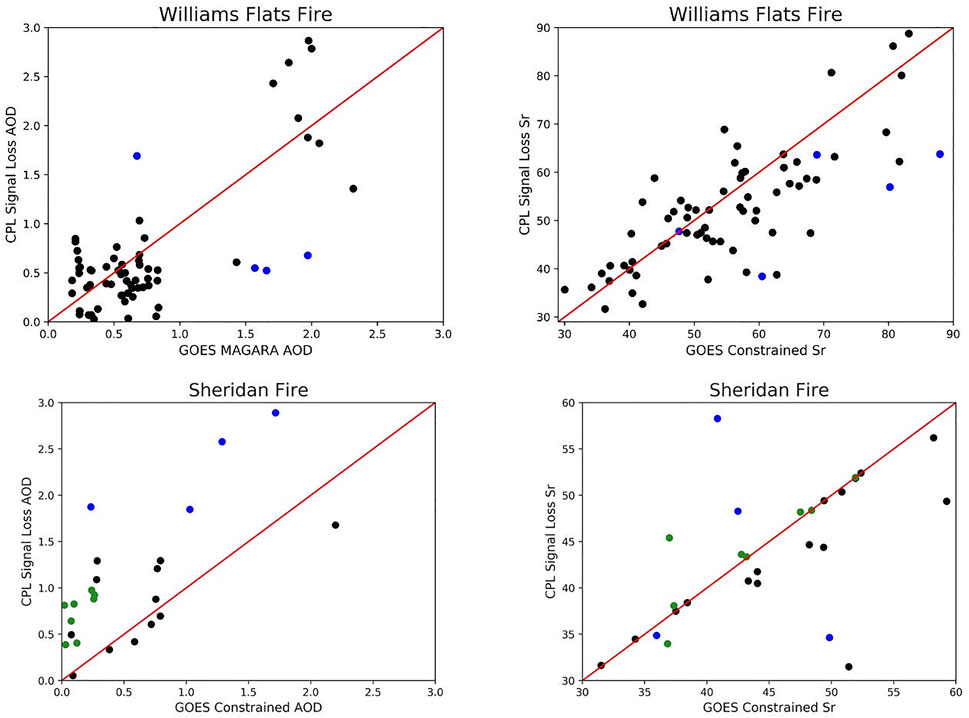
FIGURE 9. Point by point comparison of collocated GOES MAGARA AOD and CPL AOD retrievals (left) for the Williams Flats and Sheridan fire case studies, along with GOES MAGARA constrained lidar ratio values and CPL signal loss calculated lidar ratios (right). Blue colored points indicate values with larger discrepancies between the two retrievals likely due to potential MAGARA cloud masking biases or the effects of CPL layer boundary detection issues. Green colored points indicate values where the signal loss method has a high bias in the smoke plume AOD due to the presence of a tenuous layer above the primary smoke plume.
There are two possible sources of AOD discrepancies between MAGARA and CPL. The first source is potential MAGARA cloud masking biases. Because the selected aerosol model is more important as AOD increases, imperfections in the daily-retrieved fine-and-coarse mode properties will be more important at higher AOD. This means as AOD increases, the value of the minimized cost function generally increases as well. Since we are screening for clouds partly based on this cost function, it is quite likely that significant amounts of thick smoke plumes are masked. The second source are possible overlying particulate layers, either an optically thin cirrus cloud or aerosol layer, not detected by the CPL layer detection algorithm, as highlighted by the green dots in Figure 9 (bottom panel) and explained above. However, in general, the retrieved AOD values agree well in both cases, even though only several dozen collocation points were available (∼30 for the Sheridan Fire and ∼70 for the Williams Flats Fire). The majority of AOD values in both case studies were below an AOD of 1.0. There is slightly better agreement in the Williams Flats case where there are more observations. The linear correlation coefficient for the regression between GOES MAGARA and CPL signal loss AOD is 0.72 and 0.68 for the Williams Flats Fire and Sheridan Fire, respectively. The lidar ratio correlation coefficient for both cases is very similar, with an R value of 0.74 for the Williams Flats case study and 0.68 for the Sheridan fire. Additionally, the RMS error and mean absolute error in lidar ratio for the Williams Flats case are 10 and 7 sr, respectively. The Sheridan Fire lidar ratio error values are lower, with an RMS error of 7sr and mean absolute error of 4 sr. For both cases errors in the lidar ratio values are in line with the expected signal loss lidar ratio error estimate of ∼17–23% reported in Section 2.5. In general, the CPL signal loss technique produces very good agreement with the lidar retrievals using collocated GOES MAGARA AODs as constraints. The summary statistics for these comparisons, and for the points where attenuation due to an overlying layer causes a high AOD bias, are provided in Table 5. This close agreement bolsters confidence in the CPL signal loss technique applied throughout this study. Additionally, these lidar ratio values continue to align with previous findings of smoke plume lidar ratios below 70 sr (Table 4) and further suggest the historical smoke lidar ratio default value of 70 sr is too high for smoke plumes sampled in this study.
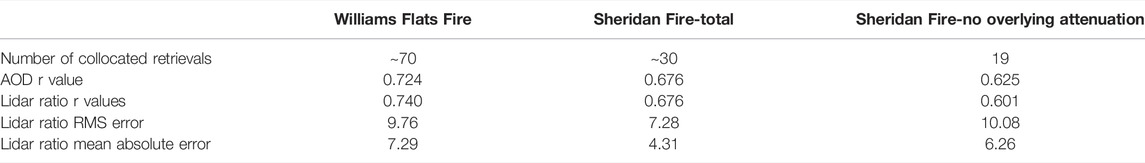
TABLE 5. Summary statistics for collocated GOES MAGARA and CPL retrievals for the Williams flats and Sheridan fires.
3.4 Intercomparison of Lidar Ratio Retrievals From the Signal Loss Method and the DIAL–HSRL Data
A direct comparison of NASA DIAL–HSRL data was also made to CPL retrievals from the Williams Flats Fire. The DIAL-HSRL system makes DIAL ozone profile measurements in the UV (Browell et al., 1998), in addition to standard backscatter aerosol and cloud measurements at 355 and 1,064 nm. Utilizing the HSRL technique, DIAL-HSRL also provides 532 nm extinction values (Hair et al., 2008). During the FIREX-AQ field campaign DIAL-HSRL was mounted onboard the NASA DC-8 aircraft, while CPL was on board the NASA ER-2. For the Williams Flats Fire, the DC-8, and ER-2 aircraft did not sample plumes simultaneously. However, a comparison of retrieved lidar ratio values from both sensors was still explored. DIAL-HSRL 532 nm lidar ratio retrievals are made at a 270 m vertical resolution, while the CPL 532 nm lidar ratios are layer-integrated values. DIAL-HSRL 532 nm lidar ratio values were compared to CPL 532 nm lidar ratio values for the two plumes shown in Figure 2. Although DIAL-HSRL data are not spatially (offset by ∼25 km) or temporally (offset by ∼3 h) collocated, good agreement exists between the lidars (Table 6). HYSPLIT forward parcel trajectories were performed from the time and location of the CPL overpasses to confirm the same plumes were compared in this analysis. For the first plume sampled by CPL during this event (18:29:52–18:46:32 UTC), a median lidar ratio value of 62 sr was retrieved by CPL compared to 61 sr for DIAL-HSRL. A similar analysis found good agreement (CPL lidar ratio 47 sr and DIAL-HSRL lidar ratio 53 sr) for the second plume (Figure 2C). Despite temporal and spatial offsets, these results highlight good agreement between the sensors utilizing the most direct comparison available.
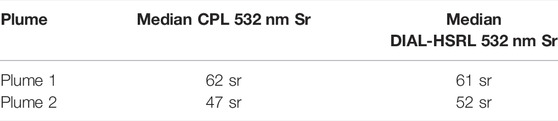
TABLE 6. Comparison of CPL and DIAL-HSRL 532 nm lidar ratio values for the Williams Flats Fire.
4 Conclusion
In this study, the signal loss method, which was developed for simultaneous retrievals of both aerosol extinction and lidar ratio, was applied to observations from CPL during the 2019 FIREX-AQ field campaign. The AOD values derived from the signal loss method are evaluated against AOD retrievals from GOES. Both lidar ratio and AOD retrievals from the signal loss method are also inter-compared with lidar ratio and AODs derived through the constrained lidar ratio method that uses MAGARA GOES AOD as a constraint during the lidar retrieval process.
The results presented in this study highlight two important findings. The first of these is the successful application of the CPL signal loss lidar ratio calculations for elevated smoke plumes sampled during the FIREX-AQ field campaign. To the authors’ knowledge, the present study showcases one of the first successful applications of the signal loss lidar ratio calculation technique on an extensive dataset of aerosol layers comprised of eleven CPL flights of fires in the western United States. The signal loss method is typically restricted to optically thin cloud layers. An advantage of this method is the direct estimate of signal loss through a layer, which eliminates the need for an assumed lidar ratio or an independent collocated AOD retrieval to constrain the calculation. When directly comparing the lidar ratios derived from the signal loss technique to those estimated by using MAGARA GOES AODs as a constraint, the relative error was less than 14% (13.6% for the Williams Flats Fire and 7.4% for the Sheridan Fire), suggesting the signal loss technique provides robust layer-mean lidar ratio estimates of lofted smoke plumes. Backscatter lidar algorithms, both for existing systems like CPL and future space-based sensors, could incorporate the signal loss technique to improve aerosol extinction retrievals.
The second important finding of this study is the wide range of smoke lidar ratios and their potential relationship to the age or transport distance of the smoke plume. The lidar ratio statistics of smoke plumes presented in this analysis (51
Data Availability Statement
Publicly available datasets were analyzed in this study. This data can be found here: https://cpl.gsfc.nasa.gov.
Author Contributions
NM, JY, JZ and OK designed the study. NM implemented the experiment. JL provided GOES related analysis. OK, JZ, JY and MG provided valuable comments to the study. All authors were involved in writing or revising the manuscript.
Funding
This study is supported by the NASA grant 80NSSC18K0887 and the JPLYIP-SUM internship program. Author JZ was supported by the ONR grant (N00014-16-1-2040) and NASA grant (80NSSC20K1260).
Conflict of Interest
The reviewer DP declared a shared affiliation with one of the author, JL, to the handling editor at time of review.
Author JL was employed by the company Science Systems and Applications, Inc.
The remaining authors declare that the research was conducted in the absence of any commercial or financial relationships that could be construed as a potential conflict of interest.
Publisher’s Note
All claims expressed in this article are solely those of the authors and do not necessarily represent those of their affiliated organizations, or those of the publisher, the editors and the reviewers. Any product that may be evaluated in this article, or claim that may be made by its manufacturer, is not guaranteed or endorsed by the publisher.
Acknowledgments
We are grateful for the advice and contributions from the entire FIREX-AQ Science Team, especially NASA Project Manager Barry Lefer and NOAA Program Manager Gregory Frost. A portion of this research was carried out at the Jet Propulsion Laboratory, California Institute of Technology, under a contract with the National Aeronautics and Space Administration. We thank the AERONET team for sun-photometer data used in this study.
References
Alados-Arboledas, L., Müller, D., Guerrero-Rascado, J. L., Navas-Guzmán, F., Pérez-Ramírez, D., and Olmo, F. J. (2011). Optical and Microphysical Properties of Fresh Biomass Burning Aerosol Retrieved by Raman Lidar, and star‐and Sun‐photometry. Geophys. Res. Lett. 38 (1), L01807. doi:10.1029/2010GL045999
Balis, D., Amiridis, V., Zerefos, C., Gerasopoulos, E., Andreae, M., Zanis, P., et al. (2003). Raman Lidar and Sunphotometric Measurements of Aerosol Optical Properties over Thessaloniki, Greece during a Biomass Burning Episode. Atmos. Environ. 37 (32), 4529–4538. doi:10.1016/s1352-2310(03)00581-8
Ban-Weiss, G. A., Cao, L., Bala, G., and Caldeira, K. (2012). Dependence of Climate Forcing and Response on the Altitude of Black Carbon Aerosols. Clim. Dyn. 38 (5), 897–911. doi:10.1007/s00382-011-1052-y
Browell, E. V., Ismail, S., and Grant, W. B. (1998). Differential Absorption Lidar (DIAL) Measurements from Air and Space. Appl. Phys. B: Lasers Opt. 67, 399–410. doi:10.1007/s003400050523
Burton, S. P., Ferrare, R. A., Hostetler, C. A., Hair, J. W., Kittaka, C., Vaughan, M. A., et al. (2010). Using Airborne High Spectral Resolution Lidar Data to Evaluate Combined Active Plus Passive Retrievals of Aerosol Extinction Profiles. J. Geophys. Res. Atmospheres. 115 (D4), D00H15. doi:10.1029/2009jd012130
Cattrall, C., Reagan, J., Thome, K., and Dubovik, O. (2005). Variability of Aerosol and Spectral Lidar and Backscatter and Extinction Ratios of Key Aerosol Types Derived from Selected Aerosol Robotic Network Locations. J. Geophys. Res. Atmospheres. 110 (D10), D10S11. doi:10.1029/2004jd005124
Eloranta, E. W. (1998). Practical Model For The Calculation Of Multiply Scattered Lidar Returns. Applied Optics 37 (12), 2464–2472.
Fernald, F. G. (1984). Analysis of Atmospheric Lidar Observations: Some Comments. Appl. Opt. 23 (5), 652–653. doi:10.1364/ao.23.000652
Fernald, F. G., Herman, B. M., and Reagan, J. A. (1972). Determination of Aerosol Height Distributions by Lidar. J. Appl. Meteorol. 11 (3), 482–489. doi:10.1175/1520-0450(1972)011<0482:doahdb>2.0.co;2
Ferrare, R. A., Turner, D. D., Brasseur, L. H., Feltz, W. F., Dubovik, O., and Tooman, T. P. (2001). Raman Lidar Measurements of the Aerosol Extinction-To-Backscatter Ratio over the Southern Great Plains. J. Geophys. Res. 106 (D17), 20333–20347. doi:10.1029/2000jd000144
Hair, J. W., Hostetler, C. A., Cook, A. L., Harper, D. B., Ferrare, R. A., Mack, T. L., et al. (2008). Airborne High Spectral Resolution Lidar for Profiling Aerosol Optical Properties. Appl. Opt. 47, 6734. doi:10.1364/AO.47.006734
He, Q., Mao, J., Lau, A. K. H., and Li, C. (2006). A Study On The Aerosol Extinction-To-Backscatter Ratio With Combination Of Micro-Pulse LIDAR and MODIS over Hong Kong. Atmos. Chem. Phy. 6 (11), 3243–3256. doi:10.5194/acp-6-3243-2006
Hlavka, D. L., Yorks, J. E., Young, S. A., Vaughan, M. A., Kuehn, R. E., McGill, M. J., et al. (2012). Airborne Validation of Cirrus Cloud Properties Derived from CALIPSO Lidar Measurements: Optical Properties. J. Geophys. Res. Atmospheres. 117 (D9), D09207. doi:10.1029/2011jd017053
Junghenn Noyes, K. T., Kahn, R. A., Limbacher, J. A., Li, Z., Fenn, M. A., Giles, D. M., et al. (2020). Wildfire Smoke Particle Properties and Evolution, from Space-Based Multi-Angle Imaging II: The Williams Flats Fire during the FIREX-AQ Campaign. Remote Sensing. 12, 3823. doi:10.3390/rs12223823
Kar, J., Vaughan, M., Tackett, J., Liu, Z., Omar, A., Rodier, S., et al. (2018). Swelling of Transported Smoke from savanna Fires over the Southeast Atlantic Ocean. Remote sensing Environ. 211, 105–111. doi:10.1016/j.rse.2018.03.043
Klett, J. D. (1981). Stable Analytical Inversion Solution for Processing Lidar Returns. Appl. Opt. 20 (2), 211–220. doi:10.1364/ao.20.000211
Koffi, B., Schulz, M., Bréon, F. M., Griesfeller, J., Winker, D., Balkanski, Y., et al. (2012). Application of the CALIOP Layer Product to Evaluate the Vertical Distribution of Aerosols Estimated by Global Models: AeroCom Phase I Results. J. Geophys. Res. Atmospheres 117 (D10), D10201. doi:10.1029/2011jd016858
Lawson, C. L., and Hanson, R. J. (1995). Solving Least Squares Problems. Philadelphia, Pennsylvania: Society for Industrial and Applied Mathematics.
Limbacher, J., and Kahn, R. A. (2019). “A Multi-Angle Geostationary Aerosol Retrieval Algorithm,” in AGU Fall Meeting Abstracts, 2019, A33G–A06.
Lyapustin, A., Wang, Y., Korkin, S., and Huang, D. (2018). MODIS Collection 6 MAIAC Algorithm. Atmos. Meas. Tech. 11 (10), 5741–5765. doi:10.5194/amt-11-5741-2018
Markowicz, K. M., Flatau, P. J., Kardas, A. E., Remiszewska, J., Stelmaszczyk, K., and Woeste, L. (2008). Ceilometer Retrieval of the Boundary Layer Vertical Aerosol Extinction Structure. J. Atmos. Oceanic Technology. 25 (6), 928–944. doi:10.1175/2007jtecha1016.1
Mattis, I., Ansmann, A., Wandinger, U., and Müller, D. (2003). Unexpectedly High Aerosol Load in the Free Troposphere over central Europe in spring/summer 2003. Geophys. Res. Lett. 30 (22), 2178. doi:10.1029/2003gl018442
McGill, M., Hlavka, D., Hart, W., Scott, V. S., Spinhirne, J., and Schmid, B. (2002). Cloud Physics Lidar: Instrument Description and Initial Measurement Results. Appl. Opt. 41 (18), 3725–3734. doi:10.1364/ao.41.003725
McGill, M. J., Hlavka, D. L., Hart, W. D., Welton, E. J., and Campbell, J. R. (2003). Airborne Lidar Measurements of Aerosol Optical Properties during SAFARI‐2000. J. Geophys. Res. Atmospheres 108 (D13), 8493. doi:10.1029/2002jd002370
Müller, D., Ansmann, A., Mattis, I., Tesche, M., Wandinger, U., Althausen, D., et al. (2007). Aerosol‐type‐dependent Lidar Ratios Observed with Raman Lidar. J. Geophys. Res. Atmospheres 112 (D16), D16202. doi:10.1029/2006jd008292
Müller, D., Mattis, I., Wandinger, U., Ansmann, A., Althausen, D., and Stohl, A. (2005). Raman Lidar Observations of Aged Siberian and Canadian forest Fire Smoke in the Free Troposphere over Germany in 2003: Microphysical Particle Characterization. J. Geophys. Res. Atmospheres 110 (D17), D17201. doi:10.1029/2004jd005756
Nicolae, D., Nemuc, A., Müller, D., Talianu, C., Vasilescu, J., Belegante, L., et al. (2013). Characterization of Fresh and Aged Biomass Burning Events Using Multiwavelength Raman Lidar and Mass Spectrometry. J. Geophys. Res. Atmos. 118 (7), 2956–2965. doi:10.1002/jgrd.50324
Omar, A. H., Winker, D. M., Vaughan, M. A., Hu, Y., Trepte, C. R., Ferrare, R. A., Lee, K.-P., Hostetler, C. A., Kittaka, C., Rogers, R. R., Kuehn, R. E., and Liu, Z. (2009). The CALIPSO Automated Aerosol Classification and Lidar Ratio Selection Algorithm. J. Atmos. Oceanic Technology. 26 (10), 1994–2014. doi:10.1175/2009jtecha1231.1
Palm, S., Hart, W., Hlavka, D., Welton, E. J., Mahesh, A., and Spinhirne, J. (2002). GLAS Atmospheric Data Products. NASA Goddard Space Flight Cent. Geosci. Laser Altimeter Syst. Algorithm Theor. Basis Document Version 4.2.. Greenbelt, Md: NASA Goddard Space Flight (141), 20.
Pauly, R. M., Yorks, J. E., Hlavka, D. L., McGill, M. J., Amiridis, V., Palm, S. P., et al. (2019). Cloud-Aerosol Transport System (CATS) 1064 Nm Calibration and Validation. Atmos. Meas. Tech. 12 (11), 6241–6258. doi:10.5194/amt-12-6241-2019
Platt, C. M. R. (1981). Remote Sounding Of High Clouds. III: Monte Carlo Calculations Of Multiple-Scattered Lidar Returns. J. Atmos. Sci. 38 (1), 156–167.
Reagan, J. A., Wang, X., and Osborn, M. T. (2002). Spaceborne Lidar Calibration from Cirrus and Molecular Backscatter Returns. IEEE Trans. Geosci. Remote Sensing 40 (10), 2285–2290. doi:10.1109/tgrs.2002.802464
Roberts, J., Trainer, M., Murphy, D., Brown, S., Brewer, A., Gao, R. S., et al. (2020). Fire Influence on Regional to Global Environments and Air Quality (FIREX-AQ). Available at: https://csl.noaa.gov/projects/firex-aq/whitepaper.pdf (accessed on November 09, 2021).
Rogers, R. R., Vaughan, M. A., Hostetler, C. A., Burton, S. P., Ferrare, R. A., Young, S. A., et al. (2014). Looking through the Haze: Evaluating the CALIPSO Level 2 Aerosol Optical Depth Using Airborne High Spectral Resolution Lidar Data. Atmos. Meas. Tech. 7 (12), 4317–4340. doi:10.5194/amt-7-4317-2014
Sakamoto, K. M., Laing, J. R., Stevens, R. G., Jaffe, D. A., and Pierce, J. R. (2016). The Evolution Of Biomass-Burning Aerosol Size Distributions Due To Coagulation: Dependence On Fire And Meteorological Details And Parameterization. Atmospheric Chem. Phy. 16 (12), 7709–7724.
Sasano, Y., Browell, E. V., and Ismail, S. (1985). Error Caused by Using a Constant Extinction/backscattering Ratio in the Lidar Solution. Appl. Opt. 24 (22), 3929–3932. doi:10.1364/ao.24.003929
Sayer, A. M., Hsu, N. C., Eck, T. F., Smirnov, A., and Holben, B. N. (2014). AERONET-based Models of Smoke-Dominated Aerosol Near Source Regions and Transported over Oceans, and Implications for Satellite Retrievals of Aerosol Optical Depth. Atmos. Chem. Phys. 14 (20), 11493–11523. doi:10.5194/acp-14-11493-2014
Spinhirne, J. D., Reagan, J. A., and Herman, B. M. (1980). Vertical Distribution of Aerosol Extinction Cross Section and Inference of Aerosol Imaginary index in the Troposphere by Lidar Technique. J. Appl. Meteorol. 19 (4), 426–438. doi:10.1175/1520-0450(1980)019<0426:vdoaec>2.0.co;2
Stein, A. F., Draxler, R. R., Rolph, G. D., Stunder, B. J. B., Cohen, M. D., and Ngan, F. (2015). NOAA's HYSPLIT Atmospheric Transport and Dispersion Modeling System. Bull. Am. Meteorol. Soc. 96 (12), 2059–2077. doi:10.1175/bams-d-14-00110.1
Vaughan, M. A., Liu, Z., McGill, M. J., Hu, Y., and Obland, M. D. (2010). On the Spectral Dependence of Backscatter from Cirrus Clouds: Assessing CALIOP's 1064 Nm Calibration Assumptions Using Cloud Physics Lidar Measurements. J. Geophys. Res. Atmospheres 115 (D14), D14206. doi:10.1029/2009jd013086
Vaughan, M. A., Powell, K. A., Winker, D. M., Hostetler, C. A., Kuehn, R. E., Hunt, W. H., et al. (2009). Fully Automated Detection of Cloud and Aerosol Layers in the CALIPSO Lidar Measurements. J. Atmos. Oceanic Technology 26 (10), 2034–2050. doi:10.1175/2009jtecha1228.1
Veselovskii, I., Goloub, P., Podvin, T., Tanre, D., da Silva, A., Colarco, P., et al. (2018). Characterization of Smoke and Dust Episode over West Africa: Comparison of MERRA-2 Modeling with Multiwavelength Mie-Raman Lidar Observations. Atmos. Meas. Tech. 11 (2), 949–969. doi:10.5194/amt-11-949-2018
Voss, K. J., Welton, E. J., Quinn, P. K., Johnson, J., Thompson, A. M., and Gordon, H. R. (2001). Lidar Measurements during Aerosols99. J. Geophys. Res. 106 (D18), 20821–20831. doi:10.1029/2001jd900217
Welton, E. J., and Campbell, J. R. (2002). Micropulse Lidar Signals: Uncertainty Analysis. J. Atmos. Oceanic Technol. 19 (12), 2089–2094. doi:10.1175/1520-0426(2002)019<2089:mlsua>2.0.co;2
Winker, D. M. (2003). “Accounting for Multiple Scattering in Retrievals from Space Lidar,” in Lidar Scattering Experiments. Editor C. Werner, U. Oppel, and T. Rother (SPIE Proceedings; International Society for Optics and Photonics) 5059, 128–139.
Yorks, J. E., Hlavka, D. L., Hart, W. D., and McGill, M. J. (2011a). Statistics of Cloud Optical Properties from Airborne Lidar Measurements. J. Atmos. Oceanic Technology 28 (7), 869–883. doi:10.1175/2011jtecha1507.1
Yorks, J. E., Hlavka, D. L., Vaughan, M. A., McGill, M. J., Hart, W. D., Rodier, S., et al. (2011b). Airborne Validation of Cirrus Cloud Properties Derived from CALIPSO Lidar Measurements: Spatial Properties. J. Geophys. Res. Atmospheres 116 (D19), D19207. doi:10.1029/2011jd015942
Yorks, J. E., Palm, S. P., McGill, M. J., Hlavka, D. L., Hart, W. D., Selmer, P. A., et al. (2015). CATS Algorithm Theoretical Basis Document Level 1 and Level 2 Data Products. Available at: https://eosweb.larc.nasa.gov/sites/default/files/project/cats/guide/CATS_ATBD.pdf.
Yorks, J. E., Selmer, P. A., Kupchock, A., Nowottnick, E. P., Christian, K. E., Rusinek, D., et al. (2021). Aerosol and Cloud Detection Using Machine Learning Algorithms and Space-Based Lidar Data. Atmosphere. 12 (5), 606. doi:10.3390/atmos12050606
Young, S. A., Vaughan, M. A., Kuehn, R. E., and Winker, D. M. (2013). The Retrieval of Profiles of Particulate Extinction from Cloud-Aerosol Lidar and Infrared Pathfinder Satellite Observations (CALIPSO) Data: Uncertainty and Error Sensitivity Analyses. J. Atmos. Oceanic Technology. 30 (3), 395–428. doi:10.1175/jtech-d-12-00046.1
Appendix A
AERONET locations within the FIREX-AQ domain collocated with high-confidence MAGARA observations and the resultant number of observationsaa.

TABLE. AERONET locations within the FIREX-AQ domain collocated with high-confidence MAGARA observations and the resultant number of observations.
Keywords: lidar, remote sensing, smoke optical properties, AOD, aerosol extinction, aerosols
Citation: Midzak N, Yorks J, Zhang J, Limbacher J, Garay M and Kalashnikova O (2022) Constrained Retrievals of Aerosol Optical Properties Using Combined Lidar and Imager Measurements During the FIREX-AQ Campaign. Front. Remote Sens. 3:818605. doi: 10.3389/frsen.2022.818605
Received: 19 November 2021; Accepted: 28 March 2022;
Published: 03 May 2022.
Edited by:
Daniel Perez Ramirez, University of Granada, SpainReviewed by:
Patrick Augustin, Université du Littoral Côte d’Opale, FranceDavid Painemal, Science Systems and Applications, Inc., United States
Copyright © 2022 Midzak, Yorks, Zhang, Limbacher, Garay and Kalashnikova. This is an open-access article distributed under the terms of the Creative Commons Attribution License (CC BY). The use, distribution or reproduction in other forums is permitted, provided the original author(s) and the copyright owner(s) are credited and that the original publication in this journal is cited, in accordance with accepted academic practice. No use, distribution or reproduction is permitted which does not comply with these terms.
*Correspondence: Natalie Midzak, Natalie.midzak@und.edu