1
Center for Mind and Brain, University of California at Davis, Davis, CA, USA
2
M.I.N.D. Institute, University of California at Davis, Davis, CA, USA
3
Departments of Psychology and Neurology, University of California at Davis, Davis, CA, USA
Cues that direct selective attention to a spatial location have been observed to increase baseline neural activity in visual areas that represent a to-be-attended stimulus location. Analogous attention-related baseline shifts have also been observed in response to attention-directing cues for non-spatial stimulus features. It has been proposed that baseline shifts with preparatory attention may serve as the mechanism by which attention modulates the responses to subsequent visual targets that match the attended location or feature. Using functional MRI, we localized color- and motion-sensitive visual areas in individual subjects and investigated the relationship between cue-induced baseline shifts and the subsequent attentional modulation of task-relevant target stimuli. Although attention-directing cues often led to increased background neural activity in feature specific visual areas, these increases were not correlated with either behavior in the task or subsequent attentional modulation of the visual targets. These findings cast doubt on the hypothesis that attention-related shifts in baseline neural activity result in selective sensory processing of visual targets during feature-based selective attention.
Covert visual attention to spatial locations or non-spatial features (e.g., color, shape, or motion) facilitates behavioral and neural responses elicited by attended stimuli (e.g., Corbetta et al., 1991
; Heinze et al., 1994
; Hillyard and Munte, 1984
; Kingstone, 1992
; Mangun and Hillyard, 1991
; Moran and Desimone, 1985
; Posner, 1980
; Woldorff et al., 1997
), and this facilitation is thought to reflect the top-down attentional control of sensory processing (Corbetta and Shulman, 2002
; Desimone and Duncan, 1995
; Mangun, 1995
; Posner and Petersen, 1990
). The effects of attention in sensory cortex are usually observed as modulations of stimulus-driven sensory responses. How top-down attentional control enables selective stimulus processing remains an open question, but most models propose that attention modulates the excitability of the sensory neurons to facilitate the processing of attended stimuli, and perhaps also to inhibit the activity of neurons coding unattended stimuli. If this is true, then one would expect to observe changes in the background activity of sensory neurons with directed attention, even in the absence of sensory stimulation, and indeed, evidence for such effects of attention is growing.
Several reports have documented attention-related shifts in baseline neuronal activity in sensory areas following an attention directing cue and prior to the appearance of task-relevant stimuli. In studies of visual spatial attention, these “baseline shifts” occur in regions of visual cortex that represent the attended location. For example, Luck et al. (1997)
found that some monkey V4 neurons increased their firing rate when the location that the cells coded was attended in expectation of an upcoming stimulus there. Similarly, human neuroimaging studies and event-related potential (ERP) studies have reported increases in activity prior to the presentation of an attended target stimulus in areas of visual cortex that represent the attended location (e.g., Giesbrecht et al., 2003
; Harter et al., 1989
; Hopf and Mangun, 2000
; Hopfinger et al., 2000
; Kastner et al., 1999
; Wilson et al., 2005
; Woldorff et al., 2004
).
Analogous baseline shifts have also been reported for studies of non-spatial attention. Recording from individual neurons in the macaque, Chelazzi et al. (1998)
observed that IT cells responded more when monkeys were required to make a saccade to that cell’s preferred stimulus in an upcoming display. In humans, fMRI studies have observed increased activity in MT+ during the period just before an attended motion target was due to appear (Luks et al., 2002
; Shulman et al., 1999
). Another fMRI study found that V4 was more active in the intervals between targets during runs in which subjects made color judgments on the targets, and MT+ was more active in these intervals during runs when subjects made motion judgments (Chawla et al., 1999
; see also Foxe et al., 2005
).
These attention-related baseline shifts are thought to reflect the influence of biasing signals originating in frontal and parietal attentional control areas (e.g., Chawla et al., 1999
; Driver and Frith, 2000
; Hopfinger et al., 2000
; Kastner et al., 1999
). It has been proposed that attention-related changes in prestimulus neural activity are in fact the mechanism by which selective attention modulates target responses (Chawla et al., 1999
; see also Driver and Frith, 2000
). That is, an increase in baseline firing rates in a given visual area may result in a larger response to the subsequent target stimulus in that same visual area. The strongest version of such a model would predict both that prestimulus baseline shifts are necessary to modulate sensory processing and that their presence itself is sufficient to induce such modulation: We term this the Causal Hypothesis.
However, cue-related shifts in baseline neural activity are not always observed during feature-based attention. In one study, for example, the response preferences of monkey V4 neurons during the delay period of an orientation delayed match-to-sample task did not correspond with their preferences during the target period. That is, the orientation to which a cell was maximally responsive when the animal was viewing the object rarely coincided with the orientation to which the cell was maximally responsive when the animal was expecting the object (Haenny et al., 1988
). Similarly, a study of attention to motion found that the delay period activity for the vast majority of cells in monkey areas MT, MST, 7a and V4 carried no information about the direction of the cue (Ferrera et al., 1994
). In a human fMRI study of feature-based attention, Shulman et al. (2002)
did not report significant changes in visual cortical activity in response to either color or direction cues, despite the fact that attention modulated subsequent responses (cf. Foxe et al., 2005
).
Using fMRI methods, we investigated whether pretarget baseline shifts result in obligatory selective target processing during feature-based visual selective attention. Three predictions were tested by measuring cue and target responses in functionally-defined visual areas. First, if baseline shifts in background neural activity are necessary for selective target processing, then within a given visual area any attentional modulation of target responses will be preceded by a similar shift in baseline activity. Second, we reasoned that if baseline shifts are sufficient to modulate subsequent target processing, then whenever we observe an attention-related baseline shift it will be followed by a modulation of target responses. Finally, if baseline shifts play a causal role in attentional modulation of target stimuli, then between-subjects differences in the amplitude of baseline shifts should correlate both with the amplitude of the subsequent target responses and with detection performance. As described in the following, our results failed to support any of these predictions.
Subjects
Sixteen right-handed volunteers (6 women) ages 19–29 gave informed consent according to the guidelines of the Institutional Review Board of the University of California, Davis. These subjects had normal or corrected-to-normal vision as assessed with a Titmus Vision Screener (Titmus Optical, Inc., Petersburg, VA), and reported no neurological or psychiatric conditions. Each subject participated in two sessions and was reimbursed $10 per hour of participation.
Stimuli and Procedure
General experimental design. Subjects were tested in a trial-by-trial attentional cuing paradigm. On each experimental trial, subjects were cued with an auditory cue directing them to attend to, detect, and report the presence or absence of a feature in the upcoming stimulus. In separate alternating blocks, subjects were either cued to attend to aspects of the color or the motion of the target stimuli. Within each block, interleaved cue conditions either directed the subjects’ attention to expect a specific stimulus feature (specific feature cue) or provided no information about the most likely stimulus feature to be presented (general dimension cue). By specific feature cue we mean that in the case of attention to color (Figure 1
A), the cues predicted the upcoming color of the target stimuli if a color target was presented in the stimulus display (specific feature cues were the auditory words, blue, green, orange and purple). By general dimension cue we mean that the cue was non-informative about the specific feature in the stimulus display (general dimension cues were the auditory word “color”) and therefore did not specify which color would appear if one did appear (any of the four colors were equally likely on such a trial). In the motion attention blocks (Figure 1
B), the specific feature cues predicted the upcoming direction of motion (left, right, up or down) of the target stimuli. When the cue was non-informative of the direction of motion (general dimension cues) the subjects received only the auditory word “motion” which indicated that if a motion target was presented, the coherent motion of the target stimulus was equally likely to be left, right, up or down. The words “motion” and “color” were used as the non-informative cues because, even though the motion and color conditions were blocked and the subjects told which block was being presented, the targets contained both motion and color changes in both conditions. Hence, the cues “color” and “motion” ensured that the subjects were not confused about which block they were in when the non-informative cue trials were presented. The design is analogous to many prior studies of cued attention that have included informative and non-informative cues (e.g., Posner, 1980
), and as in prior studies, the effect of selective attention is the difference between the informative and non-informative cue trials, which in the present case is the difference between the specific feature cue trials and the general dimension cue trials. We will interchangeably refer to this effect as the attention effect, cuing effect or specificity effect, the latter term being descriptive of the comparison in our task (specific feature vs. general dimension). These effects are all within-dimension effects, being computed for the color and motion attention conditions separately (because the design is blocked with respect to these conditions), and in Figure 1
would be the comparisons between the two trial types in Figure 1
A or the two trial types in Figure 1
B. In our design, there is also another form of attention effect that can be described as between-dimension as it compares responses between the blocked color and motion attention conditions. This between-dimension attention effect will be computed when comparing the responses to color vs. motion cues and targets (independent of specificity cuing) within defined visual areas that are primarily responsive to motion or color stimuli. In Figure 1
, this between-dimension attention effect would effectively compare the trial types in Figure 1
A vs. those in Figure 1
B. These within- and between-dimension attention comparisons will become clearer as the data is presented.
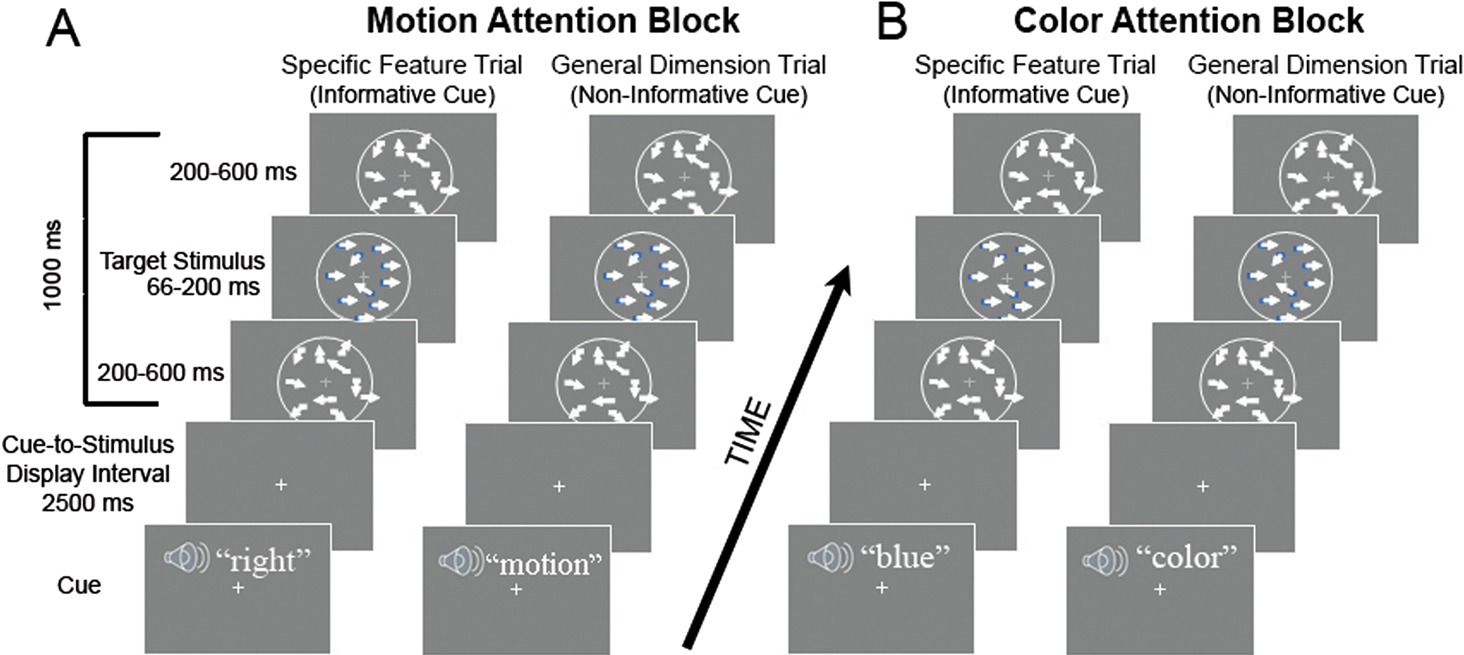
Figure 1. Schematic illustration of cue and stimulus trials for the motion and color conditions. (A) Stimulus sequence for the motion attention condition showing an informative specific feature cue trial (left in part A), where the cue (auditory word “right”) informed the subject of the motion of the upcoming target (if the trial contained any motion – see text). At right in part A, a non-informative general dimension cue trial is illustrated; here the subjects are presented only with the word “motion”, indicating that on that trial, if there is motion, it is equally likely to be left, right, up or down in direction. The cue, presented auditorily in a male voice, was followed by an interval of 2500 ms (cue-to-stimulus display interval, onset to onset) and then a display of randomly moving dots appeared for 1000 ms. In the midst of this presentation, there could be a motion target, where the dots briefly move in a coherent direction – the same direction as was cued if there is motion on that trial. During the motion condition, there were also task-irrelevant color targets that could briefly appear (see text for details). The plus (+) sign in the center of each panel is the fixation point where subjects were required to maintain their gaze throughout each trial. Each trial was followed by an intertrial interval of 1000 ms. (B) Stimulus sequences for the color attention condition. Again the trial on the left of part B depicts an informative specific feature cue trial wherein subjects are cued to a specific color (e.g., blue). The right side of part B shows a non-informative general dimension trial. As in the motion attention condition, task-irrelevant coherent motion of the dots could also take place. Each trial lasted 4.5 seconds.
Task. The subjects’ task was to detect targets that consisted of brief periods of color (color condition) or coherent motion (motion condition) in an otherwise grayscale random dot kinetogram that served as the stimulus display (see Figure 1
). Subjects were instructed to maintain fixation on the central cross throughout each run, and to press a button with their right forefinger as quickly as possible when they detected color flashes or periods of coherent motion in the color and motion blocks, respectively. They were instructed to withhold a response on the catch trials (which did not include a cued target but did include randomly moving dots during the stimulus display). For trials with specific feature cues, subjects were instructed to prepare for the cued feature in particular. For trials with the more general dimension cues they were instructed to prepare equally for all possible features within that dimension.
Stimuli. The stimuli were presented using a PC computer running the Presentation software package (Neurobehavioral Systems, Albany, CA). Auditory stimuli were presented using magnet compatible headphones. Visual stimuli were projected from the control room onto a screen positioned at each subject’s feet and viewed through a mirror suspended above his or her eyes. Attentional cues were prerecorded individual words spoken by a male voice. The central fixation cross subtended 18′ of arc, had a luminance of 293 cd/m2, and was present for the duration of each run. Stimulus display dots subtended 3′ each and were presented at 5% density against a black background within a circular aperture 6.9° in diameter. Dot luminance varied randomly from frame to frame within a range of 22% above and below the mean luminance of 38 cd/m2. The grayscale dots randomly replotted every refresh (approx. 16 ms) for 1000 ms. Coherently moving dots translated 9′ per refresh (9° per second). The black background luminance was 3.5 cd/m2. The onset times of motion and color targets during the stimulus display were varied independently. Motion targets began at a random time between 200 and 600 ms after the stimulus display onset and consisted of a 200 ms long period during which a predetermined (see below, “Training and testing” section) percentage of the dots moved coherently in one of four directions: left, right, up, or down. Color targets began at a random time between 200 and 767 ms after the test period onset and consisted of a 33-ms long period during which all the displayed dots changed to one of four colors: orange, blue, green, or purple. Shades of green and blue were generated by increasing the luminance on the green and blue channels, respectively, and decreasing the luminance on each of the other two channels by half that amount. Shades of purple were likewise generated by increasing the luminance on the red and blue channels and decreasing the luminance on the green channel by twice that amount. Finally, orange was created by increasing the luminance on the red and green channels and decreasing the luminance on the blue channel by twice that amount. The luminance of these colors was thus equated with the mean luminance of the achromatic dots. The luminance of the achromatic dots varied randomly from frame to frame by up to 30%, serving to mask any potential residual luminance differences between the colors, and upon which subjects might have based a response decision during color detection trials. Each channel was gamma corrected before making the luminance changes just described.
Trial probabilities. Each run consisted of 81 trials. Thirty-six (44.4%) of these trials were cue-plus-stimulus trials, as shown in Figure 1
. On half of these trials the cue indicated a specific feature (e.g., red) to attend and on the other half of the trials the cue indicated a general dimension (e.g., color). On 18 (22.2%) of the trials in each run, only cues were presented (cue-only trials). Again, on half the trials the cues were for specific features and on half they were for general dimensions. Cue-only trials consisted of a cue followed 2500 ms later by a 1000 ms darkening (to 164 cd/m2) of the fixation cross. This darkening occurred at the point in time at which the test stimulus would have occurred on a
cue-plus-stimulus trial and indicated to the subjects that they should cease preparing for a target and simply wait for the next cue. Cue-only trials were included to permit separation of the responses to cue and target events (e.g.,Ollinger et al., 2001a
,b
; Shulman et al., 1999
; Woldorff et al., 2004
). Twenty seven trials in each run (33.3%) were null trials which consisted only of the unchanging fixation cross and were used to create a random inter-trial interval permitting deconvolution of hemodynamic responses of adjacent trials despite response overlap (e.g., Burock et al., 1998
; Woldorff et al., 2004
). Of the 36 cue-plus-stimulus trials in each run, 4 (11.1%) were catch trials in which the randomly moving dots were presented but no target (neither coherent motion for motion trials nor color for color trials) appeared within the cued dimension. The remaining 32 cue-plus-stimulus trials included such a target. Across trials, the presence of color and motion targets in the test display was orthogonal, such that on a given trial a subject could not base a response decision on the presence or absence of a target in the unattended dimension.
The order of trial types was determined using m-sequences (e.g., Buracas and Boynton, 2002
). These are pseudo-random sequences that have the advantage of being nearly perfectly counterbalanced n-trials back (we confirmed this counterbalancing up to 8 trials back), so that trials of each type, including null trials, were preceded equally often by each trial type, at every serial position. This ensured that the overlap of hemodynamic responses from preceding and subsequent trials was matched across trial types.
Training and testing. Each subject completed a training session within the 2 weeks prior to their imaging session. During this training session the percentage of coherently moving target dots and the saturation of target colors were varied between runs to establish levels at which each subject’s performance stabilized between 65 and 75% correct detections. During the imaging session, subjects completed 8 or 10 attention runs. The coherence and saturation levels arrived at during the training session were used as the initial settings during the imaging session, and these levels were adjusted as needed between runs to maintain a stable level of performance.
Previous studies have reported facilitated behavioral responses to feature-cued targets relative to dimension-cued targets (e.g., Ball and Sekuler, 1980
). We reasoned that subjects who did not show this characteristic behavioral effect during the training session may not be following task instructions, and we therefore excluded these subjects from participation in the subsequent imaging session. Eye movements were also monitored during the training session (ASL 5000), and subjects who failed to fixate adequately likewise did not participate in the imaging session.
Imaging Methods
Acquisition parameters. Functional images were acquired with a 1.5T General Electric Signa scanner using a BOLD sensitive (T2*-weighted) gradient-echo EPI sequence (TR = 1500 ms, TE = 40, flip angle = 90°). Two hundred sixty MR frames were acquired per run, each frame consisting of 18 contiguous 6 mm axial slices (FOV = 220 mm, 64 × 64 matrix). High-resolution T1-weighted SPGR images were also acquired for each subject.
Image preprocessing was performed on a PC using MATLAB (Mathworks, Inc.) and SPM2 software (www.fil.ion.ucl.ac.uk/spm). The first four TRs of each run were discarded to avoid T1 saturation and the remaining functional images were corrected for slice acquisition order and head motion, normalized to a standard stereotaxic space [Montreal Neurological Institute (MNI) template], and spatially smoothed with an 8 mm full-width half maximum isotropic Gaussian kernel. Temporal high-pass filtering at 3 cycles per run (∼0.008 Hz) and all subsequent statistical analyses were then performed using BrainVoyagerQX (Brain Innovation, Maastricht, The Netherlands).
Functional localizer procedures. Previous studies examining cue-related effects in feature-selective visual areas either localized these areas across subjects (Shulman et al., 1999
) or did not functionally localize them (Chawla et al., 1999
; Shulman et al., 2002
). Considerable variability in the locations of anatomical landmarks has been observed across individual brains (e.g., Tamraz and Comair, 2000
), and similar variability exists in the locations of functional areas relative to such landmarks and within a stereotaxic coordinate system (Aine et al., 1996
; Uylings et al., 2005
). Thus, a functional area defined by a group-level analysis may overlap only partially or not at all with that area for any given subject. The Causal Hypothesis posits that for a given functional area, cue-related baseline shifts enable subsequent target modulation (Chawla et al., 1999
). Defining functional areas individually for each subject ensures the strongest test of this hypothesis.
The regions of interest (ROIs) for the color- and motion-sensitive visual cortical areas were identified using two scans at the end of each imaging session separate from those acquired during the attention conditions. We then examined the responses evoked by cues and targets in these ROIs. To define the ROIs for color-sensitive areas, we contrasted the activity elicited during periods of static chromatic isoluminant dot patterns with alternating periods of static achromatic dot patterns presented within the circular aperture used during the attention task. The chromatic stimuli consisted of randomly placed dots within a circular aperture, with stimulus dimensions and dot density the same as in the attention task. Our aim was to localize the parts of color-sensitive visual cortex that correspond to the retinotopic regions stimulated during the primary task. The circular aperture was divided into four quadrants bounded by the horizontal and vertical meridians. The dots constituted one stimulus element and the background of each quadrant constituted another. Each of the 5 stimulus elements was randomly assigned a different isoluminant color every 1.5 seconds. The achromatic stimuli consisted of the same pattern of elements as the chromatic stimuli, but each element was instead randomly assigned a different grayscale value, with the mean luminance of the whole stimulus always equaling that of the chromatic stimuli. Again, new grayscale values were assigned to each stimulus element every 1.5 seconds. Periods of chromatic and achromatic stimulation lasted 9 seconds each, and the color localizer scan consisted of 21 of these 18 seconds cycles.
For motion-sensitive areas, we contrasted the activity elicited during periods of coherently translating dots with that elicited during alternating periods of static dots. White dots were presented against a black background within the same circular aperture as in the attention task. During motion periods all the dots translated in one of the four cardinal directions at a time and changed direction every 1.5 seconds for 9 seconds. Stationary periods simply consisted of a stationary dot pattern presented for 9 seconds. Again, the localizer scan to define the motion ROIs consisted of 21 of these 18 seconds cycles. We chose to stimulate with fronto-parallel translating dot motion because we wished to localize visual areas sensitive to the relevant features in the attention task. Moreover, the more commonly used expanding and contracting dot motion stimuli (“optic-flow” stimuli) activate different areas of visual cortex than do the fronto-parallel dot motion used in the attention task (Morrone et al., 2000
).
Region of interest (ROI) generation. First, statistical maps were generated for each subject using a voxelwise fixed effects general linear model (GLM) contrast of moving vs. stationary dots. Experimental conditions were modeled as a boxcar function convolved with a gamma function. The significance threshold was set to p < 0.005 uncorrected with a minimum cluster size of fifty 1-mm3 voxels. We localized motion-sensitive ROIs using descriptive statistics of the location of MT reported by Tootell et al. (1995)
. For each hemisphere, an ROI was seeded from the positively activated voxel with the greatest t-value whose Talairach coordinates were within 2 standard deviations of the mean MT coordinates reported by Tootell et al. (1995)
. ROIs were grown outward from this seed location to include all contiguous significantly activated voxels to a maximum extent of 15 mm from the seed voxel along each of the 3 coordinate dimensions. This extent limitation limited growth of the ROI into other nearby motion-sensitive visual areas in the two cases when the activation in these areas was partially contiguous with MT.
The color-sensitive ROIs were generated in the same way using the contrast of chromatic vs. achromatic dot patterns and seeding an ROI at the positively activated voxel with the highest t-value whose coordinates were within 2 standard deviations of the mean putative V4 coordinates reported by McKeefry and Zeki (1997)
. ROIs were grown outward from this seed point as they were for MT.
The motion-sensitive and the color-sensitive areas for each subject were mapped onto a standardized average flat map of the cortex that uses local landmark-based methods using a method derived from that of Kang et al. (2004)
(see also www.ebire.org/hcnlab/cortical-mapping). This permitted our functionally-defined areas to be related to the locations of MT, V4 and V8 as defined in prior studies using functional localizers and retinotopic mapping.
Hemodynamic Time Courses and Statistics
Time courses for hemodynamic responses for cues and targets (stimulus displays contained coherent motion during the motion condition, or color change in the color condition) were estimated for both MT and V4 (in both hemispheres) using a finite impulse response basis set. This method permits bias-free estimates of the size and shape of the hemodynamic response (Ollinger et al., 2001a
,b
). Single cue and target response values were generated from each time course by averaging the beta values occurring within a specific postevent time window. For cues, we averaged the beta values for TRs occurring at 4.5, 6, and 7.5 seconds after cue onset in order to capture the peak of the BOLD response to cues. For targets we averaged the values for TRs occurring at 3.5, 5, and 6.5 seconds after stimulus display onset in order to capture the peak of the BOLD response elicited by the targets. The TR sampled for cues and targets differed slightly (by 500 ms) only because the onset of each trial (cue onset) was time-locked to a TR, and the cue-to-stimulus display interval, being 2500 ms, began one TR plus 1000 ms later (TR = 1500 ms), and therefore to sample the peak of the target hemodynamic responses we necessarily were limited to TRs at 3.5, 5 and 6.5 seconds after the onset of the stimulus display (i.e., the first TR after the onset of the stimulus display occurred with a latency of 500 ms, and therefore, 500 ms plus two TRs of 1500 ms each equals 3.5 seconds). Effects of cue specificity on cue-related responses were calculated by subtracting the response values for general dimension cues from the response values for specific feature cues, and effects of specificity on target values were calculated by subtracting the response values for general dimension trials from the response values for specific feature trials. These subtractions were performed for both MT and the color-sensitive area in each hemisphere in which they were localized, and were performed separately for motion and color.
The individual cue and target response values were then subjected to statistical tests. Paired t-tests assessed the significance of the effects of dimension (pooling across levels of specificity) and specificity (within each dimension) for both cues and targets. The individual cue and target response values and the effects of specificity on cue and stimulus responses were then correlated and Pearson r values and corresponding p-values were computed.
For the BOLD-behavior correlations, when a visual area was localized for both hemispheres within a given subject we collapsed the specificity effect values for cues and targets across hemispheres to obtain individual subject values. These were then correlated with the individual effects of cue specificity on five behavioral measures: reaction time (RT), % hits, % false alarms, A′, and β. A′ is a measure of detection sensitivity that takes into account both hit rate and false alarms, similar to d′. However, unlike d′, A′ is a non-parametric measure that requires no further correction for hit and false alarm rates of 0 and 100% and does not assume that the data are normally distributed. β is a commonly used measure of response bias (Green and Swets, 1966
; MacMillan and Creelman, 1996
)
Behavioral Results
Behavioral results are summarized in Table 1
. Consistent with previous studies, response times (RTs) to both color and motion targets were faster when preceded by the informative specific feature cues than when preceded by non-informative general dimension cues. For color targets, RTs were 435 and 474 ms following specific feature and general dimension cues, respectively [t(14) = –5.52, p < 0.001]. For motion targets, RTs were 524 and 580 ms following specific feature and general dimension cues, respectively [t(14) = –10.96, p < 0.001]. A similar advantage for cued targets was observed in detection rates. For color, subjects detected 72% of specifically-cued targets and 56% of generally-cued targets [t(14) = 5.93, p < 0.001], and for motion they detected 80 and 67%, respectively [t(14) = 4.87, p < 0.001]. There was not a significant difference in the false alarm rate between targets following specific and general cues for either color [t(14) = 0.30, p = 0.768] or motion [t(14) = 0.12, p = 0.909]. We also found that for both color and motion conditions, the specific feature cues improved sensitivity (A′) [for color, t(14) = 4.109, p = 0.001; for motion, t(14) = 2.367, p = 0.033] without influencing criterion (β) [for color, t(14) = –0.917, p = 0.375; for motion, t(14) = –1.379, p = 0.190] (see Table 1
for means). Importantly, these results demonstrate that subjects were actively using the cue information to help them perform the task, and that preparatory selective attention improved performance: When they were precued to a specific stimulus feature they were faster and more accurate in detecting that target feature than when they could not prepare for a specific target feature.
There was a 98 ms response time advantage for detecting color targets over motion targets [452 ms vs. 550 ms, respectively; t(14) = –12.91, p < 0.001], consistent with previous work demonstrating that the visual system processes color faster than motion by about 50–100 ms (Moutoussis and Zeki, 1997a,b
). However, given that motion targets were detected more often than color targets [74.8% vs. 64.0%; t(14) = –4.04, p < 0.001], and were accompanied by a higher false alarm rate [24.3% vs. 11.5%; t(14) = –3.89, p < 0.001], this RT advantage may also partly reflect a more liberal response strategy being adopted on motion trials. We evaluated this using signal detection methods to calculate metrics of sensitivity (A′) and response criterion (β) for each condition. Criterion values confirmed that subjects had a stronger bias to indicate they detected a target during motion trials than during color trials, collapsed across cuing conditions [0.36 vs. 1.45, respectively; t(14) = 4.30, p < 0.001]. Importantly, however, sensitivity was not statistically different for color and motion [0.837 vs. 0.829; t(14) = 0.31, p = 0.759], indicating that detection sensitivity was evenly matched across dimensions of color and motion (see Table 1
; Note that one subject’s behavioral data were corrupted and the foregoing analyses and data in Table 1
were based on the remaining 15 subjects).
Functional Imaging Results
Individually-defined functional areas. We defined color- and motion-sensitive ROIs for individual hemispheres in each subject (Figure 2 and Table 2
). The localizer runs were performed at the end of each imaging session. One subject asked to be removed from the scanner before these could be performed, and the functional imaging data from the localizer runs of second subject were corrupted.
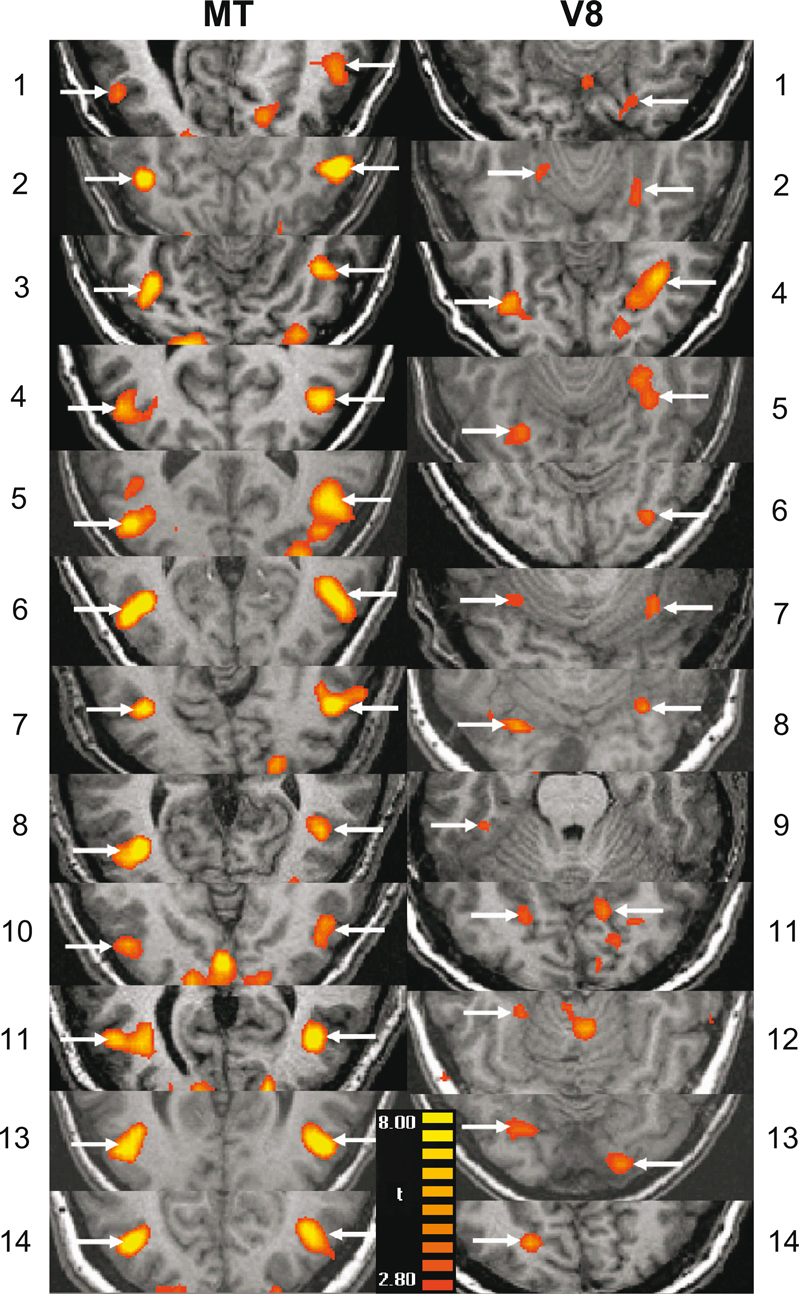
Figure 2. Individually defined MT and V8 ROIs. Arrows indicate the activation(s) from which the ROI(s) for each subject (N = 14) were generated. The left column is for motion area MT and the right is for color area V8. The numbers 1–14 refer to the subjects and correspond to those in Table 2
.
There is disagreement regarding the appropriate terminology for color-sensitive areas of the brain and their precise homology with those identified in monkeys (e.g., Hadjikhani et al., 1998
; Zeki, 1990
; Zeki and Bartels, 1999
; Zeki et al., 1991
). The human color sensitive region observed in or near the collateral sulcus has traditionally been referred to as V4 due to its inferred homology with area V4 identified in monkeys (e.g., Zeki, 1990
; Zeki and Bartels, 1999
; Zeki et al., 1991
). However, more recent retinotopic mapping studies have suggested that this color sensitive region does not fall within the fourth retinotopically organized visual area in humans, and it has been given the tentative alternative label of V8 (e.g., Hadjikhani et al., 1998
). Our color sensitive ROIs are consistent with the coordinates of retinotopically defined V8 (see Figure 3
) and we will therefore use this terminology when referring to our color sensitive ROIs. Note, however, that these ROIs are clearly consistent with the coordinates of the color-sensitive regions labeled V4 in earlier studies.
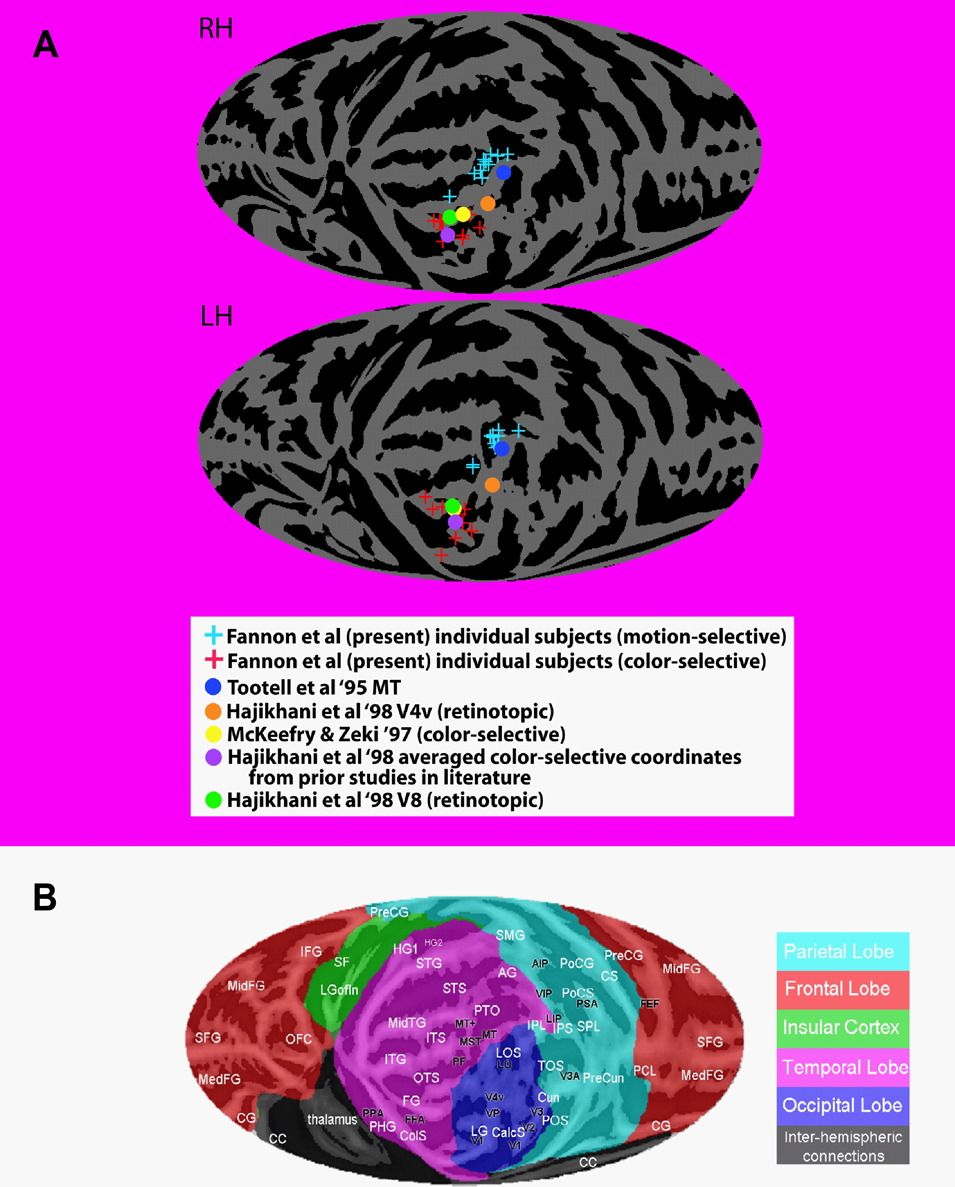
Figure 3. Mapping of individual loci of ROIs for motion and color compared to functional and retinotopic localizations in the literature. (A) Motion-sensitive (blue plus signs) and color-sensitive areas (red plus signs) for each subject were mapped onto a standardized average flat map of the right (top) and left (bottom) hemisphere using local landmark-based methods derived from those of Kang et al. (2004)
(see also www.ebire.org/hcnlab/cortical-mapping). The projection onto a plane uses a Mollweide equal area projection. In the same flattened representations, the maxima for the group activations for the locations of MT, V4 and V8 as defined in prior studies using functional localizers and retinotopic mapping (colored circles – see key in figure). Note that the right hemisphere flat map has been reversed around the vertical midline to permit comparison to the anatomical map key in “b”. (B) Flat map of the cortical surface showing major sulci and gyri labeled for comparison. Abbreviations of anatomical structures: AG, angular gyrus; CC, corpus callosum; CG, cingulate gyrus; CalcS, calcarine sulcus; ColS, collateral sulcus; Cun, cuneate; CS, central sulcus; FG, fusiform gyrus; HG, Heschls gyrus; IFG, inferior frontal gyrus; IPL, inferior parietal lobule; IPS, intraparietal sulcus; ITG, inferior temporal gyrus; ITS, inferior temporal sulcus; LG, lingual gyrus; LGofin, long gyrus of the insula; LOS, lateral occipital sulcus; MedFG, medial frontal gyrus; MidFG, mid-frontal gyrus; MidTG, middle temporal gyrus; OFC, orbitofrontal cortex; OTS, occipital temporal sulcus; PCL, paracentral lobule; PHG, parahippocampal gyrus; POS, parieto-occipital sulcus; PoCG, postcentral gyrus; PoCS, postcentral sulcus; PreCG, precentral gyrus; PreCun, precuneus; PTO, parietal/temporal/occipital point; SF, Sylvian fissure; SFG, superior frontal gyrus; SMG, supramarginal gyrus; SPL, superior parietal lobule; STG, superior temporal gyrus; STS, superior temporal sulcus; TOS, transverse occipital sulcus.
We were able to clearly localize MT in 24 hemispheres (bilaterally for 12 of the remaining 14 subjects). We were able to localize V8 in 19 hemispheres within 12 of the remaining subjects (bilaterally in 7 subjects, unilaterally in 5). Below, we describe the responses to cues and targets in MT and then V8, for both the motion and color condition.
Cue and target responses in motion area MT. In MT, responses to motion targets, collapsed over the specific feature and general dimension trials, were significantly larger than responses to color targets [t(47) = –2.759, p = 0.008] even though across trials there was no difference in the physical target stimuli because, as described in the “Materials and methods” section, the stimulus displays were identical for the motion and color conditions; only the dimension (color or motion) to be discriminated differed. Therefore, this difference in MT for color and motion targets reflects the differential processing of the stimulus displays as a function of feature-based selective attention. In contrast to the significant different for the targets, the responses to the preceding motion vs. color cues revealed no significant differences in MT [t(47) = 0.745, p = 0.460] (see Figure 4
A). That is, preparatory attention engaged by the cues (collapsed over specificity) did not result in larger shifts in pretarget baseline activity for motion than for color cuing in MT, even though the responses to the subsequent targets were significantly modulated by attention in MT. This dissociation between the amplitude of cue vs. target responses indicates that differential baseline shifts are not necessary to induce differential attentional modulation of subsequent target responses in a defined visual area.
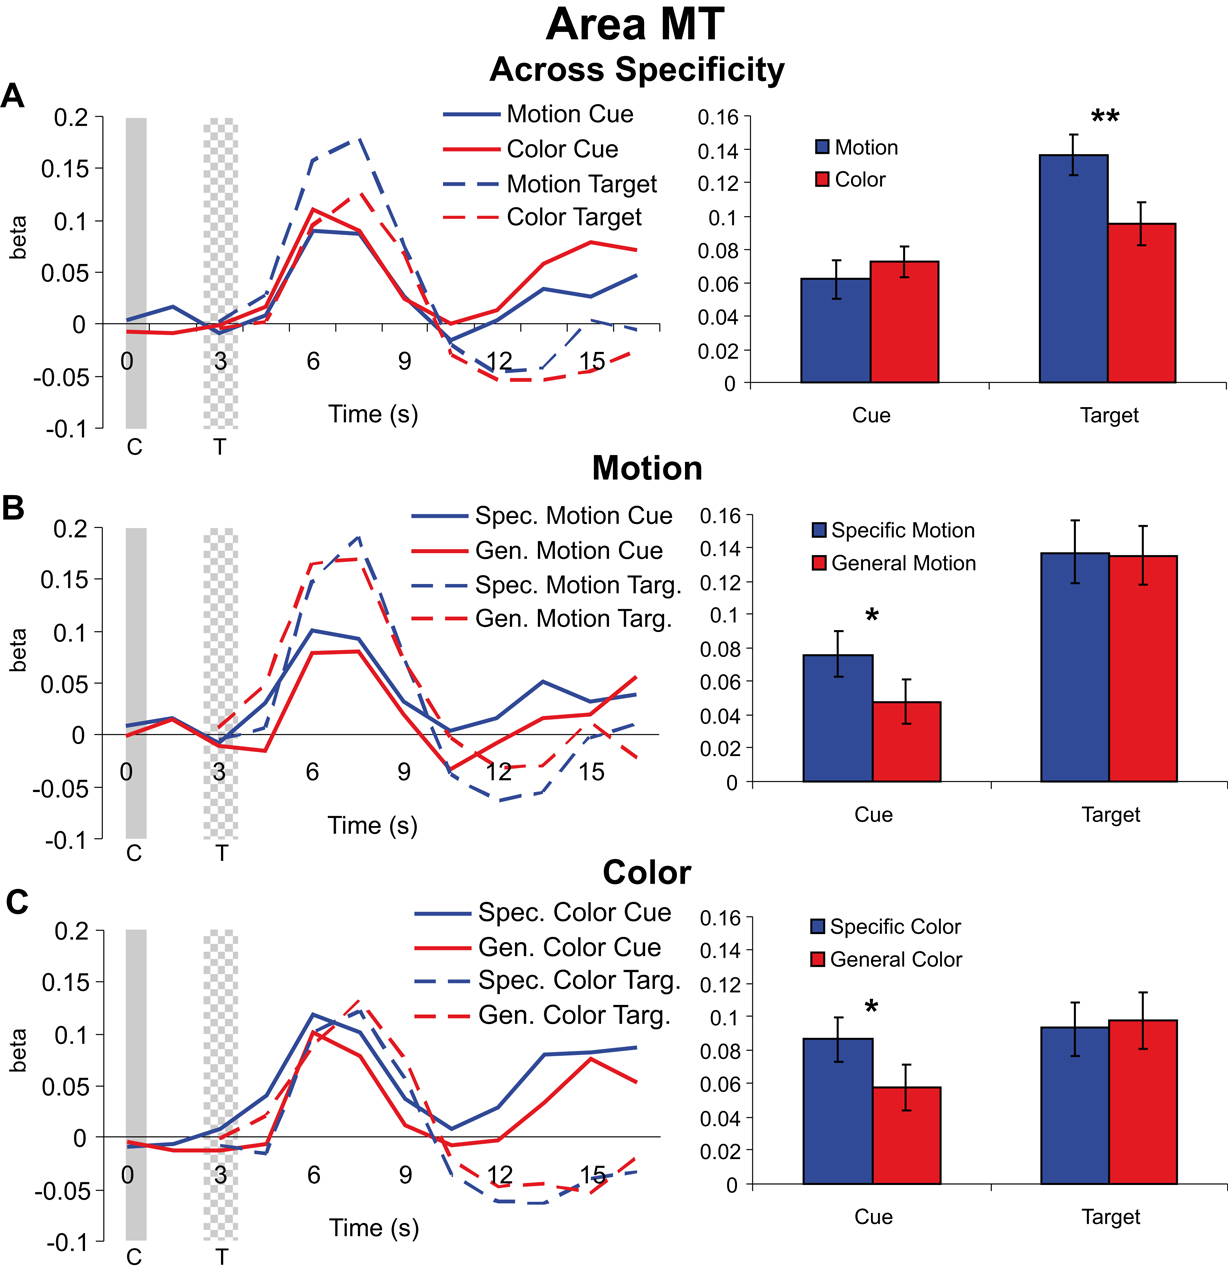
Figure 4. Cue and target responses in area MT. Left column shows BOLD response time course estimates (beta weights) in MT. The solid and checkered gray bars represent the cue (C) and target (T) onsets and offsets, respectively. The right column shows the amplitudes of cue and target responses averaged over the three TRs around the peak of the hemodynamic response (see “Materials and methods” section). All individual cue and target responses are significantly different from the zero baseline. (A) Hemodynamic responses collapsed across specific feature and general dimension trials for motion and color cues and targets in MT. Although cue responses for motion and color conditions were not significantly different, there was a significant difference in target processing with attention (cued and attending for motion vs. color) in MT. Note that because the stimulus displays were identical for motion and color attention conditions, differences in target processing between motion and color reflect the effects of feature-based attention and not merely differences in selectivity for motion vs. color stimuli in MT. (B) Hemodynamic responses for motion specific feature and general dimension cues and targets in MT. The selective attention (cuing) effect here is the difference between the informative specific feature cue trials (for cues and targets) and the non-informative general dimension cue trials (for cues and targets). (C) Hemodynamic responses for color specific feature and general dimension cues and targets, also in MT.
Next we examined the effects of cue specificity in MT for the motion condition (Figure 4
B). Specific motion cues generated significantly more activity in MT than did general motion cues [t(23) = 2.636, p = 0.015]. In contrast, however, we observed no difference between specific feature and general dimension trials for the motion targets in MT [t(23) = –0.533, p = 0.599]. The same general pattern of responses was observed for the color dimension (Figure 4
C), with specific color cue responses significantly larger than general color cue responses [t(23) = 2.459, p = 0.022], but no difference between responses to subsequent specific and general color targets [t(23) = 0.139, p = 0.891]. In fact, general color targets elicited numerically greater activity than did specific color targets. This dissociation between the effects of cue specificity on cue and target responses shows that baseline shifts are not sufficient in and of themselves to modulate subsequent target responses in a given visual area.
All cue types showed statistically significant responses, and at least some portion of these responses is likely attributable to non-feature-specific changes in attention or arousal. The same holds true for cue responses in V8 to be described in the next section.
Cue and target responses in color area V8. Both cues and targets led to significant hemodynamic responses in V8 (with the exception of the general dimension cues in the motion attention condition). Collapsing across specific feature and general dimension trials in V8, we found no significant effect of visual dimension (motion vs. color) for either cues [t(37) = 0.850, p = 0.401] or targets [t(37) = 0.419, p = 0.678] (Figure 5
A). Examining the effects of cue specificity, we found that interestingly, as in MT, specific motion cues elicited greater activity than general motion cues in V8 [t(18) = 2.270, p = 0.036], but there was no attentional modulation of subsequent motion targets in V8 [t(18) = 0.847, p = 0.408] (Figure 5
B). Therefore, even though motion cuing resulted in significant difference in V8, there was no effect on target processing; this pattern demonstrates that baseline shifts with preparatory attention in a visual area do not alone predict the amplitude of subsequent target responses. Of course, this describes the result of the motion condition on processing in V8, and therefore one might have reasonably expected to find no effects of either motion cue or motion target processing in V8. Yet we did, and hence this further confirms at least that shifts in baseline activity in a visual area do not in and of themselves lead to similar modulations in subsequent target responses. That is, if changes in baseline neural activity were the causal mechanism leading to selective target processing, then one should predict changes in target processing in Figure 5
B, and none were observed.
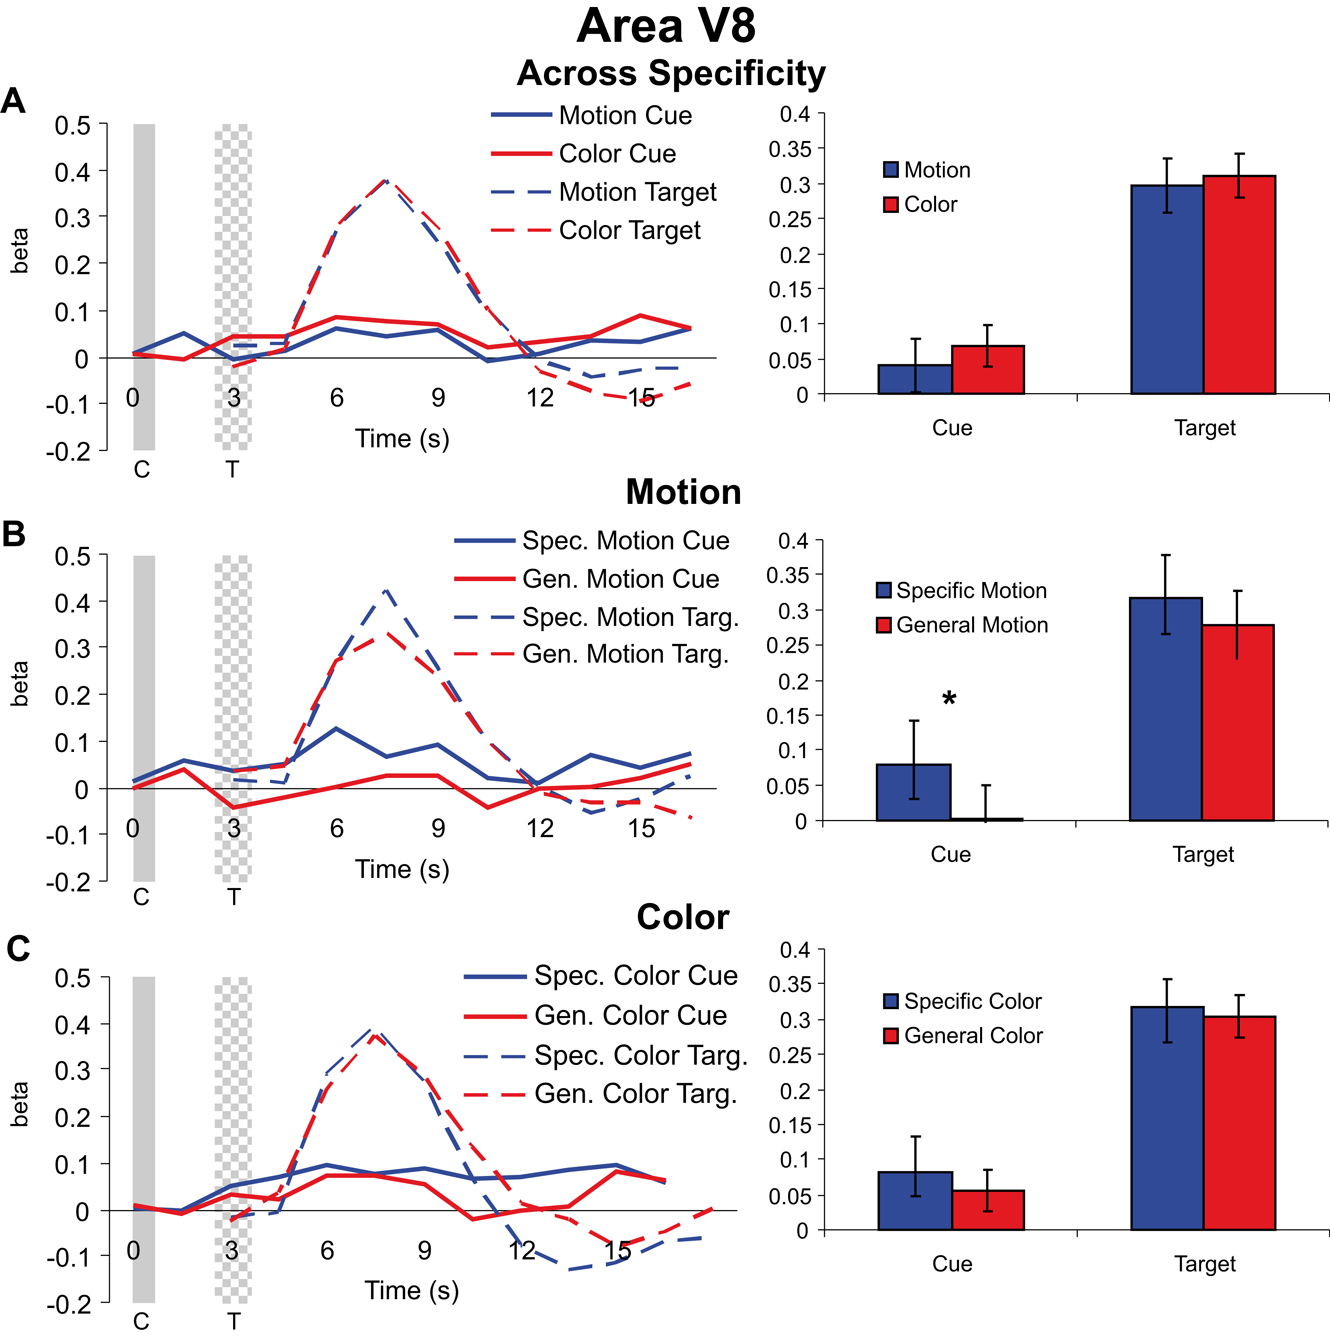
Figure 5. Cue and target responses in area V8. Left column shows BOLD response time course estimates (beta weights) in V8. The solid and checkered gray bars represent the cue and target presentations, respectively. The right column shows the amplitude of cue responses averaged over the three TRs centered on the peak of the hemodynamic responses (see “Materials and methods”). All individual target responses are significantly different from the zero baseline. For the cue responses, although smaller than observed in MT, here in V8 the responses are also significantly different from the zero baseline expect for the cue response in the general dimension motion trials (see panel B). (A) Hemodynamic responses collapsed across specific feature and general dimension trials for motion and color cues and targets in V8. Unlike for MT (see Figure 4
) there was no significant difference in target processing with attention (attending for color vs. motion) in V8. (B) Hemodynamic responses for motion specific feature and general dimension cues and targets in V8. (C) Hemodynamic responses for color specific feature and general dimension cues and targets in V8.
Since the relationship between baseline shifts and target processing in a visual area not specialized for the stimulus dimension cued might be a weak test of the Causal Hypothesis, it is perhaps more important to examine the effects in V8 of cue and target processing in the color attention condition. There were no significant differences between the responses to specific feature and general dimension color cues [t(18) = 0.662, p = 0.516] or the subsequent targets [t(18) = 0.329, p = 0.746] (Figure 5
C). Therefore, despite significant behavioral attention effects of color cuing in this study, we were not able to observe effects of color cuing or selective target processing in V8 as identified here.
Correlations Between Cue and Target Responses
The preceding results demonstrate that the pattern of group average responses to attentional cues and subsequent targets need not correspond; this was especially clear for the motion attention condition and responses from motion area MT. Specifically, differences between cue conditions may be present where differences between subsequent target events are not, and vice versa. To further explore the relationship between cue and target responses we tested for correlations between cue and target response amplitudes across individual subjects.
The Causal Hypothesis predicts a positive correlation between cue responses and subsequent target responses; that is, more cue-related activity should lead to larger target responses in a visual area. We calculated the correlation between the amplitude of cue- and target-related activity within individually defined visual areas across hemispheres. We also correlated the effects of attention for cues and subsequent targets. That is, for each subject we calculated the difference between responses to specific feature and general dimension cues and correlated these with the differences between responses to specific feature and general dimension targets (separately for color and motion conditions).
Figure 6
shows the relationships between cue and target responses in MT. We found no statistically significant positive correlations between the amplitudes of cue and target responses. In contrast, we obtained weak but statistically significant negative correlations in three cases: (i) specific motion cue responses vs. specific motion target responses, (ii) general motion cue responses vs. general motion target responses, and (iii) the attention (specificity) effect (specific feature minus general dimension trials) for motion cues compared to targets.
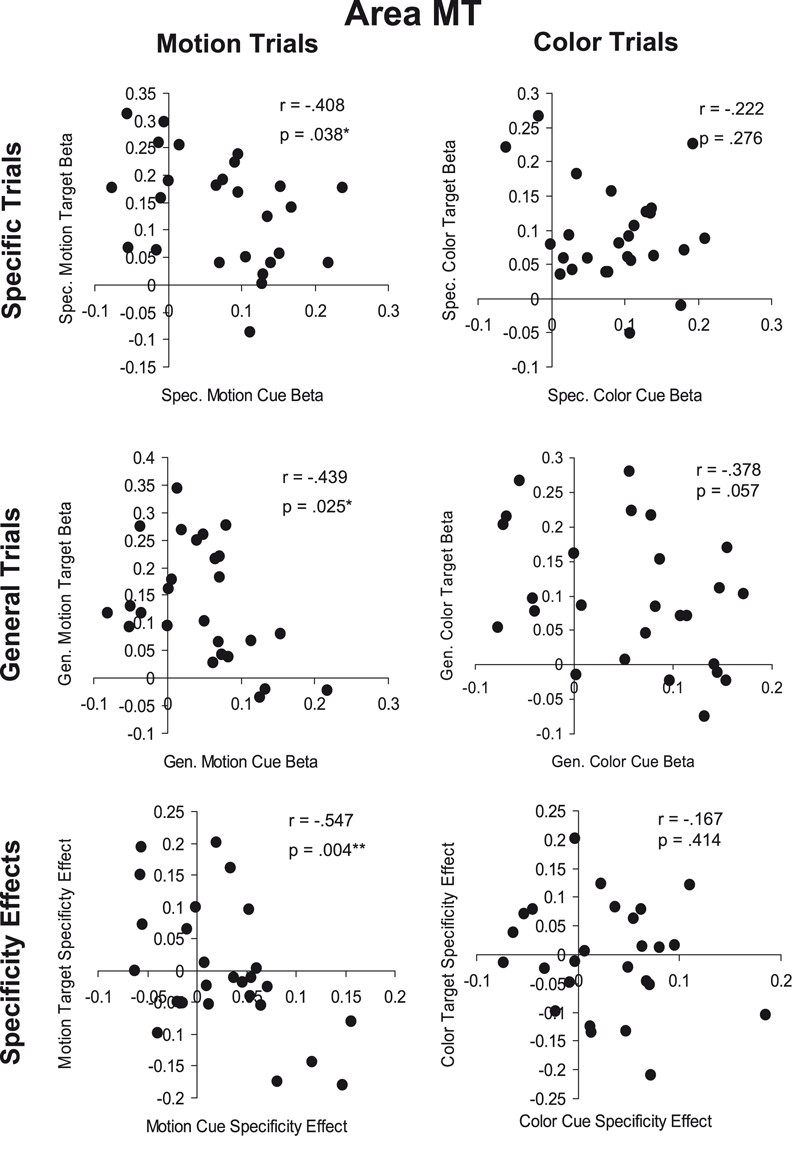
Figure 6. Cue-target correlations in area MT. The top row (Specific Trials) shows the correlation between specific feature cues and targets for motion (left) and color (right) attention conditions. The middle row (General Trials) shows the correlation between general dimension cues and targets for motion and color attention conditions. The bottom row (Specificity Effects) shows the correlation between cues and targets for the effect of cue information (specific feature cue minus general dimension cue) for motion and color attention conditions.
In V8 also, there were no positive correlations between cue and target responses. There was, however, a significant negative correlation between the motion cue attention (specificity) effect and the motion target attention effect (Figure 7
).
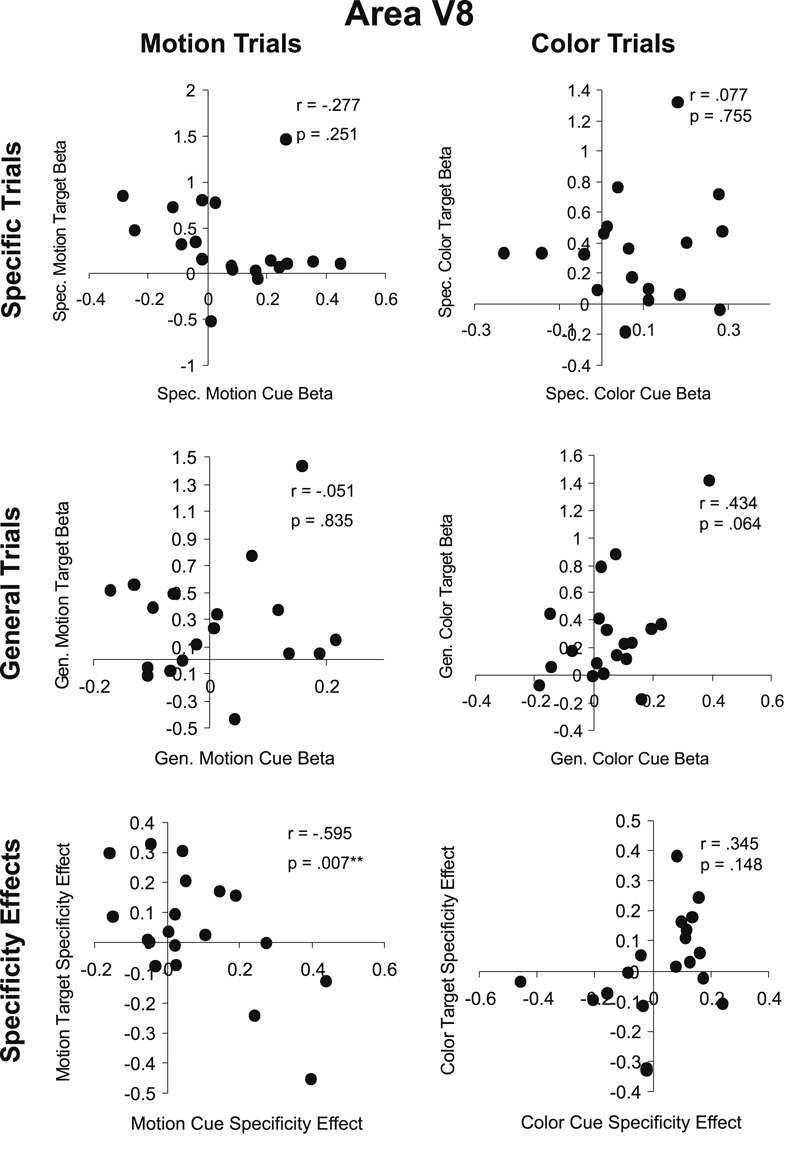
Figure 7. Cue-target correlations in area V8. As in Figure 6
, the top row (Specific Trials) shows the correlation between specific feature cues and targets for motion (left) and color (right) attention conditions. The middle row (General Trials) shows the correlation between general dimension cues and targets for motion and color attention conditions. The bottom row (Specificity Effects) shows the correlation between cues and targets for the effect of cue information (specific feature cue minus general dimension cue) for motion and color attention conditions.
Overall, the cue-target correlation results in MT and V8 offer no support for the Causal Hypothesis. There were no positive correlations between cue and target responses, as the Causal Hypothesis would predict. Out of twelve possible correlations, four were significant but negative, meaning that larger cue responses were associated with smaller target responses and vice versa. However, only one of these four correlations remains significant once corrected for multiple comparisons. It is unclear what mechanism might underlie a negative correlation between cue and target activity. One might speculate that decreased activity in a visual area preceding stimulus onset might be tantamount to a decrease in ‘noise’ that increases the computational resources available for target processing. Alternatively, the inverse correlations may be due to neural or hemodynamic refractoriness. An elevation in cue period activity induced via top-down influence engaged by the auditory cues in a given population of neurons might leave that population less able to generate a BOLD response to an incoming sensory-driven volley of activity, and conversely, low cue-period activity might permit greater stimulus-driven responses (e.g., Huettel and McCarthy, 2000
). In any event, a minority of the statistical tests performed resulted in a significant negative correlation and these are clearly at odds with the Causal Hypothesis.
Correlations Between Physiology and Behavior
Another prediction made by the Causal Hypothesis is that cue-related activity should be correlated with behavior. If increasing prestimulus baseline activity in areas that code the attended feature leads to improved perceptual processing of that feature when it is presented, then this improvement should be reflected in behavioral measures of perceptual performance. Some evidence in favor of this already exists. Warning signals that precede a visual target increase neural activity in regions that code the location of the target and the amplitude of this activity is correlated with performance (Ress and Heeger, 2003
; Ress et al., 2000
). Giesbrecht et al. (2006)
also investigated the relationship between baseline shifts and behavior. In that study, subjects selected an object to be discriminated based on its location or color, and the objects associated with these two conditions elicited activity in distinct portions of visual cortex. They found that, across subjects, discrimination accuracy during location selection (spatial attention) was significantly correlated with the size of the cue-related attention effects (location cue response minus color cue response) in visual areas selective for the location targets,. Similarly, accuracy during color selection was correlated with the size of the cue-related attention effect (color cue response minus location cue response) in areas selective for the color targets. As well, Sapir et al. (2005)
presented precues that predicted the likely location of an upcoming motion target. Activity in MT predicted trial-by-trial performance. They did not report whether spatially specific visual activity (i.e., in cortical areas coding the cued location) also correlated with performance.
We hypothesized that cue activity might predict individual performance in the current study. In our experimental design the saturation of color targets and percentage of coherently moving dots were adjusted individually for each subject in an attempt to equate difficulty both between these two visual dimensions and across subjects. Thus, between-subject variability in performance does not reflect how well subjects actually performed the task but how well difficulty was adjusted, and correlating this performance with neural responses would therefore be meaningless. However, the improvement in detection performance for targets following specific features cues vs. targets following general dimension cues does reflect the degree to which the specific feature cues facilitated target detection, and is therefore an index of the effect of selective attention. The Causal Hypothesis would again predict that, for a given subject, the size of the attention effects on baseline shifts to cues should be reflected in performance. We correlated the magnitude of the specificity effect for five behavioral measures (RT, % hits, % false alarms, A′ and β) with the physiological effects of attention for cues (baselines shifts) and targets in MT and V8 across subjects.
Tables 3 and 4
contain the BOLD-behavior correlations for the motion attention and color attention conditions in MT and V8. Across these correlations we found no evidence that the size the behavioral attention effect could be predicted from the size of the physiological attention effects.
Attention-related changes in pretarget neural activity have been reported in visual areas that process an attended location or feature. Several authors have suggested that attention-related baseline shifts are a causal mechanism that results in attentional modulation of visual responses evoked by subsequent targets (e.g., Chawla et al., 1999
; Driver and Frith, 2000
; Kastner et al., 1999
; Ress et al., 2000
). We have termed this the Causal Hypothesis. Baseline shifts in neural activity in response to spatial attention cues are observed with relative consistency (e.g., Hopfinger et al., 2000
; Kastner et al., 1999
; Luck et al., 1997
), but evidence that cues directing attention to visual features also induce baseline shifts is less consistent (e.g., Shulman et al., 2002
). As a result, whether or not baseline shifts in neural activity can be considered a general mechanism underlying the effects of preparatory attention in vision remains uncertain.
We examined attention-related baseline activity in color- and motion-sensitive visual areas following cues to attend for color or motion targets. We found, both in group averages and on a subject-by-subject basis that cue-related baseline shifts in the fMRI BOLD signals failed to predict subsequent target responses or detection performance. That is, baseline shifts were neither a necessary nor sufficient mechanism for attentional modulation of target responses. This casts considerable doubt on the plausibility of the Causal Hypothesis for feature-based attention. There may be conditions under which baseline shifts do play a causal role in modulating the amplitude of subsequent stimulus-evoked visual responses, such as during spatial attention (Giesbrecht et al., 2006
; Sapir et al., 2005
), but baseline shifts are clearly not the only available mechanism and do not appear to necessarily influence target processing during feature-based attention.
The present results confirm that attention to motion boosts the response to motion stimuli in MT, consistent with numerous previous studies (e.g., Corbetta et al., 1991
; Martinez-Trujillo and Treue, 2004
;Shulman et al., 1999
, 2002
; Treue and Martinez-Trujillo, 1999
). Here we also showed that informative cues for specific directions of motion elicit greater activity in MT and V8 than do motion non-informative cues without specific direction information. Shulman et al. (1999)
also found increased activity at coordinates consistent with both of these areas in the specific feature cue vs. passive cue contrast from their Experiment 2 and their specific feature attention vs. neutral attention contrast from their Experiment 1, suggesting that an effect similar to that reported here was reflected in their results. Interestingly, they also concluded that the response to motion targets is greater when subjects are precued to a specific motion direction, a result not observed in the current experiment. However, because their conclusions were drawn partly from the results of a blocked design experiment, it is not clear that their findings can fully distinguish cue from target activity. In this regard it is noteworthy that significant differences were observed in the cue-to-target period in the present study for the comparison of specific feature vs. general dimension cues (see Figure 4
B).
One surprising observation was that neither the cue nor target responses in V8 were influenced by the dimension (color vs. motion) to which subjects were attending. Several previous studies have found that attention to color increases the activity in activity in color sensitive regions more than does attention to motion (e.g., Chawla et al., 1999
; Corbetta et al., 1991
). However, a more recent study failed to observe this difference for either cues or targets (Shulman et al., 2002
). Similarly, a single unit study using a delayed match-to-sample task found that in monkey V4 neurons the response to the S2 stimulus was modulated similarly regardless of whether subjects were matching based on color or direction of motion (Ferrera et al., 1994
). A number of single unit studies have demonstrated that some V4 neurons are motion responsive (Cheng et al., 1994
; Desimone and Schein, 1987
; Ferrera et al., 1994
; Tolias et al., 2005
), and at least one has suggested that V4 does not have a particularly high concentration of color-selective neurons compared to other visual areas (Cheng et al., 1994
). It is unclear to what extent monkey V4 is homologous with the ventral color sensitive regions observed in humans (which we refer to as V8), but both previous human fMRI studies (e.g., Singh et al., 2000
) and the motion localizer used in the current study have similarly revealed activity in these areas. Thus, even though this area is relatively sensitive to color compared to other areas in human visual cortex, this does not imply that it is not also sensitive to other stimulus features such as motion.. Given these points, it is less surprising that color attention effects in V8 are not observed consistently in humans. In contrast, area MT has a very high proportion of motion-selective neurons and a relatively low proportion of color-selective neurons (Zeki, 1978
), which may be why we were able to clearly detect effects of motion attention on target processing in MT.
Importantly, the absence of color attention effects at the population level in V8 (as measured by fMRI) does not rule out the presence of such effects at the level of individual neurons. Effects of attention at the single unit level that are not visible across the population might also explain our behavioral effects of cue specificity. Specific color and direction cues facilitated detection of colors and coherent motion, respectively, even though attentional cuing did not correlate with BOLD responses to targets in either MT or V8. Attention has been shown to increase the visual response in cells tuned for direction (Martinez-Trujillo and Treue, 2004
; Treue and Martinez-Trujillo, 1999
) or color (Motter, 1994
; Spitzer et al., 1988
) when the animal is attending for the cell’s favored feature, and these excitatory effects may be accompanied by response suppression in cells tuned for unattended features (Haenny and Schiller, 1988
; Martinez-Trujillo and Treue, 2004
; Motter, 1994
). Attention might also narrow the tuning curves of individual neurons (e.g., Haenny and Schiller, 1988
; Spitzer et al., 1988
; though see McAdams and Maunsell, 1999
). Mechanisms such as these could improve detection of attended features (Britten et al., 1996
; Cook and Maunsell, 2002
; Salzman et al., 1990
) without substantially altering the average firing rate of the population as a whole, masking attention effects when macroscopic measures (such as fMRI) are employed. Such mechanisms might also explain the absence of effects of cue specificity on target processing.
Our failure to observe a correlation between the effects of specificity on cue BOLD responses and detection performance would appear to be at odds with the findings from our lab reported in Giesbrecht et al. (2006)
. In that study, subjects were precued to attend for a spatial location or color, and it was found that these precues increased activity in visual areas that coded the attended target, and in addition, the size of the cue-related baseline shift correlated with subjects’ discrimination performance. There are several important differences between that design and the one we used in the current study that may have led to this discrepancy. First, in Giesbrecht et al., discrimination difficulty was held constant across subjects; thus, between-subject differences in discrimination accuracy for a single attentional condition reflect actual between-subject differences in performance. Here, we were limited to correlating the difference between the effects of specific feature and general dimension cues on physiology and behavior. Also, in the Giesbrecht et al., design, attention was used to select one of two target objects for further orientation discrimination, whereas in the present study predictive color or motion precues indicated the color or motion to be detected in a simple speeded detection task.
However, the effects of Giesbrecht et al. (2006)
could also reflect the influence of spatial attention rather than feature-based attention. In that study subjects were cued to select an object for discrimination based on color or location, but the color and location targets were presented in different parts of the visual field. The two color targets were spatially superimposed at the fovea, whereas the two location targets were placed in the upper left and right quadrants nearly 6° from fixation. Thus, although subjects were still required to select an object based on color in the color attention condition, their attention was also necessarily directed to a different spatial location than during the location attention condition, and the differences in the locations of cue-related visual activity between the two conditions could therefore reflect the effects of spatial attention. This interpretation is supported by the findings of an earlier report using some of the same data (Giesbrecht et al., 2003
). In that report, two different target configurations were tested; one in which the color targets were presented foveally as in the 2006 report, and one in which they were presented on the midline above fixation at the same eccentricity as the location targets. The location of cortical activity elicited by the color cues showed a marked anterior shift for the more eccentric targets, consistent with a shift in the focus of spatial attention to the new target location. Such a supposition is supported by a recent study that also combined spatial and feature attention to investigate baseline shifts (McMains et al., 2007
).
Why might spatial attention elicit baseline shifts with such regularity while non-spatial attention does not? One potential reason is that spatial locations are necessarily always represented in visual perception, whereas visual features are not. Locations may therefore serve as ever-present elementary sensory ‘channels’ that when attended may lead to increased activity in retinotopically-mapped visual structures, even before the onset of a task-relevant target. It remains to be demonstrated whether or not baseline shifts with preparatory spatial attention cause subsequent modulation of attended targets.
The Causal Hypothesis makes predictions about the behavior of populations of neurons observable at the level of functionally-defined visual areas (e.g., Chawla et al., 1999
), and our results fail to confirm those predictions at this level of analysis. However, our results cannot rule out the possibility that changes in baseline activity systematically influence target responses at the level of individual neurons or small neural networks. Previous findings from single unit studies speak to this possibility. Although such studies generally report significant changes in delay period activity in the context of feature matching, the activity observed in a given cell following cues for a direction (Ferrera et al., 1994
), color (Ferrera et al., 1994
; Motter, 1994
) or orientation (Haenny et al., 1988
) need not correspond with that cell’s pattern of feature selectivity. Thus, the totality of evidence also fails to provide much support for a causal role for baseline shifts even at the single neuron level.
If baseline shifts are not the mechanism by which attention modulates stimulus processing, then what might that mechanism be? One possibility is synchronized neural firing. A growing body of empirical work implicates oscillatory neural activity in the gamma frequency range (>30 Hz) as an important mechanism for attentional modulation. For example Fries et al. (2001)
found that neurons activated by an attended stimulus showed increased gamma synchronization and reduced low-frequency (<20 Hz) synchronization. This synchronization effect was observed as early as 50 ms after stimulus onset, whereas overall increases in firing rate occurred only after 400 ms had elapsed. Increased firing rates have also been observed in cells that are the targets of synchronized presynaptic activity (e.g., Usrey et al., 1998
). Stimulus selection may thus involve both a temporal code and a rate code (Niebur et al., 2002
), with the former possibly enabling the latter. Gamma synchrony might also enable transient associations of neural assemblies so as to bind the features of an attended object into a unified percept (Engel and Singer, 2001
). Patterns of oscillatory activity in networks distributed throughout the brain might represent current states of expectation, and these in turn may shape activity evoked by incoming sensory information through a process of entrainment (Engel et al., 2001
). In this way, information represented within brain areas that constitute the attentional control network could create brain states that influence stimulus processing in early visual areas without increases in the overall prestimulus (baseline) firing rates of sensory neurons.
We declare that the research was conducted in the absence of any commercial or financial relationships that could be construed as a potential conflict of interest.
We are grateful for the support and advice of Michael H. Buonocore, John Ryan and Cameron S. Carter, and for the suggestions of Marty Woldorff, Kevin LaBar and Michael Platt. This work was presented in preliminary form at the annual meeting of the Association for Psychological Science (Fannon and Mangun, 2005
), and constitutes a portion of the dissertation research of the first author (Fannon, 2006
). Special thanks to Tim Herron, Anthony Cate, and David L. Woods for assistance with the cortical surface mapping procedures. Supported by NIMH R01 MH55714 to G.R.M., the Fetzer Institute to C.D.S., and an NSF Graduate Fellowship to S.P.F.